1. Introduction
A selection of any interior lighting solution is based on a number of lighting and non-lighting criteria, both objective and subjective. The objective assessment of the interior lighting is usually based on checking if it meets the requirements for photometric parameters, e.g., [
1,
2] The objective assessment of non-lighting parameters may concern: Energy efficiency, e.g., [
3,
4], environmental impact, e.g., [
5,
6], or lighting cost, e.g., [
7,
8]. The basic subjective assessment of lighting is a visual evaluation and directly applies to the lighting effects connected to the brightness distribution in the interior, e.g., [
9,
10]. The psychological impact of the interior luminous environment can also be assessed, e.g., [
11,
12], including some aesthetic aspects, e.g., [
13,
14].
The appraisal of lighting effects is carried out in the illuminated space, in real rooms, e.g., [
15,
16], arranged rooms [
17] or stands [
18], as well as in lightboxes, e.g., [
19,
20]. The assessment of lighting effects is carried out on the basis of images of the illuminated interiors: photos of real interiors [
21] or visualizations of virtual interiors [
22]. Images of the illuminated interiors can be presented on projection screens [
23] or display screens [
24].
Undoubtedly, the presentation of virtual images of the illuminated interior on the computer screen is still the most commonly used form of showing lighting effects for visual evaluation in practice. This arises from the fact of using this method in the design process. Most often such an appraisal is made at the lighting design stages. The computer visualizations of room illumination developed by the design team are used to discuss and verify the lighting concept, and to present the final lighting solutions. The lighting effects in the rooms are presented on computer screens of the people from the project team and the customers, i.e., the people making decisions on choosing the final solution, including the investors and the future users. In practice, therefore, lighting effects are assessed on different and usually uncalibrated computer screens. The use of such an evaluation has many limitations and should only be used as a supplementary criterion. However, as a result of the widespread use of computers and their continuous development, we should strive for a better use of this method when making decisions on the choice of lighting solution. The question also arises if different people similarly assess the lighting effects in the virtual rooms presented on different computer screens and under different surrounding conditions.
A significant part of the research on assessing the opportunity to use the computer lighting images in virtual rooms focuses on examining whether and to what extent there is a convergence of subjective evaluation of lighting in a real and virtual room. One of the first studies in this area was carried out by A. Mahdavi and H. Eissa [
25]. In their research, two groups of participants evaluated five lighting situations in office-type rooms. The first group assessed the illumination in the real rooms from the specific observation directions. The second group assessed the illumination of the same lighting situations on the basis of the virtual visualizations generated in the Lightscape software and presented on a 19-inch computer monitor. Ten impressions between these groups were compared with the use of seven-point semantic scales, following the methodology used in [
26]. The results suggested that “such images could reliably represent certain aspects of the lighting conditions in real spaces. The overall correlation between the image-based and spacebased evaluations was found to be significant” [
25].
In the research done by G. Newsham et al. [
27] the group of respondents evaluated six lighting situations in the rooms of various purposes. These situations were assessed in the real rooms and based on the room images presented on a 17-inch computer monitor in both conventional and HDR mode. All images were taken with a Canon EOS Digital Rebel XT camera. Impressions on brightness, uniformity, pleasantness, and glare were compared in the group with the use of continuous semantic scales, following the methodology applied in [
28]. The results suggested that “for evaluations of visual appearance of interior scenes featuring large areas of high luminance, the HDR method may be used as a surrogate for experiencing a real space both for lighting quality research, and in the design process” [
27].
In the research by C. Villa and R. Labayrade [
29], a web application was developed to investigate online-based psycho-visual experiments. The visual assessment of the lighting effects was based on 26 images of virtual lighting situations in the office room. First, the lighting effects were evaluated by a control group of 30 people, initially under laboratory conditions (on the stereoscopic display device with dimensions of 1.69 m × 1.26 m and resolution of 1024 × 768 pixels) and then online on their own computers. The results revealed no statistically significant differences between data collected in the laboratory and online. Then, an online-based experiment involving 1114 observers was conducted to study the uncontrolled experimental conditions that may impact results. The results suggested that 100 observers were enough to remove bias, related mainly to the perceived contrast and brightness of the display and the brightness of the surrounding area. The images of virtual lighting situations were prepared on Autodesk 3ds MAX software. In these images, the lighting for task area—computer desk—was mainly exposed. Participants focused on a paper-based desk job evaluated each lighting scene on a scale from 0 (not at all) to 10 (extremely), answering the question about luminous environment suitability for office work.
In our research, we focused on a comparison between groups of general perception of lighting in a virtual room whose images were presented on the screens of commonly available computers. The main objective of the research was to determine the differences between two groups of respondents in the evaluation of brightness and uniformity perception of the virtual lit corridor presented on the computer screens. Additionally, we demonstrated the performed calculation-based assessment of the levels and the uniformity of illuminance in the corridor as well as the impact of the ceiling and wall lighting in the corridor on the lighting power density in the investigated cases.
The scope of research covered as follows:
Developing the computer simulations of lighting in the virtual corridor, diverse in terms of the luminance distribution on the room planes.
Analyzing and evaluating the lighting solutions in the corridor based on the calculation results of photometric parameters.
Carrying out the qualitative analysis and assessment of the lighting solutions in the corridor presented on the computer screen based on the results of the survey.
2. Methods
The research concerned appraising the brightness and uniformity perception of a virtual lit interior model. The computer 3D corridor model was the object of the research. The choice of the corridor resulted from the common use of communication zones and the simplicity of this type of rooms. The accomplishment of the work goal was based on simulations and surveys. The research was done in two stages as follows:
Developing the computer simulations of lighting solutions and carrying out the quantitative evaluation of illuminance distribution and lighting power density in the corridor.
Conducting the surveys and assessing the brightness distribution perception based on the images of lighting solutions in the corridor presented on the computer screens.
At the first stage of research, the simulation tests were carried out. The computer model of the corridor was developed, and the simulations were performed for various lighting situations. The corridor was cuboidal and empty, 24 m long, 3 m wide, and 3 m high. The ceiling and walls were white, with reflectance of 0.7, and the floor was grey, with reflectance of 0.3. It was assumed that the reflection of the luminous flux inside had Lambertian characteristics and the impact of the spectral distribution of radiation was not considered.
The computer model of the corridor was created in Autodesk 3ds Max and DIALux. The illuminance and luminance distribution calculations were performed on each of the corridor planes in each program. The quantitative evaluation of lighting was made on the base of DIALux results. The corridor lighting visualizations were created in 3ds MAX. The images generated by 3ds Max were controlled in terms of the luminance distribution. The brightness and uniformity assessments were made on the base of these images that were presented on computer screens.
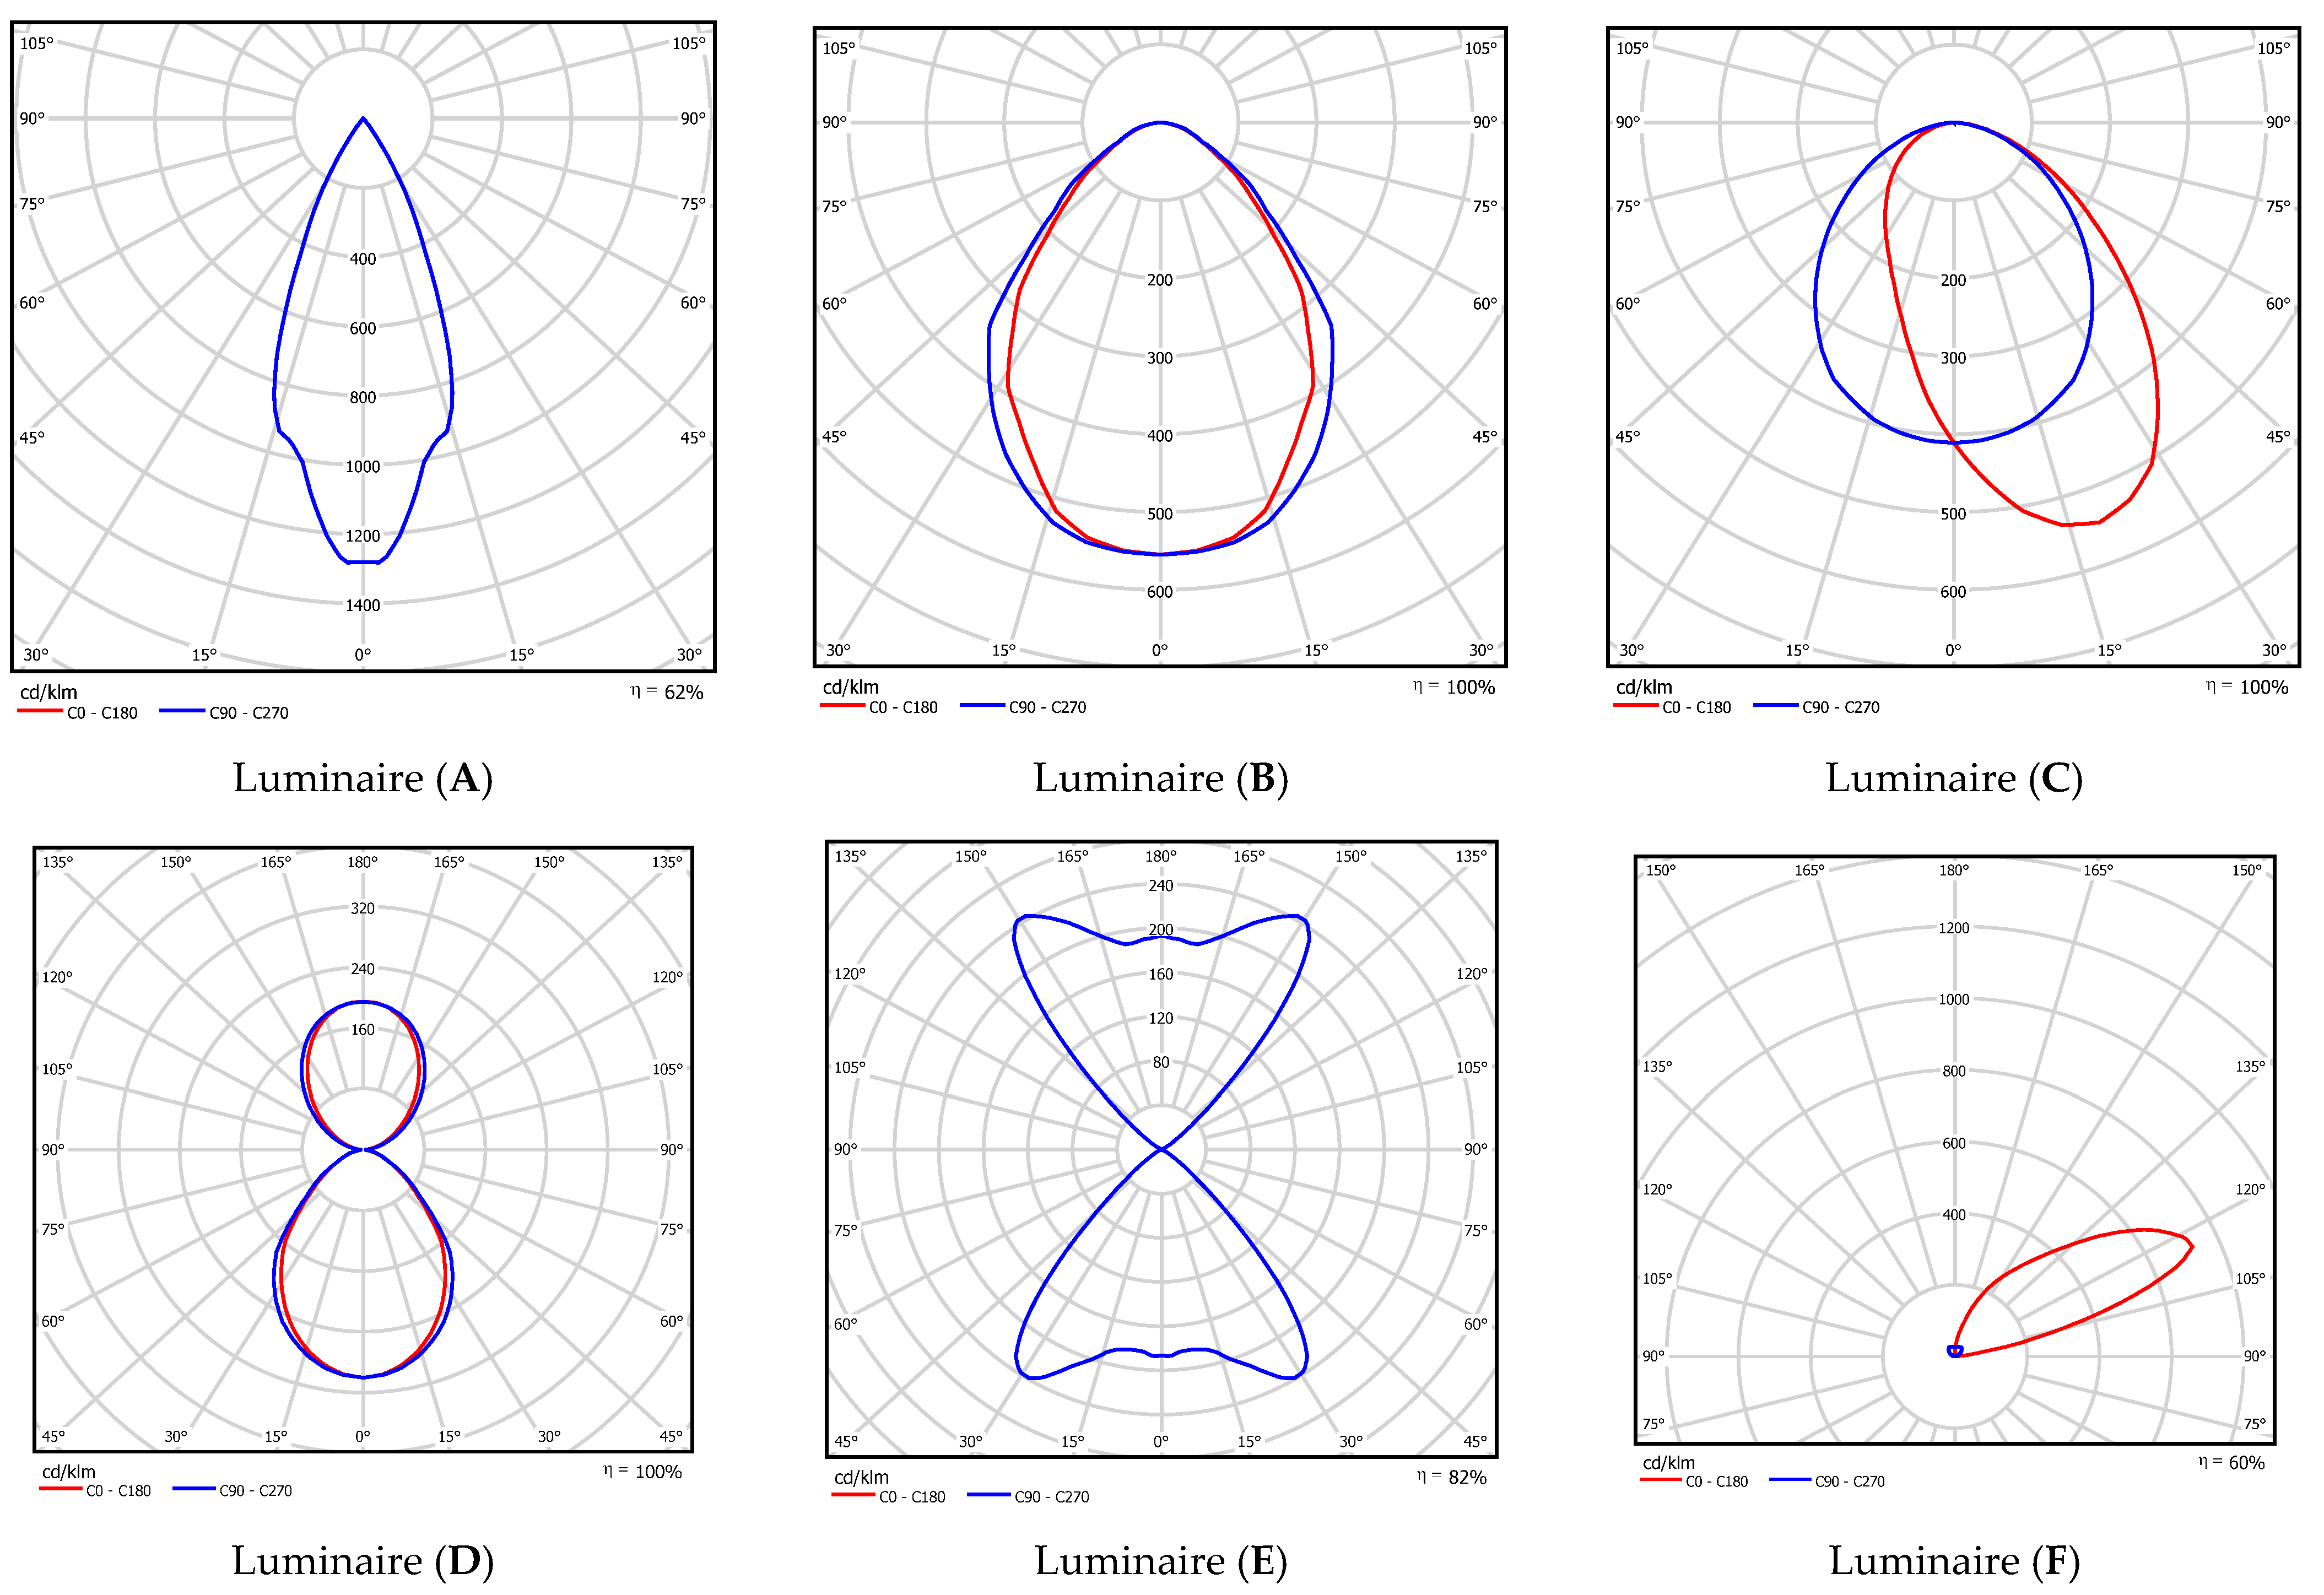
In order to develop different luminance distributions in the corridor, six types of luminaires with different luminous intensity distributions were selected: Three direct lighting luminaires (A, B, and C), two direct-indirect lighting luminaires (D and E)., and one indirect lighting luminaire (F). The luminous intensity polar curves of the luminaires are shown in
Figure 1.
The general lighting in the corridor was considered. In each case, the level of the average maintained illuminance of 100 lx and lighting uniformity not lower than 0.4 were generated on the work plane. The necessity of meeting these requirements determined a number of the luminaires and their luminous flux as well as their layout. The symmetrical lighting of the corridor was taken into account in each case, i.e., the illumination of mutually parallel walls was identical. The calculations of the illuminance distribution for the work plane were made at the floor height, with the assumption of maintenance factor of 0.8. As for the calculation of the utilization factor and the installed power density of the solutions, it was assumed that the light output ratio of luminaires was 0.8, and the luminous efficacy of light sources was 150 lm∙W−1 (the luminous efficacy of the luminaires was 120 lm∙W−1). These values are fairly typical of LED technology and currently used luminaires. Ultimately, 10 computer lighting solutions were created for the corridor.
The following parameters were calculated in DIALux for each solution:
EF—the mean illuminance of the floor.
LF—the mean luminance of the floor.
UFMIN—the uniformity of illuminance/luminance of the floor.
EW—the mean illuminance of the walls.
LW—the mean luminance of the walls.
UWMIN—the uniformity of illuminance/luminance of the walls.
EC—the mean illuminance of the ceiling.
LC—the mean luminance of the ceiling.
UCMIN—the uniformity of illuminance/luminance of the ceiling.
LR—the average luminance of the interior (the weighted average relative to the surface areas of the interior planes).
UF—the utilization factor.
PD—the installed power density of lighting in the interior.
The quantitative evaluation of lighting consisted in checking the fulfillment of the requirements and recommendations regarding the average maintained illuminance and uniformity of lighting for the floor (work plane), ceiling, and walls [
30]. They are shown in
Table 1. The appraisal also involved a comparison between the solutions of the utilization factor and the installed power density. The impact of ceiling and wall lighting on these parameters was also demonstrated.
At the second stage of research, the survey was conducted. Based on the developed questionnaire, the qualitative assessment of ceiling, wall, floor, and whole corridor illumination was performed for each solution. The respondents evaluated the brightness and uniformity of the individual lit planes and entire interior. The assessment was carried out on the basis of images of lighting visualization presented on the computer screens. The corridor lighting visualizations were created in Autodesk 3ds MAX.
The questionnaire used in the research included the respondents’ personal data and the appraisal of the selected corridor lighting features. In terms of personal data, the survey covered as follows: The respondents’ gender, age, education, and occupation as well as information about the state of their sight and well-being. Seven-point semantic differential scales were used to assess the selected lighting features. This methodology has been used many times in research on the perception of interior lighting [
31]. The questionnaire included the evaluation of brightness and uniformity of the ceiling, wall, floor, and entire interior illumination. The part of the survey concerning the brightness and uniformity assessment of the floor illumination is presented in
Figure 2. The same evaluation way concerned the brightness and uniformity perception assessment of the lit walls, floor, and entire corridor.
The survey was conducted according to the following procedure:
Discussing the objective of the research, the questionnaire content, and completion order.
Receiving the consent from the respondents to take part in the survey.
Starting the survey.
Taking a place in front of the computer screen by the respondent.
Handing over the first part of the personal data survey.
Completing the first part of the questionnaire by the respondents.
Collecting the first part of the survey.
Displaying the lighting visualization, variant 1 on the computer screens.
Handing over the second part of the questionnaire concerning the assessment of lighting features in variant 1.
Completing the second part of the questionnaire by the respondents.
Collecting the second part of the survey.
Repeating the procedure for the second part of the survey, for variants from 2 to 10.
Ending the survey and thanking the participants for taking part in the research.
Two groups of students from the Electrical Power Engineering Institute, Lighting Technology Division, Warsaw University of Technology, participated in the research. The respondents had basic knowledge of lighting technology and had not participated in similar studies yet.
Every surveyed group consisted of 10 people (5 women and 5 men in each group). All respondents were in the age group of 19–25 years. All respondents took part in the entire survey and completed all parts of the questionnaire.
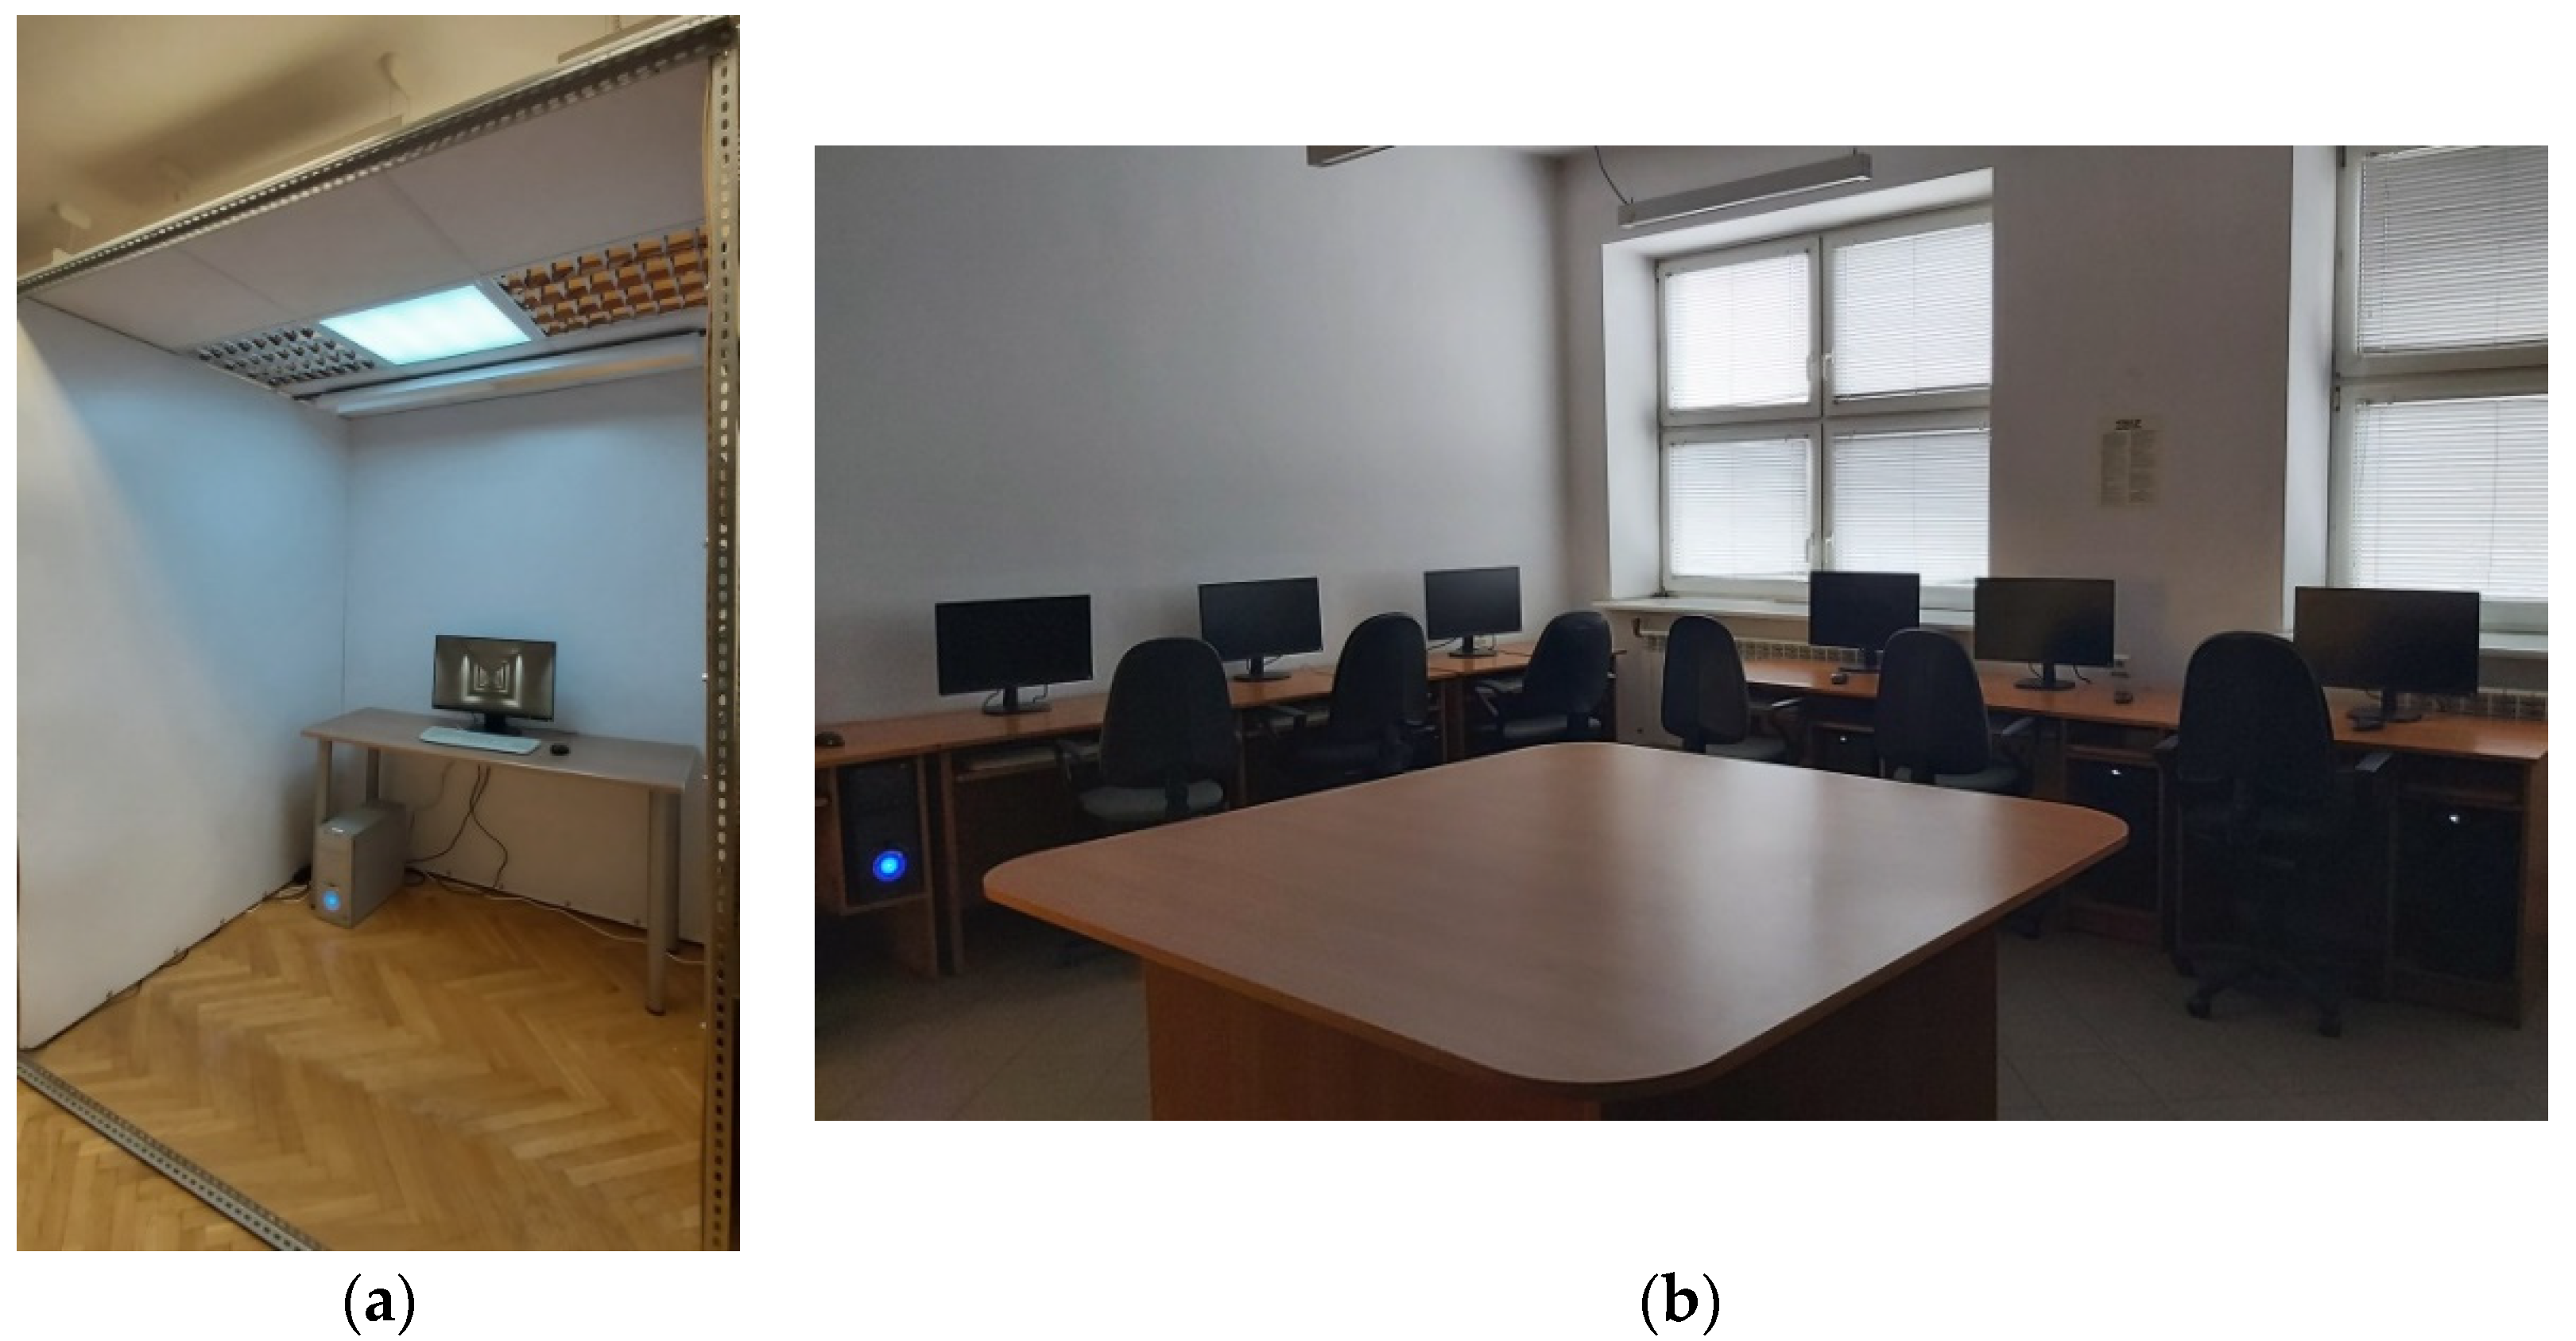
The first group (Group B—from “Box”) participated in the research that was carried out in a box adapted for this purpose at the Lighting Technology Division, Warsaw University of Technology. There was a computer station in the box. The recessed ceiling luminaires were used for the electric lighting in the box. The luminous fluxes of the light sources were adjusted to produce the level of average luminance on the wall behind the screen (in the respondents’ field of view) of approximately 10 cd∙m−2. The luminance distributions of computer screens for the individual variants were also measured. Therefore, the lighting conditions were alike to all respondents and were controlled. Each of the respondents from this group took part in the survey individually.
The second group (Group C—from “Classroom”) participated in the research that was carried out in the computer room of the Lighting Technology Division, Warsaw University of Technology. The available daylight, which came through the windows located on the northern wall of the room, was used to illuminate the interior. The windows were covered with louvers to reduce the luminance of the windows and to eliminate the view-out. The incoming daylight was sufficient to read the information and fill in the questionnaires. The lighting conditions in the room were quite similar for all respondents but were not controlled. All respondents in Group C used the same types of computer screens (different from the one applied by the respondents in Group B) that were not calibrated. All participants from this group took part in the survey at the same time.
Figure 3 shows the venues where the research was done.
The survey results considering brightness and uniformity perception were processed into numerical values. Value 1 was assigned to extremely dim/extremely non-uniform answers. Value 7 was assigned to extremely bright/extremely uniform answers. Values from 2 to 6 were assigned to intermediate answers, relatively to the impression intensity. For every lighting situation and for each group separately, the mean values of perceived brightness and uniformity were calculated for every plane and the entire corridor.
The qualitative evaluation of lighting was comparative and applied to:
The convergence in assessment of changes in the brightness and uniformity perception for successive lighting situations between the groups.
The convergence of brightness and uniformity perception for a given lighting situation between the groups.
3. Results and Discussion
3.1. The Computer Simulation and Quantitative Assessment of Lighting
As a result of the first stage of the research, the computer simulations of lighting were developed. Each of 10 solutions elaborated was briefly presented in the following way: The used means and obtained effects.
Lighting variant 1 (
Figure 4) was performed with the use of eight A-type luminaires located directly on the ceiling, in one row along the corridor. The lighting installation was characterized by the lowest mean illuminances of the ceiling and walls among all variants.
Lighting variant 2 (
Figure 5) was implemented using 16 A-type luminaires (with a lower luminous flux than in variant 1) located directly on the ceiling, in two rows along the corridor. Placing the luminaires near the walls caused a significant increase in mean illuminance and a reduction in uniformity of the walls compared to variant 1.
Lighting variant 3 (
Figure 6) was performed with the use of 22 B-type luminaires located directly on the ceiling, in one continuous line along the corridor. The effect of uniform illumination of the walls was achieved. The mean illuminance on the walls was similar to that of variant 2.
Lighting variant 4 (
Figure 7) was implemented with the use of 6 B-type luminaires (with a higher luminous flux than in variant 3) located directly on the ceiling, in one non-continuous line along the corridor. The use of the non-continuous light line reduced the wall illumination uniformity compared to variant 3 while maintaining the mean illuminance value.
Lighting variant 5 (
Figure 8) was performed using 44 C-type luminaires located directly on the ceiling, in two continuous lines along the corridor. The asymmetric light distribution of the luminaires and the proximity of the walls caused a significant rise in mean illuminance of the wall. At the same time, the longitudinal uniformity of the walls was high.
Lighting variant 6 (
Figure 9) was performed with the use of 12 C-type luminaires (with a higher luminous flux than in variant 5) located directly on the ceiling, in two non-continuous lines along the corridor. The use of the non-continuous light lines lowered the wall illumination uniformity compared to variant 5 while maintaining the average illuminance value
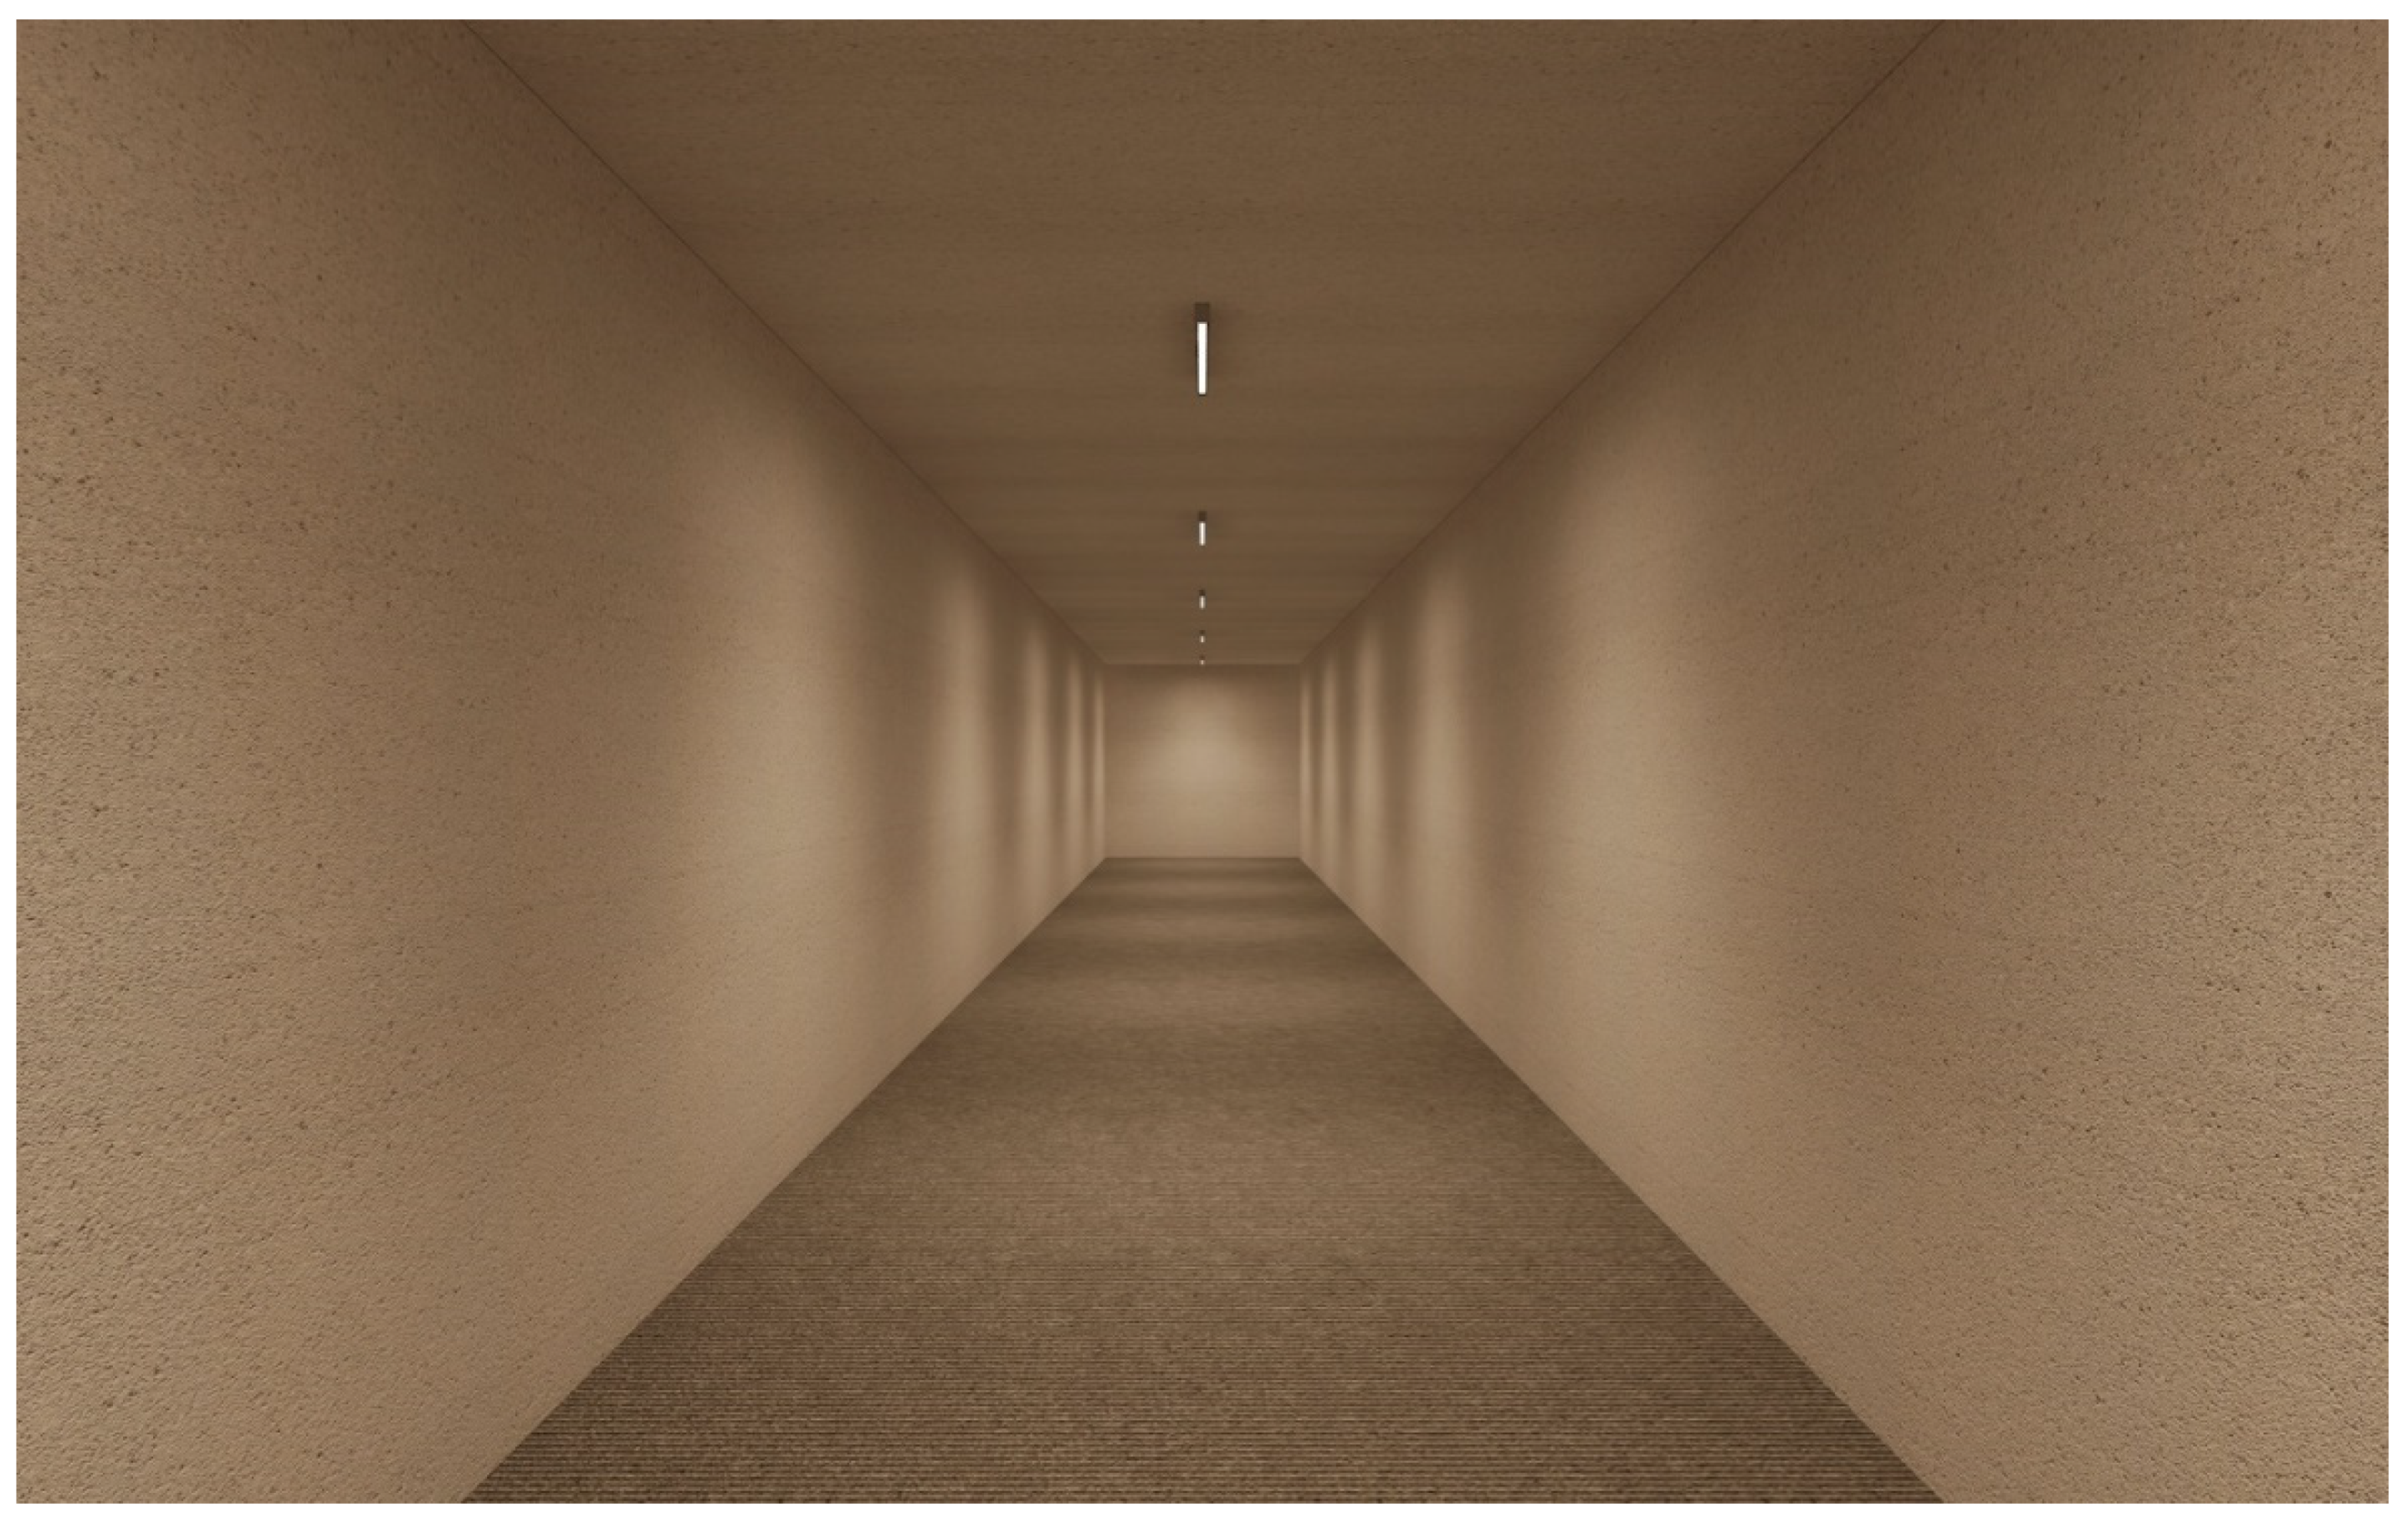
Lighting variant 7 (
Figure 10) was implemented using 18 D-type luminaires suspended from the ceiling, in one continuous line along the corridor. The luminous flux sent into the upper hemisphere caused a significant increase in the mean ceiling illuminance. The longitudinal ceiling illumination uniformity was high and the transverse one was low. The average illuminance and uniformity on the wall were comparable to variant 3.
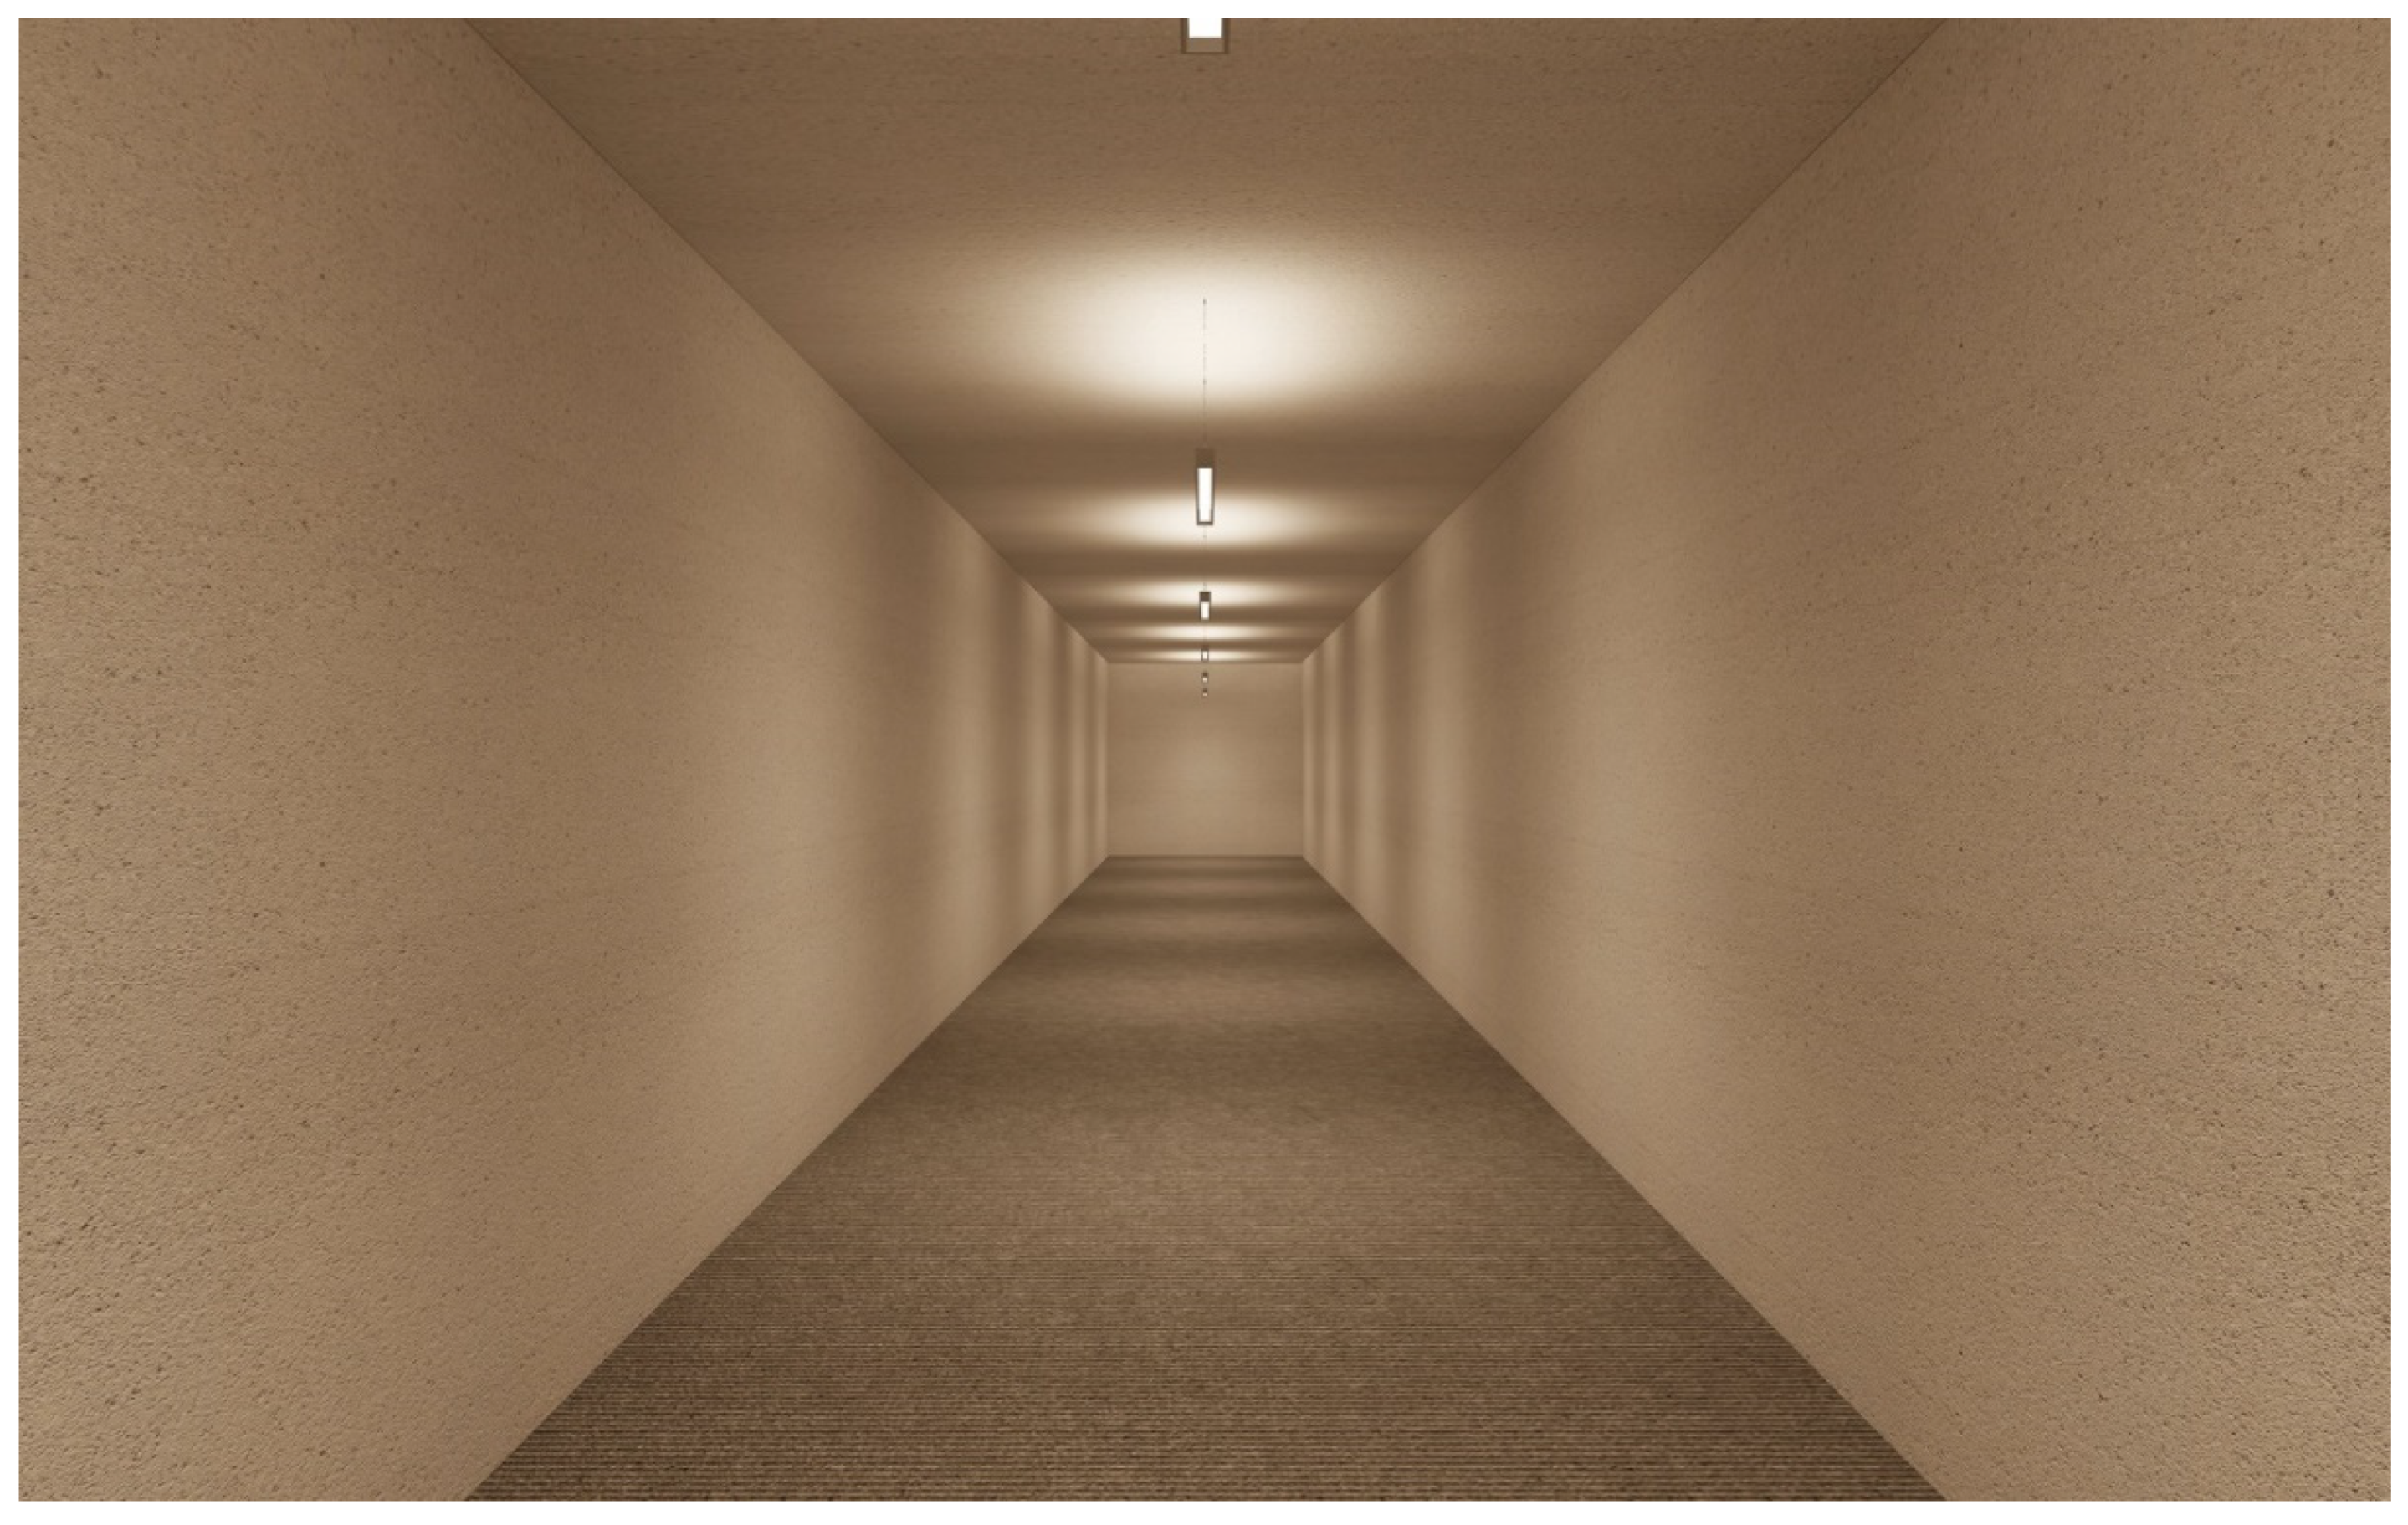
Lighting variant 8 (
Figure 11) was performed with the use 6 D-type luminaires (with a higher luminous flux than in variant 7) suspended from the ceiling, in one non-continuous light line along the corridor. The use of the non-continuous light line lowered the ceiling and wall illumination uniformity compared to variant 7 while maintaining the mean illuminance value.
Lighting variant 9 (
Figure 12) was implemented with the use of 20 E-type luminaires located on the walls, in two rows along the corridor. This variant was characterized by relatively high levels of mean ceiling and wall illuminance, and at the same time relatively low uniformities on these planes.
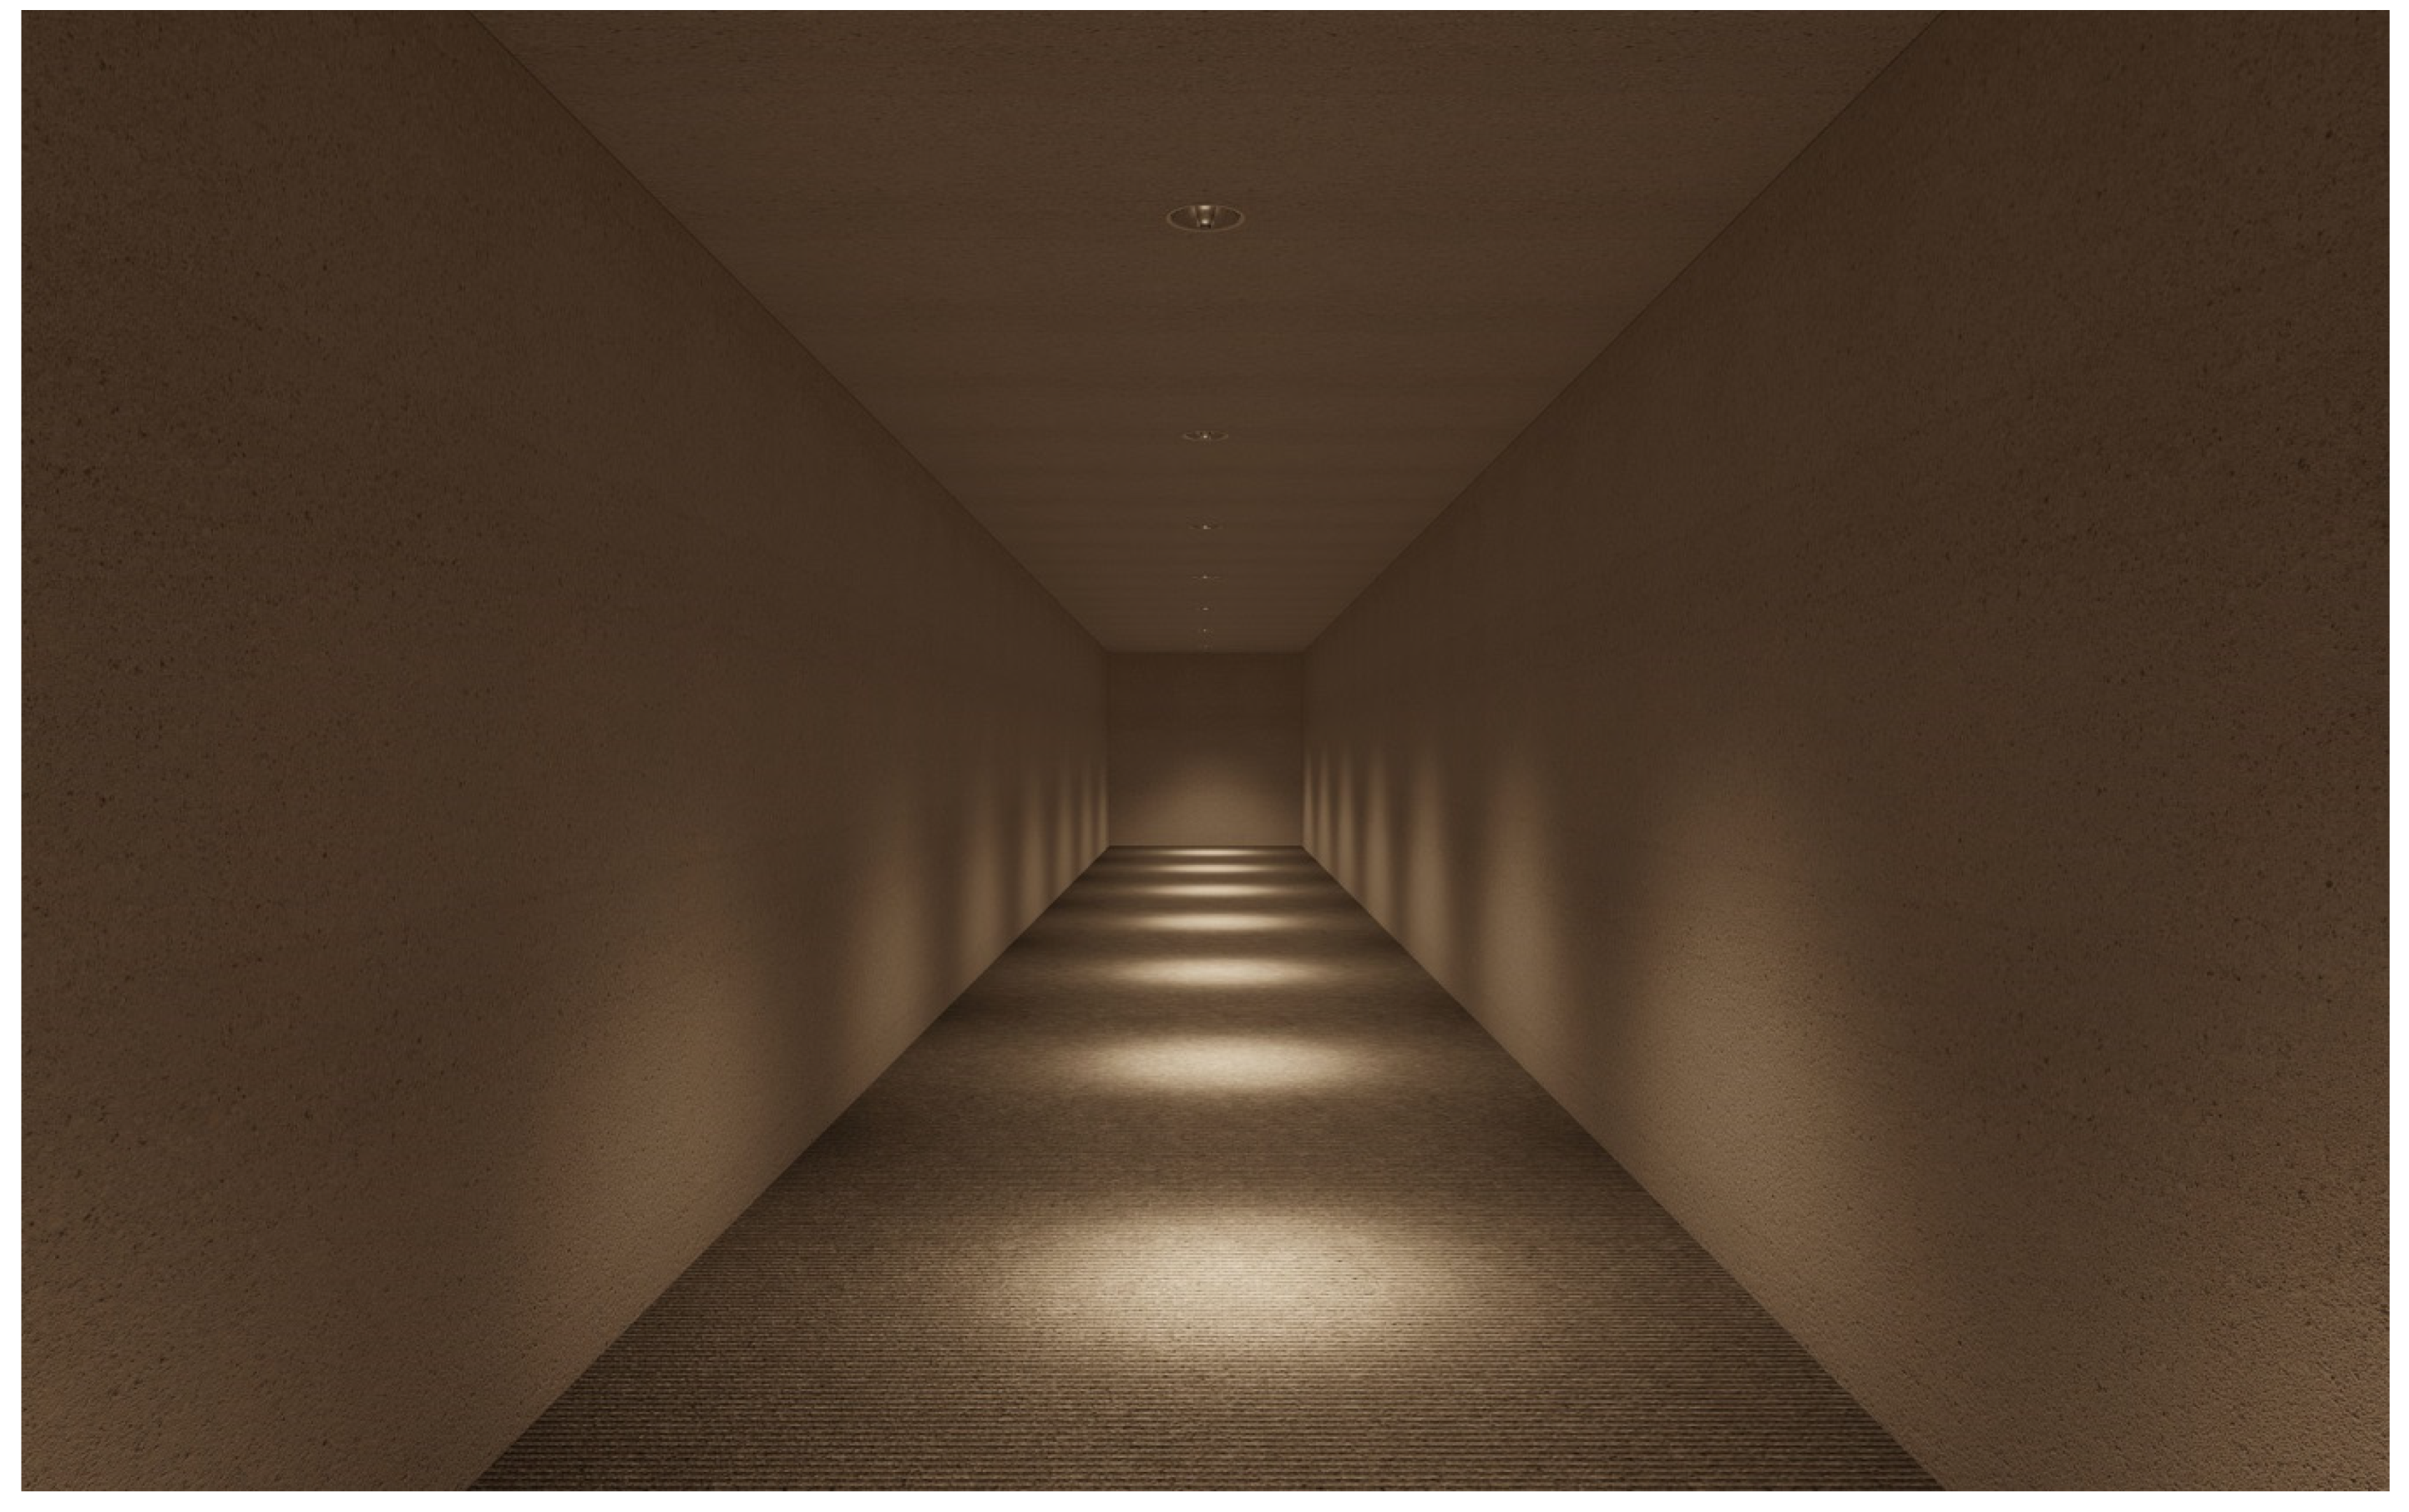
Lighting variant 10 (
Figure 13) was performed using 40 F-type luminaires located on the walls, in two rows along the corridor.
The asymmetric upward light distribution of the luminaires caused a significant increase in average ceiling illuminance with high uniformity. The levels of wall illuminance and uniformity were also high.
The quantitative assessment of the corridor lighting was based on the results of illuminance and luminance calculations from the DIALux software, which are summarized in
Table 2.
The use of direct lighting luminaires with a narrow light distribution (type A) made it impossible to obtain the required mean illuminance on the ceiling in variants 1 and 2, and the required mean illuminance on the walls in variant 1. The application of direct lighting luminaires with a wider light distribution (type B) also limits achieving the recommended illumination on the ceiling and walls in variants 3 and 4. In these situations, the recommended levels of mean illuminance on the ceiling and walls were not obtained. The use of direct-indirect lighting luminaires with limited light distribution in the lateral direction (type D), in variants 7 and 8, reduces achieving the recommended wall illumination. In these cases, the recommended levels of mean wall illuminance were not obtained. In all cases, the requirements for uniformity on the work plane (>0.40), and on the ceiling and walls (>0.10) were met. The achieved uniformities significantly exceeded the requirements.
Solution 5 was characterized by the lowest installed power density among the variants meeting all lighting requirements whereas the lowest installed power density among the variants meeting all lighting recommendations was characteristic of solution 3. To sum up, from the point of view of the quantitative lighting assessment made on the basis of illuminance distributions, solutions 5 and 3 should be preferred.
It is worth paying attention to the relationships between the obtained effects (relative average ceiling E
C/E
F and wall E
W/E
F illuminances) and the efficiency of lighting solutions (utilization factor (UF) and installed power density (PD)).
Figure 14 illustrates this relation.
The analyzed cases were ordered from the most efficient (the highest utilization factor and the lowest power density) solution 1 (in the bottom right corner of the graph) to the least efficient (the lowest utilization factor and the highest power density) solution 10 (in the top left corner of the graph).
It should be noted that solutions 3, 5, and 7 (where the continuous lines were applied) are more efficient than solutions 4, 6, and 8 (with the same types of luminaires, but with the non-continuous lines and much higher luminous fluxes of the luminaires). It arises from the luminaire layout, which resulted in a higher utilization factor of solutions 3, 5, and 7.
It is also worth noting that solution 7 is more efficient than solution 5, and solution 8 is more efficient than solution 6. It arises from more efficient use of the luminous flux of the luminaires to illuminate the work plane (floor). In solutions 7 and 8, a higher amount of the luminous flux of the luminaires is emitted directly towards the floor than in solutions 5 and 6.
The wall mounted solutions are the least efficient, especially solution 10 where the work plane illumination results only from the luminous flux reflected from the ceiling and walls.
3.2. The Survey and Qualitative Assessment of Lighting
In the second stage of the research, the survey in two groups were conducted: For the first group B in the box and for the second group C in the computer room.
Table 3 presents the results of measurements of the mean luminance of the corridor image presented to the respondents from group B on the computer screen located in the box.
The following parameters were given for each lighting situation:
LFM—the mean luminance of part of the floor in the corridor displayed on the screen.
LWM—the mean luminance of part of the walls in the corridor displayed on the screen.
LCM—the mean luminance of part of the ceiling in the corridor displayed on the screen.
LRM—the mean luminance of part of the entire corridor displayed on the screen.
The mean luminance level on the wall behind the screen (in the field of view of the respondents from group B) was about 10 cd∙m−2. The luminance distribution in the computer room and on the computer screens in group C was not controlled.
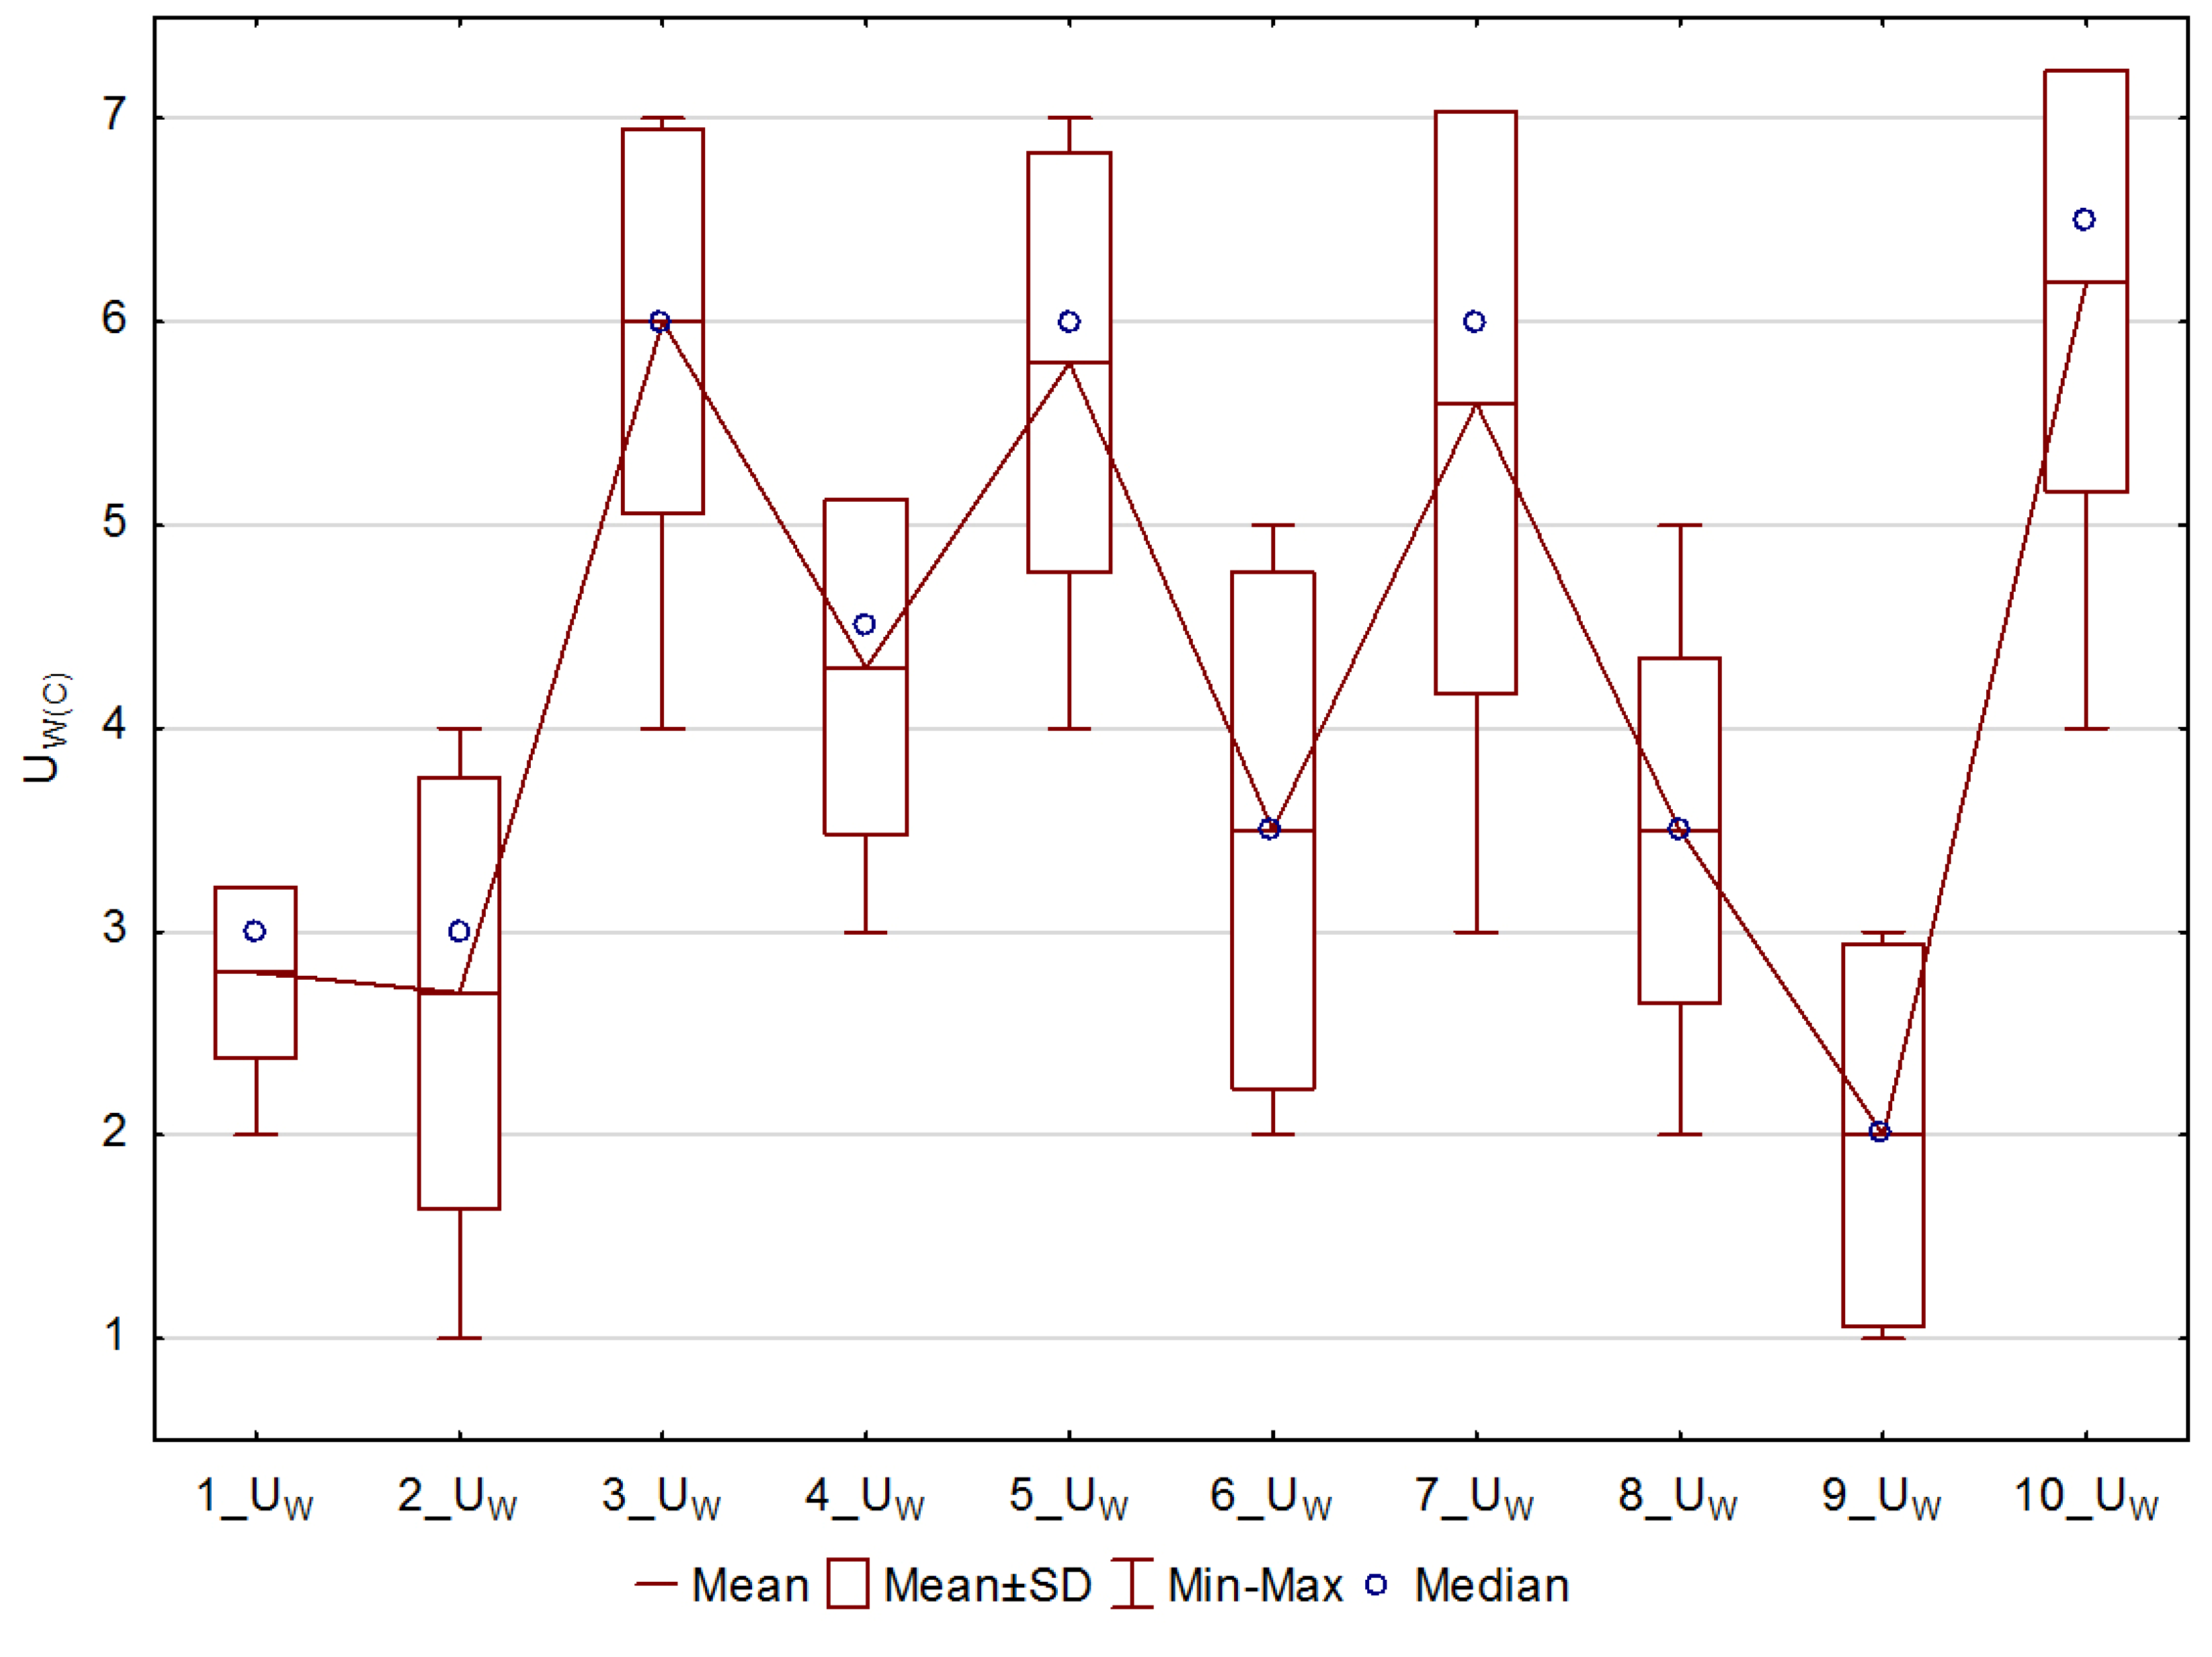
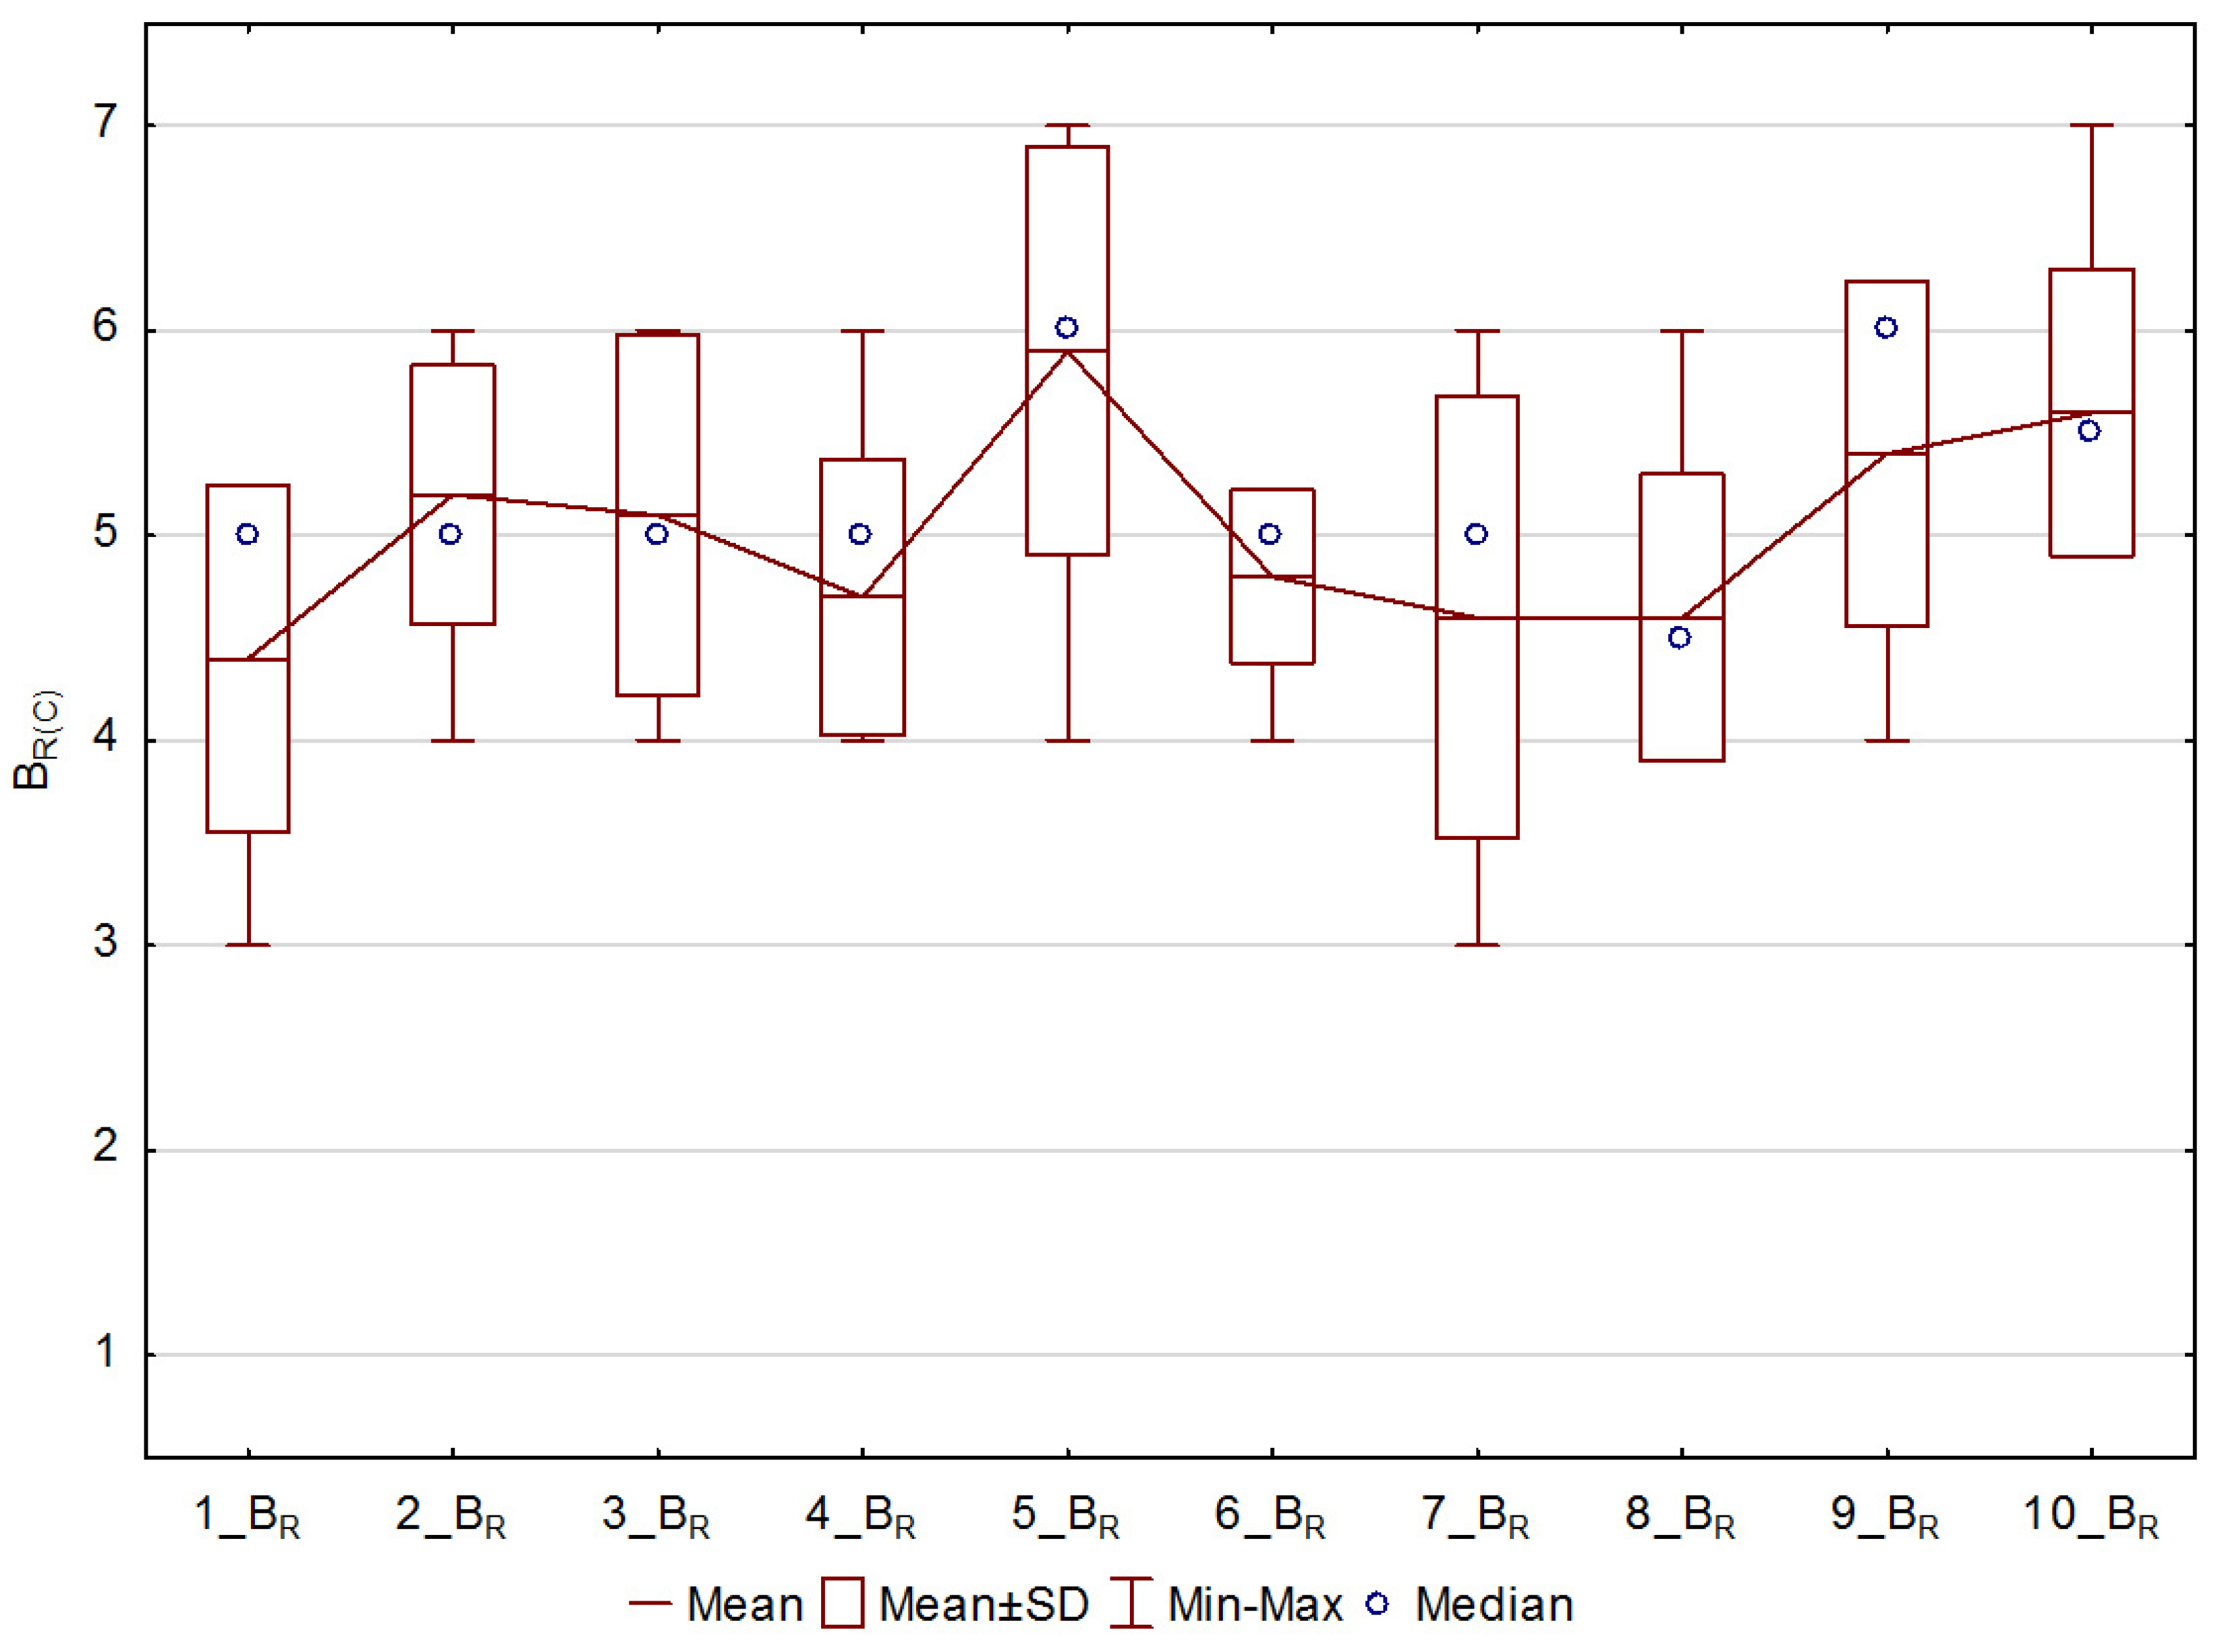
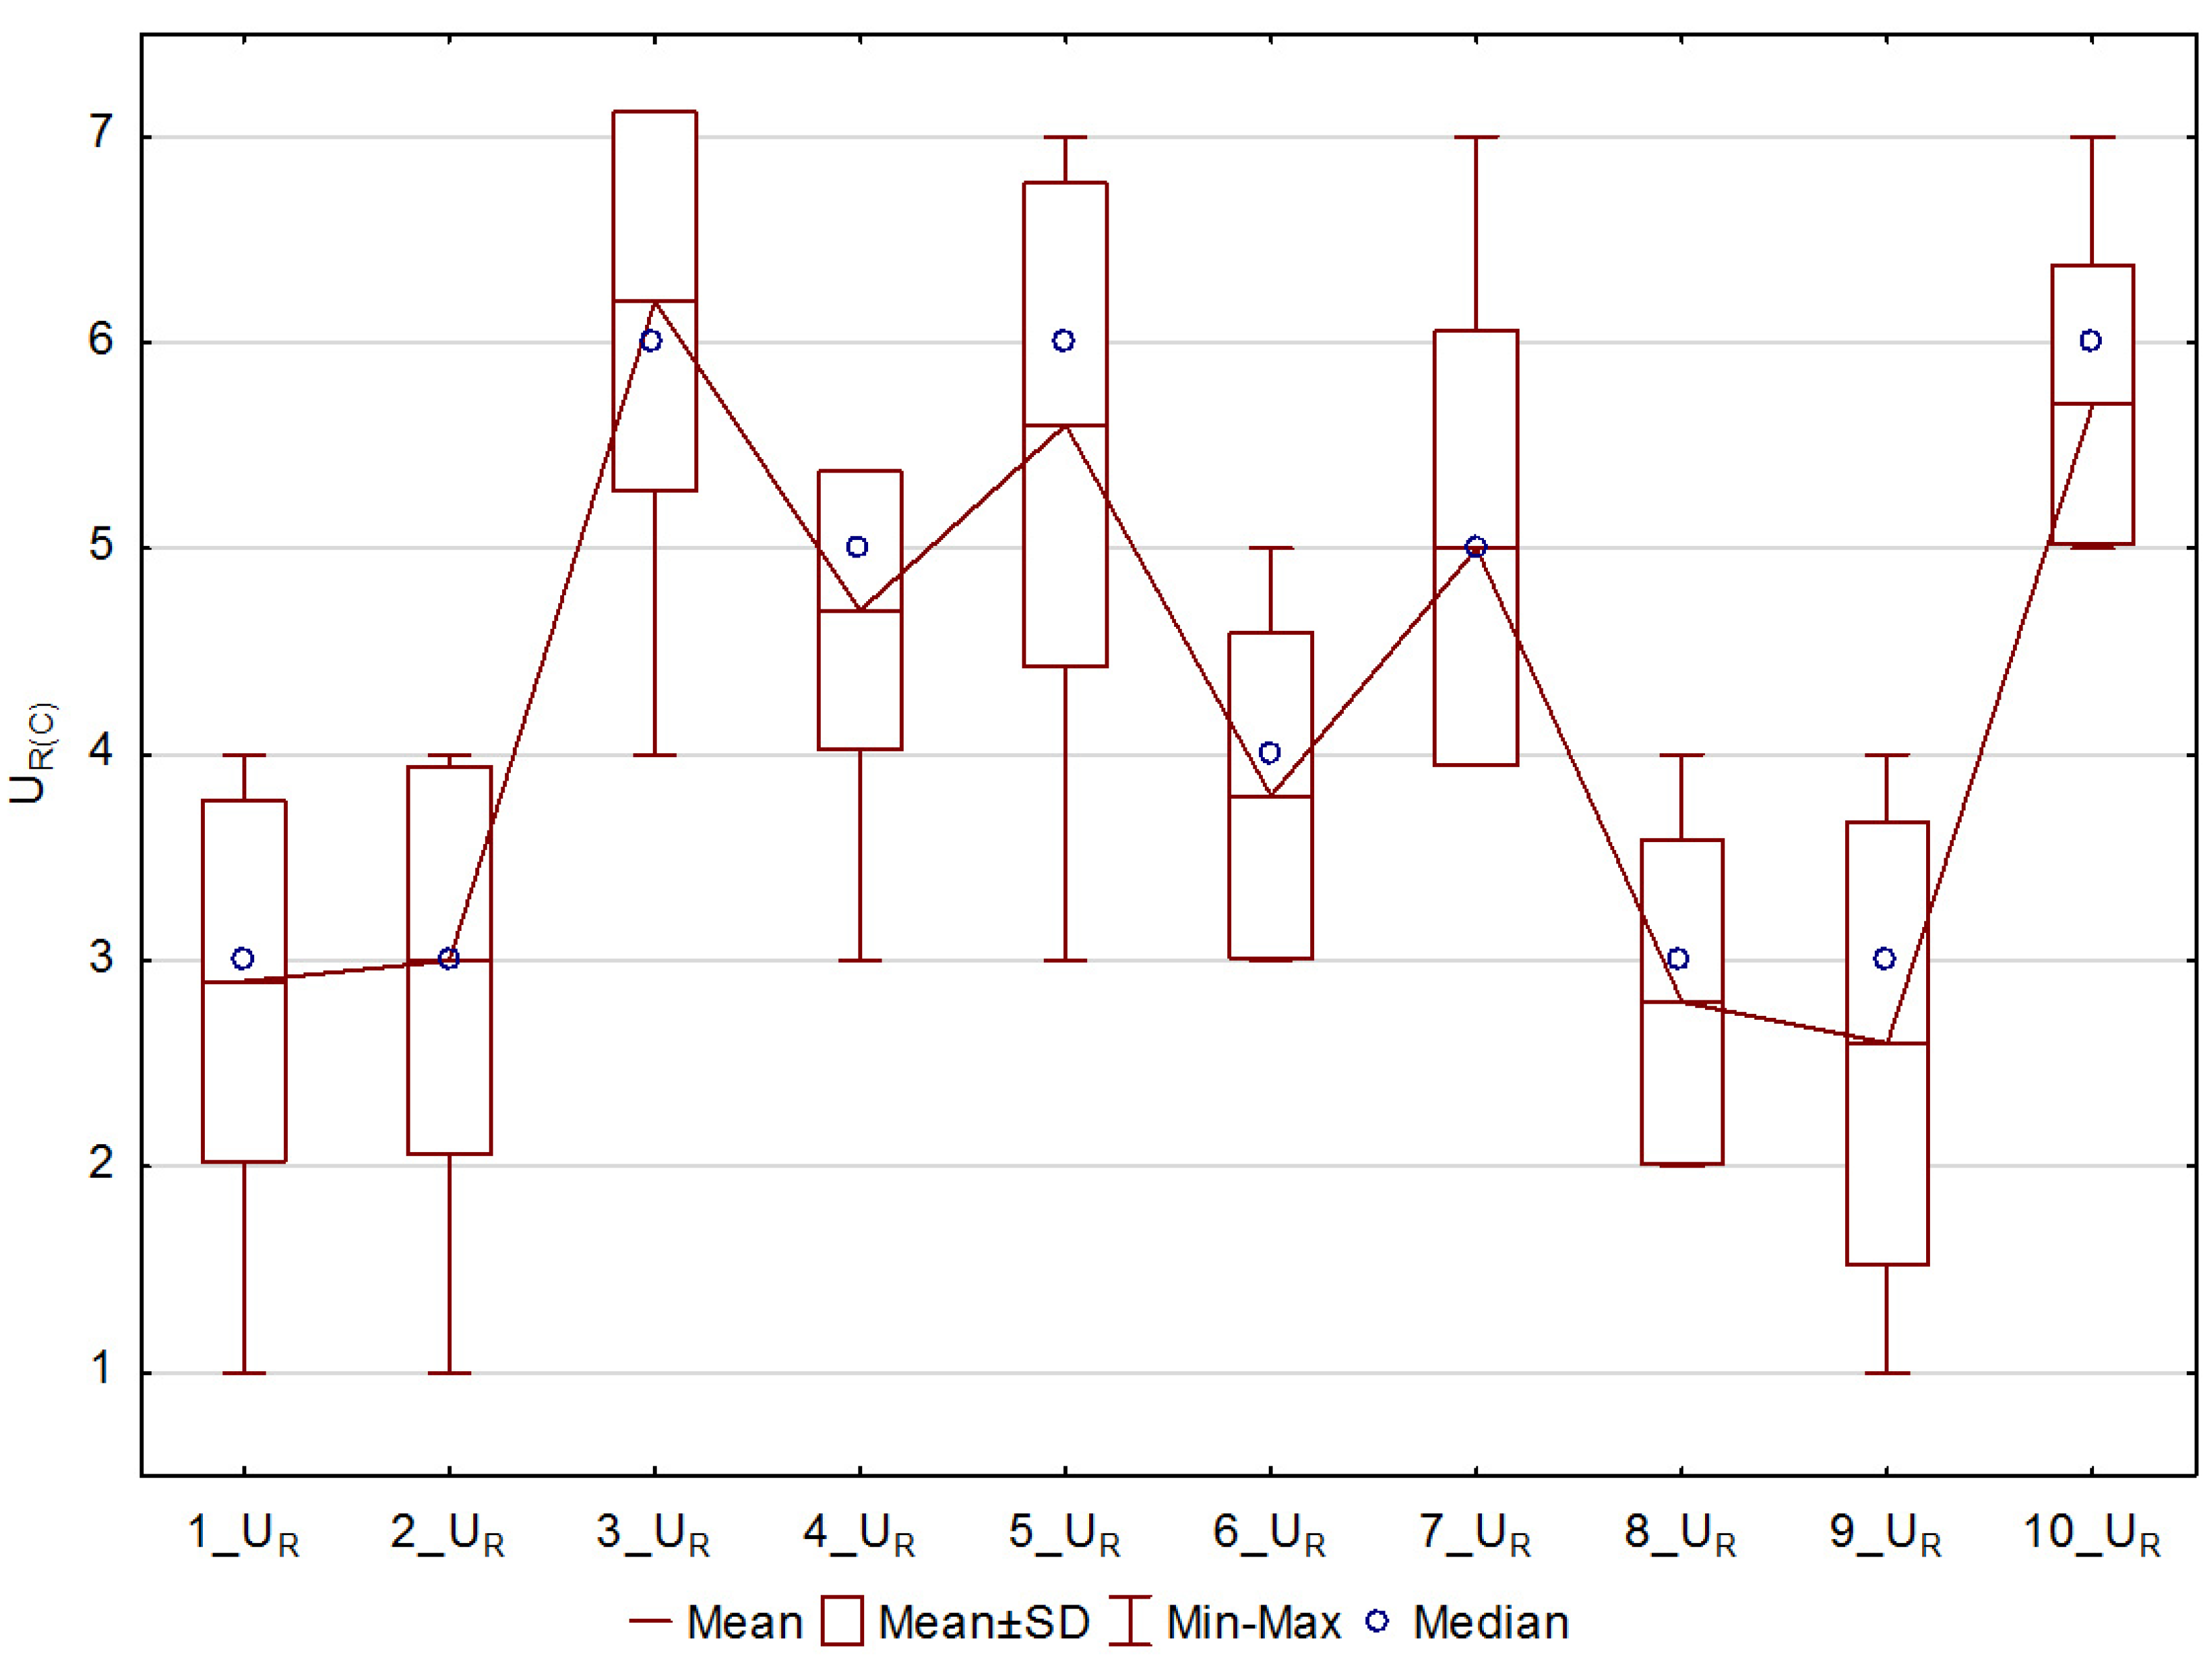
On the basis of all completed questionnaires, for the brightness and uniformity for the individual lit planes and corridor, the mean values (Mean), medians (Median), minimum (Min.), maximum (Max.), and standard deviations (SD) of the mean values were calculated for each group and each lighting situation. The symbols used indicate: Lighting situation (from 1 to 10), analyzed feature (B—brightness, U—uniformity), illuminated planes (F—floor, W—walls, C—ceiling, R—the entire corridor), and group ((B)—group B, (C)—group C).
3.3. Brightness and Uniformity Perception of Consecutive Computer Images of Corridor
On the basis of the obtained results, the changes in the brightness and uniformity perception on a given plane and the corridor in the consecutive situations were analyzed for each group.
In every group, it was estimated that the highest mean floor brightness occurred in variant 1 (BF(B) = 5.4, BF(C) = 5.7). The perception of a higher floor brightness in variant 1 was associated with a much lower ceiling and wall brightness than in the other variants. For the remaining variants, the average floor brightness perception in group B ranged between 3.8 and 4.3, and in group C it ranged between 4.4 and 5.1. The floor brightness for variants 2 to 10 was therefore assessed very similarly in each group. However, for each situation, group C estimated that the floor brightness levels were higher compared to the ones evaluated by group B.
In every group, it was assessed that the lowest mean floor uniformity occurred in variant 1 (UF(B) = 1.6, UF(C) = 2.0), and then in variant 2. In each group it was estimated that in variants 3, 5 and 7 (continuous light lines) the floor illumination uniformity was higher than in variants 4, 6 and 8 (non-continuous light lines). The floor illumination uniformity in variant 10 was also rated very high.
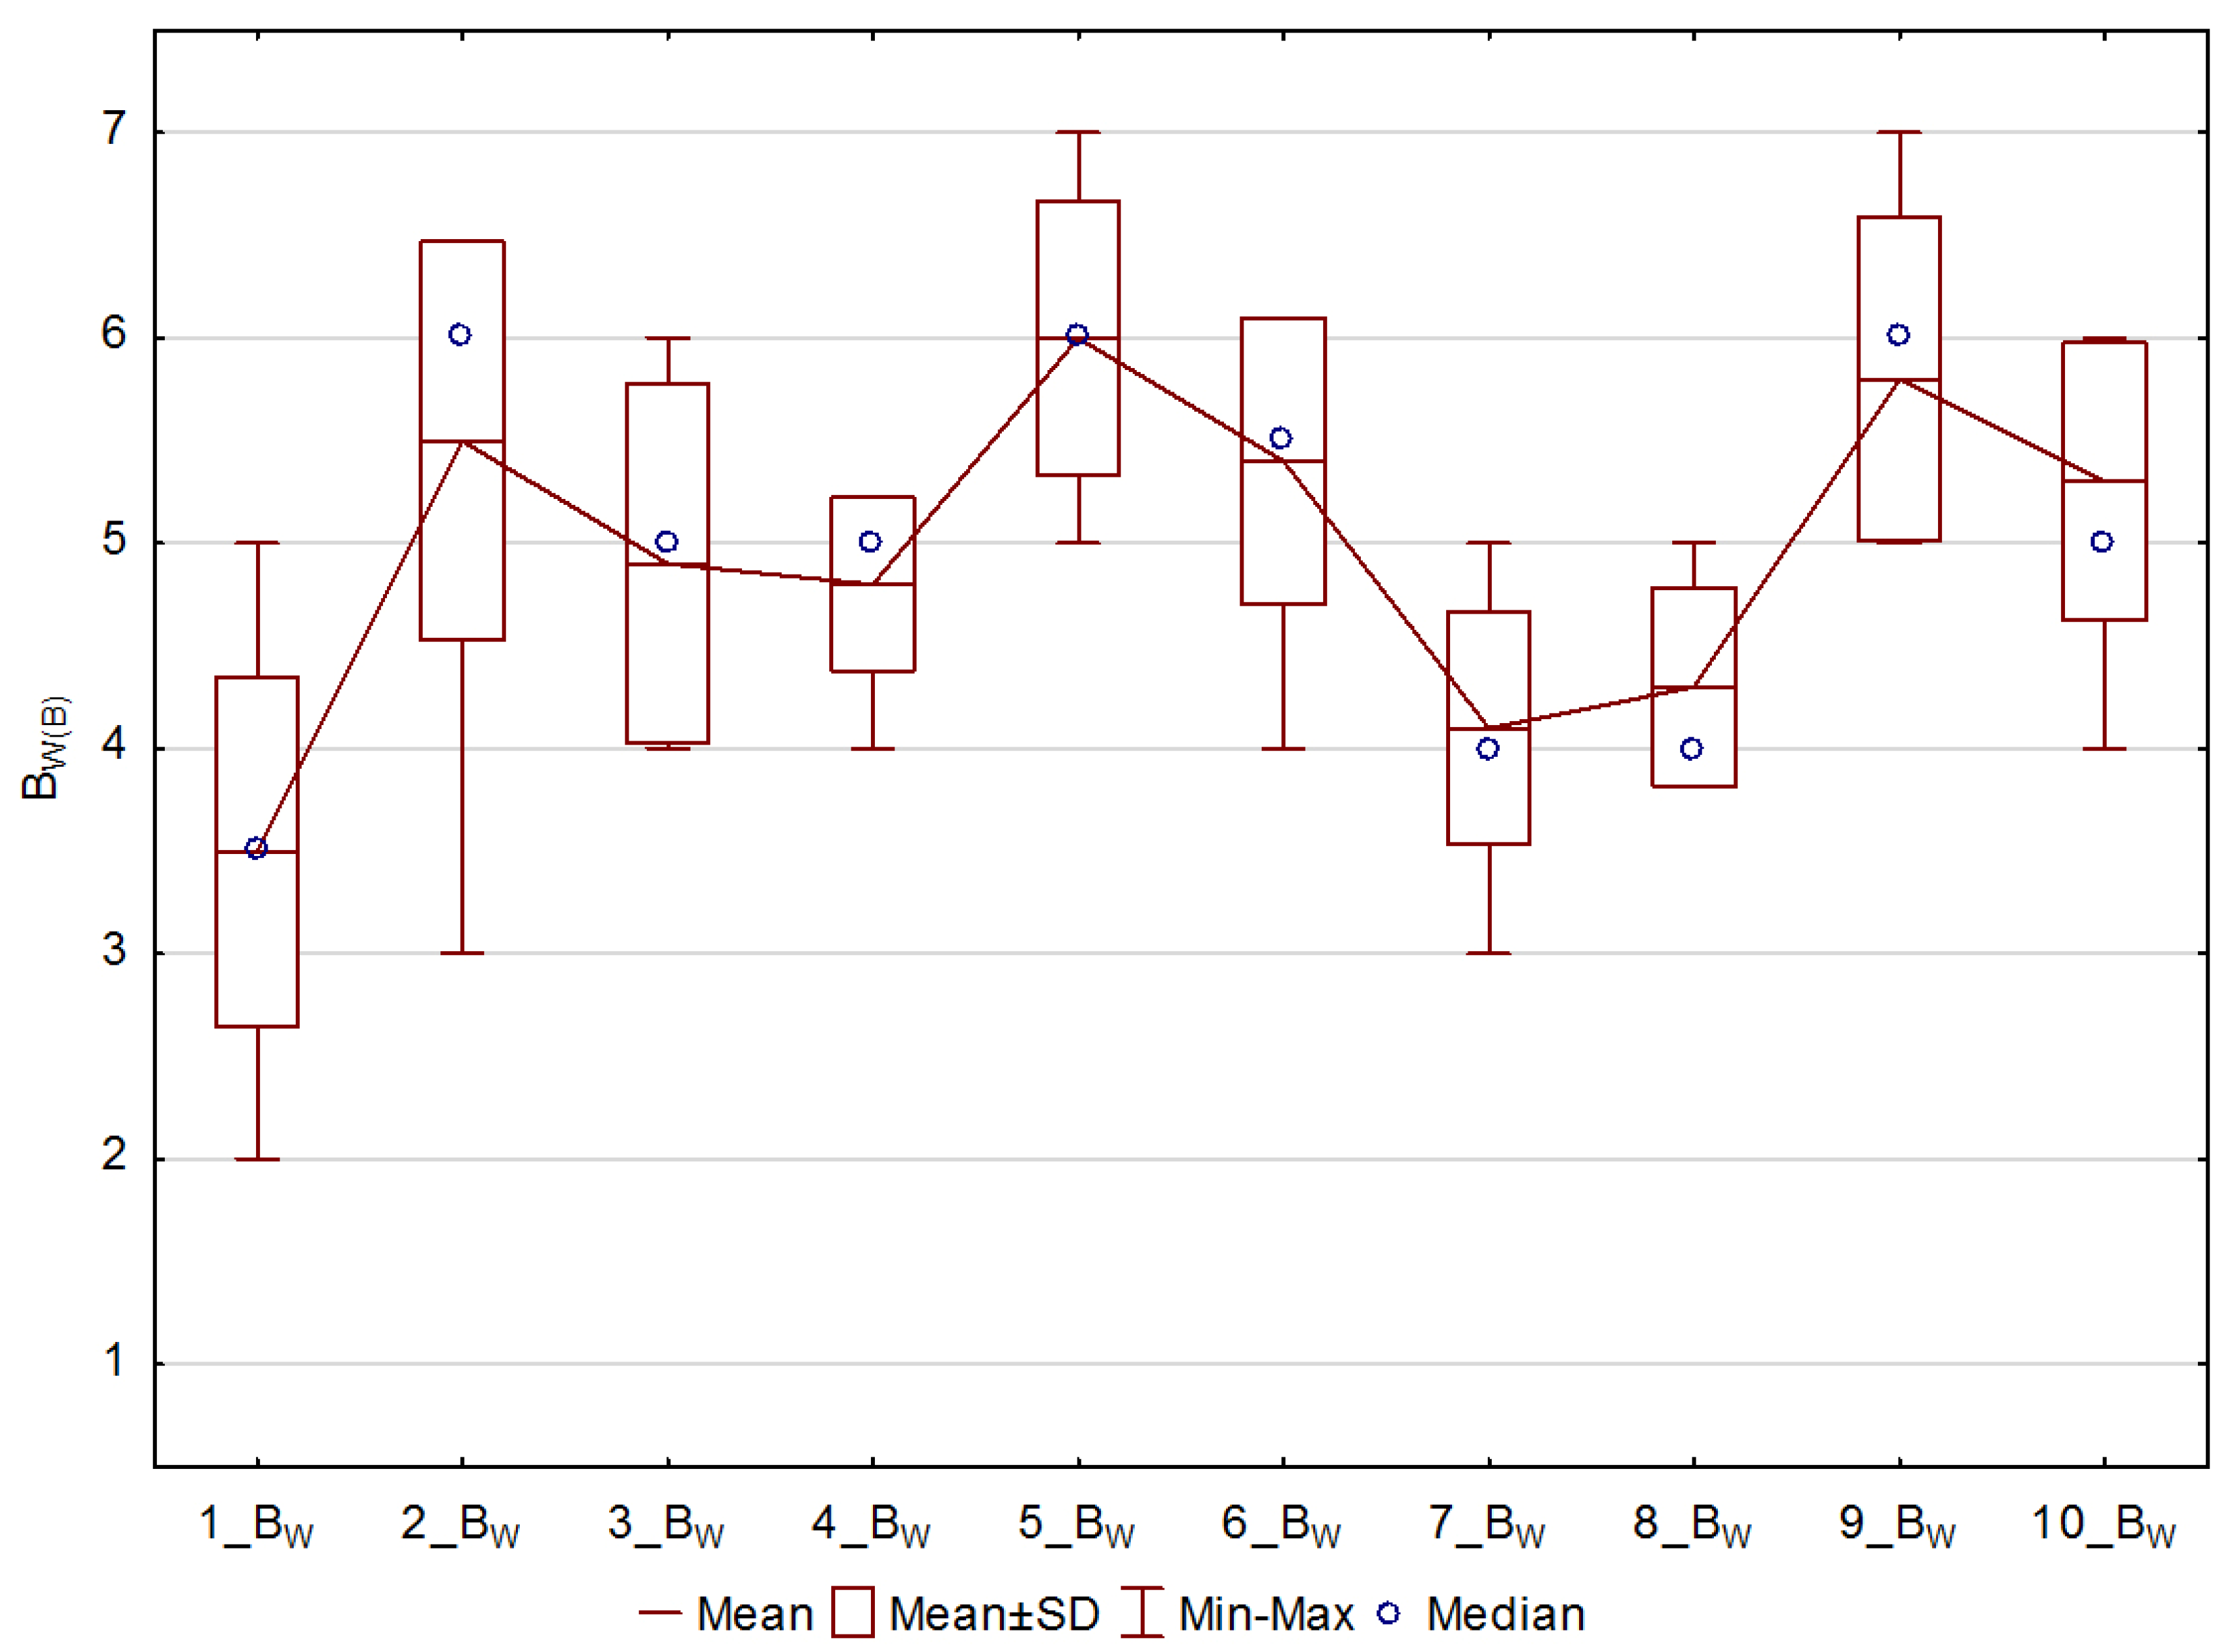
When analyzing the results, it can be concluded that in each group, it was assessed that the lowest mean wall brightness occurred in variant 1 (BW(B) = 3.5, BW(C) = 4.3) whereas the highest mean wall brightness occurred in variant 5 (BW(B) = 6.0, BW(C) = 6.3). In each group, almost identical nature of changes in the wall brightness assessment for consecutive variants can also be observed. It was assessed that in variants 7 and 8, despite the high mean luminance, the wall brightness was low (only higher than the brightness in variant 1). It was estimated that in variant 3 the wall brightness perception was lower than in option 2, despite a higher mean luminance in option 3. This could be connected with the sequence of presented variants to the respondents.
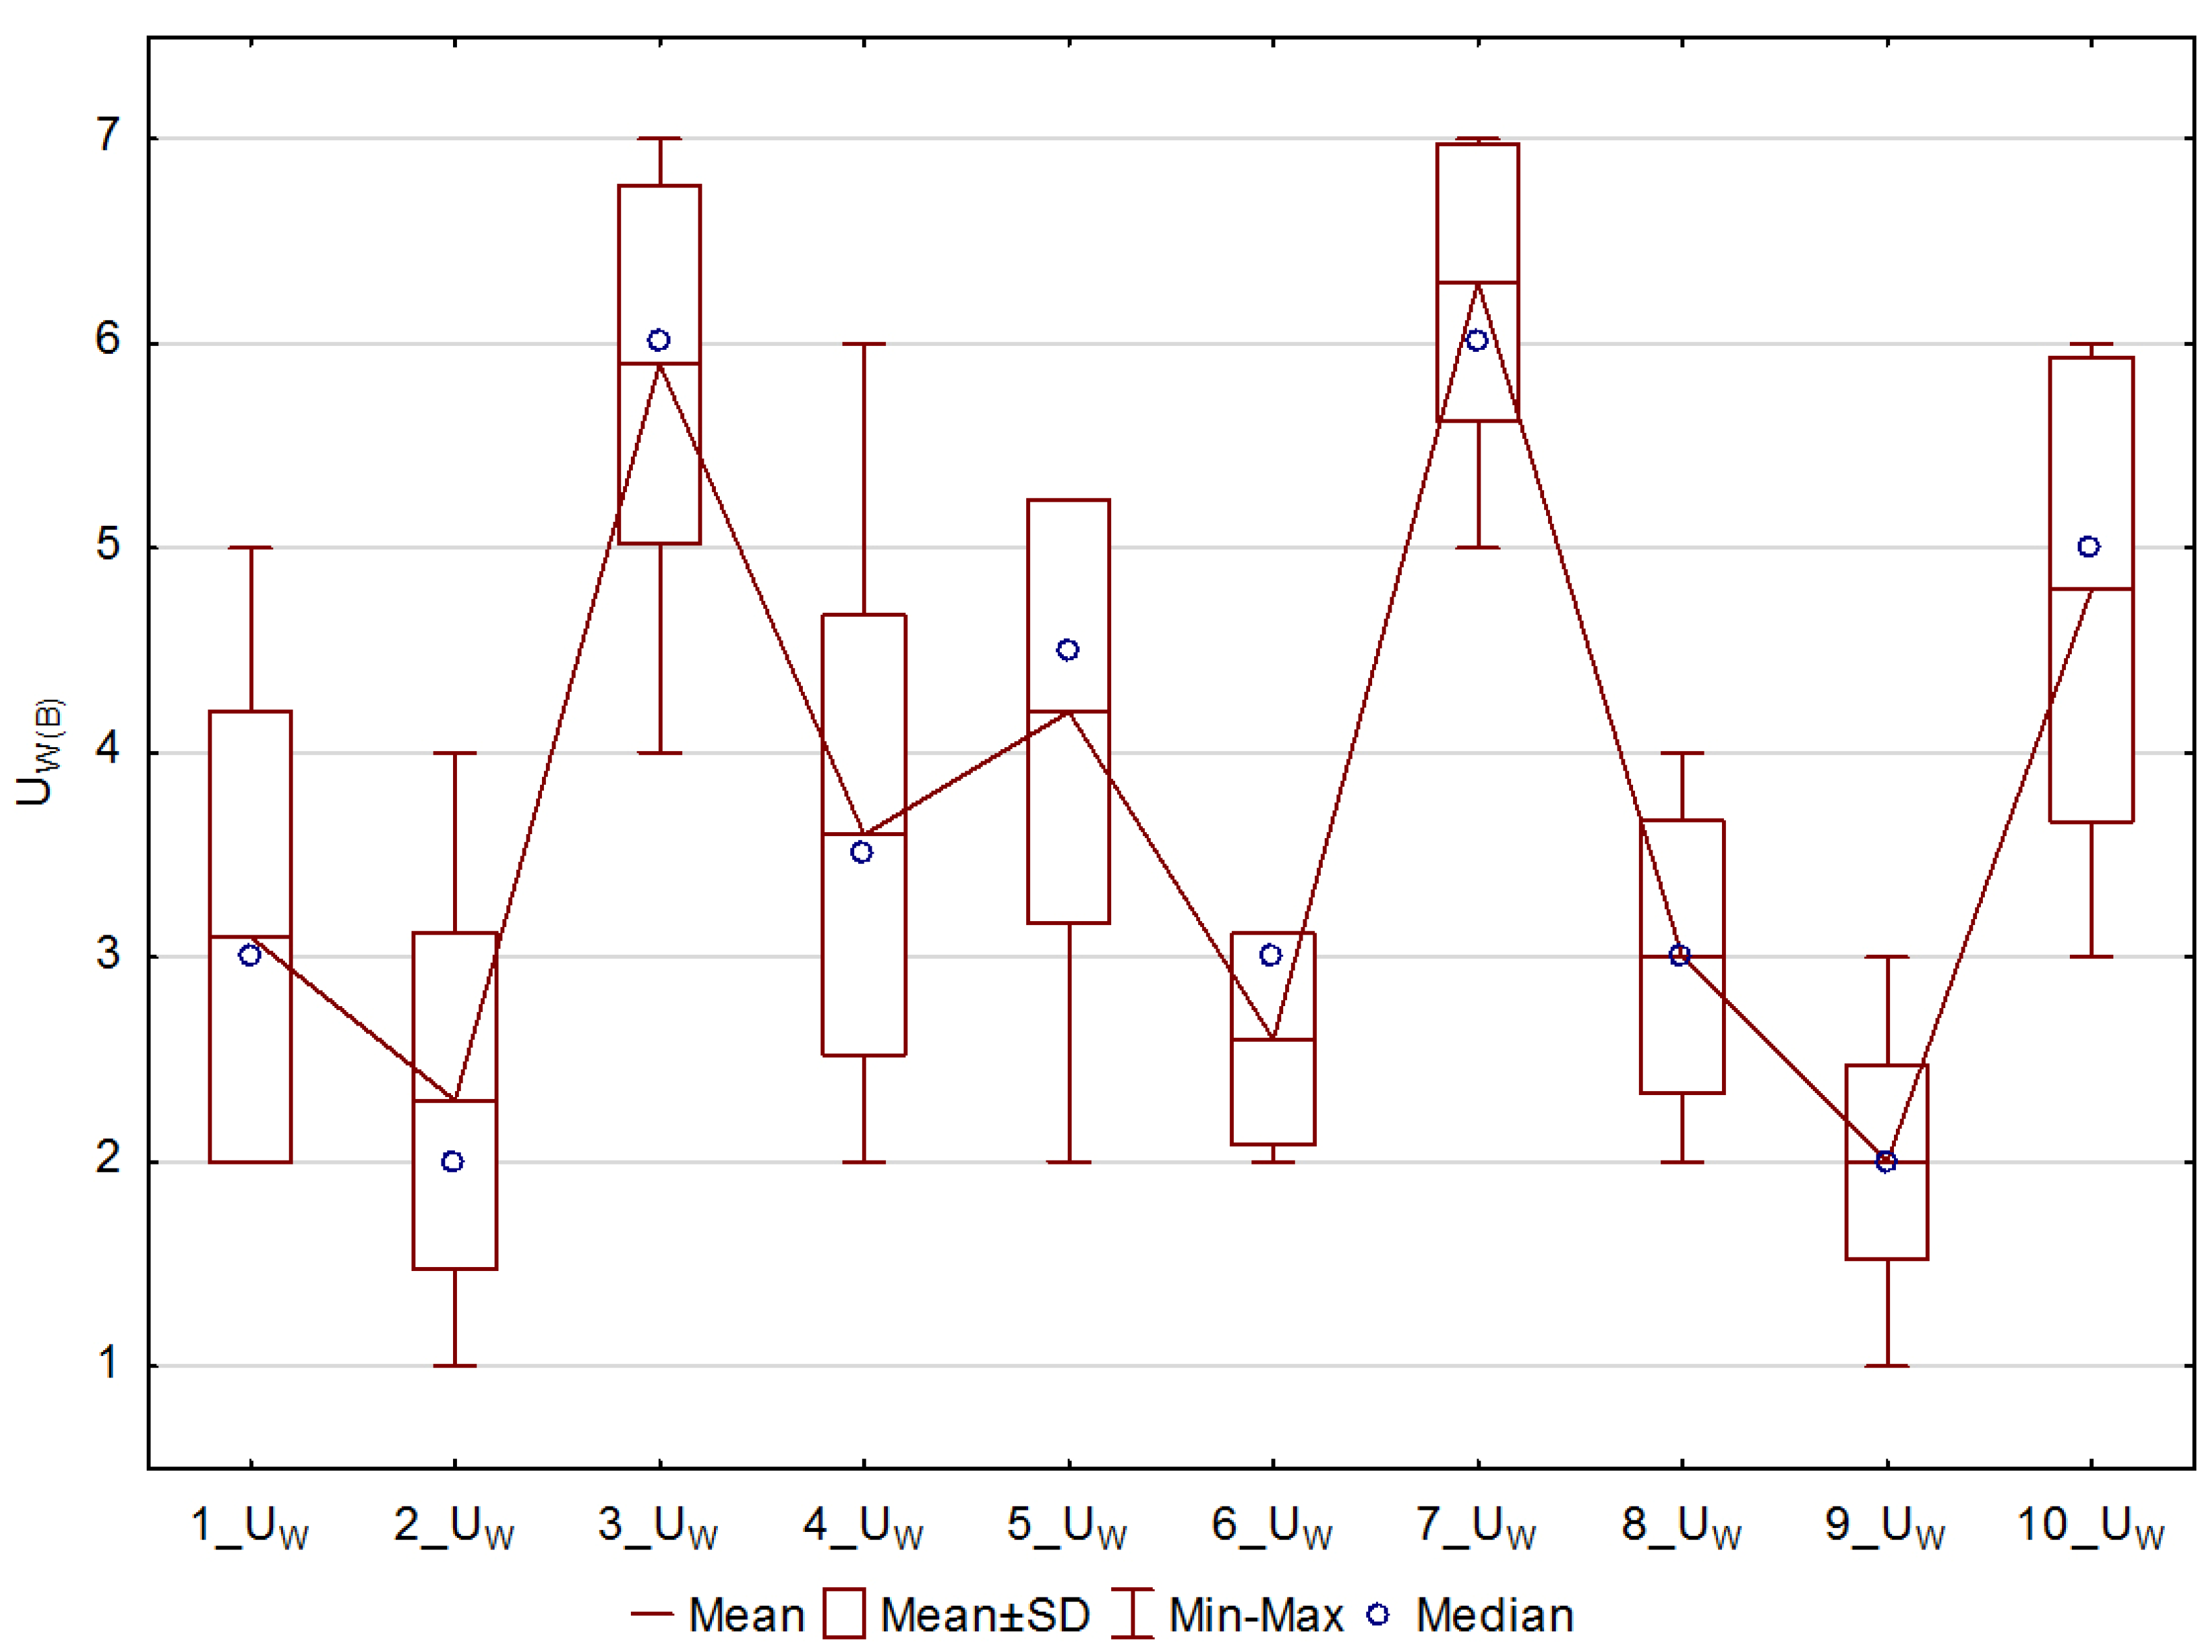
In each group, the respondents estimated that the lowest mean wall uniformity occurred in variant 9 (UW(B) = 2.0, UW(C) = 2.0), and then in variant 2. The perceived wall brightness contrasts were definitely the highest in these variants. In each group, the low wall uniformity was also observed in variants 1, 6, and 8. Like in the case of the floor, also, when assessing the wall uniformity, the high uniformity was noticed in variants 3, 5, 7 and 10. In group B, the wall uniformity in variants 5 and 10 were rated slightly lower.
In each group, it was estimated that the lowest mean ceiling brightness occurred in variant 1 (BC(B) = 3.0, BC(C) = 3.2), and then in variant 2. Very similar assessments were recorded for variants 3, 4, 5, and 6, and then higher for variants 7, 8 and 9. The ceiling brightness was rated the highest in variant 10 (BC(B) = 6.9, BC(C) = 6.6). It should be noted that in variant 5 group C assessed the ceiling brightness significantly higher than group B. In each group, the identical nature of changes in the ceiling brightness assessment for consecutive variants can be observed. It was estimated that in variant 9 the ceiling brightness perception was lower than in variant 8, despite a higher mean luminance in variant 9. This could be connected with a significantly higher wall brightness perception in variant 9 compared to variant 8.
In each group, the ceiling uniformity was rated very low in variants 8, 9, 7, and 6, too. In none of these cases was the mean ceiling uniformity value higher than 4.00, and in the variant where the uniformity was rated the lowest (situation 8), the mean values for the groups were: UC(B) = 1.7, UC(C) = 2.1. As for the direct lighting situations 1–5 (the exception was variant 6—asymmetric lighting with the non-continuous lines) and for the indirect lighting—variant 10, the ceiling uniformity was rated relatively high.
In each group, the respondents estimated that the lowest mean corridor brightness occurred in variant 1 (BR(B) = 4.2, BR(C) = 4.4). It was also assessed that the highest mean corridor brightness occurred in variant 10 for group B (BR(B) = 6.2) and in variant 5 for group C (BR(C) = 5.9). The high mean corridor brightness was also observed in variant 9. The relatively high assessment of the corridor brightness in variant 2 and relatively low assessment of the corridor brightness in variant 6 should be noted, too. This can be connected to the mean brightness of the variants directly presented earlier—low in variant 1 and high in variant 5. In each group, a similar nature of the changes in the corridor brightness assessment can be observed for the consecutive variants.
In each group, it was estimated that the mean corridor uniformity was very low in situations 1, 2, 8, and 9. In none of these situations the mean corridor uniformity was higher than 3.00. The lowest assessments were assigned to the corridor uniformity, for group B in variant 2 (UR(B) = 2.3), and for group C in variant 9 (UR(C) = 2.6). In each group, it was estimated that the corridor uniformity was higher in variant 3 than 4, in variant 5 than 6 and in variant 7 than 8 (continuous light lines versus non-continuous light lines). In each group, the corridor uniformity was rated the highest in variant 3: UR(B) = 6.0, UR(C) = 6.2.
Finally, using the non-parametric Wald-Wolfowitz test, it was assessed in Statistica ver. 13.3 for how many and which cases the difference between the brightness and uniformity perception of the individual planes and the corridor between the groups was statistically significant.
Table 4 presents the mean and SD values for brightness and uniformity perception, and the tests results.
According to the results only for 5 in 80 analyzed lighting features, the difference between the group means was statistically significant at the level of 0.05. In 93.75% of cases, differences in brightness and uniformity perception between the group means were not significant.
3.4. Comparison of Brightness Perception of Computer Image of Illuminated Corridor for Each Solution Separately, between Groups
The convergence in evaluation of brightness perception between the groups was also assessed, for each solution separately. For this purpose, individually for every solution from 1 to 10, the mean plane and corridor brightness perception levels resulting from the questionnaires in groups B and C were ranked in descending order. The ranks, from 1—the highest brightness level to 4—the lowest brightness level, were assigned to the mean brightness levels for each solution. The survey results of the mean brightness perception levels and the assigned ranks are shown in
Table 5 for group B and in
Table 6 for group C.
In
Table 5, the presented symbols are as follows: The mean brightness perception for: Floor B
F(B), walls B
W(B), ceiling B
C(B), and corridor B
G(B), and the assigned ranks in B group for: Floor RB
F(B), walls RB
W(B), ceiling RB
C(B), and corridor RB
G(B). In
Table 6, the symbols are as follows: The mean brightness perception for: Floor B
F(C), walls B
W(C), ceiling B
C(C), and corridor B
G(C), and the assigned ranks in C group for: Floor RB
F(C), walls RB
W(C), ceiling RB
C(C), and corridor RB
G(C).
For seven situations, there is the convergence of sequence of brightness perception assessment in groups B and C. The discrepancies concern situations 3, 8, and 9.
In situation 3, in group C it was assessed that the entire corridor was characterized by the highest brightness (5.10), while in group B the highest brightness was assigned to the walls (4.90). It should be noted that for this situation the differences between the brightness perception between the planes and the corridor were low and amounted to a maximum of 0.6 in every group.
In situation 8, in group C it was assessed that the walls were characterized by the lowest brightness (4.40), and in group B it was estimated that the floor was characterized by the lowest brightness (4.20). However, it should be noted that the difference between the perception of the brightness of the walls and the floor was only 0.1 in each group.
In situation 9, in group C it was assessed that the entire corridor was characterized by the highest brightness (5.40) while in group B the highest brightness (5.80) was assigned to the walls. Again, it should be noted that for this situation the differences between the brightness perception for the walls, ceiling and the entire corridor were low and amounted to 0.3 in group B and 0.2 in group C maximum.
3.5. Comparison of Uniformity Perception of Computer Image of Illuminated Corridor for Each Solution Separately, between Groups
The convergence of the uniformity perception between the groups was also assessed. For this purpose, individually for each solution from 1 to 10, the mean plane and corridor uniformity perception levels resulting from the surveys in groups B and C were ranked in descending order. The ranks, from 1—the highest uniformity level to 4—the lowest uniformity level, were assigned to the mean uniformity levels for each solution. The survey results of the mean uniformity perception levels and the assigned ranks are shown in
Table 7 for group B and in
Table 8 for group C. In
Table 7, the symbols are as follows: The mean uniformity perception for: Floor U
F(B), walls U
W(B), ceiling U
C(B), and corridor U
G(B), and the assigned ranks in group B for: Floor RU
F(B), walls RU
W(B), ceiling RU
C(B), and corridor RU
G(B). In
Table 8, the symbols are as follows: The mean uniformity perception for: Floor U
F(C), walls U
W(C), ceiling U
C(C), and corridor U
G(C), and the assigned ranks C group for: Floor RU
F(C), walls RU
W(C), ceiling RU
C(C), and corridor RU
G(C).
For six situations, there is the convergence of sequence of the uniformity perception assessment in groups B and C. The discrepancies concern situations 1, 5, 7, and 10.
In situation 1, in group C the entire corridor uniformity was rated higher (2.90), and in group B the wall uniformity was rated higher (3.10). It should be noted that the differences between the impressions on uniformity of the walls and entire corridor were low and amounted to 0.5 in group B and 0.1 in group C.
In situation 5, in group C the lowest perceived uniformity (5.40) was assigned to the ceiling while in group B the lowest perceived uniformity (4.20) was assigned to the walls. In group B it was assessed that the perceived ceiling uniformity was high (in relation to the floor and the entire interior). The differences in these impressions can be seen in the interpretation of the ceiling uniformity by the respondents. The assessment made by group B that the ceiling uniformity is high (higher of 1.30 than the wall uniformity) can suggest that the ceiling illumination itself was assessed without clearly bright luminaires. However, in group C, the ceiling and wall uniformity was assessed in a similar way, which may suggest that while evaluating the ceiling uniformity, the bright contrasting luminaires were taken into account.
In situation 7, in group C the highest perceived uniformity (6.10) was assigned to the floor while in group B the highest perceived uniformity (6.30) was assigned to the walls. It is difficult to unequivocally settle the discrepancy of these assessments. However, it should be noted that in each group the perceived uniformity of the illuminated floor and walls was rated high. Additionally, the differences between the impressions on the floor and wall uniformity were not high and amounted to 0.6 for group B and 0.5 for group C.
In situation 10, in group C the lowest perceived uniformity (5.10) was assigned to the ceiling while in group B the lowest perceived uniformity (4.20) was assigned to the entire corridor, but the low one (4.80) was also assigned to the walls. In this situation, it is difficult to unequivocally settle the discrepancy of these assessments.


