Article

Decomposition Characteristics of SF6 under Arc Discharge and the Effects of Trace H2O, O2, and PTFE Vapour on Its By-Products

1
SGCC Shaanxi Electric Power Research Institute, Xi’an 710049, China
2
State Key Laboratory of Electrical Insulation and Power Equipment, Xi’an Jiaotong University, Xi’an 710049, China
*
Author to whom correspondence should be addressed.
Energies 2021, 14(2), 414; https://doi.org/10.3390/en14020414
Submission received: 21 December 2020 / Revised: 6 January 2021 / Accepted: 11 January 2021 / Published: 13 January 2021

Abstract

:
The research on decomposition characteristics of SF6 and its by-products have great significance to the operation, maintenance, condition assessment and fault diagnosis of power equipment. In this paper, the particle composition models of SF6, SF6/polytetrafluoroethylene (PTFE), SF6/PTFE/O2, SF6/PTFE/H2O, and SF6/PTFE/O2/H2O were established by using Gibbs free energy minimization method, and the effects of trace H2O and O2 impurities and PTFE vapour on SF6 by-products were studied by the models. In order to verify the correctness of the simulation results, a series of breaking experiments were carried out on a 40.5 kV SF6 circuit breaker, and a gas chromatograph was used to detect and analyse the SF6 by-products. It was found that when PTFE vapour is involved in the arc plasma, the main by-product after arc quenching is CF4, and the molar fractions of C2F6 and C3F8 are very low. When O2 is involved, the main by-products are SOF2, SO2 and SO2F2, and a small amount of CO and CO2 was also produced. When H2O is involved, the main by-products in simulation are SOF2, SO2 and HF, and a small amount of SO2, CO2, CO, SO2F2 and H2 was also produced. The experimental results are in good agreement with the above results.

1. Introduction

SF6 is a greenhouse gas. It is one of the six gases included in the Kyoto Protocol aimed at reducing greenhouse gas emissions. The global warming potential (GWP) of SF6 is 23,900 times greater than CO2 according to the 2013 report of Intergovernmental Panel on Climate Change (IPCC), and it has a lifetime in the atmosphere of 3200 years. However, SF6 has excellent insulation performance, arc quenching performance, and molecular stability. It is widely used in high voltage circuit breakers [1,2]. The high voltage SF6 circuit breaker will inevitably produce a high temperature and high energy arc in the process of breaking currents. It will cause SF6 to decompose and form SF6 arc plasma. Many sulfur fluorides such as SF5, SF4, SF3, SF2, SF, S, and F will be produced in the arc plasma. As the arc extinguishes, the arc temperature will gradually decrease, and these species will recombine into SF6 molecules [3,4]. However, there are trace H2O and O2 impurities in the circuit breaker, and the nozzle made by polytetrafluoroethylene (PTFE) material will be ablated by arc to produce trace PTFE vapour during the breaking process. The H2O, O2, and PTFE impurities will participate in the reaction of SF6 arc plasma to form various by-products such as SOF2, SO2, SO2F2, CF4, C2F6, C3F8, CO2, CO, and HF [5,6].
On the one hand, some by-products such as SOF2 and HF are corrosive and toxic, thus posing considerable threat to the safe and stable operation of equipment and health of the operation and maintenance personnel [7]. On the other hand, there is a close relationship between some by-products and the discharge faults in the equipment, so the decomposition component analysis (DCA) technology can be used in fault detection and condition assessment of SF6 power equipment [8,9]. Therefore, the decomposition characteristics of SF6 under arc discharge and the effects of trace H2O, O2, and PTFE vapour on its by-products have attracted extensive attention.
Many scholars have carried out a lot of research on this problem and achieved rich results. In terms of the experiments, Boudene et al. studied the decomposition products in detail under the condition of voltage of 60 kV, a current of 4.5 kA and arcing time 40–80 ms. They found that the gas production rate of SOF2 and SO2F2 and arc energy is almost linear [10]. Belmadani and Casanvas examined the SF6 byproducts of power arc discharges using gas chromatography [11,12]. The maximum arc current reached 8.3 kA, and the primary byproducts were SOF2, SO2F2, SO2, and CF4. The concentrations of these byproducts decreased in the following order: SOF2+SO2 > CF4 > SO2F2. Our previous work used a circuit breaker to study the influence of trace H2O and O2 on SF6 by-products [13]. We found that the increase of the concentration of H2O and O2 will increase the production of SOF2+SO2, and the concentration of CF4 is hardly affected by the concentration of H2O and O2. Andrzej pelc studied the generation of negative ions from SF6 gas by means of hot surface ionization. He found eight ion species: SF5, F, SF6, SF4, SF3, SF2, SF and F2, with ion current intensities ratios of 1000:200:100:10:5:0.5:0.5:0.05. He also found the optimal temperatures at which the maximum of the ion current intensity is observed were estimated in the 1830–2000 ± 10 °C range [14].
In terms of the simulations, Brand et al. studied the particle compositions of SF6 arc plasma at standard atmospheric pressure [15]. Chervy and Gleizes considered the influence of copper vapour on the particle compositions and proposed a particle composition model of an SF6/Cu mixture [16]. Coufal studied the effect of PTFE ablation on particle compositions, and the Gibbs free energy minimization method was first used in the calculation [17]. Wang et al. studied the arc plasma particle compositions of an SF6/CF4 gas mixture [18]. Up to now, there are few reports about SF6/PTFE/H2O, SF6/PTFE/O2, and SF6/PTFE/H2O/O2 gas mixture arc plasma. The arc plasma model cannot be used to study the comprehensive effects of trace H2O, O2, and PTFE vapour on SF6 by-products. It seriously limits the reliability of the calculation results.
In order to solve this problem, the arc plasma models of SF6, SF6/PTFE, SF6/PTFE/H2O, and SF6/PTFE/O2 are established by using the Gibbs free energy minimization method in this paper. The effects of trace H2O, O2, and PTFE vapour on SF6 by-products was studied by these models. On this basis, a comprehensive model of SF6/PTFE/H2O/O2 gas mixture was finally established. The research on the particle composition of SF6 arc plasma is improved. In order to verify the correctness of the calculation results, a series of breaking experiments were carried out on a 40.5 kV SF6 circuit breaker, and a gas chromatograph was used to detect and analyse the SF6 by-products. It was found that the simulation results are in good agreement with the experimental results.

2. Methods

Under the assumption of local thermodynamic equilibrium (LTE), the physical parameters of the system are only functions of temperature and pressure. The minimization of Gibbs free energy means that the Gibbs function of the equilibrium state is the smallest when the temperature and pressure are constant [17]. In this paper, the particle composition of SF6 arc plasma is studied by this method. In pure SF6 arc plasma, 12 kinds of particles such as SF6, SF5, SF4, SF3, SF2, SF, S, S2, F, F2, S2F10, and FSSF were considered. In SF6/PTFE arc plasma, 12 kinds of particles such as C3F8, C2F6, C2F5, C2F4, C2F3, C2F2, C2F, C, CF, CF2, CF3, and CF4 were added. In SF6/PTFE/O2 arc plasma, 10 kinds of particles such as O, O2, SOF2, SO2F2, SO, SO2, CO2, CO, COF, and COF2 were added. In SF6/PTFE/H2O arc plasma, 9 kinds of particles such as H2O, OH, H, HF, H2, CH4, CH3, CH2, and CH were added. In SF6/PTFE/H2O/O2 arc plasma, all the 43 particles mentioned above were considered. The thermodynamic data of all particles, such as standard enthalpy of formation, entropy, and specific heat at constant pressure can be obtained in the JANAF database [19]. All calculations were completed in the Chemkin software.
In order to verify the correctness of the calculation results, a series of breaking experiments were carried out on a 40.5 kV SF6 circuit breaker. The rated voltage was 40.5 kV, the rated current was 2.5 kA, the rated frequency was 50 Hz, the rated air pressure was 0.6 MPa, the rated short circuit breaking current was 31.5 KA, and the volume of single-phase air chamber was 30.0 L. Figure 1 shows the experimental arrangement. Before the experiment, SF6 gases with different concentrations of H2O and O2 were filled into three chambers respectively. Sinusoidal current was generated by an L-C circuit with pre-charged capacitor banks. Arc current was about 10 kA. Arcing time with one current half-wave was 6.5 to 10.0 ms due to the mechanical dispersion of the actuator. Arc voltage and arc current were measured by a high voltage probe and Rogowski coil respectively, and recorded by oscilloscope. After each breaking experiment, the SF6 by-products in the chamber were analysed by gas chromatograph.
This gas chromatograph was equipped with a hydrogen ionisation detector (FID) and a pulsed flame photometric detector (PFPD) to detect SF6 by-products. The carrier gas was He with purity over 99.99%, the output pressure was 0.5–0.6 MPa, the injection temperature was 150 °C, the injection volume was 250 μL, the split ratio was 20:1, the column temperature was 50 °C for 5 min, and 10 °C/min is raised to 200 °C for 10 min. Figure 2 shows the test result of gas chromatograph. The detected gases in channel A were H2, O2, N2, CO, CH4, CO2, CF4, and C2F6. The detected gases in channel B were SF6, SOF2, SO2F2, SO2, COS, C3F8, and CS2. Trace H2O content was measured using a SF6 mirror dew point instrument. This instrument is often used in the field detection of trace H2O content in SF6 circuit breaker, with the advantages of fast response and high precision.
The specific experimental settings are shown in Table 1 and Table 2. In order to research the effect of trace H2O on SF6 by-products after the arc was extinguished and verify the correctness of the simulation results, the three gas chambers of the circuit breaker were filled with SF6 gases with different H2O concentration. The concentration of H2O before the breaking experiment in A, B, and C chambers were 106 ppm, 748 ppm, and 1131 ppm, respectively. The breaking current was 10 kA and the times of breaking is 5. The setting of the breaking experiment with different O2 concentration was similar to that of H2O.

3. Results and Discussion

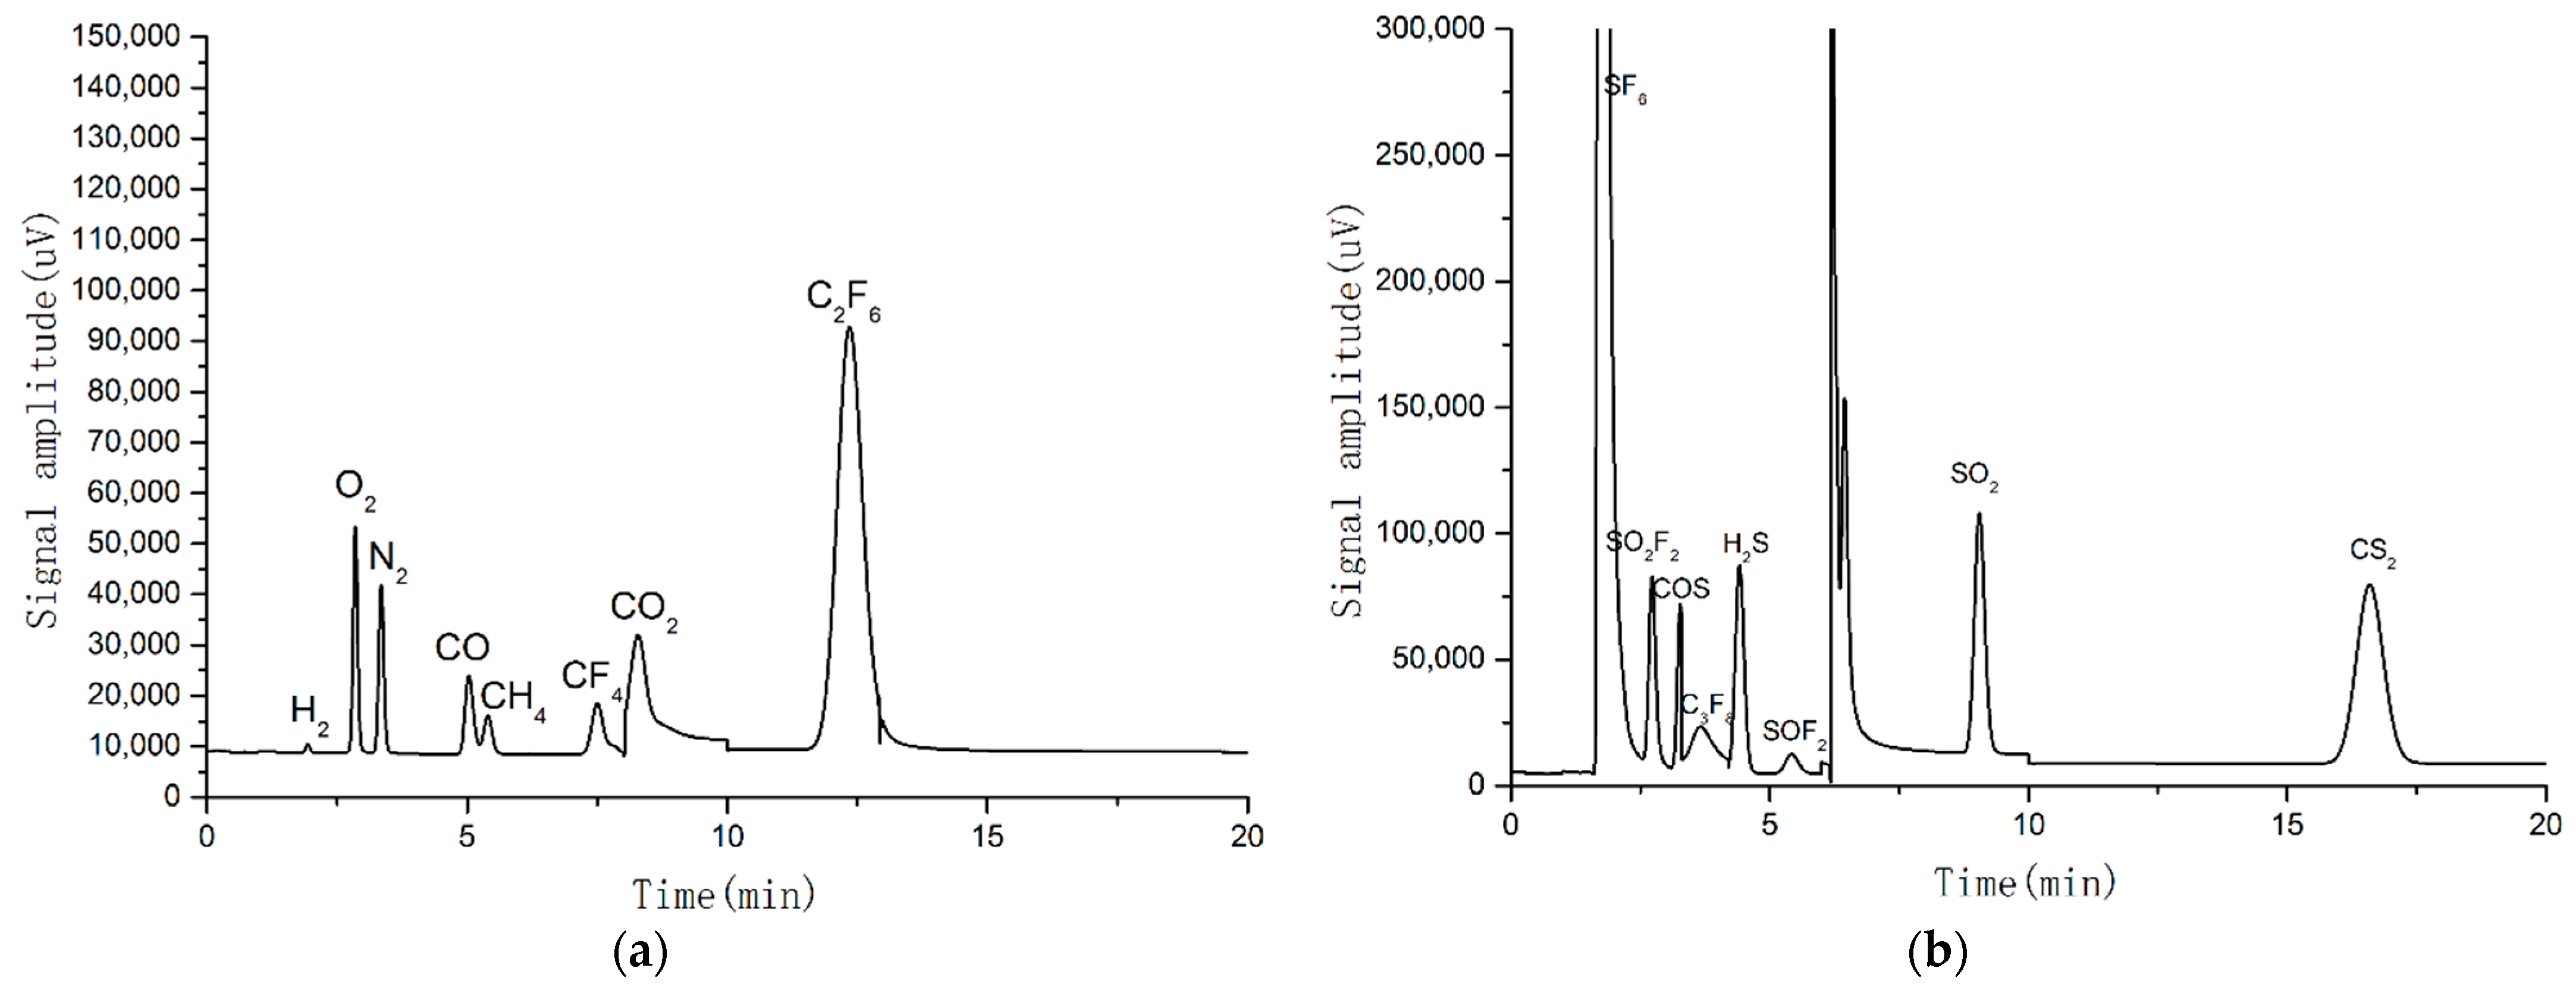
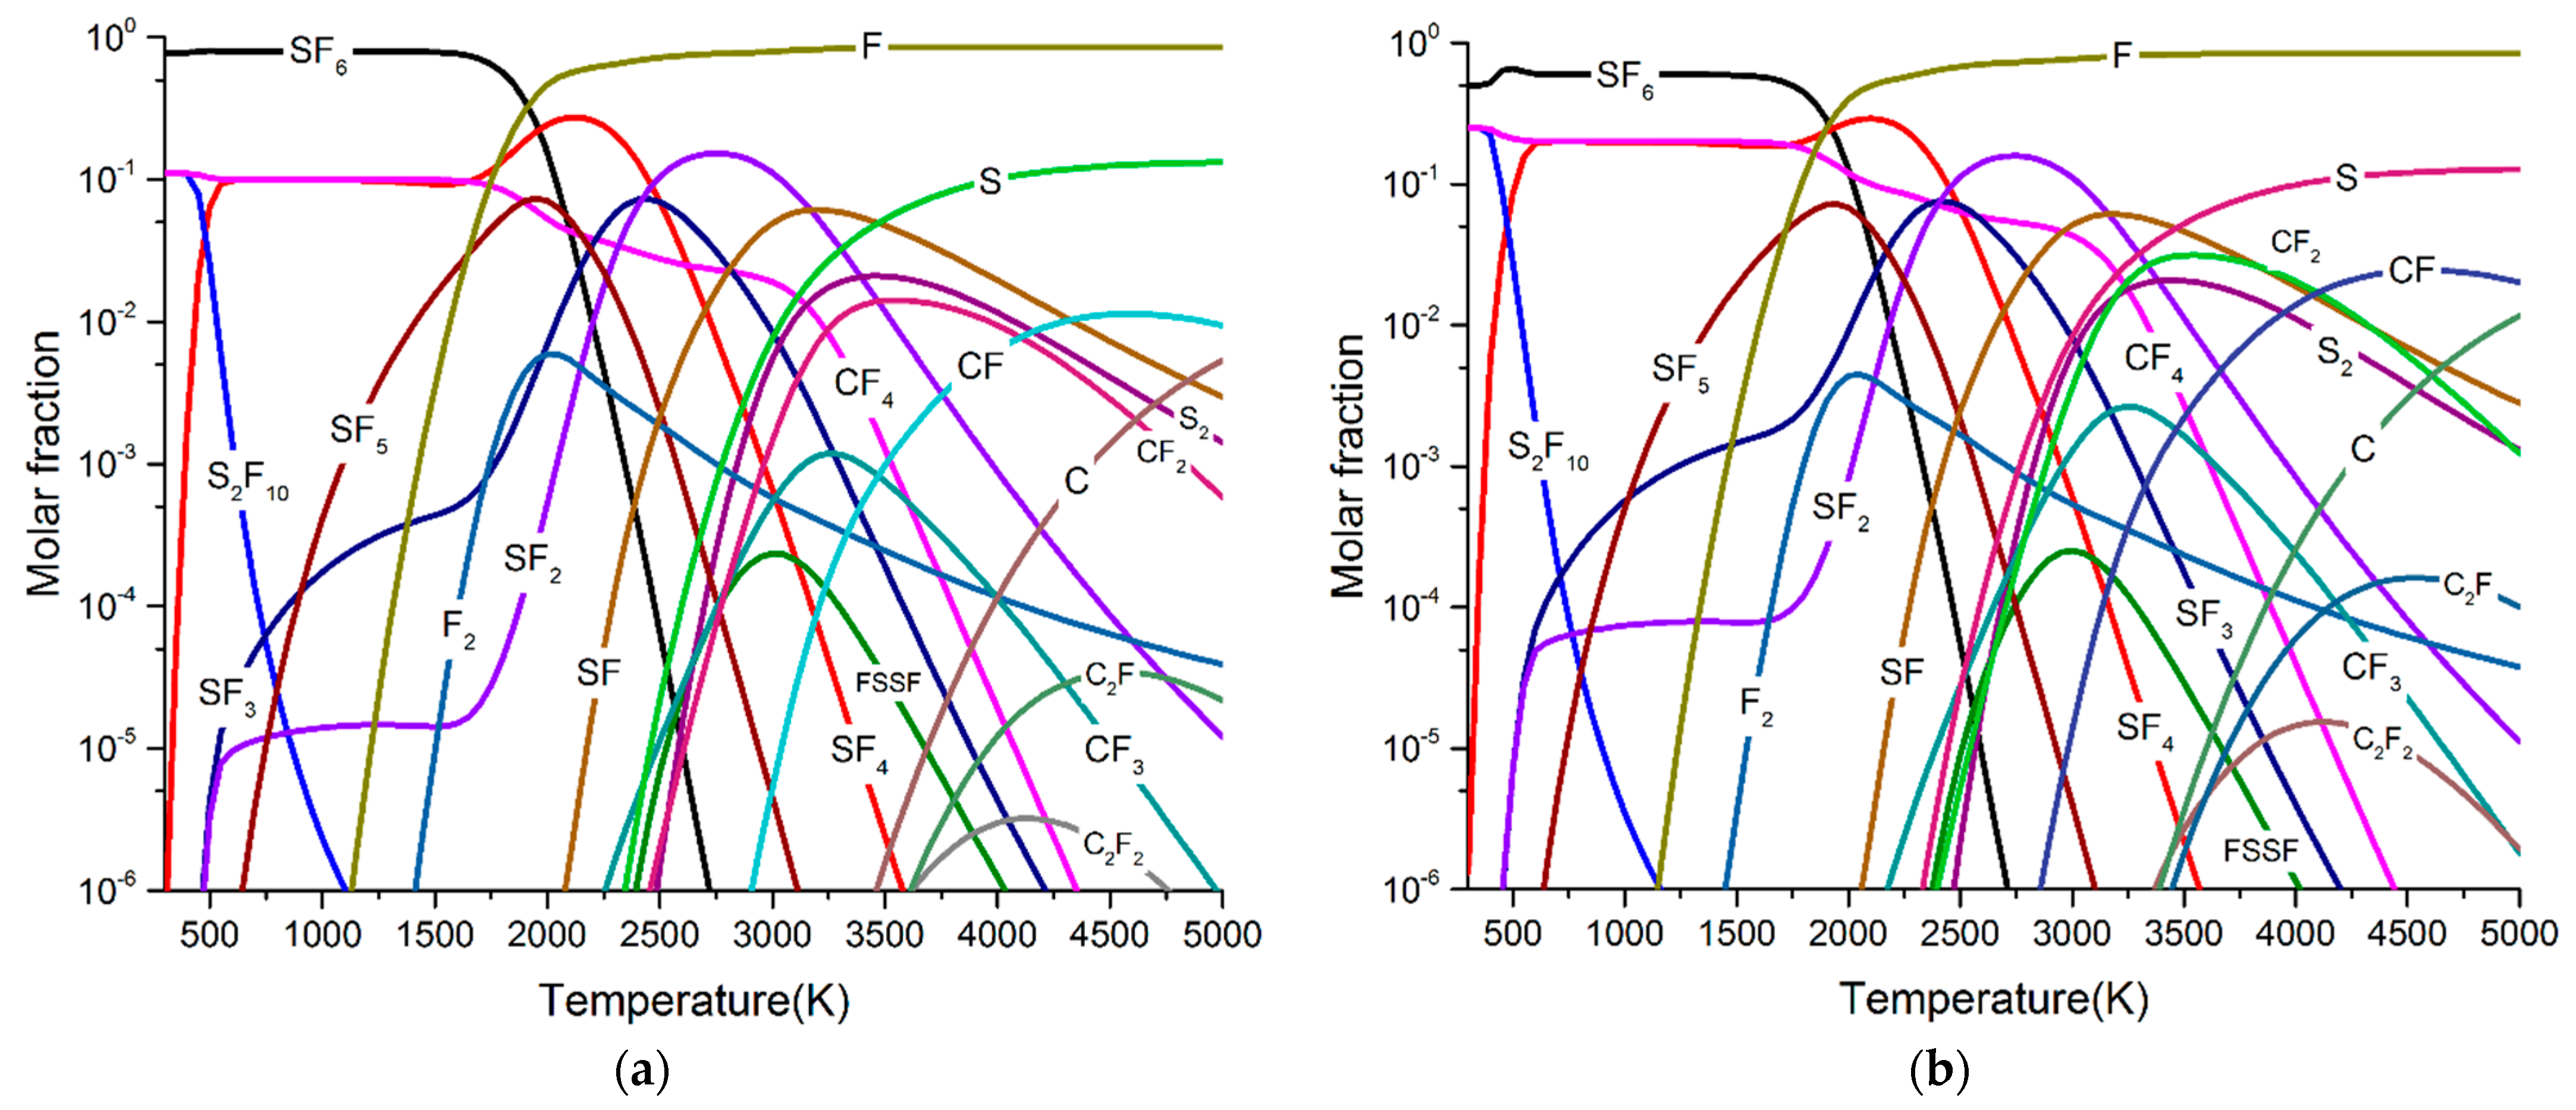
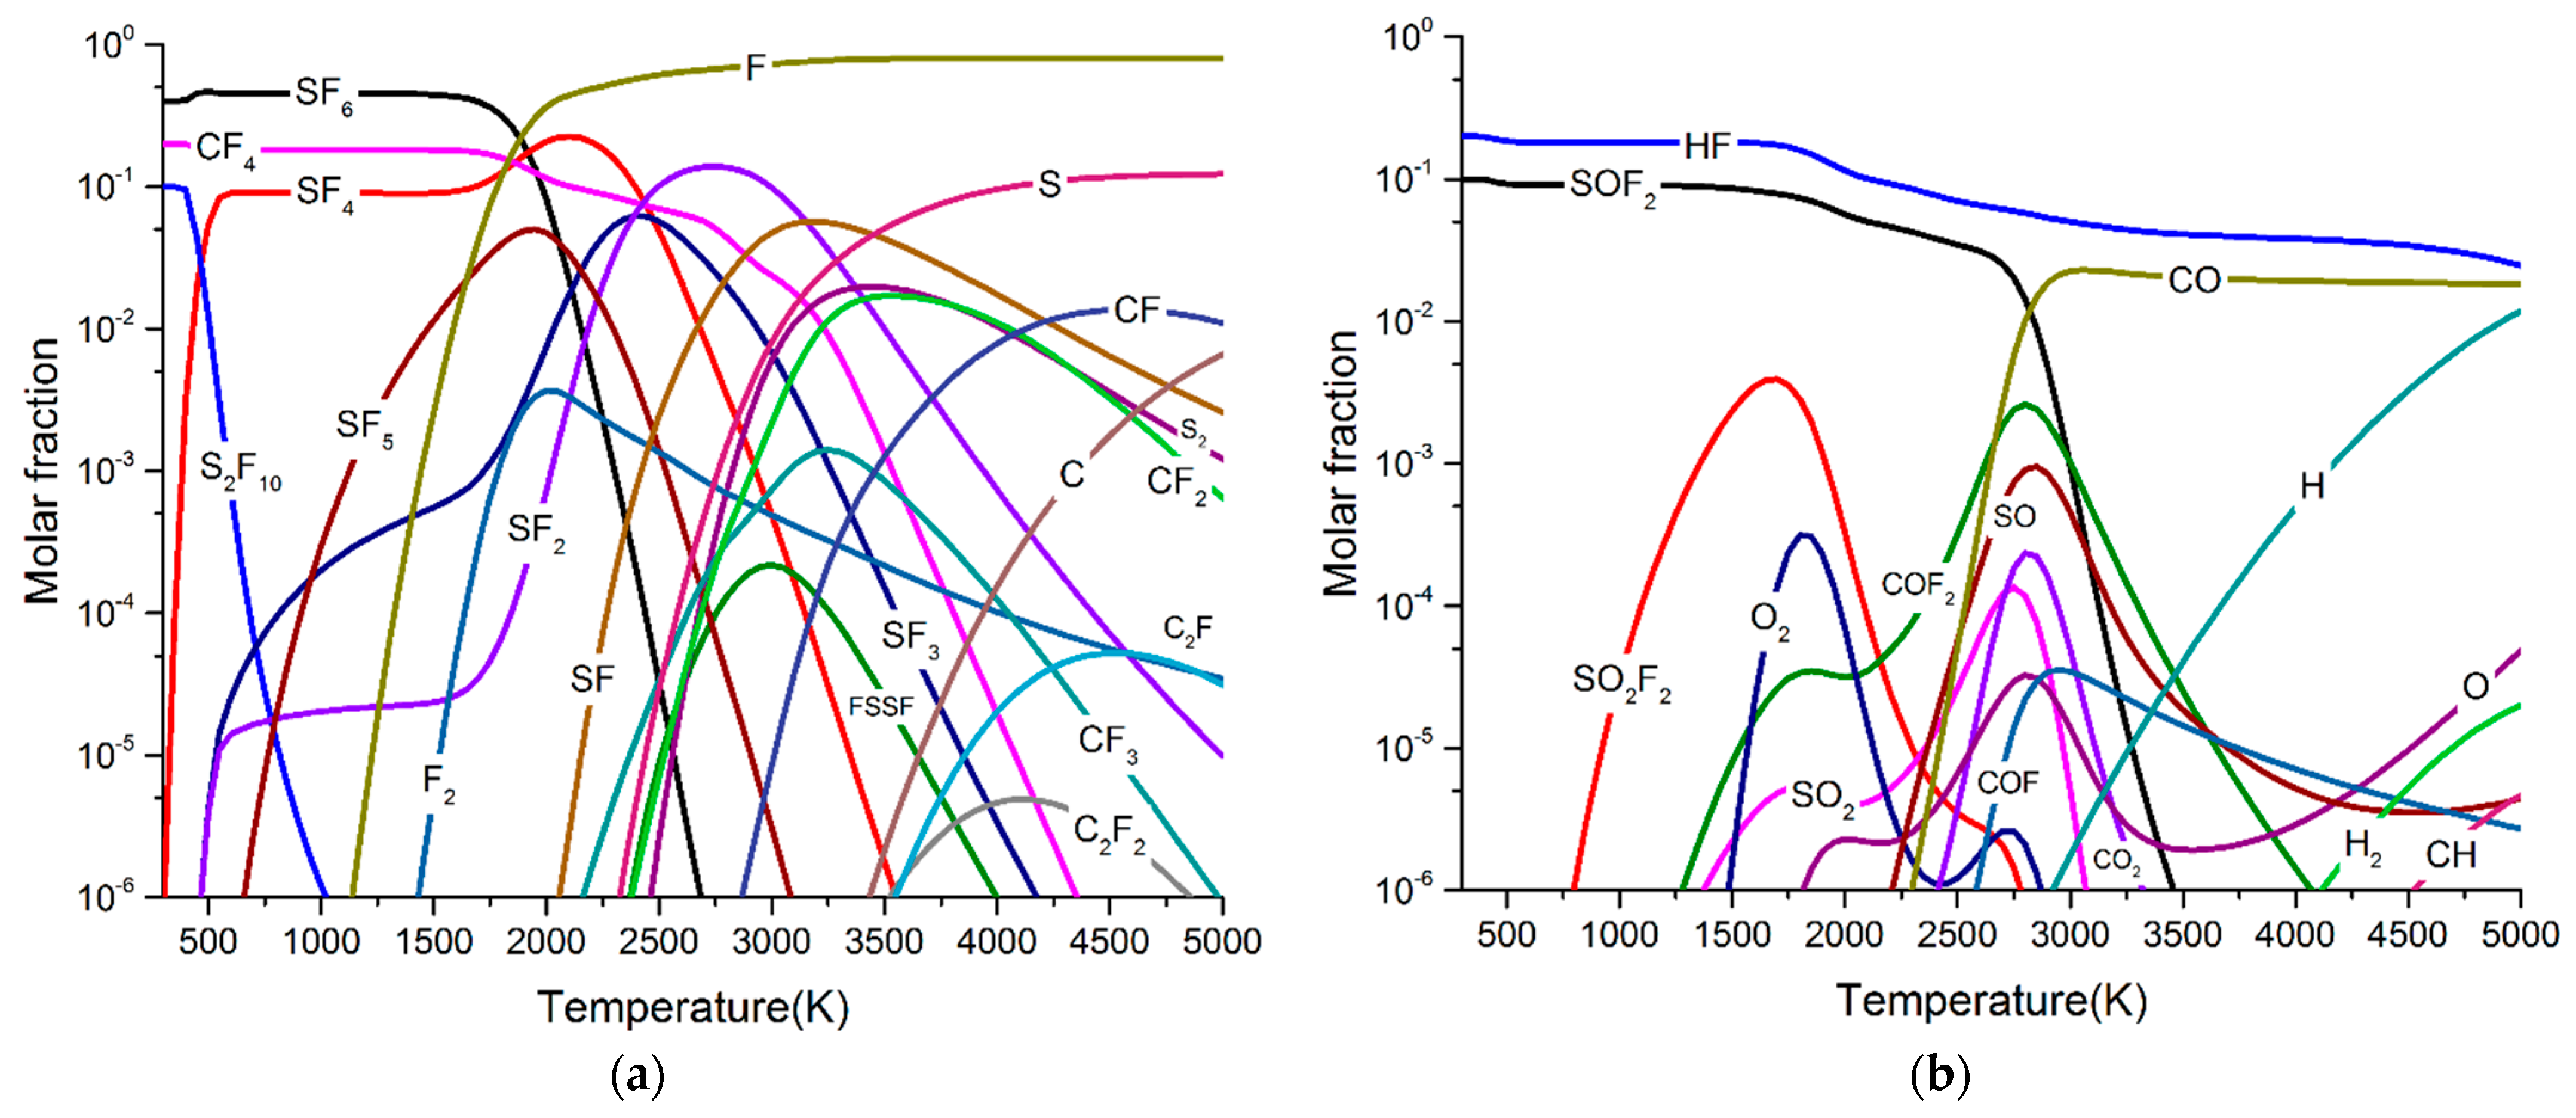
3.1. Particle Composition of SF6 and SF6/PTFE

Figure 3 shows the particle composition of pure SF6 arc plasma at 0.6 MPa. It can be found that SF6 molecules begin to decompose at about 1000 K and forms SF5, SF4 and F atoms first. With the increase of arc temperature, SF3, SF2, and SF begin to form. It should be noted that the temperature required for the formation of SF5, SF4, SF3, SF2, and SF increases step-by-step, and the maximum mole fractions of SF4 and SF2 is significantly greater than that of SF5, SF3, and SF. The main reason is that the decomposition process of SF6 is a process of gradually breaking the S-F bond to form a lower-level low fluorine sulfide, and the S-F bond energy of SF4 and SF2 is higher than that of SF5, SF3, and SF. When the arc temperature is greater than 3000 K, the mole fractions of all sulfur fluorides begin to decrease, and gradually decompose into S and F atoms. It should be noted that the arc temperature decreases gradually during the arc decay process. When the arc temperature decreases below 1000 K, all sulfur fluorides and atoms recombine into SF6. The results of this part show good agreement with previous work [20], which proves the reliability of our calculation results.
Figure 4 shows the particle composition of SF6/PTFE arc plasma at 0.6 MPa. Compared with pure SF6 arc plasma, CF4, CF3, CF2, S2F10, etc. appear in particle composition. CF4 and CF3 are formed by the combination of CF2 radicals produced by the decomposition of PTFE and the F atom produced by SF6 decomposition. The formation of CF4 will lead to the lack of F atoms in the arc plasma, so some SF5 radicals cannot obtain the F atoms to form SF6, and these SF5 radicals will combine with each other to form S2F10. It should be noted that as the arc temperature gradually decreases to room temperature, almost all PTFE vapour is converted into CF4, and C2F6 and C3F8 are hardly generated. The molar fraction of C2F6 and C3F8 are both less than 10−6.
Figure 5 shows the change of CF4, C2F6, and C3F8 concentrations with the breaking times. The breaking current is about 10 kA. It can be found that the concentration of CF4 is much higher than that of C2F6 and C3F8, and shows an obvious increasing trend with the breaking times, while C2F6 and C3F8 have no obvious change. After five breaking experiments, the concentration of CF4 reached 289.6 ppm, while the concentration of C2F6 and C3F8 was only 2.1 ppm and 0.2 ppm, respectively. It can be concluded that CF4 is the main by-product produced by the ablation of PTFE, and the concentrations of C2F6 and C3F8 are very low. The experimental results are in good agreement with the simulation results.

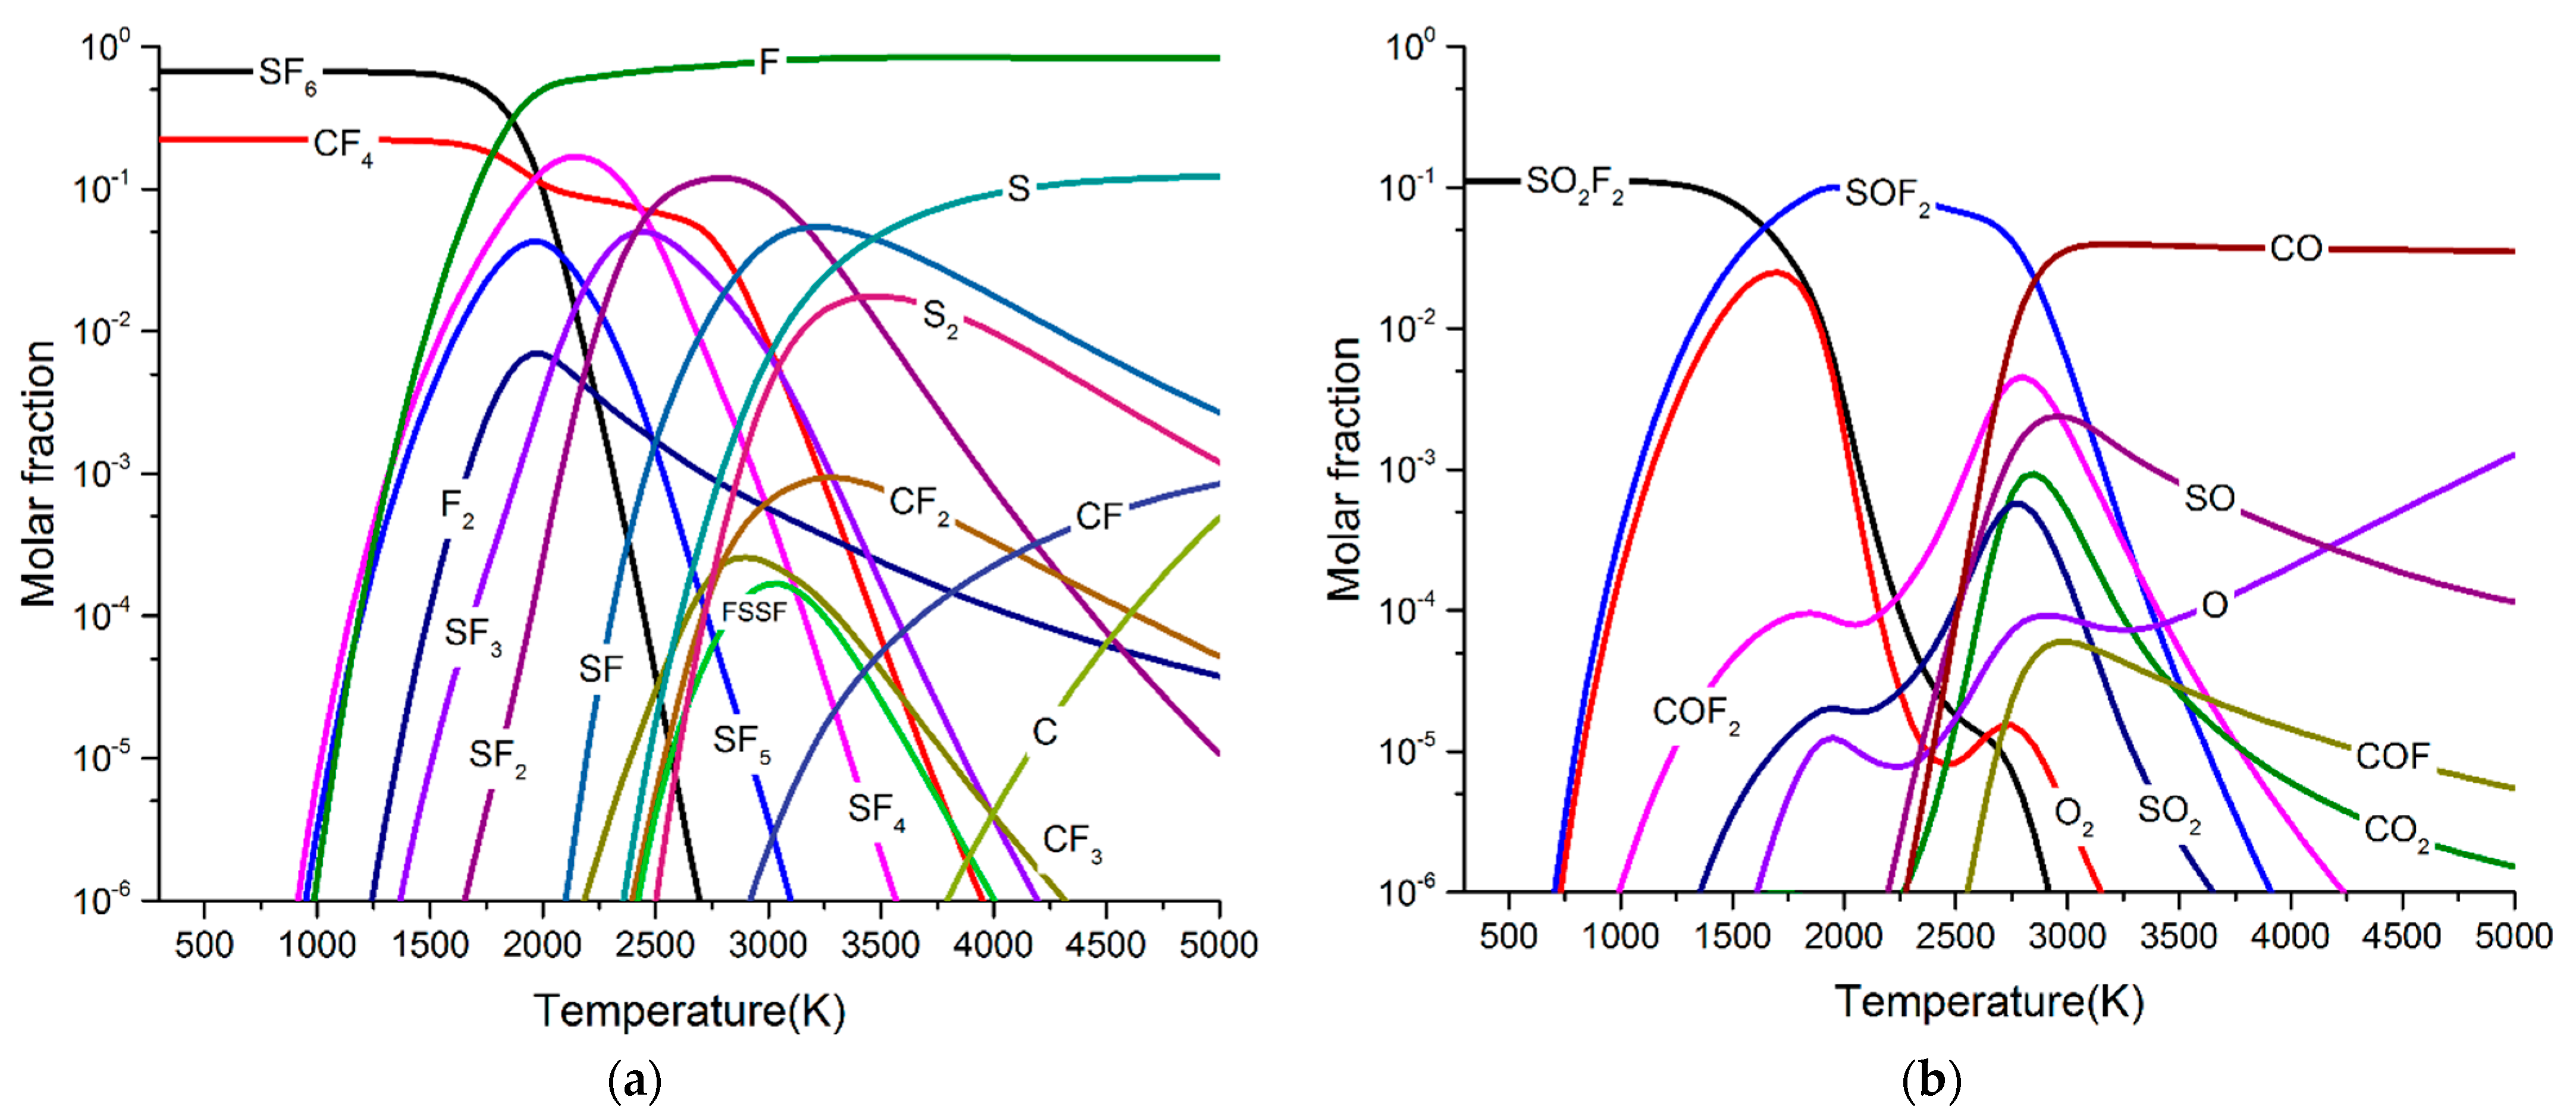
3.2. Particle Composition of SF6 and SF6/PTFE/O2

Figure 6 and Figure 7 show the particle composition of SF6/PTFE/O2 arc plasma with different O2 concentrations. Compared with SF6/PTFE arc plasma, a large number of particles containing O element such as SOF2, SO2F2, COF2, SO2, CO, and CO2 appear in arc plasma. CO appears in the temperature range of 2000 K–5000 K. CO2 and SO2 appear in the temperature range of >1500 K. COF2 appears in the temperature range of 1000 K–4500 K. As the arc temperature gradually decreases to room temperature, the molar fraction of these species will be reduced to <10−6. SOF2 and SO2F2 can appear in arc plasma when the temperature is less than 1000 K, and their molar fraction is much higher than that of CO2, SO2 and COF2. Therefore, it can be concluded that the participation of a small amount of O2 will promote the formation of SOF2, SO2F2, COF2, SO2, CO, and CO2. After the arc is extinguished, the concentration of SOF2 and SO2F2 will be higher than that of COF2, SO2, CO, and CO2.
Figure 8 shows the changes of SOF2, SO2, SO2F2, and CO concentrations with the breaking times under different O2 concentration. As shown in Figure 8a, the concentration of SOF2 increases with the breaking times. When the O2 concentrations are 59 ppm, 748 ppm and 1130 ppm, respectively, the concentrations of SOF2 can reach 761 ppm, 983 ppm and 1121 ppm, respectively, after five breaking experiments. This indicates that the increase of O2 concentration can promote the formation of SOF2. As shown in Figure 8b, the concentration of SO2 increases with the breaking times. The concentrations of SO2 were 3.1 ppm, 9.0 ppm and 9.7 ppm, respectively, after five breaking experiments. As shown in Figure 8c, the concentration of SO2F2 increases with the breaking times. After five breaking experiments, the concentrations of SO2F2 are 0.4 ppm, 7.1 ppm and 9.8 ppm, respectively. This indicates that the increase of O2 concentration can significantly promote the formation of SO2F2. Figure 8d shows the change of CO with the breaking times. It can be seen that the concentration of CO is very low, and the highest is only 1.0 ppm. Due to the limitation of experimental conditions and the accuracy of testing equipment, when O2 are 736 ppm and 1202 ppm, CO has no significant regularity. When O2 is 59 ppm, the concentration of CO is obviously lower than the former two cases. This indicates that the increase of O2 concentration can also promote the formation of CO, but this phenomenon is not obvious.
In comparison, the concentration of SOF2 is much higher than that of SO2, SO2F2 and CO. After five breaking experiments, the concentration of SOF2 can reach 1000 ppm, and the concentrations of SO2 and SO2F2 are both about 10 ppm, while the concentration of CO is lower than 2 ppm. This phenomenon indicates that when O2 is involved in the arc plasma reaction, SOF2 will be the main by-product after the arc is extinguished, and the concentrations of SO2 and SO2F2 will also increase significantly.

3.3. Particle Composition of SF6 and SF6/PTFE/H2O

Figure 9 and Figure 10 show the particle composition of SF6/PTFE/H2O arc plasma with different H2O concentrations. Compared with SF6/PTFE/O2 arc plasma, some particles containing H such as HF, H2, CH, and H appear in arc plasma, and the molar fractions of SOF2 and SO2F2 were significantly affected. H2 appears in the temperature range of 3500 K–5000 K. H appears in the temperature range of 2500 K–5000 K. HF can appear in the whole temperature range and its molar fraction is always greater than 10−1. SOF2 can appear in the temperature range of 300 K–5000 K, and its molar fraction increases with the decrease of arc temperature. When the temperature decreases to room temperature, the molar fraction of SOF2 can reach 10−1. SO2F2 can appear in the temperature range of 300 K–3000 K, and its molar fraction relatively low. It can be concluded that the participation of a small amount of H2O will promote the formation of HF, H2, SOF2, SO2F2, COF2, SO2, CO, and CO2. After the arc is extinguished, the concentration of HF and SOF2 will be significantly higher than that of SO2F2, COF2, SO2, CO, and CO2.
Figure 11 shows the changes of SOF2, SO2, CO2, and CO concentrations with the breaking times under different H2O concentration. It can be found that the concentration of SOF2, SO2, CO2 and CO increase with the breaking times. The increase of H2O concentration can promote the production of SOF2, SO2, CO2, and CO. For example, when the H2O concentrations are 106 ppm, 748 ppm and 1130 ppm, respectively, the concentrations of SOF2 are 1097 ppm, 1130 ppm and 1253 ppm, respectively, after five breaking experiments. This conclusion is consistent with the calculation results of particle composition of SF6/PTFE/H2O arc plasma.
In comparison, the concentration of SOF2 is much higher than that of SO2, CO2 and CO. After five breaking experiments, the concentration of SOF2 can reach 1000 ppm, while the concentration of SO2 and CO2 is lower than 20 ppm, and the concentration of CO is lower than 2 ppm. This phenomenon indicates that when H2O is involved in the arc plasma reaction, SOF2 will be the main by-product after the arc is extinguished. This conclusion also shows good agreement with the calculation result.
Contrary to the simulation results, SO2F2 and HF are hardly detected in this experiment. We believe the main reason is that H2O does not promote the formation of SO2F2 obviously, and HF can react with the metal materials and solid insulation materials in the circuit breaker quickly, which makes it hardly detected. The particle composition model of arc plasma needs to be further improved.
It can be found by comparing the breaking experiments under different O2 and H2O concentrations that both H2O and O2 can promote the formation of SOF2. Under similar experimental conditions, the promotion effect of H2O on the formation of SOF2 is more obvious than that of O2. For example, when the concentration of H2O is 748 ppm, the concentration of SOF2 can reach 1130 ppm after five breaking experiments, with an average of 226 ppm each time. When the concentration of O2 is 736 ppm, the concentration of SOF2 is 983 ppm after five breaking experiments, with an average of 197 ppm each time. It also can be found that both H2O and O2 can promote the formation of SO2 and CO, but the concentrations are relatively low. O2 can significantly promote the formation of SO2F2, while H2O has no obvious effect on SO2F2.

3.4. Particle Composition of SF6 and SF6/PTFE/O2/H2O

Figure 12 shows the particle composition of 60% SF6 + 20% CF2 + 10% H2O + 10% O2 arc plasma at 0.6 MPa. A total of 43 kinds of particles are considered in this model. The molar fractions of 33 kinds of particles are more than 10−6. The SF6 by-products detected after the breaking experiment all appeared in this model, and the molar fractions of these species are relatively high. CO appears in the temperature range of 2000 K–5000 K, and the maximum molar fraction is 4.6%. CO2 and SO2 appear in the temperature range of 1250 K–5000 K, and the maximum molar fraction is 0.27% and 0.19%, respectively. CF4 appears in the temperature range of 300 K–3500 K, and the maximum molar fraction is 20.0%. SOF2 appears in the temperature range of 500 K–4500 K, and the maximum molar fraction is 13.8%. SO2F2 appears in the temperature range of 300 K–2750 K, and the maximum molar fraction is 15.0%. HF appears in the whole temperature range, and the maximum molar fraction is 20.2%. It should be noted that SOF2, SO2F2, CF4, HF, O2, and SF6 are the main particles when the arc temperature drops below 1000 K.

4. Conclusions

This paper established the arc plasma models of SF6 (12 particles are considered), SF6/PTFE (24 particles are considered), SF6/PTFE/O2 (34 particles are considered), SF6/PTFE/H2O (43 particles are considered), and SF6/PTFE/O2/H2O (43 particles are considered) by using the Gibbs free energy minimization method. The effects of trace H2O and O2 impurities and PTFE vapour on the SF6 by-products were studied. In order to verify the correctness of the simulation results, a series of breaking experiments were carried out on a 40.5 kV SF6 circuit breaker, and a gas chromatograph was used to detect and analyse the SF6 by-products. It was found that the experimental results are in good agreement with the simulation results. The primary conclusions are summarized below:
(1)
SF6 molecules began to decompose at about 1000 K and form SF5, SF4, SF3, SF2, SF, S, and F with the increase of arc temperature. The maximum molar fractions of SF4 and SF2 were higher than SF5, SF3, and SF. As the arc temperature gradually decreases to room temperature, all low fluorine sulphides recombine into SF6.
(2)
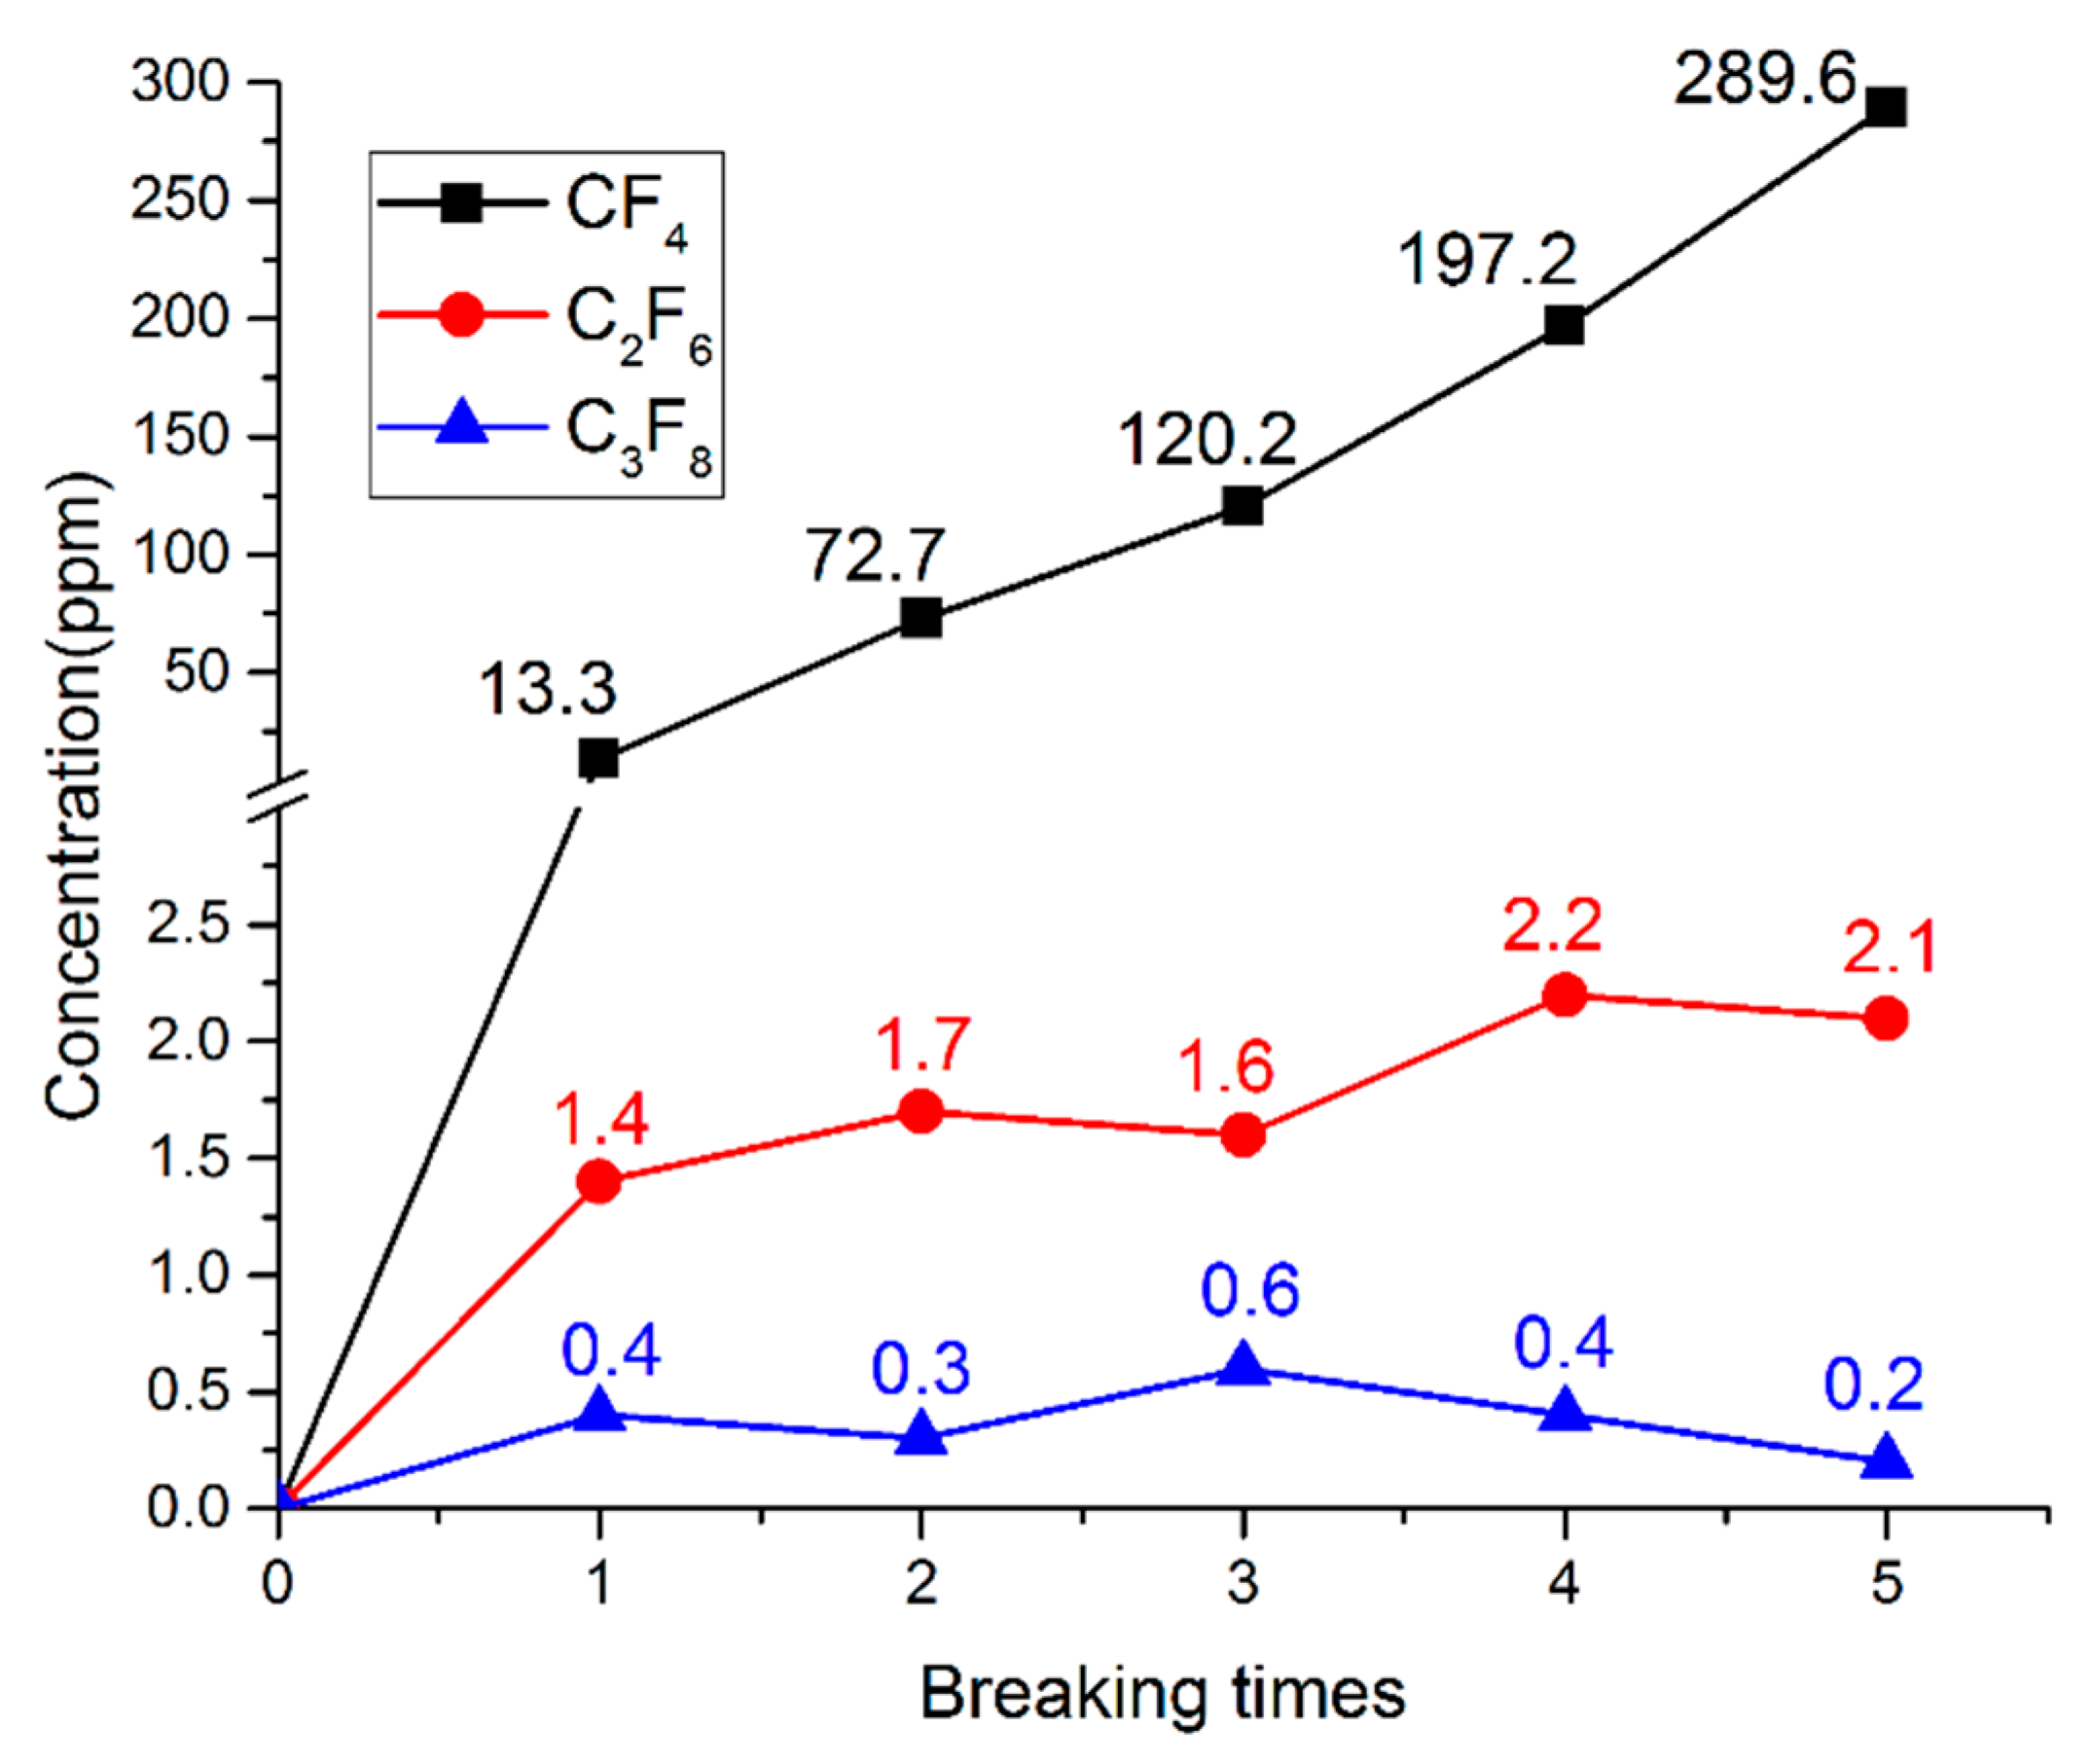
When PTFE vapour was involved in the arc plasma, the main by-product after arc quenching was CF4, and the molar fractions of C2F6 and C3F8 were very low. After five breaking experiments, the concentration of CF4 can reach 289.6 ppm, while the concentration of C2F6 and C3F8 was only 2.1 ppm and 0.2 ppm, respectively. The simulation results were in good agreement with the experimental results.
(3)
When O2 was involved in the arc plasma, the main by-products were SOF2, SO2, and SO2F2. At the same time, a small amount of CO, and CO2 was produced. After five breaking experiments, the concentration of SOF2 can reach 1100 ppm, and the concentrations of SO2 and SO2F2 were both about 10 ppm, while the concentration of CO was lower than 2 ppm.
(4)
When H2O was involved in the arc plasma, the main by-products were SOF2, SO2, SO2F2, and HF. At the same time, a small amount of CO2, CO, and H2 was produced. After five breaking experiments, the concentration of SOF2 can reach 1200 ppm, and the concentration of SO2 and CO2 was lower than 20 ppm, while the concentration of CO was lower than 2 ppm. Contrary to the simulation results, SO2F2 and HF were hardly detected in this experiment.
(5)
When H2O and O2 impurities and PTFE vapour were involved in the arc plasma together, the main by-products were SOF2, CF4, SO2F2, and HF. At the same time, a small amount of SO2, CO2, CO, and H2 was be produced.

Author Contributions

R.Y. and J.Y. proposed the idea, established the model, and completed the experiment. M.X. and M.Y. completed the simulation, analyzed the results, and finished the original draft of this paper. Y.G. and Z.L. provided valuable opinions, and collected the data. J.W. checked the format. All authors have read and agreed to the published version of the manuscript.

Funding

This work is supported by SGCC Shaanxi Electric Power Research Institute (5226ky17001p).

Institutional Review Board Statement

Not applicable.

Informed Consent Statement

Not applicable.

Data Availability Statement

Data is contained within the article.

Acknowledgments

The authors would like to thank the anonymous reviewers for the valuable comments.

Conflicts of Interest

The authors declare no conflict of interest.

References

  1. Chu, F.Y. SF6 Decomposition in Gas-Insulated Equipment. IEEE Trans. Electr. Insul. 1986, 21, 693–725. [Google Scholar] [CrossRef]
  2. Shea, J.J. High voltage circuit breakers-design and applications. IEEE Electr. Insul. Mag. 1998, 14, 42. [Google Scholar] [CrossRef]
  3. Xu, M.; Yan, J. Theoretical study of the chemical reaction mechanisms and reaction rates of CFx + SFy (where x = 1–3 and y = 1–6) in SF6–polytetrafluoroethylene arc plasma. J. Appl. Phys. 2019, 126, 193304. [Google Scholar] [CrossRef]
  4. Xu, M.; Yan, J. Theoretical study of the chemical reaction mechanism and rate of SFn + H2O (n = 3–6) under discharge. AIP Adv. 2020, 10, 095214. [Google Scholar] [CrossRef]
  5. Fu, Y.; Rong, M.; Yang, K. Calculated rate constants of the chemical reactions involving the main byproducts SO2F, SOF2, SO2F2 of SF6 decomposition in power equipment. J. Phys. D Appl. Phys. 2016, 49, 155502. [Google Scholar] [CrossRef]
  6. Fu, Y.; Yang, A.; Wang, X. Theoretical study of the neutral decomposition of SF6 in the presence of H2O and O2 in discharges in power equipment. J. Phys. D Appl. Phys. 2016, 49, 385203. [Google Scholar] [CrossRef]
  7. Tang, J.; Liu, J.; Zhang, X. Partial discharge recognition through an analysis of SF6 decomposition products part 1: Decomposition characteristics of SF6 under four different partial discharges. IEEE Trans. Dielectr. Electr. Insul. 2012, 19, 29–36. [Google Scholar] [CrossRef]
  8. Zeng, F.; Wu, S. SF6 fault decomposition feature component extraction and triangle fault diagnosis method. IEEE Trans. Dielectr. Electr. Insul. 2020, 27, 581–589. [Google Scholar] [CrossRef]
  9. Tang, J.; Rao, X.; Zeng, F. Influence Mechanisms of Trace H2O on the Generating Process of SF6 Spark Discharge Decomposition Components. Plasma Chem. Plasma Proc. 2017, 37, 325–340. [Google Scholar] [CrossRef]
  10. Boudene, C. Identification and study of some properties of compounds resulting from the decomposition of SF6 under the effect of electrical arcing in circuit-breakers. Rev. Gen. Electr. 1974, 1, 45–78. [Google Scholar]
  11. Belmadani, B.; Casanovas, J.; Casanovas, A.M.; Grob, R. SF6 decomposition under power arcs. I. Physical aspects. IEEE Trans. Electr. Insul. 1991, 26, 1163–1176. [Google Scholar] [CrossRef]
  12. Belmadani, B.; Casanovas, J.; Casanovas, A.M. SF6decomposition under power arcs. II. Chemical aspects. IEEE Trans. Electr. Insul. 1991, 26, 1177–1182. [Google Scholar] [CrossRef]
  13. Yang, R.; Xu, M. Influence of trace H2O and O2 on SF6 decomposition products under arcing conditions in electric power equipment. J. Eng. 2019, 16, 1774–1777. [Google Scholar] [CrossRef]
  14. Andrzej, P. Generation of negative ions from SF6 gas by means of hot surface ionization. Mass Spectrom. 2012, 26, 577–582. [Google Scholar]
  15. Brand, K.P.; Kopainsky, J. Particle densities in a decaying SF6 plasma. Appl. Phys. 1978, 16, 425–432. [Google Scholar] [CrossRef]
  16. Chervy, B.; Gleizes, A.; Razafinimanana, M. Thermodynamic properties and transport coefficients in SF6-Cu mixtures at temperatures of 300–30000 K and pressures of 0.1–1 MPa. J. Phys. D Appl. Phys. 1994, 27, 1193–1206. [Google Scholar] [CrossRef]
  17. Coufal, O. Composition and thermodynamic properties of SF6-C-(C2F4)n-CaF2-Cu-W reacting mixtures. J. Phys. D Appl. Phys. 1998, 31, 2025–2039. [Google Scholar] [CrossRef]
  18. Weizong, W.; Murphy, A.B.; Mingzhe, R. Investigation on critical breakdown electric field of hot sulfur hexafluoride/carbon tetrafluoride mixtures for high voltage circuit breaker applications. J. Appl. Phys. 2013, 114, 103301. [Google Scholar]
  19. Chase, M.W.; Davies, M.C.A.; Downey, J.R. JANAF thermochemical tables third edition. J. Phys. Chem. Ref. Data 1985, 14 (Suppl. 1). [Google Scholar]
  20. Wang, X.; Gao, Q.; Fu, Y. Dominant particles and reactions in a two-temperature chemical kinetic model of a decaying SF6 arc. J. Phys. D Appl. Phys. 2016, 49, 105502–105519. [Google Scholar] [CrossRef]
Figure 1. Schematic of experimental arrangement.
Energies 14 00414 g001
Figure 2. Gas chromatograph test result. (a) Channel A. (b) Channel B.
Energies 14 00414 g002
Figure 3. Particle composition of SF6 arc plasma at 0.6 MPa.
Energies 14 00414 g003
Figure 4. Particle composition of SF6/polytetrafluoroethylene (PTFE) arc plasma at 0.6 MPa. (a) 90% SF6 + 10% PTFE. (b) 80% SF6 + 20% PTFE.
Energies 14 00414 g004
Figure 5. The change of CF4, C2F6, and C3F8 concentrations with the breaking times.
Energies 14 00414 g005
Figure 6. Particle composition of 70% SF6 + 20% CF2 + 10% O2 arc plasma at 0.6 MPa. (a) SF6, SF5, SF4, SF3, SF2, SF, S, S2, F, F2, FSSF, CF4, CF3, CF2, CF, and C particles. (b) SOF2, SO2F2, COF2, COF, O2, O, SO2, SO, CO2, and CO particles.
Energies 14 00414 g006
Figure 7. Particle composition of 60% SF6 + 20% CF2 + 20% O2 arc plasma at 0.6 MPa. (a) SF6, SF5, SF4, SF3, SF2, SF, S, S2, F, F2, FSSF, CF4, CF3, CF2, CF, and C particles. (b) SOF2, SO2F2, COF2, COF, O2, O, SO2, SO, CO2, and CO particles.
Energies 14 00414 g007
Figure 8. Changes of SOF2, SO2, SO2F2, and CO concentrations with the breaking times under different O2 concentration. (a) Changes of SOF2 with the breaking times. (b) Changes of SO2 with the breaking times. (c) Changes of SO2F2 with the breaking times. (d) Changes of CO with the breaking times.
Energies 14 00414 g008
Figure 9. Particle composition of 70% SF6 + 20% CF2 + 10% H2O arc plasma at 0.6MPa. (a) SF6, SF5, SF4, SF3, SF2, SF, S, S2, F, F2, FSSF, S2F10, CF4, CF3, CF2, CF, C, C2F, and C2F2 particles. (b) SOF2, SO2F2, COF2, COF, O2, O, SO2, SO, CO2, CO, HF, H, H2, and CH particles.
Energies 14 00414 g009
Figure 10. Particle composition of 60% SF6 + 20% CF2 + 20% H2O arc plasma at 0.6MPa. (a) SF6, SF5, SF4, SF3, SF2, SF, S, S2, F, F2, FSSF, S2F10, CF4, CF3, CF2, CF, and C particles. (b) SOF2, SO2F2, COF2, COF, O2, O, SO2, SO, CO2, CO, HF, H, H2, and OH particles.
Energies 14 00414 g010
Figure 11. Changes of SOF2, SO2, CO2, and CO concentrations with the breaking times under different H2O concentration. (a) Changes of SOF2 with the breaking times. (b) Changes of SO2 with the breaking times. (c) Changes of CO2 with the breaking times. (d) Changes of CO with the breaking times.
Energies 14 00414 g011aEnergies 14 00414 g011b
Figure 12. Particle composition of 60% SF6 + 20% CF2 + 10% H2O + 10%O2 arc plasma at 0.6 MPa. (a) SF6, SF5, SF4, SF3, SF2, SF, S, S2, F, F2, FSSF, CF4, CF3, CF2, CF, and C particles. (b) SOF2, SO2F2, COF2, COF, O2, O, SO2, SO, CO2, CO, HF, H, H2, and OH particles.
Energies 14 00414 g012
Table 1. Setting of breaking experiment with different H2O concentration.
PhaseH2O ConcentrationBreaking CurrentBreaking Times
A106 ppm~10 kA5
B748 ppm~10 kA5
C1131 ppm~10 kA5
Table 2. Setting of breaking experiment with different O2 concentration.
PhaseO2 ConcentrationBreaking CurrentBreaking Times
A59 ppm~10 kA5
B736 ppm~10 kA5
C1202 ppm~10 kA5
Publisher’s Note: MDPI stays neutral with regard to jurisdictional claims in published maps and institutional affiliations.

