Article

Impact of Pilot Injection on Combustion and Emission Characteristics of a Low-Speed Two-Stroke Marine Diesel Engine

1
State Key Laboratory of Engines, Tianjin University, Tianjin 300072, China
2
China Shipbuilding Power Engineering Institute, Shanghai 201306, China
*
Authors to whom correspondence should be addressed.
Energies 2021, 14(2), 417; https://doi.org/10.3390/en14020417
Submission received: 15 November 2020 / Revised: 1 January 2021 / Accepted: 8 January 2021 / Published: 13 January 2021
(This article belongs to the Section B: Energy and Environment)

Abstract

:
Low-speed two-stroke marine diesel engines dominate the modern global long-distance transportation market; with the increasingly stringent regulations, the combustion and emissions of these engines is gaining intense interest. The primary objective of the present study was to understand the effects of air-fuel mixing by pilot injection strategy on the combustion and emission characteristics of the marine diesel engines through a numerical study. Specifically, a computational fluid dynamic (CFD) model was established and validated by experimental data for a typical low-speed two-stroke marine diesel engine. The combustion parameters under different stages were analyzed, including mean in-cylinder temperature and pressure, indicated thermal efficiency (ITE), indicated specific fuel consumption (ISFC), and distribution of fuel-air mixture. Results indicated that, due to the premixing effect, the pilot injection produced unburned soot from the main injection’s ignition as well as decrease the intervals between the middle and final stages of combustion, thus raising the in-cylinder temperature. The interaction between the reduction of soot particles resulted from the increased temperature, and the decrease of the stage intervals led to lower overall boundary heat loss, which improved the effective thermal efficiency. The pilot injection timing and quality, respectively, showed quadratic and linear impact modes on engine performance and emissions.

Graphical Abstract

1. Introduction

With the development of economic globalization, marine transportations are widely applied in global trade and transportation. The diesel engine is the primary power source of marine ships in transportations [1,2]. Different from the high- and medium-speed ships that generally use four-stroke diesel engines, low-speed marine ships, which dominate the long-distance transportation industry of global goods, normally use two-stroke engines. Compared to four-stroke engines, two-stroke low-speed marine diesel engines have the distinct advantages of higher torque, better fuel efficiency, as well as higher power density, which make them excellent power sources [3] for global long-distance transportations [4]. However, on the other hand, the two-stroke diesel engines may cause considerable pollution to the environment [5]. They tend to produce high amounts of particulate matter (PM), sulfur oxides (SOx), and nitrogen oxides (NOx), primarily due to using heavy fuel oil (HFO) [6].
In order to meet the more and more stringent requirements [7], multiple strategies have been proposed for the low-speed two-stroke marine ships so as to substantially reduce the emissions. Exhaust gas recirculation (EGR) was adopted to achieve effective NOx reduction [8,9,10]. However, it tended to increase the emissions of particulate matter (PM), and the soot deposits generated from engine components might decrease the power density and the durability of the engines [11]. The other ways to reduce conventional pollutant emissions included implementing various exhaust gas after-treatment devices such as diesel particulate filters (DPFs) [12,13,14] and selective catalytic reduction (SCR) [14,15,16]. The drawbacks of these after-treatment devices are high capital and maintenance costs. In addition to the toxic pollutant emissions, a higher Energy Efficiency Design Index (EEDI) is also demanded to reduce the emission of greenhouse gases (GHGs), which on the other hand, requires a higher power density of marine engines.
In contrast to current techniques used for reducing emissions with various disadvantages, improving the fuel-air mixing and in-cylinder combustion process was proposed as a beneficial alternative [17,18,19,20,21]. The fuel-air mixing and combustion process are controlled by injection and charging systems in the cylinder. Given the fact that adopting scavenging ports is a common practice for two-stroke engines’ charging systems, which keeps the size and direction of ports, plastic injection serves as an effective method to control the mixing process. According to the injection timing and quantity, flexible injections can be divided into the pilot-, main- and post-injection. The pilot injection, consisting of a small amount of fuel and injecting before the main injection, tends to perform a different air-fuel mixture. The impact of pilot injection on the combustion characteristics of the main injection is mainly considered by two aspects. On the one hand, it increases the in-cylinder temperature and pressure [22] and limits the premixed combustion phase of the main injection, yielding smooth heat release [23] and reduced NOx emissions [24]. On the other hand, pilot injection ignites the main injection mixture by providing a hot air-fuel mixture [25,26,27,28,29]. Some studies on the pilot injection indicated that inducing pilot injection could increase cylinder pressure and NOx emission because of the ignition effect [30,31], which has a different combustion behavior. The usage of double injection schemes was considered to be favorable in reducing combustion noise, emissions, and fuel consumption [32,33,34], yet the impacts of premixing of pilot injection on the combustion characteristics of the main injection are not known.
Currently, studies focus on the effect of pilot injection mainly consider four-stroke engines with low compression ratios [35,36] and advanced main injection timing (generally before the top dead center) [25,37,38]. The main injection timing of two-stroke engines was generally after the top dead center (TDC), when in-cylinder temperature and pressure are relatively high, under large compression ratios. Because of the thermodynamic state, the impact of the premixing process of the main injection was limited. To enhance the entire mixing process, the spray-combustion interaction in double injections, consisting of a pilot and main injections on two-stroke engines, is required to investigate the effect of pilot injection on premixing and the subsequent process of the main injection. Moreover, advanced combustion techniques, including homogenous charge compression ignition (HCCI) and premixed charge compression ignition (PCCI), can effectively reduce the formation of some conventional pollutants in four-stroke diesel engines. Meanwhile, combustion efficiency does not deteriorate [16,27,32]. Thus, based on the in-cylinder fuel-air mixing process with the adoption of multiple injections, a proper understanding of the mixing process of pilot-main injection onboard should be investigated.
The objective of the present study is to understand the spray-combustion interaction process in pilot-main-injection, as well as examine its impact on the combustion and emissions of two-stroke diesel engines by applying numerical methodologies. In order to study the impact of double injections on two-stroke engines, a computational fluid dynamic (CFD) model was first established. The simulation model adopting a characteristic time combustion model was validated by experimental data. N-tetradecane was selected as the surrogate fuel of marine diesel oil (MDO). The effects of air-fuel mixing through pilot injection on the combustion and emission characteristics of marine diesel engines were then investigated. The combustion parameters under different stages were analyzed, including mean in-cylinder temperature and pressure, indicated thermal efficiency (ITE), indicated specific fuel consumption (ISFC), and distribution of fuel-air mixture.

2. Numerical Methodologies

2.1. Test Engine

The test engine for the present study was a two-stroke, low-speed marine diesel engine with five cylinders in line. Each cylinder had an exhaust valve in the center of the cylinder head. Instead of having traditional intake valves, each cylinder was equipped with scavenging ports at the bottom of the liner. The test engine applied a direct injection strategy, i.e., the fuel was sprayed directly into the combustion chamber. Three fuel injectors were located near the outer edge of the combustion chamber. More detailed information regarding the test engine was provided in Table 1.
Although the test engine was designed to operate with heavy fuel oil (HFO), marine diesel oil operation was also operable. Detailed operating parameters at different loads were listed in Table 2, including engine speed, power, mean effective pressure (MEP), maximum pressure (Pmax), specific fuel consumption (SFC), and NOx emissions.

2.2. Model Description

Considering that the three injectors were arranged at 120 degrees apart at the outer edge of the cylinder liner, the simulation implemented the whole combustion chamber, where each injector had five nozzles of 1 mm diameter, as shown in Figure 1. The injector axis and nozzle spray direction were shown in Figure 2. Table 3 illustrated the spatial angle between each nozzle and the injector axis and the angle projected on the z–y plane. A three-dimensional computation domain was generated by the CONVERGE mesh generator. The simulation of the whole processes, including fuel/air intake, combustion, and pollutant formation, which is a typical and commonly used simulation period. The simulation period lasted from a 127 degree crank angle after top dead center (°CA ATDC), when the exhaust valve opened (and then closed), to a 487 °CA ATDC, when the exhaust valve opened again. The single-cylinder model geometric structure and computational domain were shown in Figure 3.
The CFD software was based on the finite volume method with a splitting operator (PISO) algorithm [39]. The main physical and chemical models used are listed in Table 4. To achieve more accurate simulation of the physical process of fuel injection in the cylinder, the Kelvin-Helmholtz and Rayleigh-Taylor Breakup Model (KH-RT) and Renormalization Group K-ε (RNG K-ε) turbulence models [40] were adopted. Given the similar properties between MDO and n-tetradecane (C14H30), the latter was applied as the surrogate fuel in the simulation. Applying the detailed chemical kinetics model (SAGE), the time consumption was 14 times larger than when applying the characteristic time combustion (CTC) model. Thus, as a compromise between computational work and accuracy, the CTC model [41,42] and the Shell ignition model were adopted to simulate the whole combustion process with chemical simulation. The original Shell model [43] used a simplified reaction mechanism to simulate self-ignition in diesel engines. The modified Shell model consisted of seven reactions, which are listed in Table 5. The Shell model was used to predict the process of spontaneous combustion of fuel in the cylinder at the low-temperature reaction stage, while the CTC model described the combustion process of the fuel in the cylinder after self-ignition. The combustion model was based on the rate of change in species’ density of component m to simulate the combustion process. The rate of density’s change was defined as Equation (1).
d ρ m d t = ρ m ρ m * τ c
where ρm represented the density of component m when it reached thermodynamic equilibrium at the required characteristic reaction time (τc). As illustrated in Equation (2), the characteristic reaction time τc was composed of two parts: the chemical-kinetics time (τchem) and the turbulent mixing time (τturb), where f was a coefficient that simulated the increasing influence of turbulence on combustion. The τchem and τturb were modeled by Equations (3) and (4), respectively.
τ c = τ c h e m + f τ t u r b
τ c h e m = C n H 2 m 0.75 e E c h e m / R u T g 2 A c h e m O 2 1.5
τ t u r b = C m 2 k ε
where Achem represented the user-defined simulation constant of 8680000.0, Echem was the activation energy of 95.7 kJ/mol, and Cm2 was the user-defined turbulent time scale constant of 2.5.
Regarding the simulation of emissions, NO played a significant role in the emission of nitrogen oxides from engines. Under engine operating conditions, the thermal NO accounted for a major part of the entire NO emission in diesel engines, while the prompt NO appeared occasionally. Thus, the extended Zeldovich (thermal NO) mechanism was adopted to simulate NOx formation in-cylinder [44]. Instead of using a constant field distribution, an initial flow field was produced to achieve higher accuracy. A CONVERGE function [45], “mapping variables”, was applied to comply with region conditions, while boundary conditions are shown in Table 6.

2.3. Experimental Validation

In order to find the appropriate number of grids for effective and fast calculation, grid sensitivity was investigated. The injectors were fixed, refining at four levels. The exhaust valve contact surface and exhaust valve adopted the fixed refinement level 2 at the bottom, and the fixed refinement level 1 was set for the top of the exhaust valve. Different fixed refinement levels and adaptive mesh refinement for the scavenging port, cylinder wall, and combustion chamber were set. The number of meshes and the refinement levels are shown in Table 7. The cylinder pressure and the average temperature are illustrated in Figure 4 and Figure 5, respectively. The cylinder pressure did not change significantly with the mesh refinement. In contrast, the cylinder temperature was more sensitive to the mesh refinement. Combining the two results, excluding several refinement strategies with considerable changes, and considering the calculation time, the F2A2 mesh refinement case was finally adopted. In this study, during the combustion process, the maximum amounts of cells reached 800,000. GT-Power software was employed in the previous research for 1-D simulation [46], which used EngCylCombDIJet as the quasi-3D predictive combustion model. The Nagle and Stickland–Constable model was selected in the combustion model, considering the high computational accuracy for NOx emission prediction, the EngCylNO accuracy for soot prediction. The 1D simulation model is illustrated in Figure 6.
Since the engine tests did not provide a cylinder pressure curve, all the validations were based on values of compression pressure and peak pressure [47]. Figure 7 shows the comparison of pressure between the cylinder of the 1D simulation and the 3D simulation, which characterized the whole process, including injection, atomization, and combustion in a diesel engine. The errors between three-dimensional simulation, one-dimensional simulation, and experiment are shown in Table 8. The error between 3D and 1D simulation was 4.8% in terms of compression pressure, and the error between 3D simulation and experiment was 3.8%. The error of explosion pressure, specific fuel consumption and NOx emission values were 2.1%, 0.7%, 3.4%, 1.5%, 4.3% and 3.0% respectively. Therefore, the current models were considered feasible for predicting combustion and emission characteristics.
In order to achieve high-density combustion in the marine engine, the intake pressure adopted the current 6 bar intake pressure achievable under two-stage supercharging while maintaining a constant air-fuel ratio. On this basis, the influence of the injection parameters of the main injection and the pilot injection was investigated. As shown in Table 9, injection cases conducted in the present study consisted of four parameters: the pilot injection timing (θPI), the main injection timing (θMI), and their injection mass ratios (QPI and QMI, respectively). The main injection timing and the quantities of fuel delivery per cycle remained constant. The injection mass ratios varied from case one (P0M100) to case seven (P30M70), with the pilot injection mass ratio changing from 0% to 30% and the pilot injection timing remaining constant. And the pilot injection timing ranged from 5 degree crank angle before top dead center (°CA BTDC) to 20 ° CA BTDC in case eight (P-5CA) to case 11 (P-20CA).

3. Results and Discussion

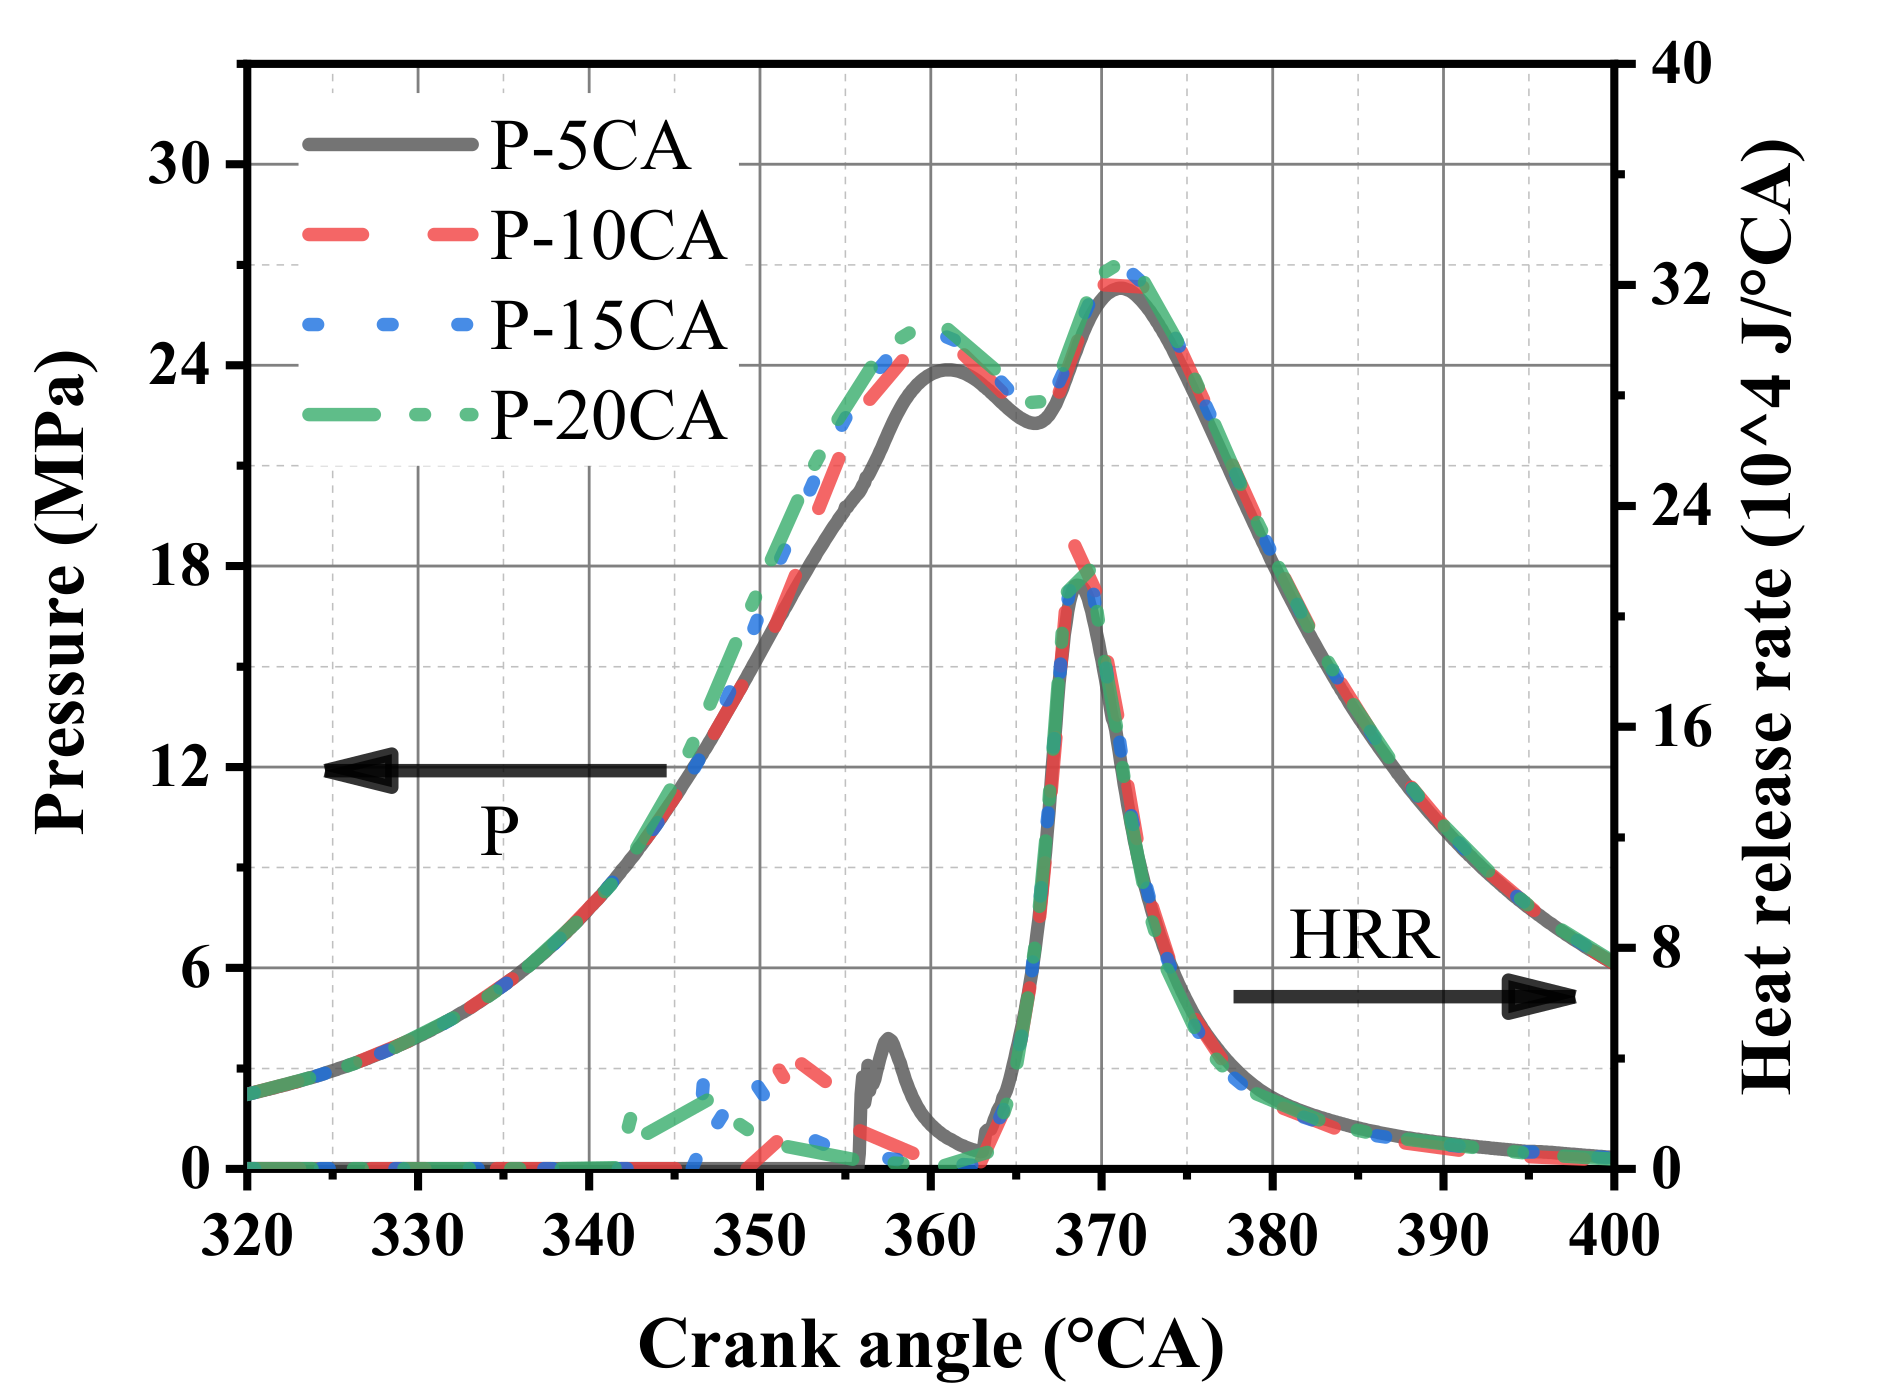
3.1. In-Cylinder Pressure and Heat Release Rate (HRR)

Generally, there were two peaks in the cylinder pressure curve for the marine two-stroke engines. When the main injection timing was after the TDC, the pressure decreased first after the compression peak because of gas expansion. Later, the main injection fuel was oxidized, and combustion occurred to release heat to raise the in-cylinder pressure further. The in-cylinder pressure and heat release rate (HRR) of different pilot injection cases are illustrated in Figure 8 and Figure 9. Pilot injection could effectively increase the in-cylinder compression pressure. Since the main injection time was fixed, the pressure-drop remained the same. The overall peak pressure resulted in an increasing curve due to the substantial increase in compression peak pressure [48]. Yet the pressure rises between peak pressure and compression pressure was decreasing because of the introduction of pilot injection.
As shown in Figure 8 and Figure 9, typically, the heat release rates of pilot injection showed two peaks, with the first one caused by premixed combustion [25] and the second one by diffusion combustion. Because of the single HRR peak, the main injection combustion process without a premixed phase could be obtained from P0M100. With an increase in the pilot injection mass ratio, the pilot injection heat release peak was delayed, while the main injection heat release peak was advanced. The pilot injection decreased the ignition delay time of the main injection [49]. Increasing the pilot injection mass ratio enhanced the peak heat release rate of the pilot injection and the average temperature of the cylinder, which eventually caused the decrease of the ignition delay time.
Moreover, as indicated by Figure 9, the duration of pilot injection prolonged when the pilot injection timing was advanced, and the peak of pilot injection heat release decreased. Especially for P-5CA, the heat release curves of the pilot injection and the main injection interfered with each other, and the peak of the main injection heat release decreased. As for P-10CA to P-20CA, the maximum heat release rate of the main injection decreased firstly and then increased. The pilot injection timing had a quadratic effect on the maximum heat release rate.

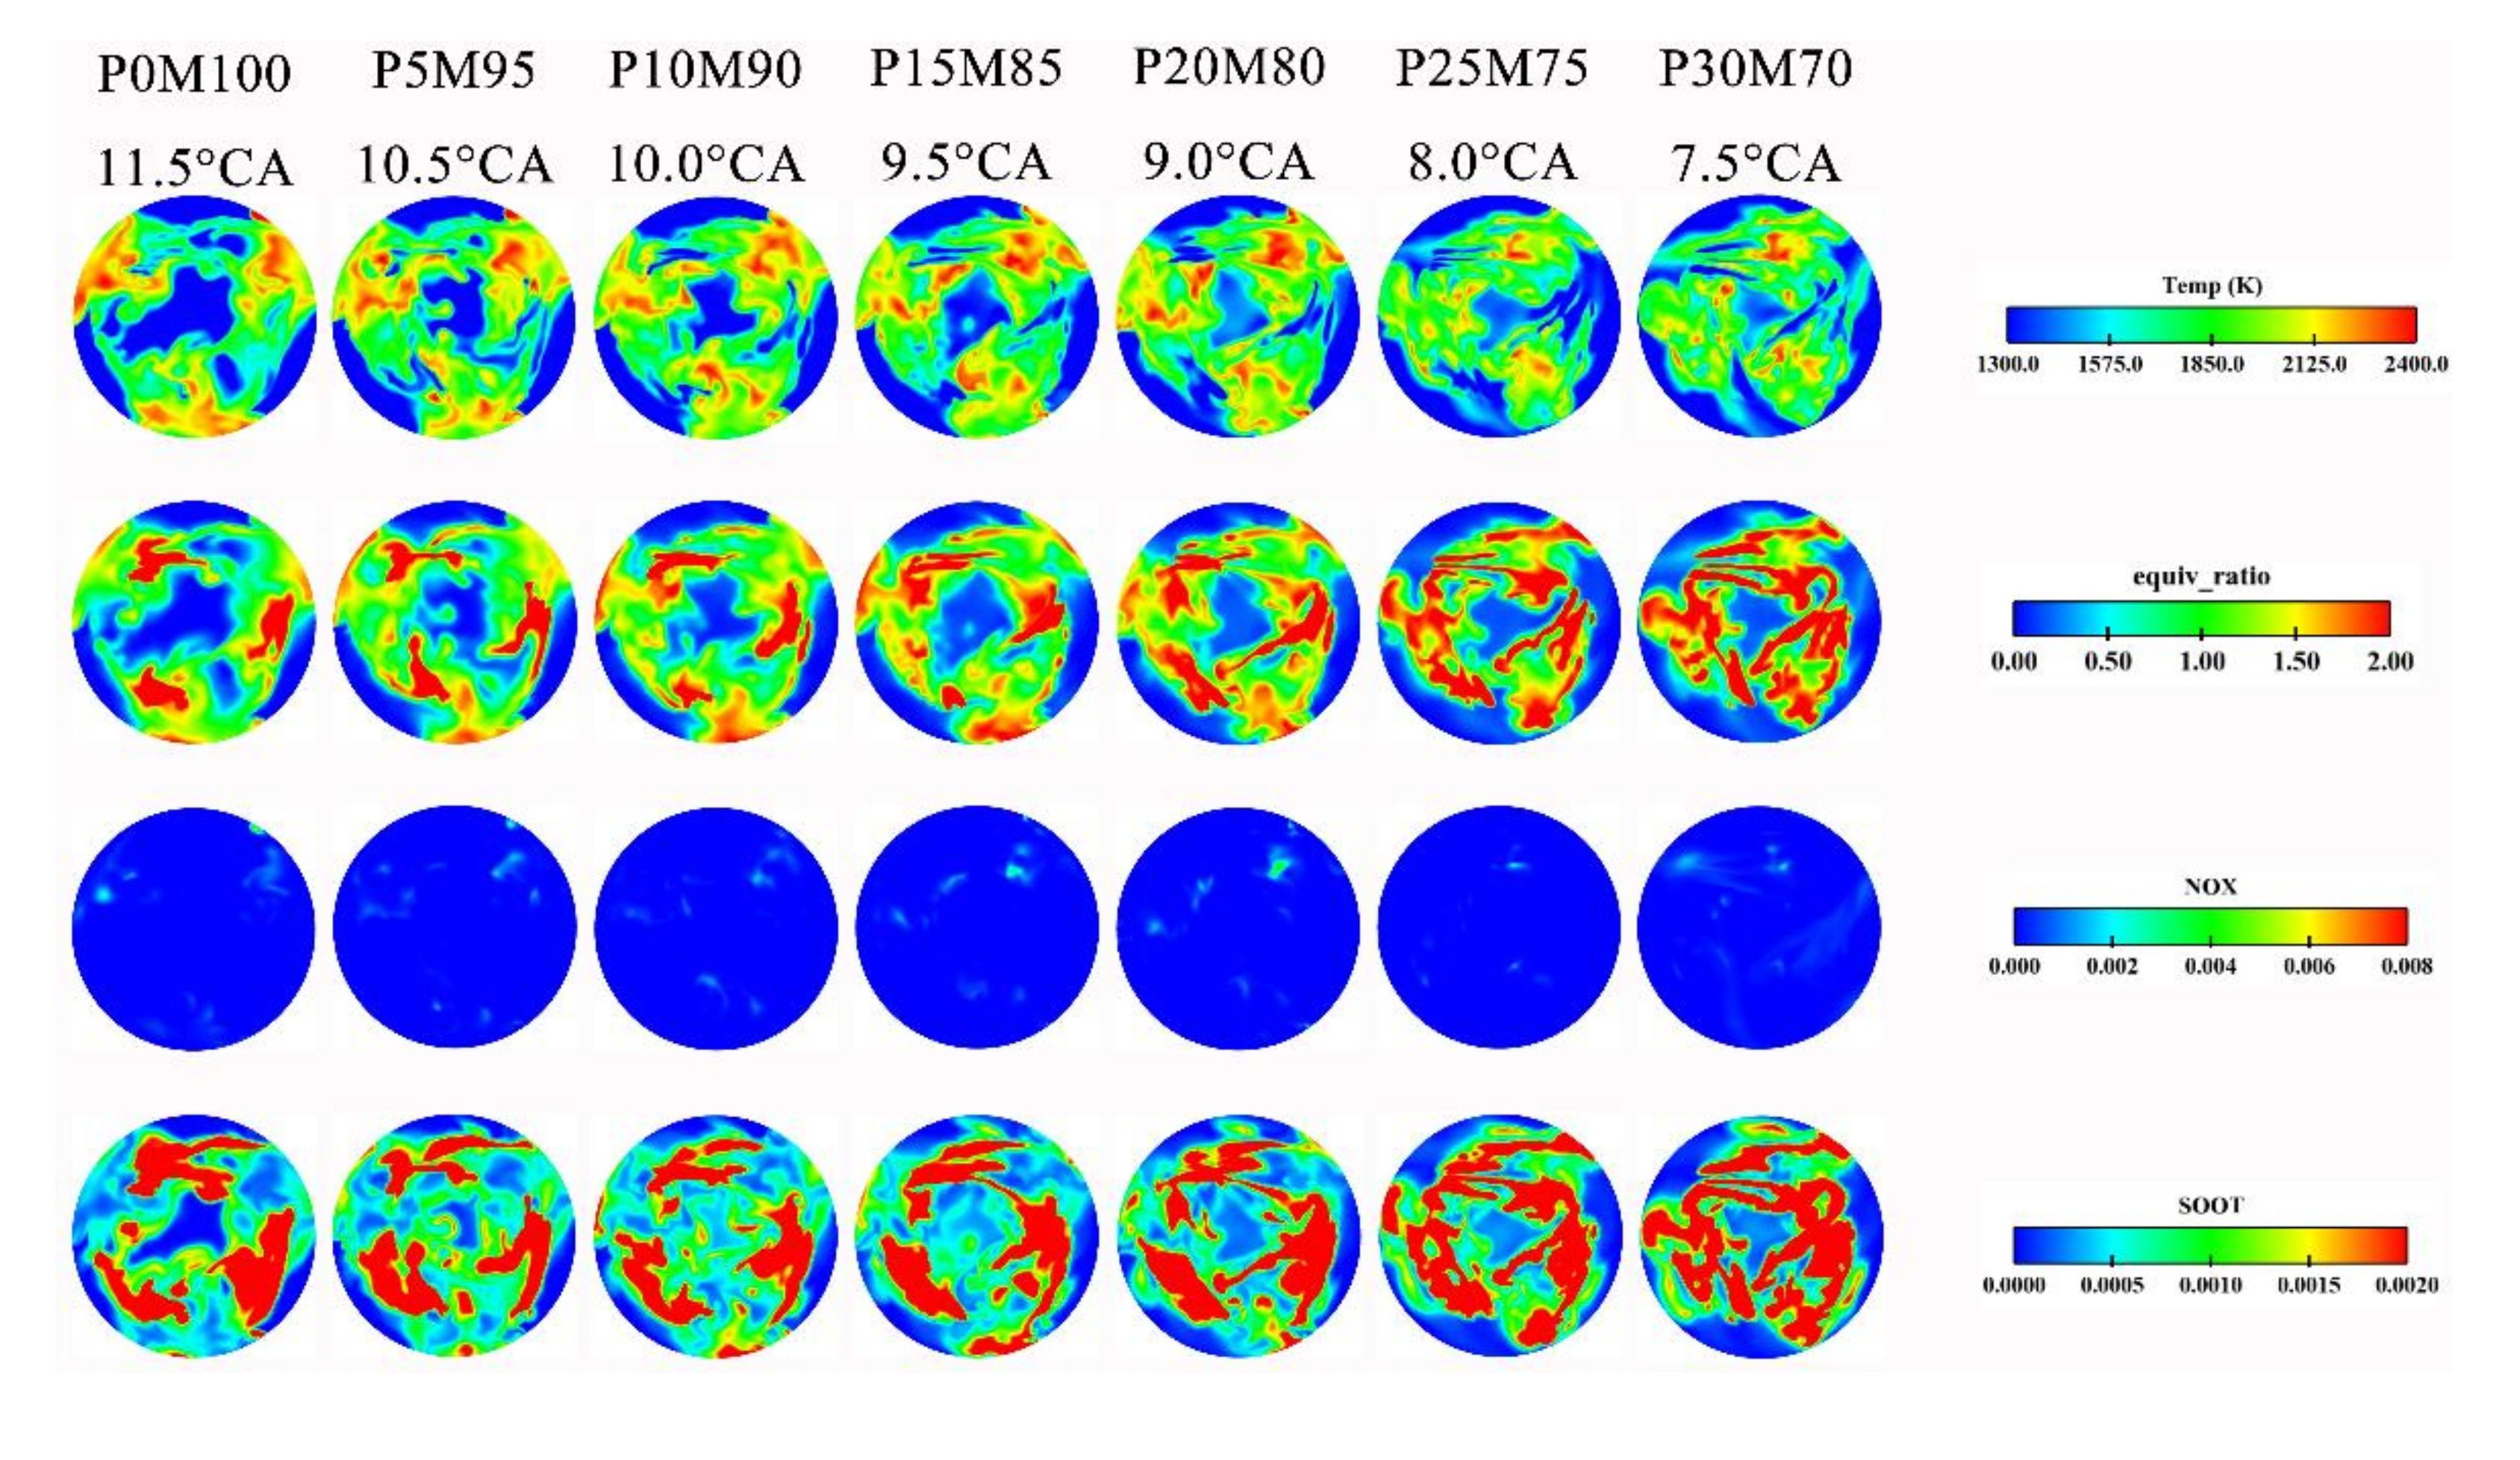
3.2. In-Cylinder Distribution of Initial Phase of Combustion

To further investigate the effect of in-cylinder condition, 10%, 50%, and 90% of the accumulative heat release (termed as q10, q50, and q90, respectively) were achieved by the heat release rate curve. They also corresponded to the crankshaft rotation angle to indicate the initial, middle, and final phase of combustion to analyze the distribution of temperature, equivalent ratio, and pollutants.
Pilot injection would raise the in-cylinder temperature of the initial stage in the combustion process. And because of the relatively low temperature where the pilot injection was introduced, the premixed effect would appear to increase the soot formation. As shown in Figure 10, from P0M100 to P10M90, the time varied from 7.5 °CA to 4 °CA ATDC because the pilot injection ratio was less than 10% of the total circulation mass. The temperature rising changed from the main injection area to the central area due to the impact of turbulence. The initial combustion temperature was lower than the temperature when the NOx was generating. The soot distribution was more uniform with the increase of the pilot injection mass ratio, which showed that pilot injection had a certain influence on the mixture during the combustion by the main injection. From P15M85 to P30M70, the corresponding time of 10% accumulative heat release was the pilot injection duration, which changed from 5 °CA BTDC to about 10 °CA BTDC along with the increase of pilot injection proportion. The temperature rising area decreased gradually, and the corresponding equivalent ratio and soot distribution area increased. Besides, the area of soot over-concentration area was also increasing. The soot formation was increasing in the early stage of combustion, with the increase of the pilot injection mass ratio.
As shown in Figure 11, from P-5CA to P-20CA, the initial combustion time was advanced from 5 °CA ATDC to 4 °CA ATDC with earlier pilot injection timing. Earlier pilot injection timing would result in deeper fuel distribution due to the gas movement in the combustion chamber, resulting in uniform in-cylinder fuel distribution. The overall temperature has not reached that to produce NOx. From the perspective of soot distribution, its formation was closer to the boundary under the effect of turbulence with the advance of pilot injection timing.

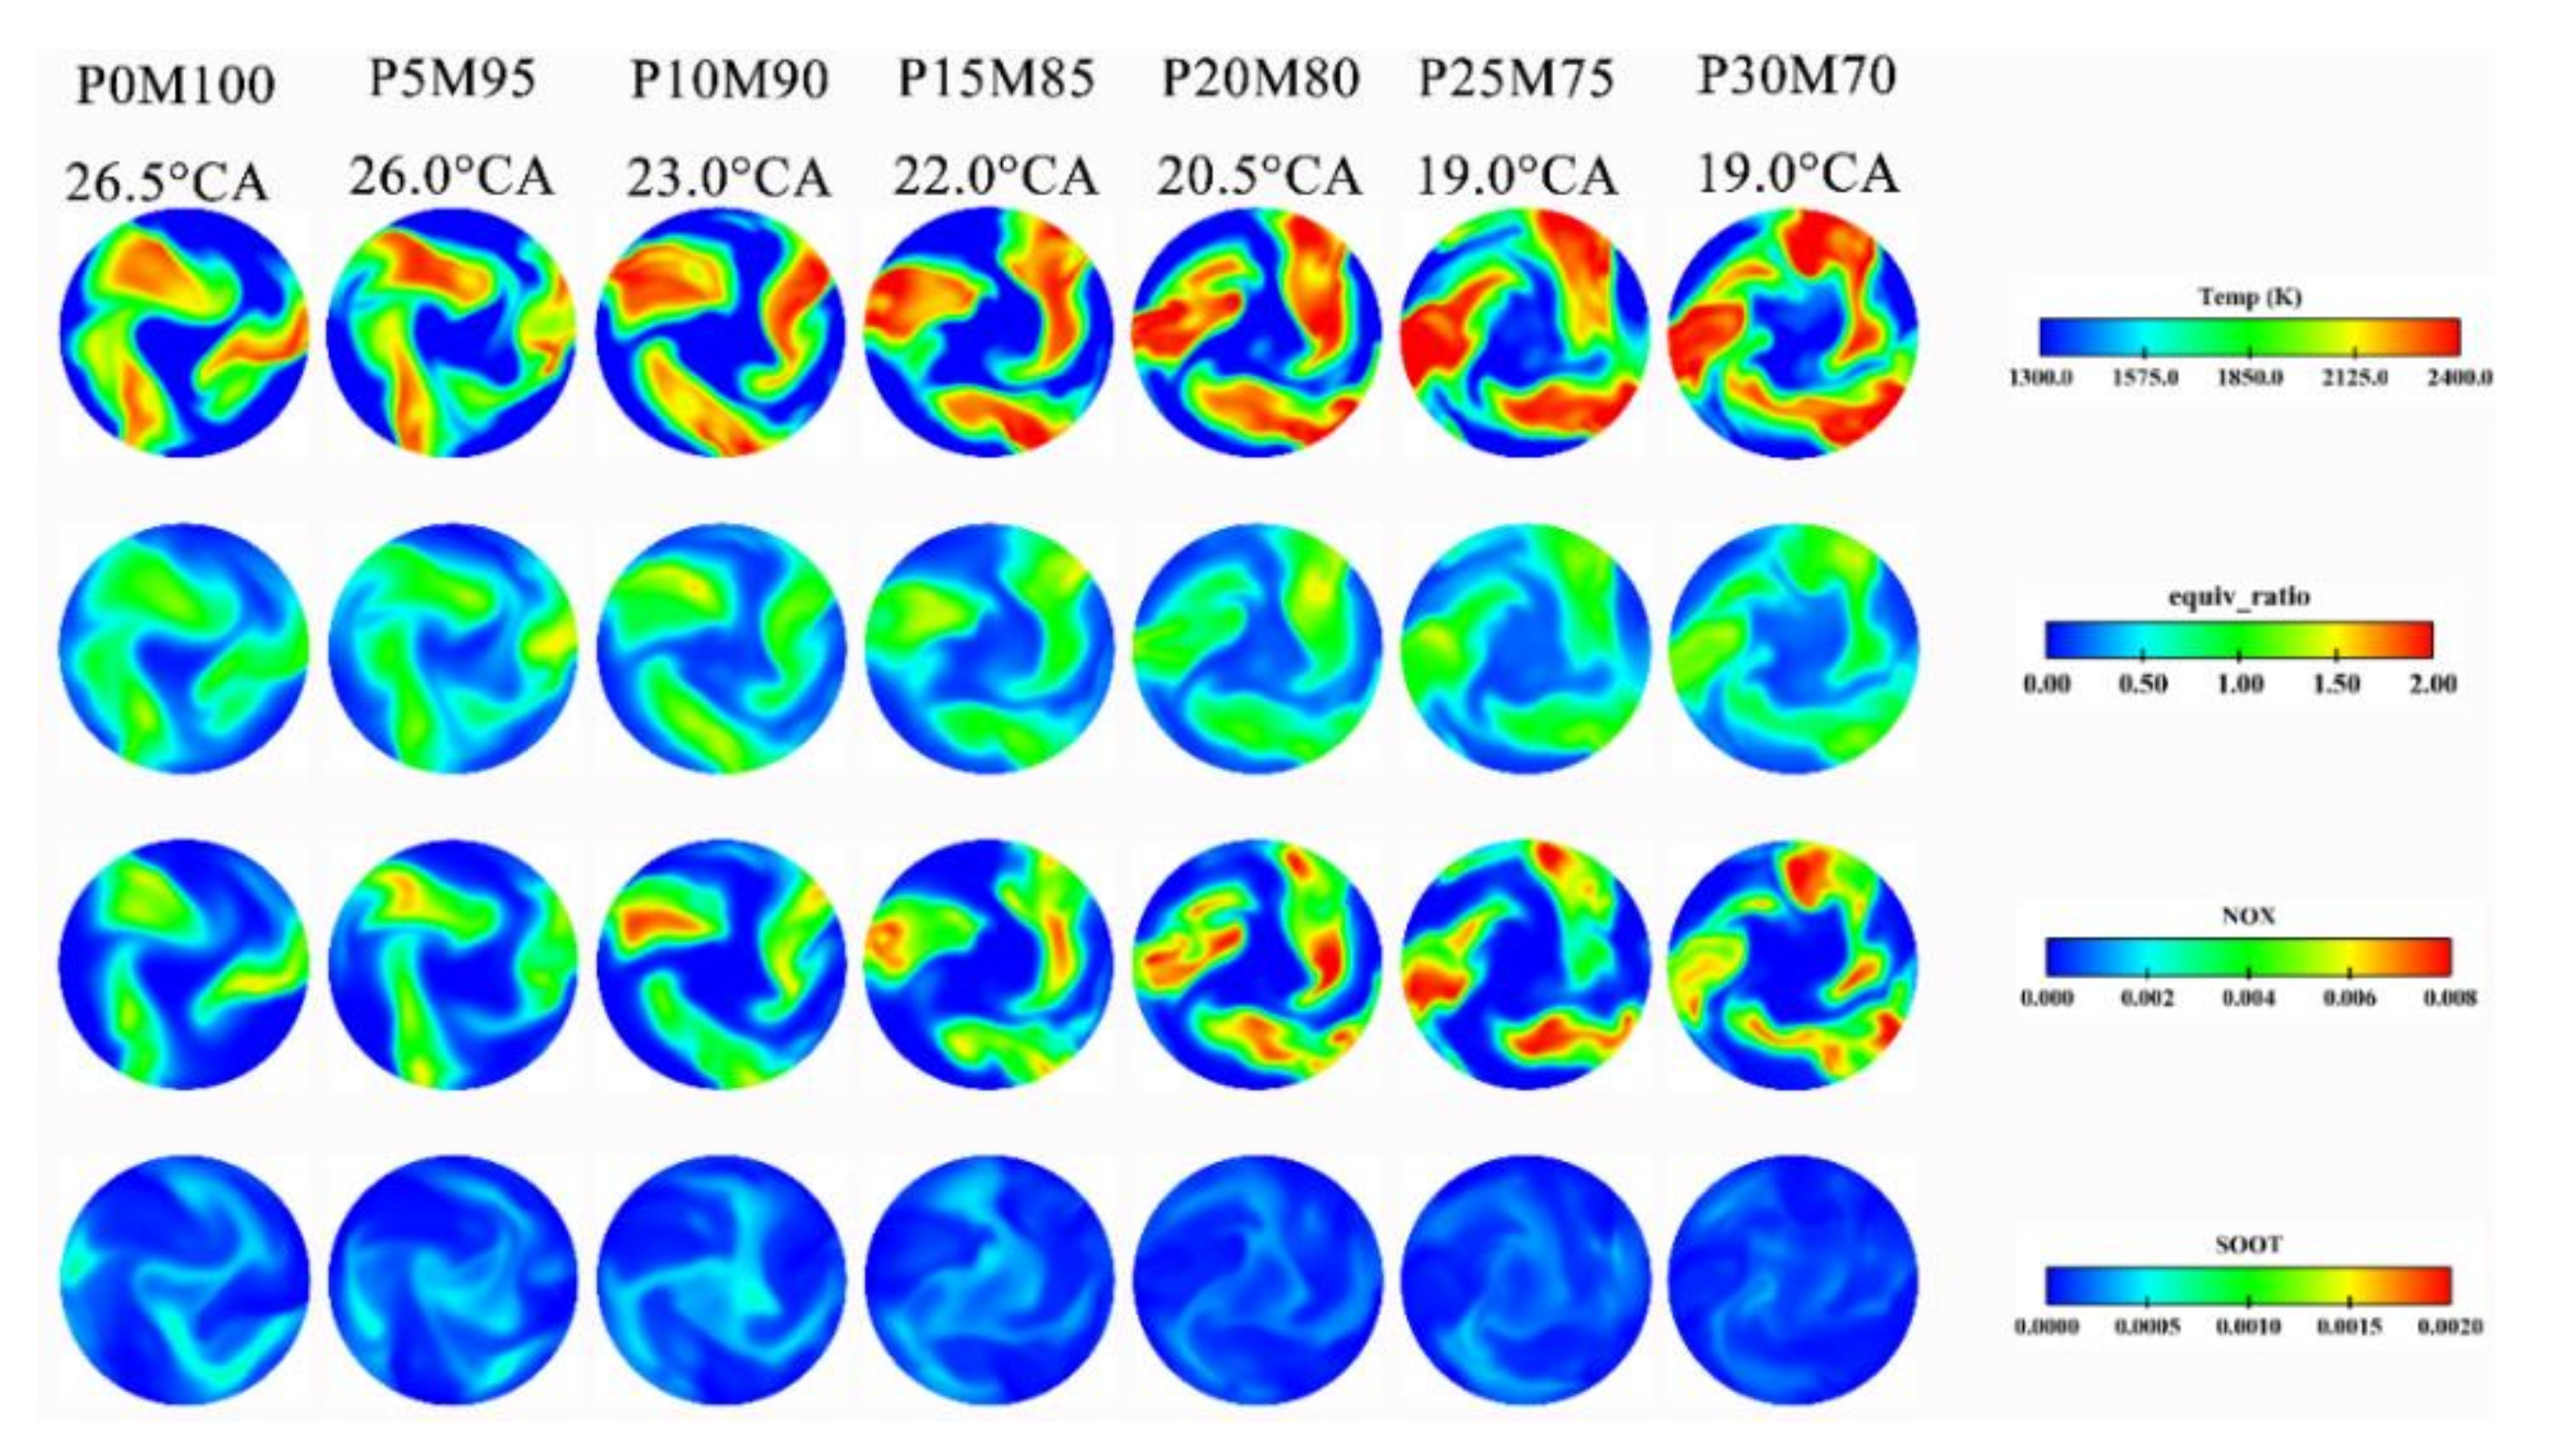
3.3. In-Cylinder Distribution of Middle Phase of Combustion

Pilot injection could effectively advance the middle stage of the whole combustion. As indicated in Figure 12, with the increase of pilot injection mass ratio, the corresponding time of 50% of accumulative heat release from P0M100 to P30M70 was advanced from 11.5 °CA ATDC to 7.5 °CA ATDC. The high-temperature zone decreased with the increase of pilot injection proportion. The 50% heat release time was advanced because of the larger pilot injection mass ratio. At that time, the main injection fuel did not finish burning. The distribution of in-cylinder fuel was closer to the injection path of the nozzle. At the same time, the high-temperature zone has appeared, starting to produce NOx. However, the NOx formation zone area was decreasing with the shrink of the high-temperature zone area, which was due to the increase of the pilot injection mass ratio similarly. With the increase of the pilot injection mass ratio, soot emissions showed an upward trend since the in-cylinder temperature was still relatively low during the early to middle stage of the combustion.
As shown in Figure 13, regardless of the pilot injection timing, the middle stage of combustion maintained at about 10 °CA ATDC because of the constant main injection. The equivalence ratio decreased, and the high-temperature zone became larger in the cylinder, which accelerated the evaporation and oxidation of fuel, and at the same time, the distribution of mixture in the cylinder tended to be uniform. However, higher temperatures resulted in increased NOx formation.

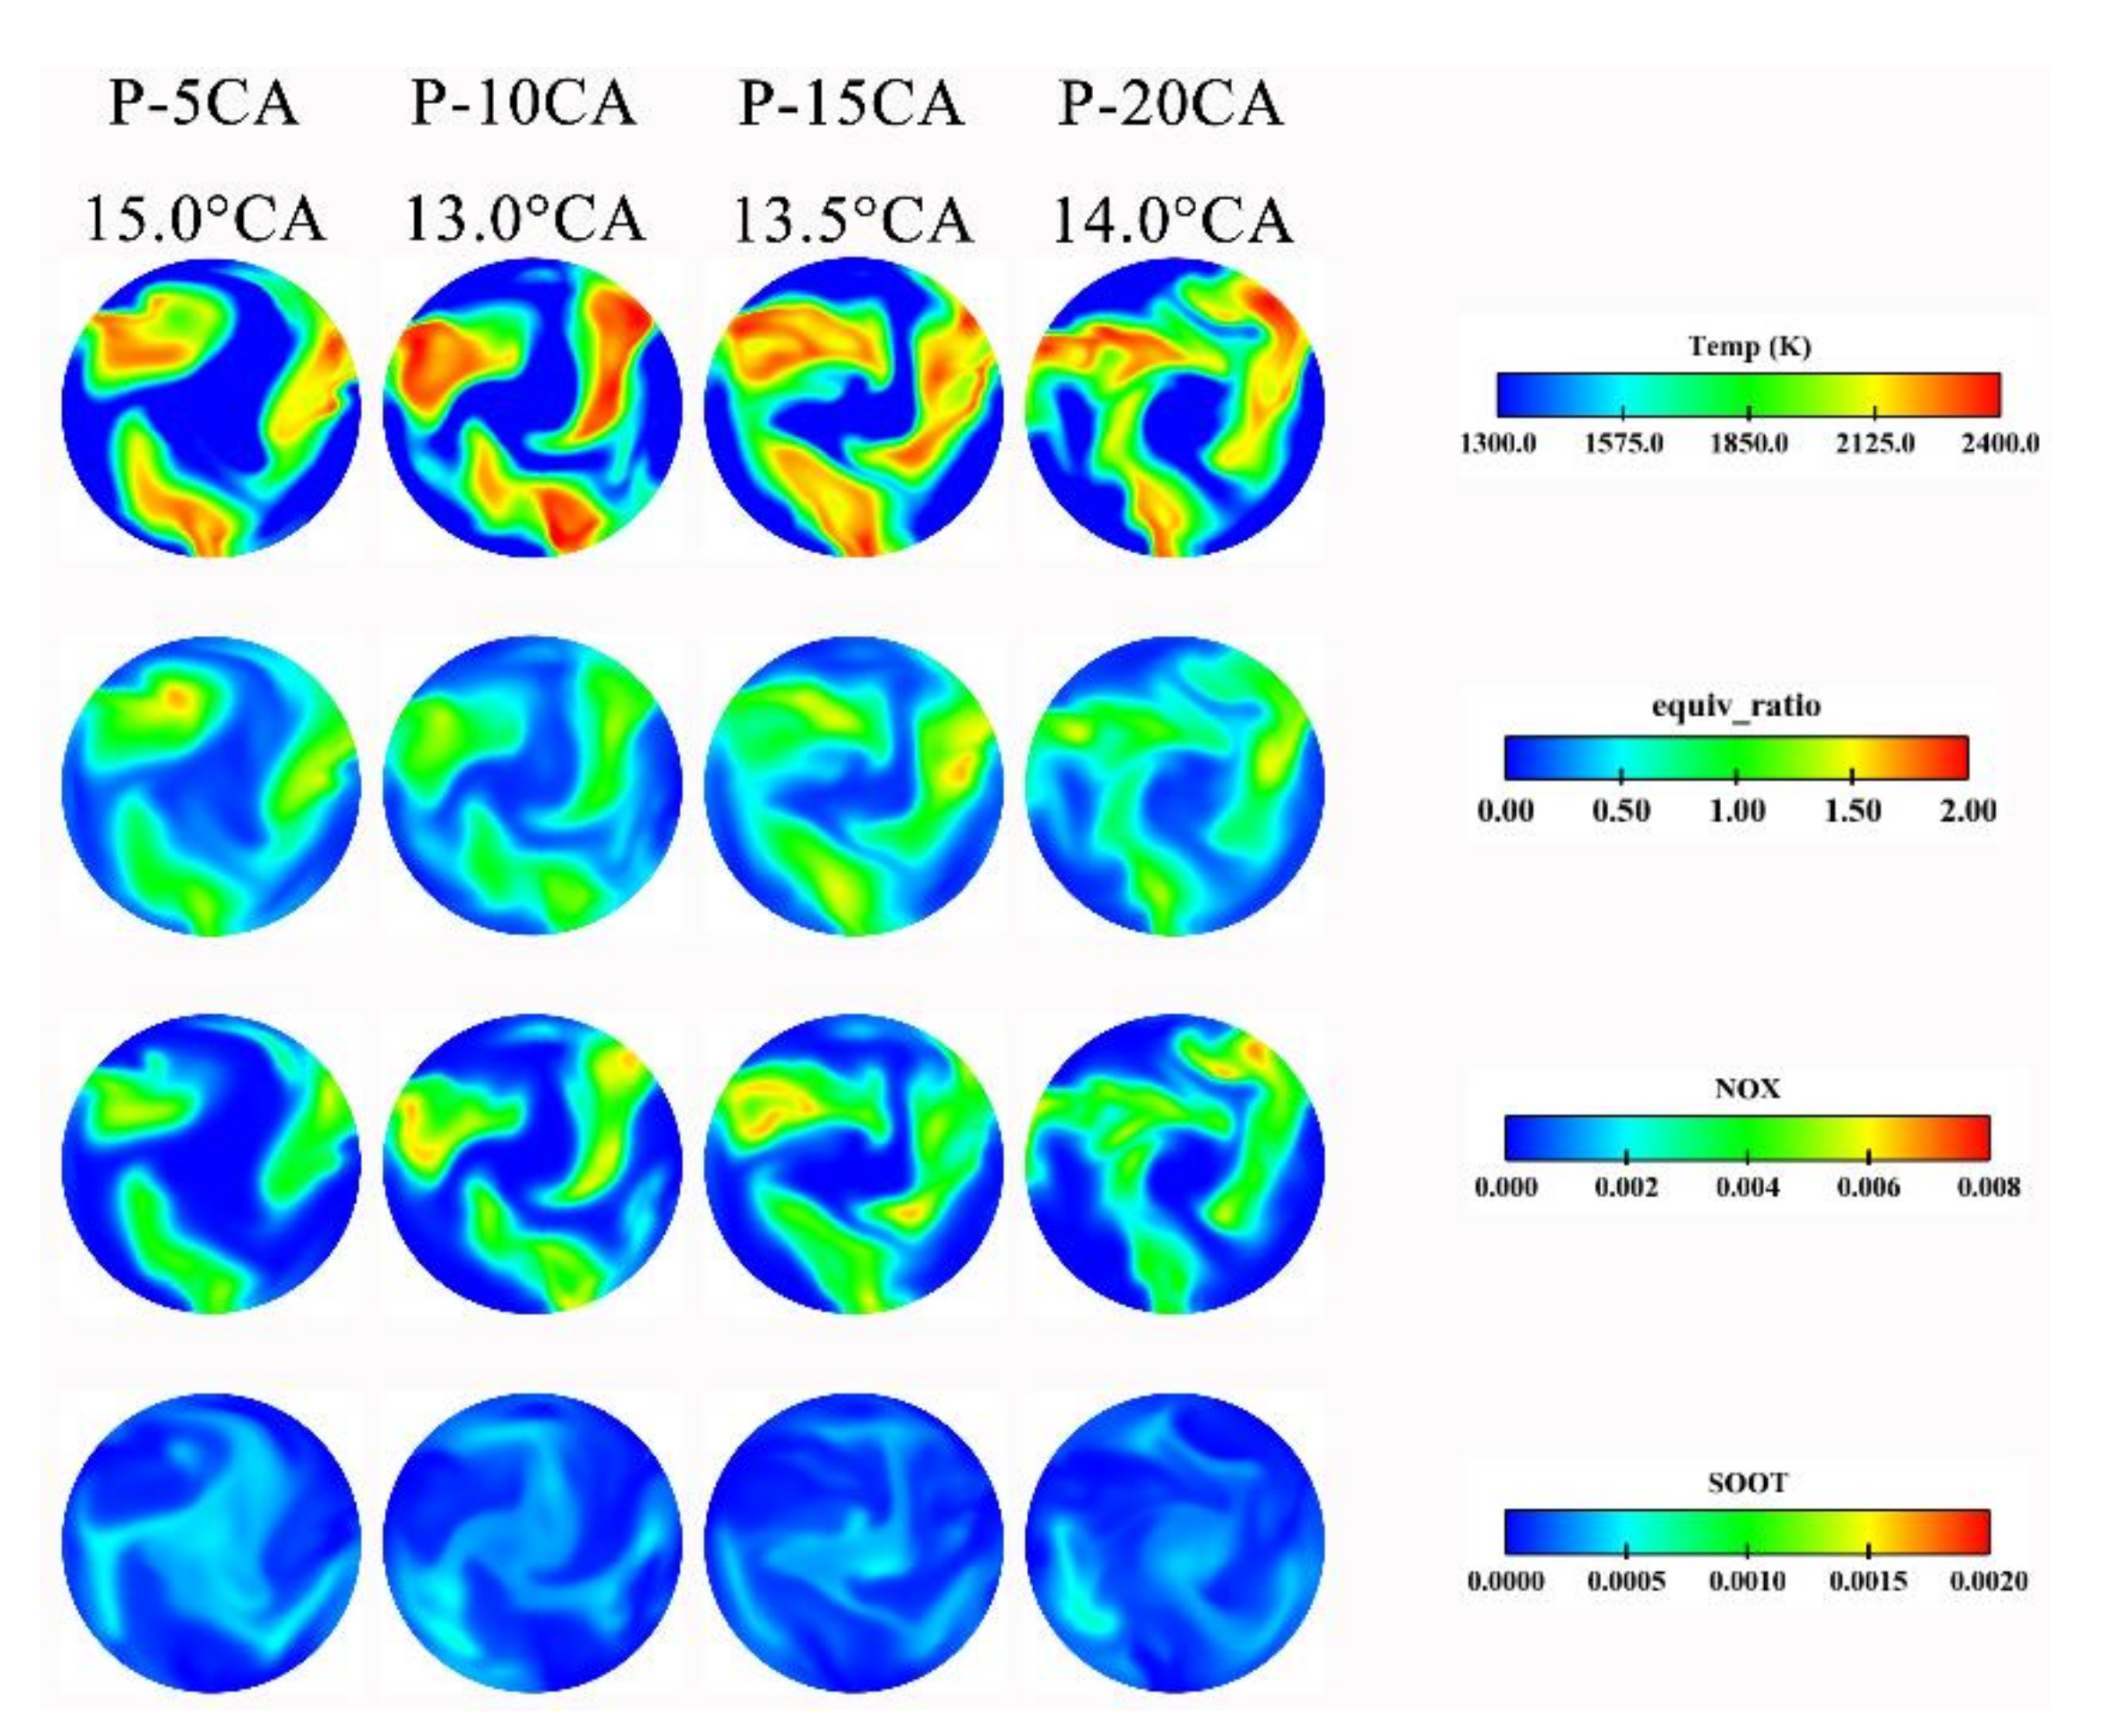
3.4. In-Cylinder Distribution of Final Phase of Combustion

With the increase of pilot injection proportion, 90% of the accumulative heat release time of P0M100 to P30M70 varied from 26.5 °CA ATDC to 19 °CA ATDC. The primary reason for the advance of the end of combustion was the decreasing injection mass ratio. With similar heat release, the interval between the middle and final stages of combustion decreased with an increase of the pilot injection mass ratio, which also led to the excessive speed of pressure rise. The in-cylinder pressure rises, then led to a partial temperature increase.
As shown in Figure 14, the area of the high-temperature zone increased, which brought in deteriorated NOx emission. On the other hand, the trade-off relationship with NOx resulted in a decreased soot emission zone. For different pilot injection timing, the final time was advanced firstly and lagged with the change. The interval between the middle and the end of injection P-10CA was the shortest. As indicated by the above analysis of the pilot injection mass ratio, the heat release time was shorter, resulting in a faster increase in pressure and higher temperature. As shown in Figure 15, there was a significant increase in zones of high-temperature and NOx formation.

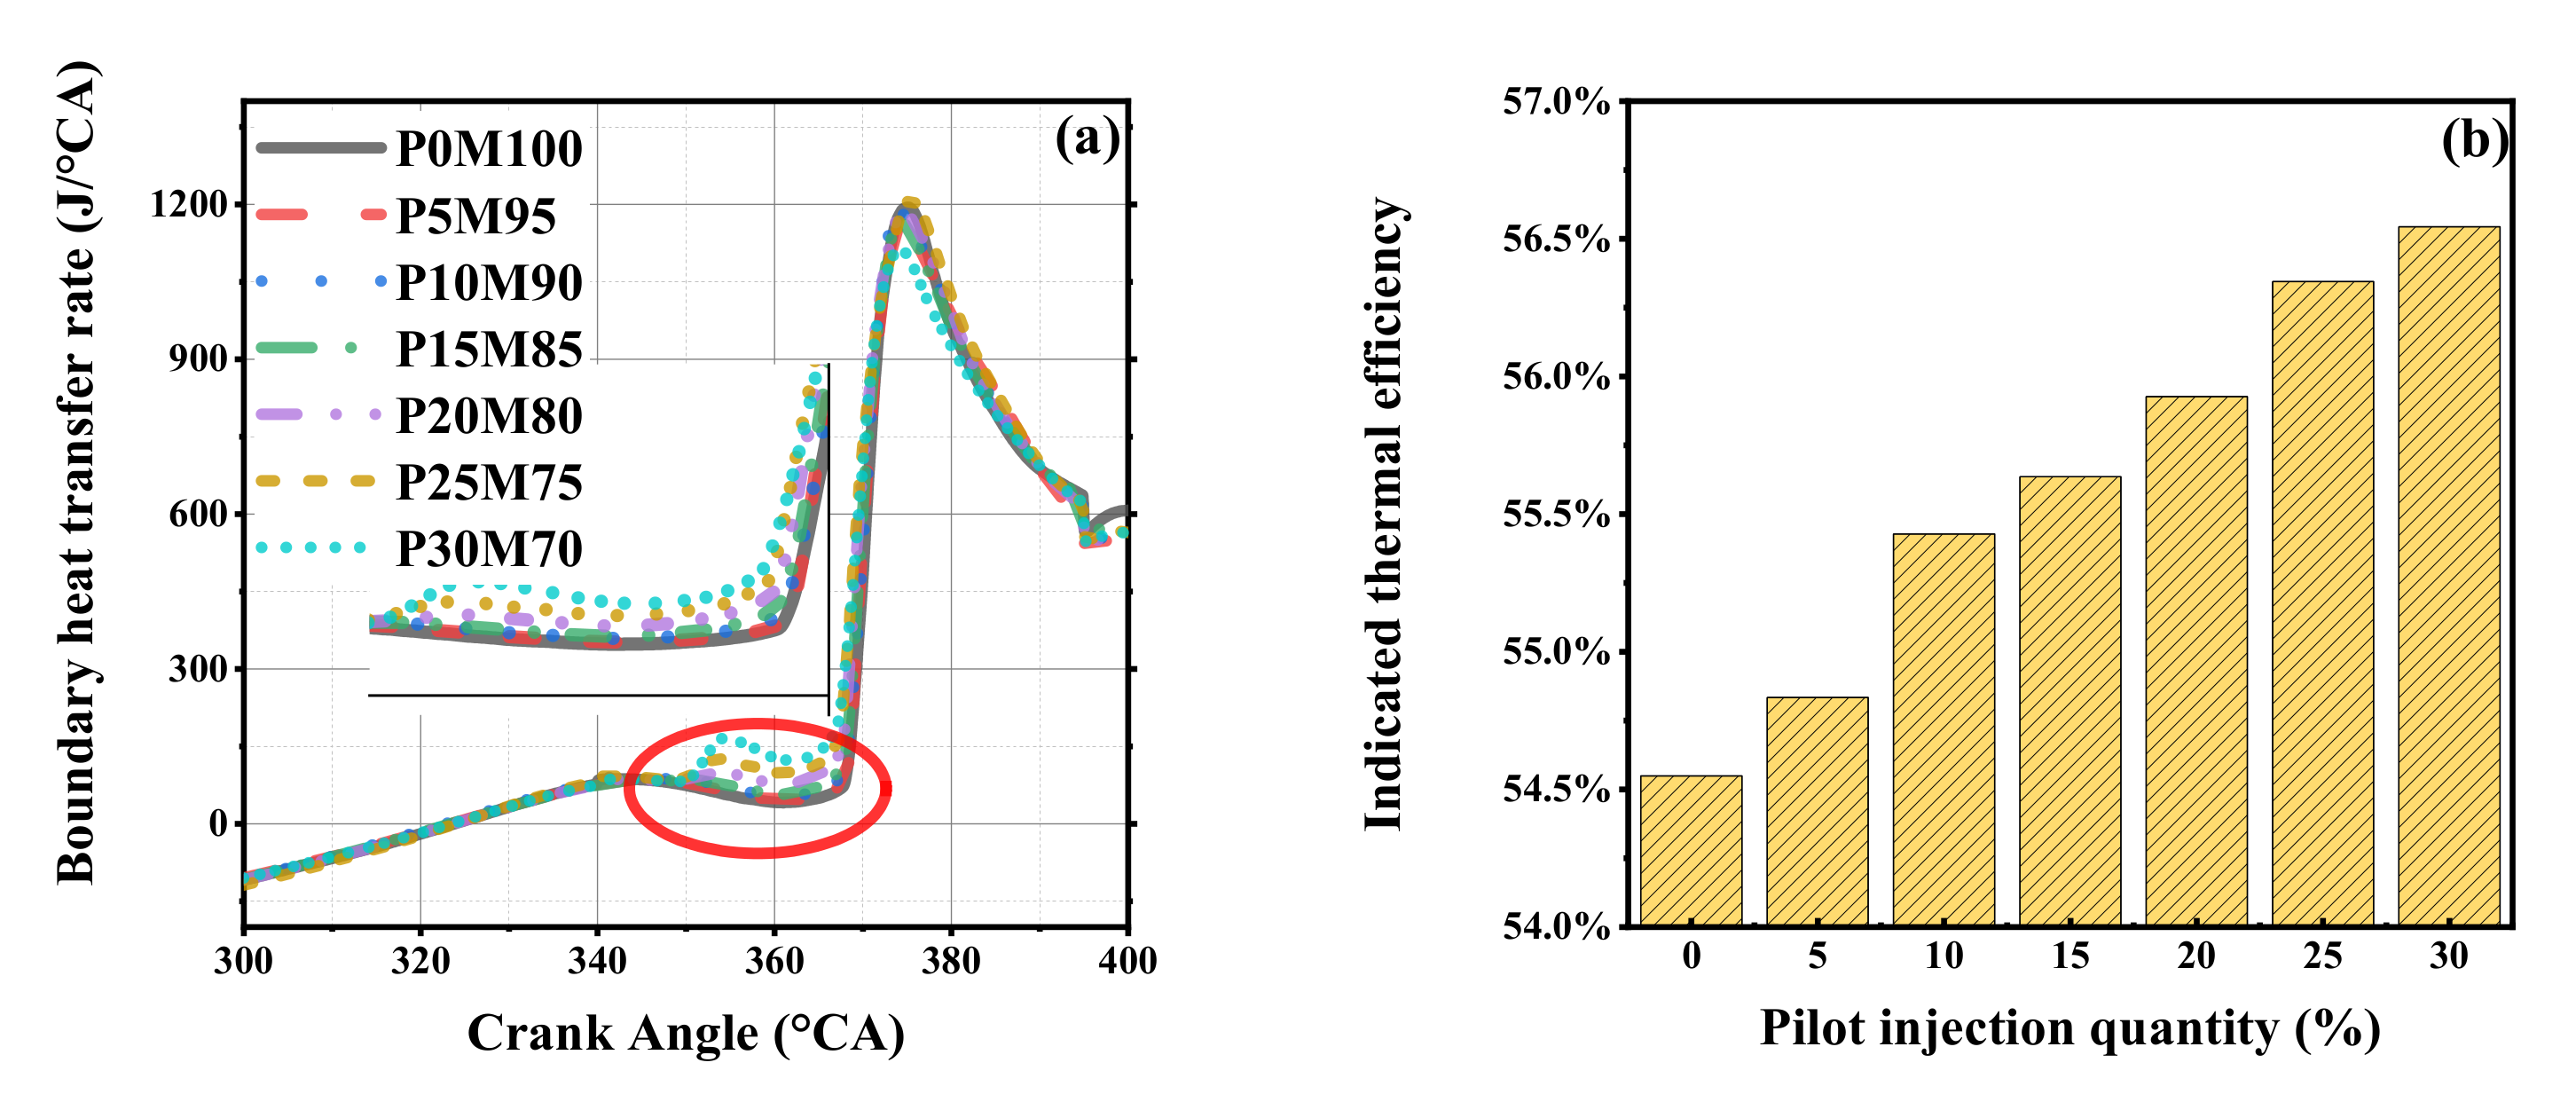
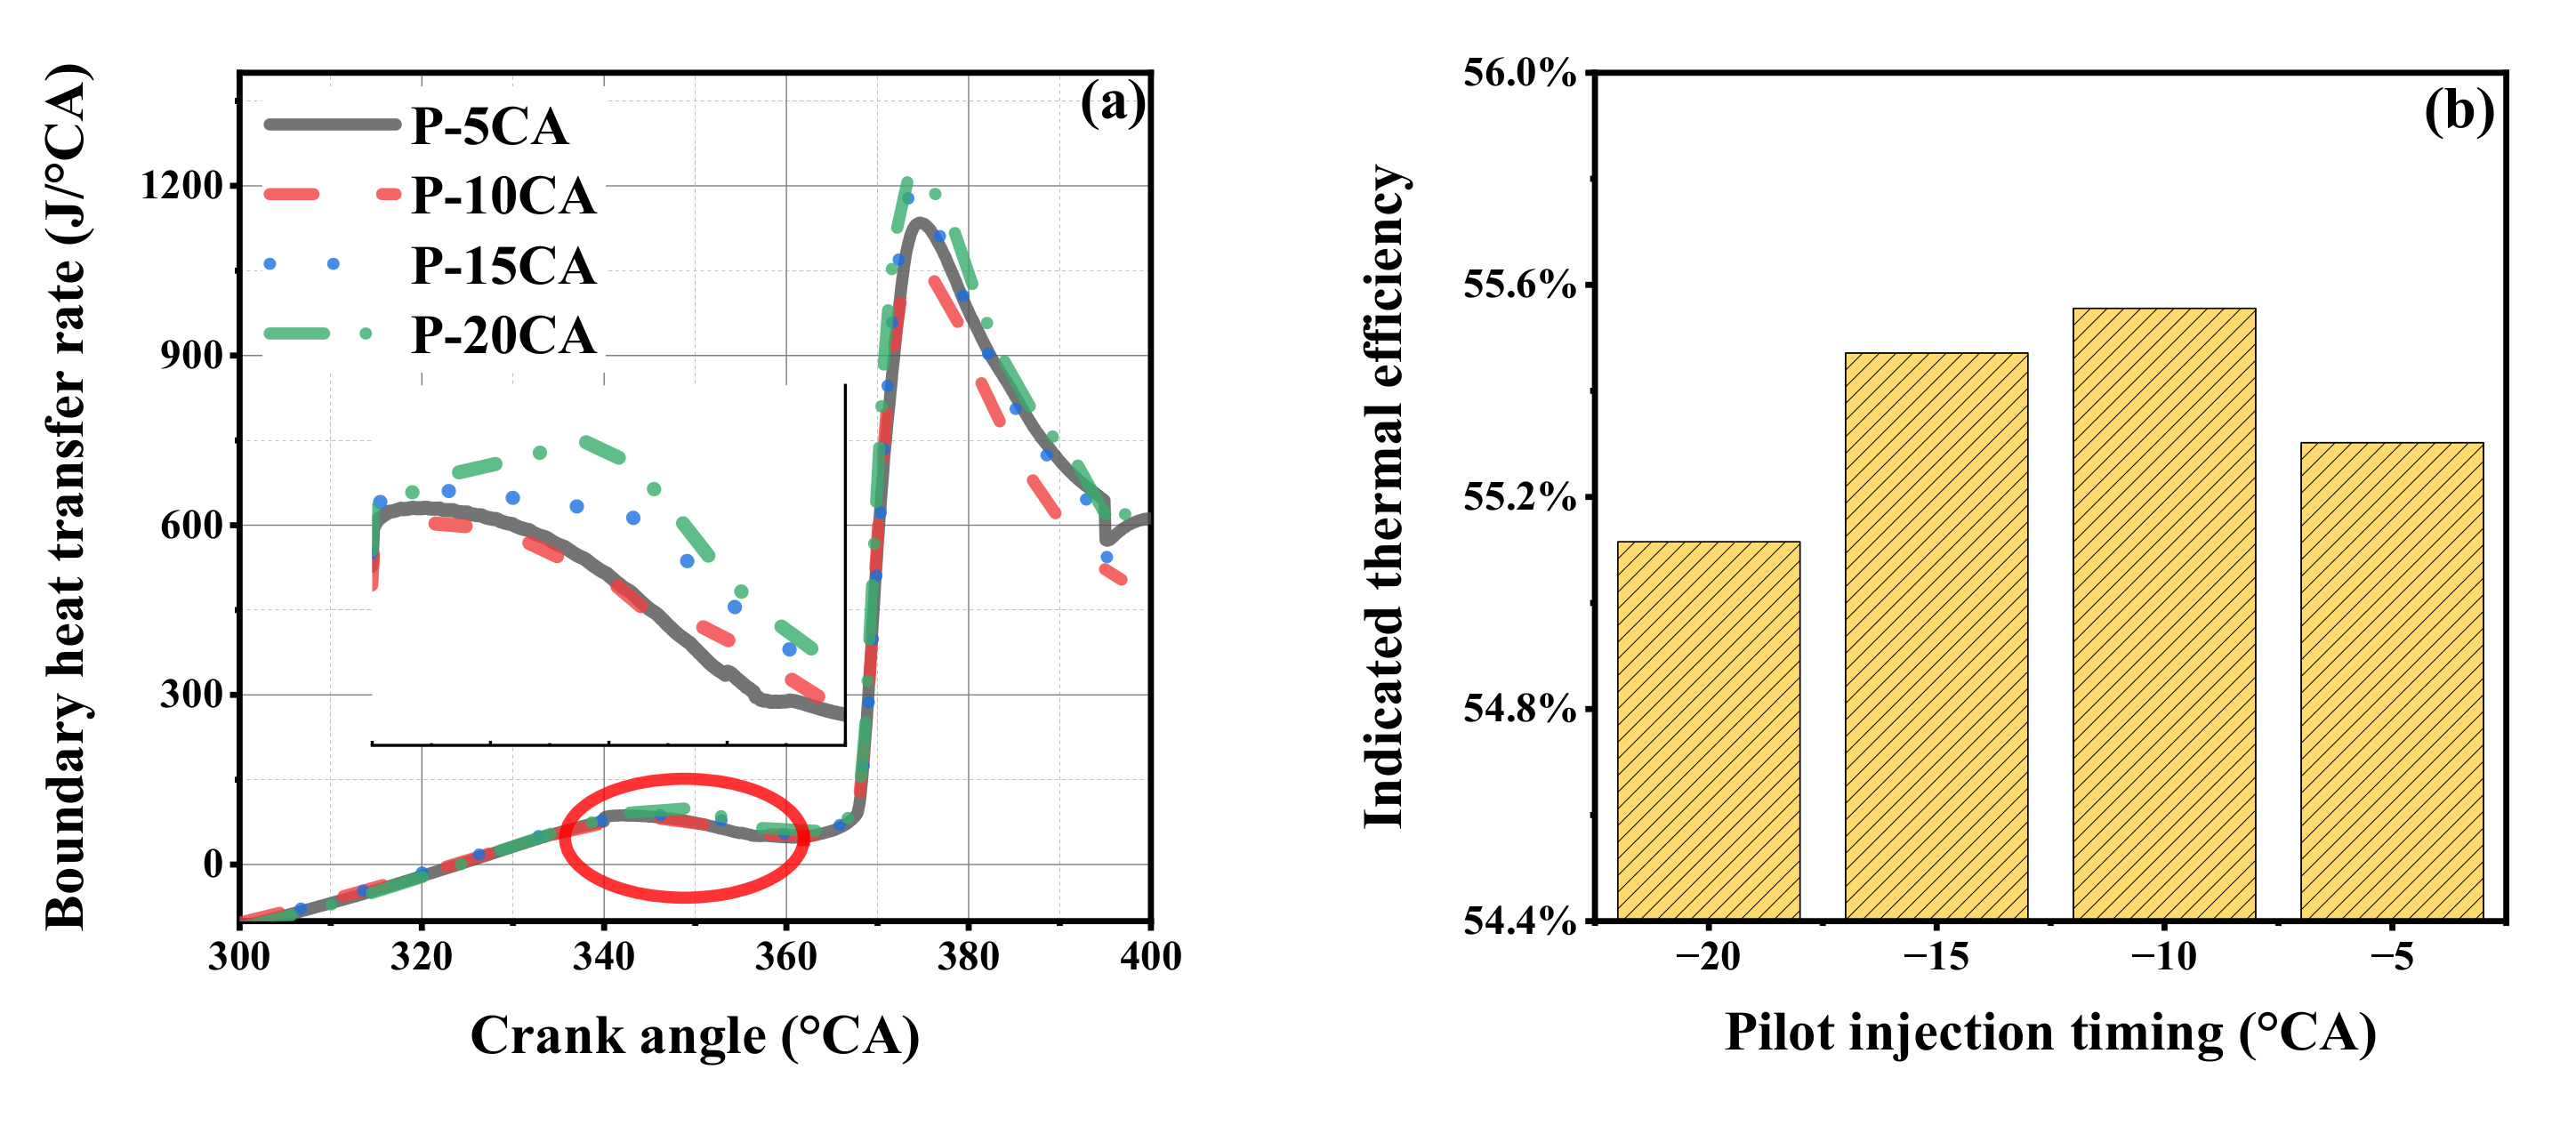
3.5. Boundary Heat Transferring

The wall heat transfer data are shown in Figure 16a. The positive value indicated that the direction of heat flow was from the system to the boundary, and a negative value indicated the opposite. With the increasing the pilot injection mass ratios, the boundary heat transfer rate in the later stage of combustion was decreasing. The reason was that the pilot injection increased the combustion speed in the cylinder. The rapid temperature rise accelerated the oxidation of soot and reduced its net formation. Especially in the late stage of combustion, high-temperature oxidation of soot was the main cause of heat loss.
As shown in Figure 16b, when the pilot injection mass ratio reached 30%, the indicated thermal efficiency was increased by about 2%, comparing to the case where no pilot injection was introduced. On the other hand, since the calculation in this simulation was the single-cycle combustion process of the engine, the simulation’s final timing was when the exhaust valve was about to open, so the in-cylinder temperature at the final moment was used to characterize the exhaust temperature qualitatively. It can be seen from Figure 17 that as the proportion of pilot injection mass ratio increased, the average temperature in the cylinder showed a downward trend, which meant that the energy of the exhaust gas in the cylinder gradually decreased, and the boundary heat transfer decreased at the later stage. The temperature of the mixed gas decreased, too. It can be inferred that more energy was used for the engine to provide work output, which was then manifested as an increase in the engine’s indicated thermal efficiency. The interaction between them improved the overall indicated thermal efficiency.
The wall heat transfer data about different timings were shown in Figure 18a. Compared to the other cases, the indicated thermal efficiency of P-10CA was increased by about 0.5%, as shown in Figure 18b. When the injection timing of the pilot injection was advanced, because the temperature and pressure in the cylinder were at a lower level, the premixing time between the pilot injection and the air increased, and the combustion duration of the pilot injection was longer. At the same time, the increase in premixing time also led to an increase in soot formation in the cylinder. Combined with the previous heat loss analysis, the heat exchange was mainly through the heat release of soot in the cylinder. Increased soot formation and longer heat exchange time would increase the heat exchange at the beginning of combustion. However, it could also be seen from Figure 18a that the heat transfer rate at the beginning of combustion was relatively low. On the one hand, the timing of the pilot injection was too advanced, which would increase the heat dissipation at the beginning of the combustion, thereby weakening the ignition effect of the main injection fuel. This made the main injection combustion in a diffuse combustion state and increased the soot production in the middle and late stages of combustion. On the other hand, when the pilot injection timing was too close to the main injection timing, the combustion in the two injection cylinders interfered with each other.
After the main injection, the mixture in the cylinder became more uneven, and the overall combustion was dominated by fluctuating diffusion combustion, which increased the soot generation in the cylinder. Besides, it can be seen from Figure 19 that with the advancement of the pilot injection timing, the average temperature in the cylinder showed a trend of decreasing firstly and then increasing, which was consistent with the changing trend of the maximum boundary heat transfer rate in the later stage of boundary heat transfer. The minimum heat transfer and the maximum drop in the temperature of the mixed gas can infer that the most energy was used for the engine’s power output, which in turn represented an increase in the engine’s indicated thermal efficiency. It was also the same as the trend of the obtained indicated effective thermal efficiency. Combined with the results of boundary heat transfer and mean temperature, it can also be seen that the inappropriate introduction of pilot combustion (too early or too late) increased the heat loss in the later stage of combustion and the mean temperature. The boundary heat transfer rate of different timings changed little in the early stage and showed a quadratic trend in the later stage of combustion.

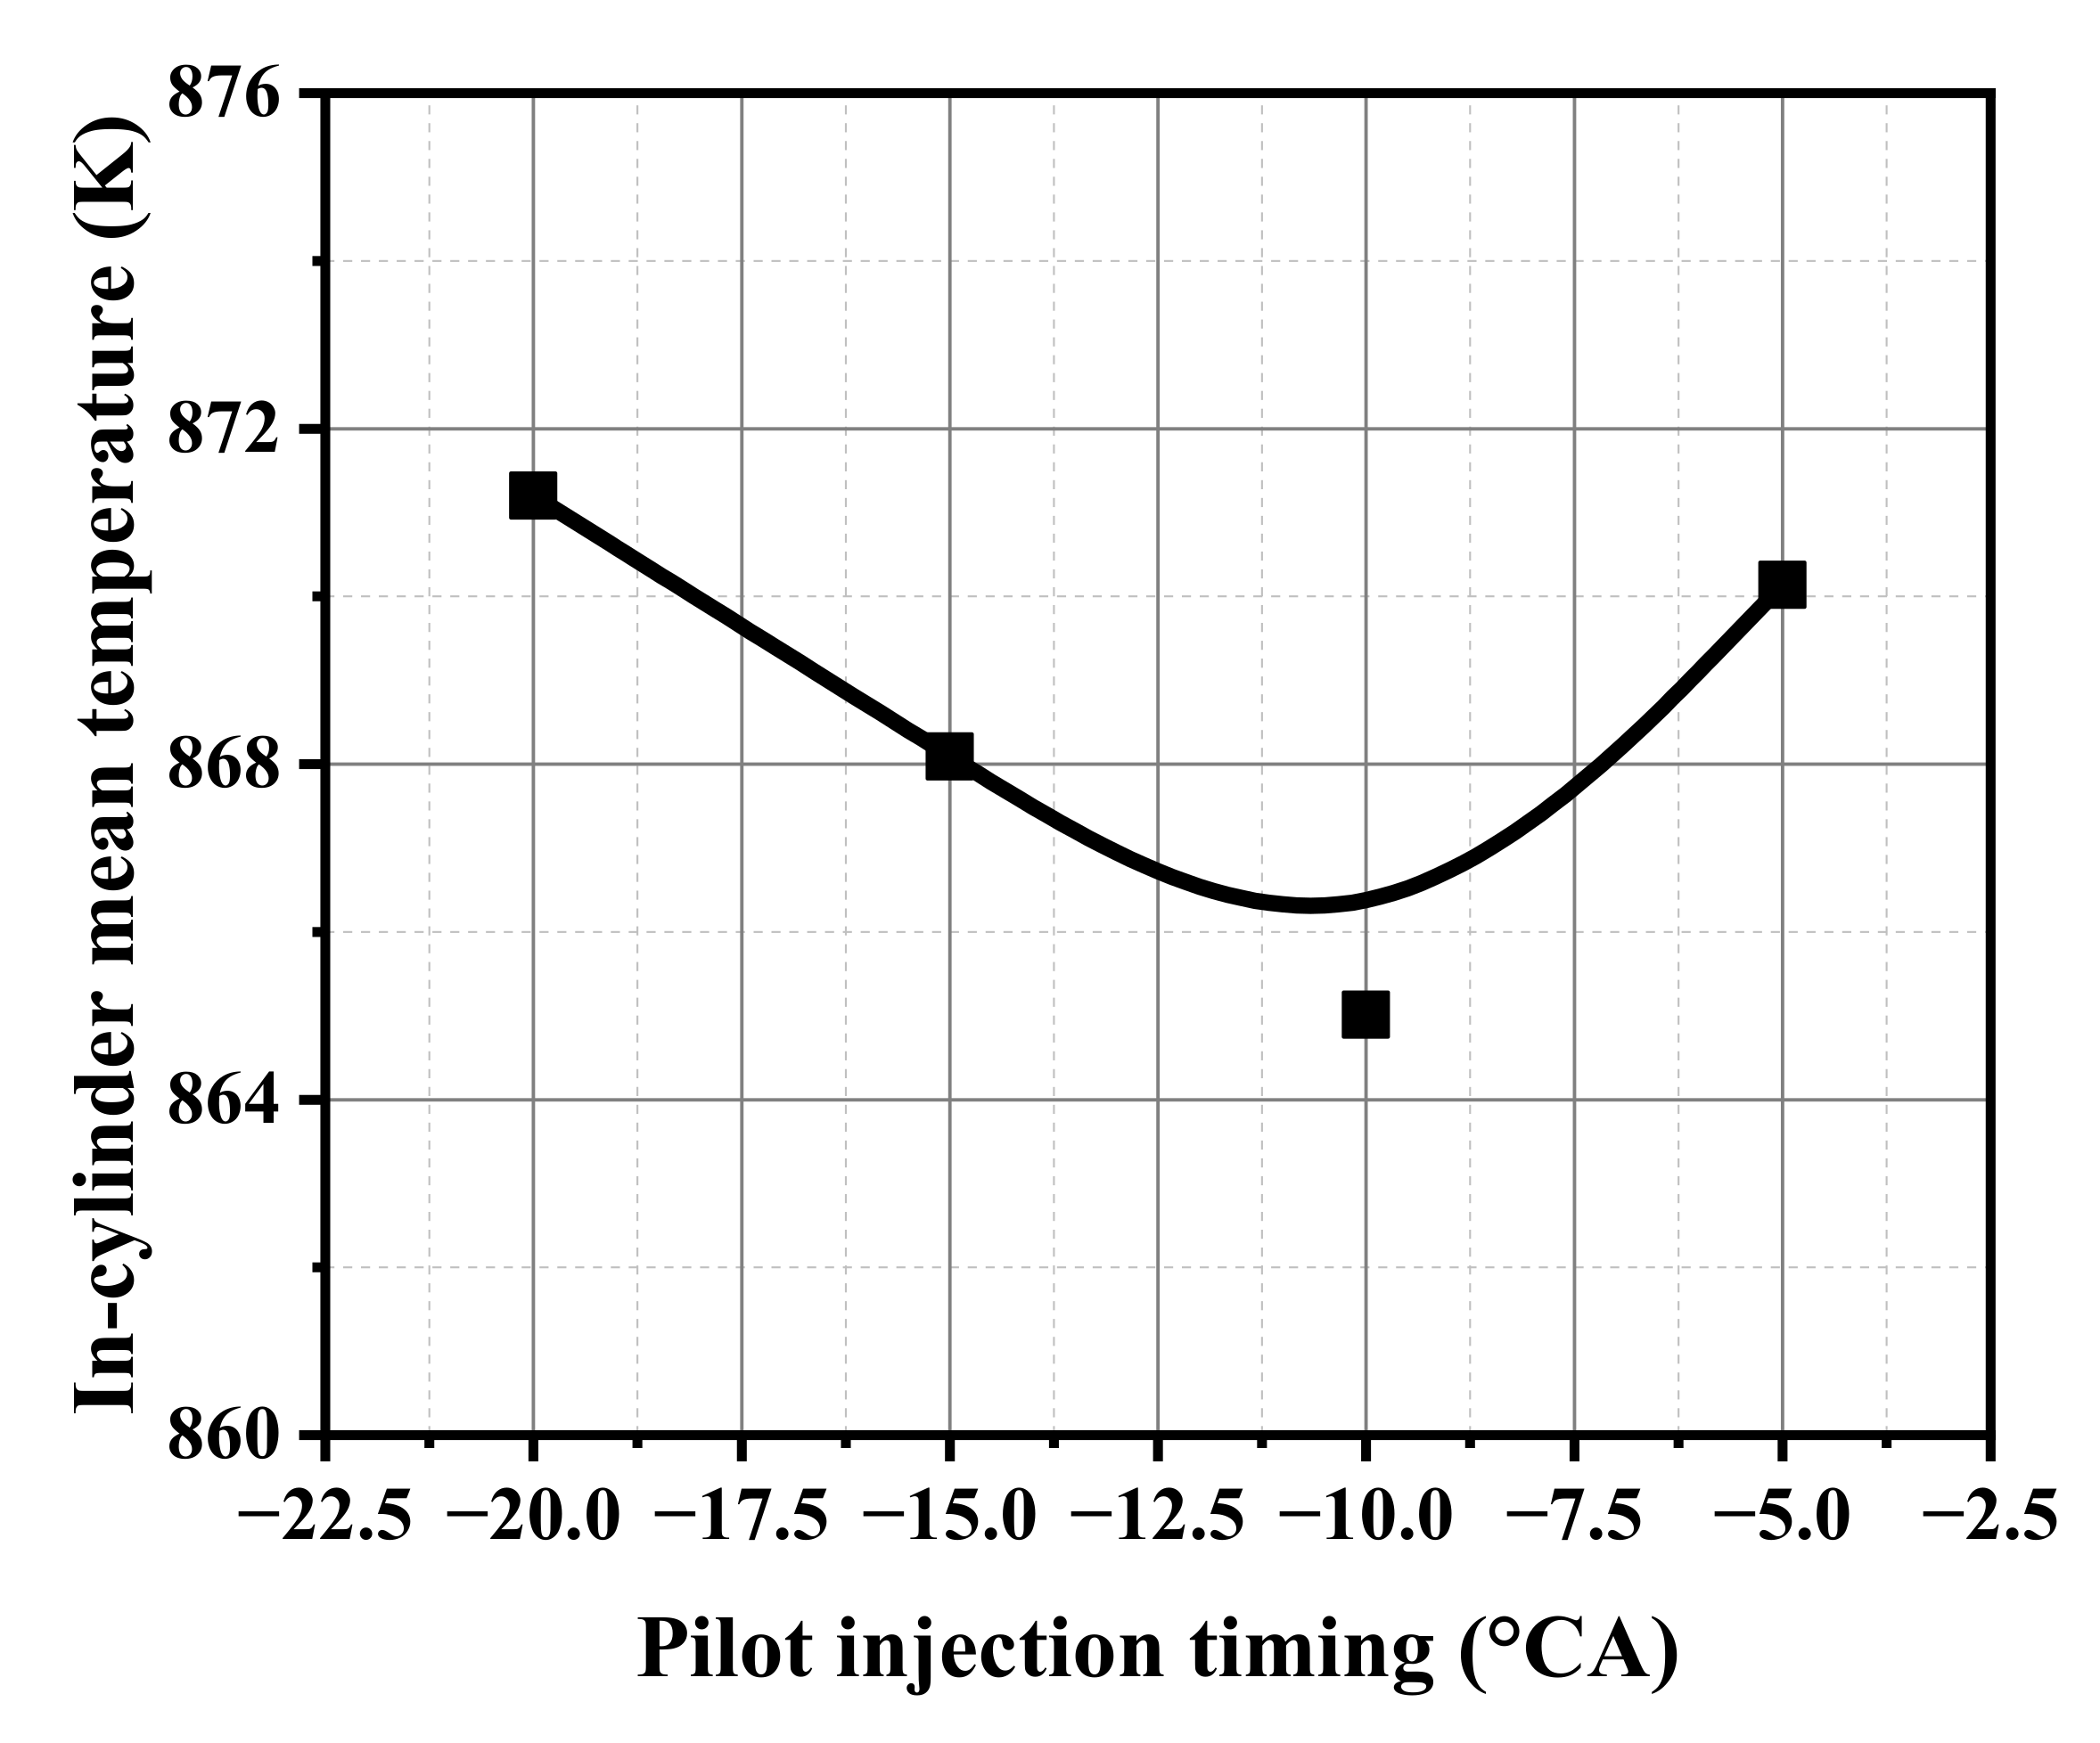
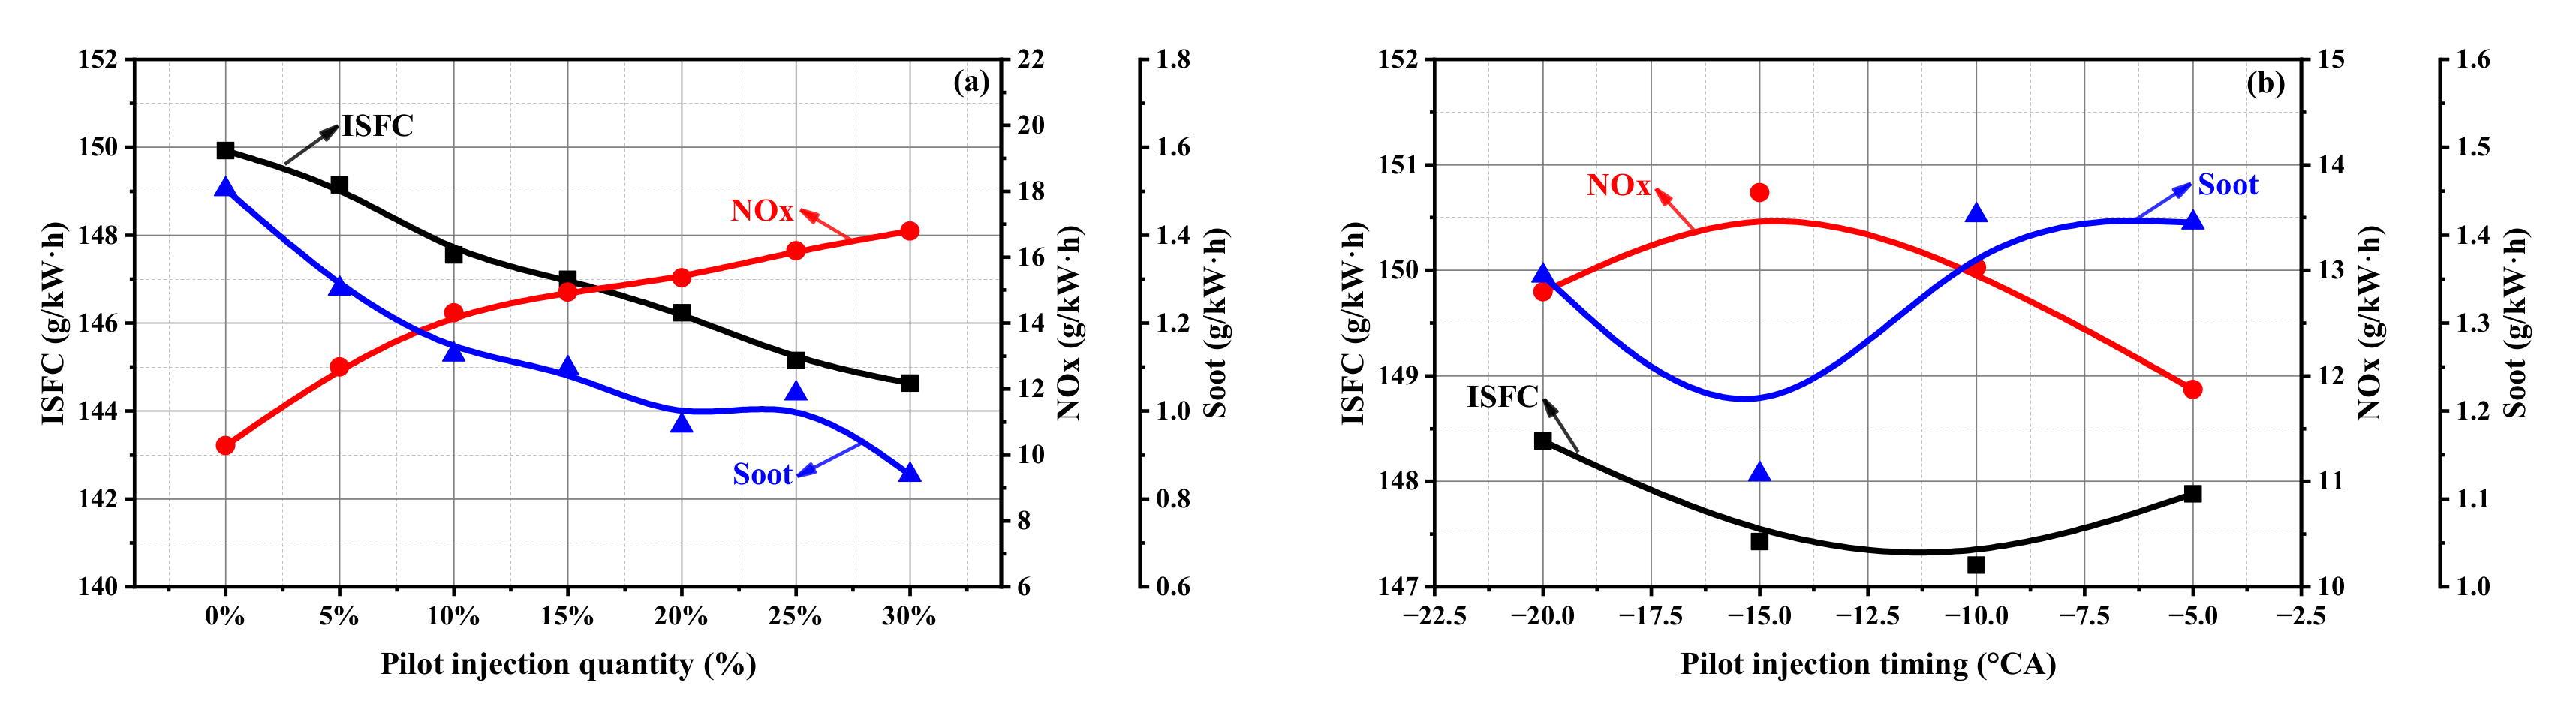
3.6. Overall Performance

Combining Figure 3 and Figure 20a, it can be seen that the increase of pilot injection proportion made the combustion more concentrated, thereby increasing indicated thermal efficiency [40] and reducing fuel consumption. However, the increase of the high-temperature zone increased NOx emission, mainly due to the rapid increase of temperature in the middle-to-final stage of combustion. When pilot injection timing kept the same, NOx showed an upward tendency with increasing pilot injection mass ratio [50]. The influence of pilot injection on NOx emission showed a different trend compared to soot emission and fuel consumption. As illustrated in Figure 20b, fuel consumption was firstly reduced and then increased by the advance of pilot injection timing. P-10CA had the greatest effect on the reduction of fuel consumption [49]. For pollutant emission, NOx emissions also performed a similar tendency as high-temperature zone. The NOx emission of P-15CA was the highest rather than P-10CA. There was an optimal pilot injection timing, which kept the minimum fuel consumption and the emission value relatively low. In this study, P-10CA was the optimal operating condition.

4. Conclusions

The main objective of the present study was to understand the pilot-main injection mixing process and its impact on the combustion and emissions characteristics of low-speed two-stroke diesel engines. A three-dimensional simulation was applied to model the combustion process of a test marine diesel engine. In terms of the fuel-air mixing characteristics, the pilot injection resulted in a prolonged mixing time than the main injection, which was confirmed by the heat release rate curve. There was a significant difference in the peak of premixed combustion between pilot injection and main injection. The pilot injection could provide the unburned soot for the main injection’s ignition in the initial phase. Regarding the combustion, the pilot injection would reduce the intervals between the middle and final stages of combustion, raising the temperature. Thus, adopting the pilot injection strategy would maintain a higher in-cylinder temperature and pressure. Due to the decreasing soot emissions by high temperature and the decreased intervals, the main boundary heat reduced by a lower heat transfer rate and shorter heat transfer time. The pilot injection mass ratio had a linear effect on indicated thermal efficiency and emissions, while pilot injection timing showed a quadratic effect. The pilot injection mass ratio rose to 30%, which could effectively increase the original engine’s thermal efficiency by 2%. By adjusting the pilot injection’s timing, it was possible to reduce part of the NOx emissions while maintaining thermal efficiency. Overall, the numerical results from the present study described the in-cylinder combustion process with pilot injection in the two-stroke marine diesel engines and confirmed that pilot injection was an effective approach to improve the indicated thermal efficiency; meanwhile, to decrease NOx emissions, the low-temperature combustion (LTC) strategy should as well be applied.

Author Contributions

Conceptualization, X.L. and Z.L.; methodology, K.W.; software, Z.L.; validation, Z.L., Z.Z. and X.W.; formal analysis, X.L. and Z.L.; investigation, C.X.; resources, X.L.; data curation, X.L.; writing—original draft preparation, Z.L.; writing—review and editing, X.L.; visualization, K.W.; supervision, X.L.; project administration, X.L.; funding acquisition, X.L. and B.L. All authors have read and agreed to the published version of the manuscript.

Funding

This work was fund by the National Natural Science Foundation of China (NO. 51976135 and NO. 21961122007) and the Marine Low-Speed Engine Pro-ject (Phase I) of MIIT.

Institutional Review Board Statement

Not applicable.

Informed Consent Statement

Not applicable.

Data Availability Statement

Not applicable.

Acknowledgments

This work was supported by the National Natural Science Foundation of China (NO. 51976135 and NO. 21961122007). The authors also thank the support of the Marine Low-Speed Engine Project (Phase I) of MIIT and the State Key Laboratory of Engines (Tianjin University).

Conflicts of Interest

The authors declare no conflict of interest.

Abbreviations

The following abbreviations are used in this manuscript:
°CA ATDCDegree crank angle after top dead center
°CA BTDCDegree crank angle before top dead center
°CADegree crank angle
CONVERGE3-dimesional CFD software
KH-RTKelvin-Helmholtz and Rayleigh-Taylor Breakup Model
RNG K-εRenormalization Group K-ε turbulence model
SAGEDetailed chemical kinetics model in CONVERGE
CTCCharacteristic time combustion model
Hiroyasu-NSCHiroyasu model coupled with Nagle and Strickland-Constable model

References

  1. Jia, X.; Sun, B.; Wu, D.-W.; Xu, D.; Zang, W.; Shang, W.; Wang, J. Analysis on the Influence of Key Parameters of Control Valve on the Performance Characteristics of Electromagnetic Injector. SAE Tech. Pap. Ser. 2017, 1. [Google Scholar] [CrossRef]
  2. Sun, Z.-Y.; Li, G.-X.; Chen, C.; Yu, Y.-S.; Gao, G.-X. Numerical investigation on effects of nozzle’s geometric parameters on the flow and the cavitation characteristics within injector’s nozzle for a high-pressure common-rail DI diesel engine. Energy Convers. Manag. 2015, 89, 843–861. [Google Scholar] [CrossRef]
  3. Li, R.; Meng, X.; Xie, Y. A tribological analysis on stuffing box-piston rod system of low-speed marine diesel engines. Int. J. Engine Res. 2019, 20, 911–930. [Google Scholar] [CrossRef]
  4. Babu, D.; Karvembu, R.; Ramanathan, A. Impact of split injection strategy on combustion, performance and emissions characteristics of biodiesel fuelled common rail direct injection assisted diesel engine. Energy 2018, 165, 577–592. [Google Scholar] [CrossRef]
  5. Fan, L.; Wen, L.; Bai, Y.; Lan, Q.; Lu, Z. Influential factors on pressure characteristics of fuel system for a low-speed marine diesel engine. Int. J. Engine Res. 2020, 12, 1468087420917284. [Google Scholar] [CrossRef]
  6. Yoon, S.H.; Cha, J.P.; Lee, C.S. An investigation of the effects of spray angle and injection strategy on dimethyl ether (DME) combustion and exhaust emission characteristics in a common-rail diesel engine. Fuel Process. Technol. 2010, 91, 1364–1372. [Google Scholar] [CrossRef]
  7. Andreadis, P.; Zobanakis, A.; Chryssakis, C.; Kaiktsis, L. Effects of fuel injection parameters on performance and emissions formation in a large-bore marine diesel engine. Int. J. Engine Res. 2010, 1, 1–14. [Google Scholar] [CrossRef]
  8. Wang, D.; Shi, L.; Zhu, S.; Liu, B.; Qian, Y.; Deng, K. Numerical and thermodynamic study on effects of high and low pressure exhaust gas recirculation on turbocharged marine low-speed engine. Appl. Energy 2020, 261, 114346. [Google Scholar] [CrossRef]
  9. Mera, Z.; Fonseca, N.; López, J.-M.; Casanova, J. Analysis of the high instantaneous NOx emissions from Euro 6 diesel passenger cars under real driving conditions. Appl. Energy 2019, 242, 1074–1089. [Google Scholar] [CrossRef]
  10. Park, S.; Cho, J.; Park, J. Numerical methodology on virtual model extension and system-level optimization of light-duty diesel vehicle with dual-loop exhaust gas recirculation. Appl. Energy 2019, 242, 1422–1435. [Google Scholar] [CrossRef]
  11. Beatrice, C.; Denbratt, I.; Di Blasio, G.; Di Luca, G.; Ianniello, R.; Saccullo, M. Experimental Assessment on Exploiting Low Carbon Ethanol Fuel in a Light-Duty Dual-Fuel Compression Ignition Engine. Appl. Sci. 2020, 10, 7182. [Google Scholar] [CrossRef]
  12. Fang, J.; Meng, Z.; Li, J.; Du, Y.; Qin, Y.; Jiang, Y.; Bai, W.; Chase, G.G. The effect of operating parameters on regeneration characteristics and particulate emission characteristics of diesel particulate filters. Appl. Therm. Eng. 2019, 148, 860–867. [Google Scholar] [CrossRef]
  13. Stamatellou, A.-M.; Stamatelos, A. Overview of Diesel particulate filter systems sizing approaches. Appl. Therm. Eng. 2017, 121, 537–546. [Google Scholar] [CrossRef]
  14. Konstandopoulos, A.G.; Kostoglou, M.; Beatrice, C.; Di Blasio, G.; Imren, A.; Denbratt, I. Impact of combination of EGR, SCR, and DPF technologies for the low-emission rail diesel engines. Emiss. Control Sci. Technol. 2015, 1, 213–225. [Google Scholar] [CrossRef] [Green Version]
  15. Gao, J.; Tian, G.; Sorniotti, A.; Karci, A.E.; Di Palo, R. Review of thermal management of catalytic converters to decrease engine emissions during cold start and warm up. Appl. Therm. Eng. 2019, 147, 177–187. [Google Scholar] [CrossRef]
  16. Bai, S.; Han, J.; Liu, M.; Qin, S.; Wang, G.; Li, G.-X. Experimental investigation of exhaust thermal management on NOx emissions of heavy-duty diesel engine under the world Harmonized transient cycle (WHTC). Appl. Therm. Eng. 2018, 142, 421–432. [Google Scholar] [CrossRef]
  17. Poorghasemi, K.; Ommi, F.; Yaghmaei, H.; Namaki, A. An investigation on effect of high pressure post injection on soot and NO emissions in a DI diesel engine. J. Mech. Sci. Technol. 2012, 26, 269–281. [Google Scholar] [CrossRef]
  18. Korkmaz, M.; Zweigel, R.; Jochim, B.; Beeckmann, J.; Abel, D.; Pitsch, H. Triple-injection strategy for model-based control of premixed charge compression ignition diesel engine combustion. Int. J. Engine Res. 2018, 19, 230–240. [Google Scholar] [CrossRef]
  19. O’Connor, J.; Musculus, M. Post injections for soot reduction in diesel engines: A review of current under-standing. SAE Int. J. Engines 2013, 6, 400–421. [Google Scholar] [CrossRef] [Green Version]
  20. Cung, K.; Moiz, A.; Johnson, J.; Le, S.-Y.; Kweon, C.-B.; Montanaro, A. Spray–combustion interaction mechanism of multiple-injection under diesel engine conditions. Proc. Combust. Inst. 2015, 35, 3061–3068. [Google Scholar] [CrossRef] [Green Version]
  21. Beatrice, C.; Di Blasio, G.; Belgiorno, G. Experimental analysis of functional requirements to exceed the 100 kW/l in high-speed light-duty diesel engines. Fuel 2017, 207, 591–601. [Google Scholar] [CrossRef]
  22. Babu, J.M.; Prasad, K.S.; Ganji, P.R.; Ravikiran, C.; Velu, R. Analysis on the effect of pilot injection strategies on combustion and emission characteristics of palm-munja biodiesel/diesel blend on CRDI diesel engine. Int. J. Ambient. Energy 2019, 1–4. [Google Scholar] [CrossRef]
  23. Lee, J.; Hong, K.; Choi, S.; Yu, S.; Choi, H.; Min, K. Comparison of the effects of multiple injection strategy on the emissions between moderate and heavy EGR rate conditions: Part 1-pilot injections. J. Mech. Sci. Technol. 2013, 27, 1135–1141. [Google Scholar] [CrossRef]
  24. Yadav, J.; Ramesh, A. Comparison of Single and Multiple Injection Strategies in a Butanol Diesel Dual Fuel Engine. J. Energy Resour. Technol. 2018, 140, 072206. [Google Scholar] [CrossRef]
  25. Park, C.; Busch, S. The influence of pilot injection on high-temperature ignition processes and early flame structure in a high-speed direct injection diesel engine. Int. J. Engine Res. 2017, 19, 668–681. [Google Scholar] [CrossRef]
  26. Yin, L.; Lundgren, M.; Wang, Z.; Stamatoglou, P.; Richter, M.; Andersson, Ö.; Tunestål, P. High efficient internal combustion engine using partially premixed combustion with multiple injections. Appl. Energy 2019, 234, 516–523. [Google Scholar] [CrossRef]
  27. Gao, T.; Yu, S.; Li, T.; Zheng, M. Impacts of multiple pilot diesel injections on the premixed combustion of ethanol fuel. Proc. Inst. Mech. Eng. Part D J. Automob. Eng. 2017, 232, 738–754. [Google Scholar] [CrossRef]
  28. Niki, Y.; Nitta, Y.; Sekiguchi, H.; Hirata, K. Diesel Fuel Multiple Injection Effects on Emission Characteristics of Diesel Engine Mixed Ammonia Gas Into Intake Air. J. Eng. Gas Turbines Power 2019, 141, 061020. [Google Scholar] [CrossRef]
  29. Huang, H.; Zhu, Z.; Chen, Y.; Chen, Y.; Lv, D.; Zhu, J.; Ouyang, T. Experimental and numerical study of multiple injection effects on combustion and emission characteristics of natural gas–diesel dual-fuel engine. Energy Convers. Manag. 2019, 183, 84–96. [Google Scholar] [CrossRef]
  30. How, H.; Masjuki, H.H.; Kalam, M.; Teoh, Y. Influence of injection timing and split injection strategies on performance, emissions, and combustion characteristics of diesel engine fueled with biodiesel blended fuels. Fuel 2018, 213, 106–114. [Google Scholar] [CrossRef]
  31. Busch, S.; Zha, K.; Miles, P.C. Investigations of closely coupled pilot and main injections as a means to reduce combustion noise in a small-bore direct injection diesel engine. Int. J. Engine Res. 2015, 16, 13–22. [Google Scholar] [CrossRef]
  32. Lee, C.; Lee, C.; Lee, K. Emission Characteristics for a Homogeneous Charged Compression Ignition Diesel Engine with Exhaust Gas Recirculation Using Split Injection Methodology. Energies 2017, 10, 2146. [Google Scholar] [CrossRef] [Green Version]
  33. Liu, J.; Wang, H.; Zheng, Z.; Li, L.; Mao, B.; Xia, M.; Yao, M. Improvement of high load performance in gasoline compression ignition engine with PODE and multiple-injection strategy. Fuel 2018, 234, 1459–1468. [Google Scholar] [CrossRef]
  34. Le, T.D.; Masjuki, H.H.; How, H.G.; Kalam, M.; Yu, K.H.; Alabdulkarem, A. Effect of two-stage injection dwell angle on engine combustion and performance characteristics of a common-rail diesel engine fueled with coconut oil methyl esters-diesel fuel blends. Fuel 2018, 234, 227–237. [Google Scholar] [CrossRef]
  35. Herfatmanesh, M.R.; Lu, P.; Attar, M.A.; Zhao, H. Experimental investigation into the effects of two-stage injec-tion on fuel injection quantity, combustion and emissions in a high-speed optical common rail diesel engine. Fuel 2013, 109, 137–147. [Google Scholar] [CrossRef] [Green Version]
  36. Maes, N.; Bakker, P.; Dam, N.; Somers, B. Transient Flame Development in a Constant-Volume Vessel Using a Split-Scheme Injection Strategy. SAE Int. J. Fuels Lubr. 2017, 10, 318–327. [Google Scholar] [CrossRef] [Green Version]
  37. Pandey, S.K.; Vandana, S.; Akella, S.S.; Ravikrishna, R. Potential of Early Direct Injection (EDI) for simultaneous NOx and soot emission reduction in a heavy duty turbocharged diesel engine. Appl. Therm. Eng. 2019, 158, 113762. [Google Scholar] [CrossRef]
  38. Taghavifar, H. Application of Divergent Split Injection in A Cidi Diesel Engine To Reduce Emissions And Boost The Efficiency. Transp. 2019, 34, 115–125. [Google Scholar] [CrossRef] [Green Version]
  39. Dawson, M.; Borman, D.; Hammond, R.B.; Lesnic, D.; Rhodes, D. Moving boundary models for the growth of crystalline de-posits from undetected leakages of industrial process liquors. Comput. Chem. Eng. 2014, 71, 331–346. [Google Scholar] [CrossRef] [Green Version]
  40. Gafoor, C.A.; Gupta, R. Numerical investigation of piston bowl geometry and swirl ratio on emission from diesel engines. Energy Convers. Manag. 2015, 101, 541–551. [Google Scholar] [CrossRef]
  41. Abraham, J.; Bracco, F.; Reitz, R. Comparisons of computed and measured premixed charge engine combustion. Combust. Flame 1985, 60, 309–322. [Google Scholar] [CrossRef]
  42. Xin, J.; Ricart, L.; Reitz, R. Computer Modeling of Diesel Spray Atomization and Combustion. Combust. Sci. Technol. 1998, 137, 171–194. [Google Scholar] [CrossRef]
  43. Halstead, M.; Kirsch, L.; Quinn, C. The autoignition of hydrocarbon fuels at high temperatures and pressures—Fitting of a mathematical model. Combust. Flame 1977, 30, 45–60. [Google Scholar] [CrossRef]
  44. Komninos, N.; Rakopoulos, C.D. Heat transfer in hcci phenomenological simulation models: A review. Appl. Energy 2016, 181, 179–209. [Google Scholar] [CrossRef]
  45. Richards, K.J.; Senecal, P.K.; Pomraning, E. Converge v2. 3 Manual; Convergent Science, Inc.: Madison, WI, USA, 2016. [Google Scholar]
  46. Zhang, E.; Liang, X.; Zhang, F.; Yang, P.; Cao, X.; Wang, X.; Yu, H. Evaluation of Exhaust Gas Recirculation and Fuel Injection Strategies for Emission Performance in Marine Two-Stroke Engine. Energy Procedia 2019, 158, 4523–4528. [Google Scholar] [CrossRef]
  47. Liang, X.Y.; Yang, P.J.; Zhang, F.; Zhang, E.X.; Cao, X.Y.; Liu, T. Research on EGR Mechanism of NOx Reduction on a Large-bore Marine Diesel Engine by 3D-CFD Simulation. In Proceedings of the 29th CIMAC World Congress, Vancouver, BC, Canada, 10–14 June 2019; p. 195. [Google Scholar]
  48. Yoon, S.H.; Kim, H.J.; Park, S. Study on optimal combustion strategy to improve combustion performance in a single-cylinder PCCI diesel engine with different combustion chamber geometry. Appl. Therm. Eng. 2018, 144, 1081–1090. [Google Scholar] [CrossRef]
  49. Hwang, J.; Park, Y.; Kim, K.; Lee, J.; Bae, C. Improvement of diesel combustion with multiple injections at cold condition in a constant volume combustion chamber. Fuel 2017, 197, 528–540. [Google Scholar] [CrossRef]
  50. Indudhar, M.R.; Banapurmath, N.R.; Rajulu, K.G.; Khan, T.M.Y.; Manoj, E.K. Effects of single and split injection on the performance, emission and combustion attributes of a CRDI engine powered with diesel and honge biodiesel. Sustain. Energy Fuels 2019, 3, 2275–2286. [Google Scholar] [CrossRef]
Figure 1. Schematic diagram of the x–y plane of the injectors and the injection direction.
Energies 14 00417 g001
Figure 2. Schematic diagram of the z–y plane of the injectors and the injection direction.
Energies 14 00417 g002
Figure 3. Model geometric structure and computational domain for the test engine.
Energies 14 00417 g003
Figure 4. The comparison of pressure in the cylinder of different grid numbers.
Energies 14 00417 g004
Figure 5. The comparison of temperature in the cylinder of different grid numbers.
Energies 14 00417 g005
Figure 6. 1-D Model geometric structure.
Energies 14 00417 g006
Figure 7. The comparison of pressure in the cylinder of 1D simulation and 3D simulation.
Energies 14 00417 g007
Figure 8. Impact of different pilot injection mass ratios on the in-cylinder pressure curves and heat release rate curves.
Energies 14 00417 g008
Figure 9. Impact of different pilot injection timings on the in-cylinder pressure curves and heat release rate curves.
Energies 14 00417 g009
Figure 10. Impact of pilot injection mass ratio on the distribution of temperature, fuel-air equivalence ratio, NOx formation, and soot formation at the moment of 10% accumulative heat release (q10) for various injection cases.
Energies 14 00417 g010
Figure 11. Impact of pilot injection timing on the distribution of temperature, fuel-air equivalence ratio, NOx formation, and soot formation at the moment of q10 for various injection cases.
Energies 14 00417 g011
Figure 12. Impact of pilot injection mass ratio on the distribution of temperature, fuel-air equivalence ratio, NOx formation, and soot formation at the moment of 50% accumulative heat release (q50) for various injection cases.
Energies 14 00417 g012
Figure 13. Impact of pilot injection timing on the distribution of temperature, fuel-air equivalence ratio, NOx formation, and soot formation at the moment of q50 for various injection cases.
Energies 14 00417 g013
Figure 14. Impact of pilot injection mass ratio on the distribution of temperature, fuel-air equivalence ratio, NOx formation, and soot formation at the moment of 90% accumulative heat release (q90) for various injection cases.
Energies 14 00417 g014
Figure 15. Impact of pilot injection timing on the distribution of temperature, fuel-air equivalence ratio, NOx formation, and soot formation at the moment of q90 for various injection cases.
Energies 14 00417 g015
Figure 16. (a) Boundary heat transfer rate curves of different pilot injection mass ratios, positive values represented that the heat flow was towards boundary (b) Indicated thermal efficiency of different pilot injection mass ratios.
Energies 14 00417 g016
Figure 17. In-cylinder mean temperature of different pilot injection mass ratios at the beginning of exhaust.
Energies 14 00417 g017
Figure 18. (a) Boundary heat transfer rate curves of different pilot injection timings, positive values represent that the heat flow was towards boundary (b) Indicated thermal efficiency of different pilot injection timings.
Energies 14 00417 g018
Figure 19. In-cylinder mean temperature of different pilot injection timings at the beginning of exhaust.
Energies 14 00417 g019
Figure 20. (a) The effect of pilot injection quantity on specific fuel consumption, NOx, and soot emission (b) The effect of pilot injection timing on specific fuel consumption, NOx, and soot emission.
Energies 14 00417 g020
Table 1. Specifications of the test engine.
ParameterBore
(m)
Speed
(r/min)
Stroke
(m)
Compression RatioOutput
(kW)
Mean Effective
Pressure (bar)
Value0.52992.31524.91640815.8
Table 2. Operating parameters on different loads of the test engine.
Operating Parameters on Different Loads (%)255075100
Engine speed (r/min)62.478.689.999
Power (kW)1602320448066408
MEP (bar)6.39.913.015.8
Pmax (MPa)8.5812.615.615.8
SFC (g/kW·h)168.30164.38163.92171.48
NOx emission (g/kW·h)19.1919.0414.229.55
Table 3. The specifications of nozzles in the computational domain.
Spatial Angle between
Injection Direction and Injector Axis
The Angle β between the Injection Direction
and the Injector Axis in the z–y Plane
140.66113.38
153.77105.98
161.00107.07
132.55109.58
159.76107.87
Table 4. The primary physical and chemical models selected for the simulations.
Model TypesSpecific Models
Turbulent modelRNG k-ε
Droplet break-up modelKH-RT
Droplet evaporation modelFrossling
Combustion modelShell + CTC
NOx emission modelExtended Zeldovich
Soot emission modelHiroyasu model coupled with Nagle and Strickland-Constable model (Hiroyasu-NSC)
Table 5. Modified Shell ignition reaction mechanism used in the simulations.
ReactionsProcess
C n H 2 m + O 2 2 R * Initiation
R * + ( f 1 + f 4 + 1 ) C n H 2 m + ( f 1 + f 4 + ( n + m / 2 ) ) O 2 n C O 2 + m H 2 O + f 1 B + f 4 Q + R * R * + Q R * + B Propagation
B 2 R * Branching
R * ( M R * / M N 2 ) * N 2 Linear termination
2 R * 2 ( M R * / M N 2 ) * N 2 Quadratic termination
R f * = R 1 6 * + ( W R * / W N 2 ) Δ N 2 B f = B 1 6 Q f = Q 1 6 R f * + B f + Q f + 2.5 ( n + m / 2 1 ) O 2 ( 2.5 n ) C O 2 + ( 2.5 m ) H 2 O Ignition termination
Table 6. Boundary conditions in the simulation.
Boundary ConditionsValues
Scavenge air pressure (MPa)0.4426
Scavenge air temperature (K)308.95
Exhaust pressure (MPa)0.4346
Exhaust temperature before gas receiver (K)727.15
Injection timing (°CA ATDC)2.13
Exhaust valve timing (°CA ATDC)127
Table 7. The specification of mesh refinement cases.
Mesh Refinement CasesNumber of Grids
F0A022,250–615,290
F0A125,624–618,188
F0A231,812–629,279
F0A331,812–1,511,302
F1A025,832–618,293
F1A125,844–618,247
F1A237,259–629,384
F1A368,169–1,510,961
F2A023,807–620,010
F2A127,607–622,010
F2A240,620–699,420
F2A376,504–1,514,252
Table 8. Simulation calibration error under 100% load.
Operating Parameters under 100% LoadExperimental Value3D Simulation1D SimulationError
(3D–1D)
(Test-3D)
compression pressure (bar)145.4139.9146.74.8%
3.8%
peak pressure (bar)158159.1162.42.1%
0.7%
SFC (g/kW·h)171.5174.1179.33.4%
1.5%
NOx emission (g/kW·h)9.559.859.444.3%
3.0%
Table 9. Settings for various injection cases.
CaseθPI (°CA)θMI (°CA)QPI (%) QMI (%)Name
1−151.130%100%P0M100
2−151.135%95%P5M95
3−151.1310%90%P10M90
4−151.1315%85%P15M85
5−151.1320%80%P20M80
6−151.1325%75%P25M75
7−151.1330%70%P30M70
8−51.1310%90%P-5CA
9−101.1310%90%P-10CA
10−151.1310%90%P-15CA
11−201.1310%90%P-20CA
Pilot injection timing (θPI), the main injection timing (θMI), and their injection mass ratios (QPI and QMI, respectively).
Publisher’s Note: MDPI stays neutral with regard to jurisdictional claims in published maps and institutional affiliations.

