Article

Coupled Thermo–Hydro–Mechanical–Seismic Modeling of EGS Collab Experiment 1

Mewbourne School of Petroleum and Geological Engineering, The University of Oklahoma, Norman, OK 73019, USA
*
Author to whom correspondence should be addressed.
Energies 2021, 14(2), 446; https://doi.org/10.3390/en14020446
Submission received: 4 December 2020 / Revised: 5 January 2021 / Accepted: 8 January 2021 / Published: 15 January 2021
(This article belongs to the Special Issue Modelings and Analysis of Hydraulic Fracturing in Reservoirs)

Abstract

:
An important technical issue in the enhanced geothermal system (EGS) is the process of fracture shear and dilation, fracture network propagation and induced seismicity. EGS development requires an ability to reliably predict the fracture network’s permeability evolution. Laboratory and field studies such as EGS Collab and Utah FORGE, and modeling simulations provide valuable lessons for successful commercial EGS design. In this work we present a modeling analysis of EGS Collab Testbed Experiment 1 (May 24, Stim-II ≅ 164 Notch) and interpret the stimulation results in relation to the creation of a fracture network. In doing so, we use an improved 3D discrete fracture network model coupled with a 3D thermo-poroelastic finite element model (FEM) which can consider fracture network evolution and induced seismicity. A dual-scale semi-deterministic fracture network is generated by combining data from image logs, foliations/micro-fractures, and core. The natural fracture properties (e.g., length and asperity) follow a stochastic distribution. The fracture network propagation under injection is considered by an ultrafast analytical approach. This coupled method allows for multiple seismic events to occur on and around a natural fracture. The uncertainties of seismic event clouds are better constrained using the energy conservation law. Numerical simulations show that the simulated fracture pressure profiles reasonably follow the trend observed in the field test. The simulations support the concept that a natural fracture was propagated from the injection well connecting with the production well via intersection and coalescence with other natural fractures consistent with plausible flow paths observed on the field. The fracture propagation profiles from numerical modeling generally match the field observation. The distribution of simulated micro-seismicity have good agreement with the field-observed data.

1. Introduction

The EGS Collab Project has been launched by U.S. Department of Energy, Geothermal Technologies Office (DOE-GTO) to enhance the understanding of rock mass response to stimulation. The focus of the EGS Collab Project is to control the permeability enhancement under in-situ stress conditions and heterogeneous rock mass properties on a decameter-scale reservoir. The EGS Collab site is hosted in the Sanford Underground Research Facility (SURF) in Lead, SD. The EGS Collab Testbed Experiment 1 consists of eight HQ-diameter holes (the hole diameter is 96 mm and the core diameter is 63.5 mm) with approximately equal lengths (about 61.0 m, Figure 1b). Each hole is steel-cased from the top (collar) to a depth of 6.1 m. Six of the holes (E1-OT/OB, E1-PST/PSB and E1-PDT/PDB) are monitoring wells, while other two holes (E1-I and E1-P) are an injection well and production well, respectably. Geophysical monitoring is via a dense 3D sensor array including 24 hydrophones (Sensor 1), 18 accelerometers (Sensor 2), 4 geophones (Sensor 3), 17 continuous active sources seismic monitoring (Sensor 4), 96 thermistors (Sensor 5), 123 seismic shot (Sensor 6) and 96 ERT electrode (Sensor 7) (Figure 1b). Six radial notches (~8.89 mm radially from the hole) were created along the injection well E1-I as marked in Figure 1b. The coordinate system used in this work is the local Homestake Mine Coordinate system [1].
The purpose of the layout of the holes was to create connected a flow path (connector) between the injection well E1-I and production well E1-P via stimulation of the former. The E1-I and E1-P were drilled (azimuth = 356° and inclination = 12°) app J. Numer. Anal. Methodsizontal stress (azimuth = 2 ° and plunge = 9.3 ° ). The distance between the injection well E1-I and the production well E1-P is approximately 10 m. Stress measurements as part of the nearby kISMET project [1] in the mine have indicated the S hmin   to be about 21.7 MPa , and the S Hmax   to be about 35.5 MPa . The vertical stress is lithostatic and equal to 41.8   MPa . The initial pore pressure is set to zero in this work since no direct measurements are available and there are no observed major flows from the rock matrix. The information of in-situ stress is listed in Table 1. Drill holes E1-OT and E1-OB were intended to be intersected by the potential hydraulic fracture to be created in the experiment. The other four holes (E1-PST/PSB, and E1-PDT/PDB) were designed to be paralleled with the potential hydraulic fracture.
Three multi-stage experiments were performed in the testbed: (1) a hydraulic fracturing test at Notch ≅ 142 occurred on May 21–22, 2018 and another hydraulic fracturing test was performed at Notch ≅ 164 on May 22–24, 2018 (Stim-II HF ≅ 164 Notch); (2) a hydraulic characterization test was carried out at after the stimulation at Notch ≅ 164, from October 24 to November 20, 2018; and finally (3) another hydraulic characterization tests was done at Notch ≅ 164 in February-March 2019. In this paper we focus on the hydraulic fracturing test at Notch ≅ 164 (Stim-II HF ≅ 164 Notch) and carry out numerical simulations to analyze and interpret the result of the stimulation. In particular, we address the stimulation outcome in terms of fracture network creation using a dynamic 3D fracture network model. The EGS Collab Testbed Experiment 1 was intended to induce controlled fracture propagation (presumably a penny-shaped one) to connect the injection well E1-I with the production well E1-P. Our simulation results and analysis support an alternative interpretation of the data, i.e., a natural fracture was extended from the wellbore connecting with pre-existing natural fractures to form a network. We begin by a brief description of the EGS Collab Testbed and proceed to describe the numerical model. Subsequently, we present simulation results and analysis.

2. Rock and Natural Fractures in the Collab Testbed Experiment 1

2.1. Site Description

Four rock formations are presented in this region: the Poorman Formation, the Yates amphibolite, the Homestake Formation, and the Tertiary Rhyolite dikes (Figure 1a). EGS Collab Testbed Experiment 1 is entirely located within the Poorman Formation, a metasedimentary rock consisting of sericite-carbonate-quartz phyllite (the dominant rock type), biotite-quartz-carbonate phyllite, and graphitic quartz-sericite phyllite [3]. Carbonate minerals present consist of calcite, dolomite, and ankerite. The rock shows intense multiscale folding with foliations at different scales; it contains carbonate, quartz veins/boudinage, pyrrhotite, and minor pyrite. Other mineral phases (in addition to those listed above) include graphite and chlorite. The Poorman Schists contains different type of discontinuities such as open and sealed natural fractures, foliations planes, and different mineralization bands distributed at different scales. The mechanical deformation, failure behavior, and transport properties of subsurface rock mass are highly influenced by these natural discontinuities and fabric features. The detailed geologic descriptions of those formations can be found elsewhere [3].

2.2. Natural Fracture Network

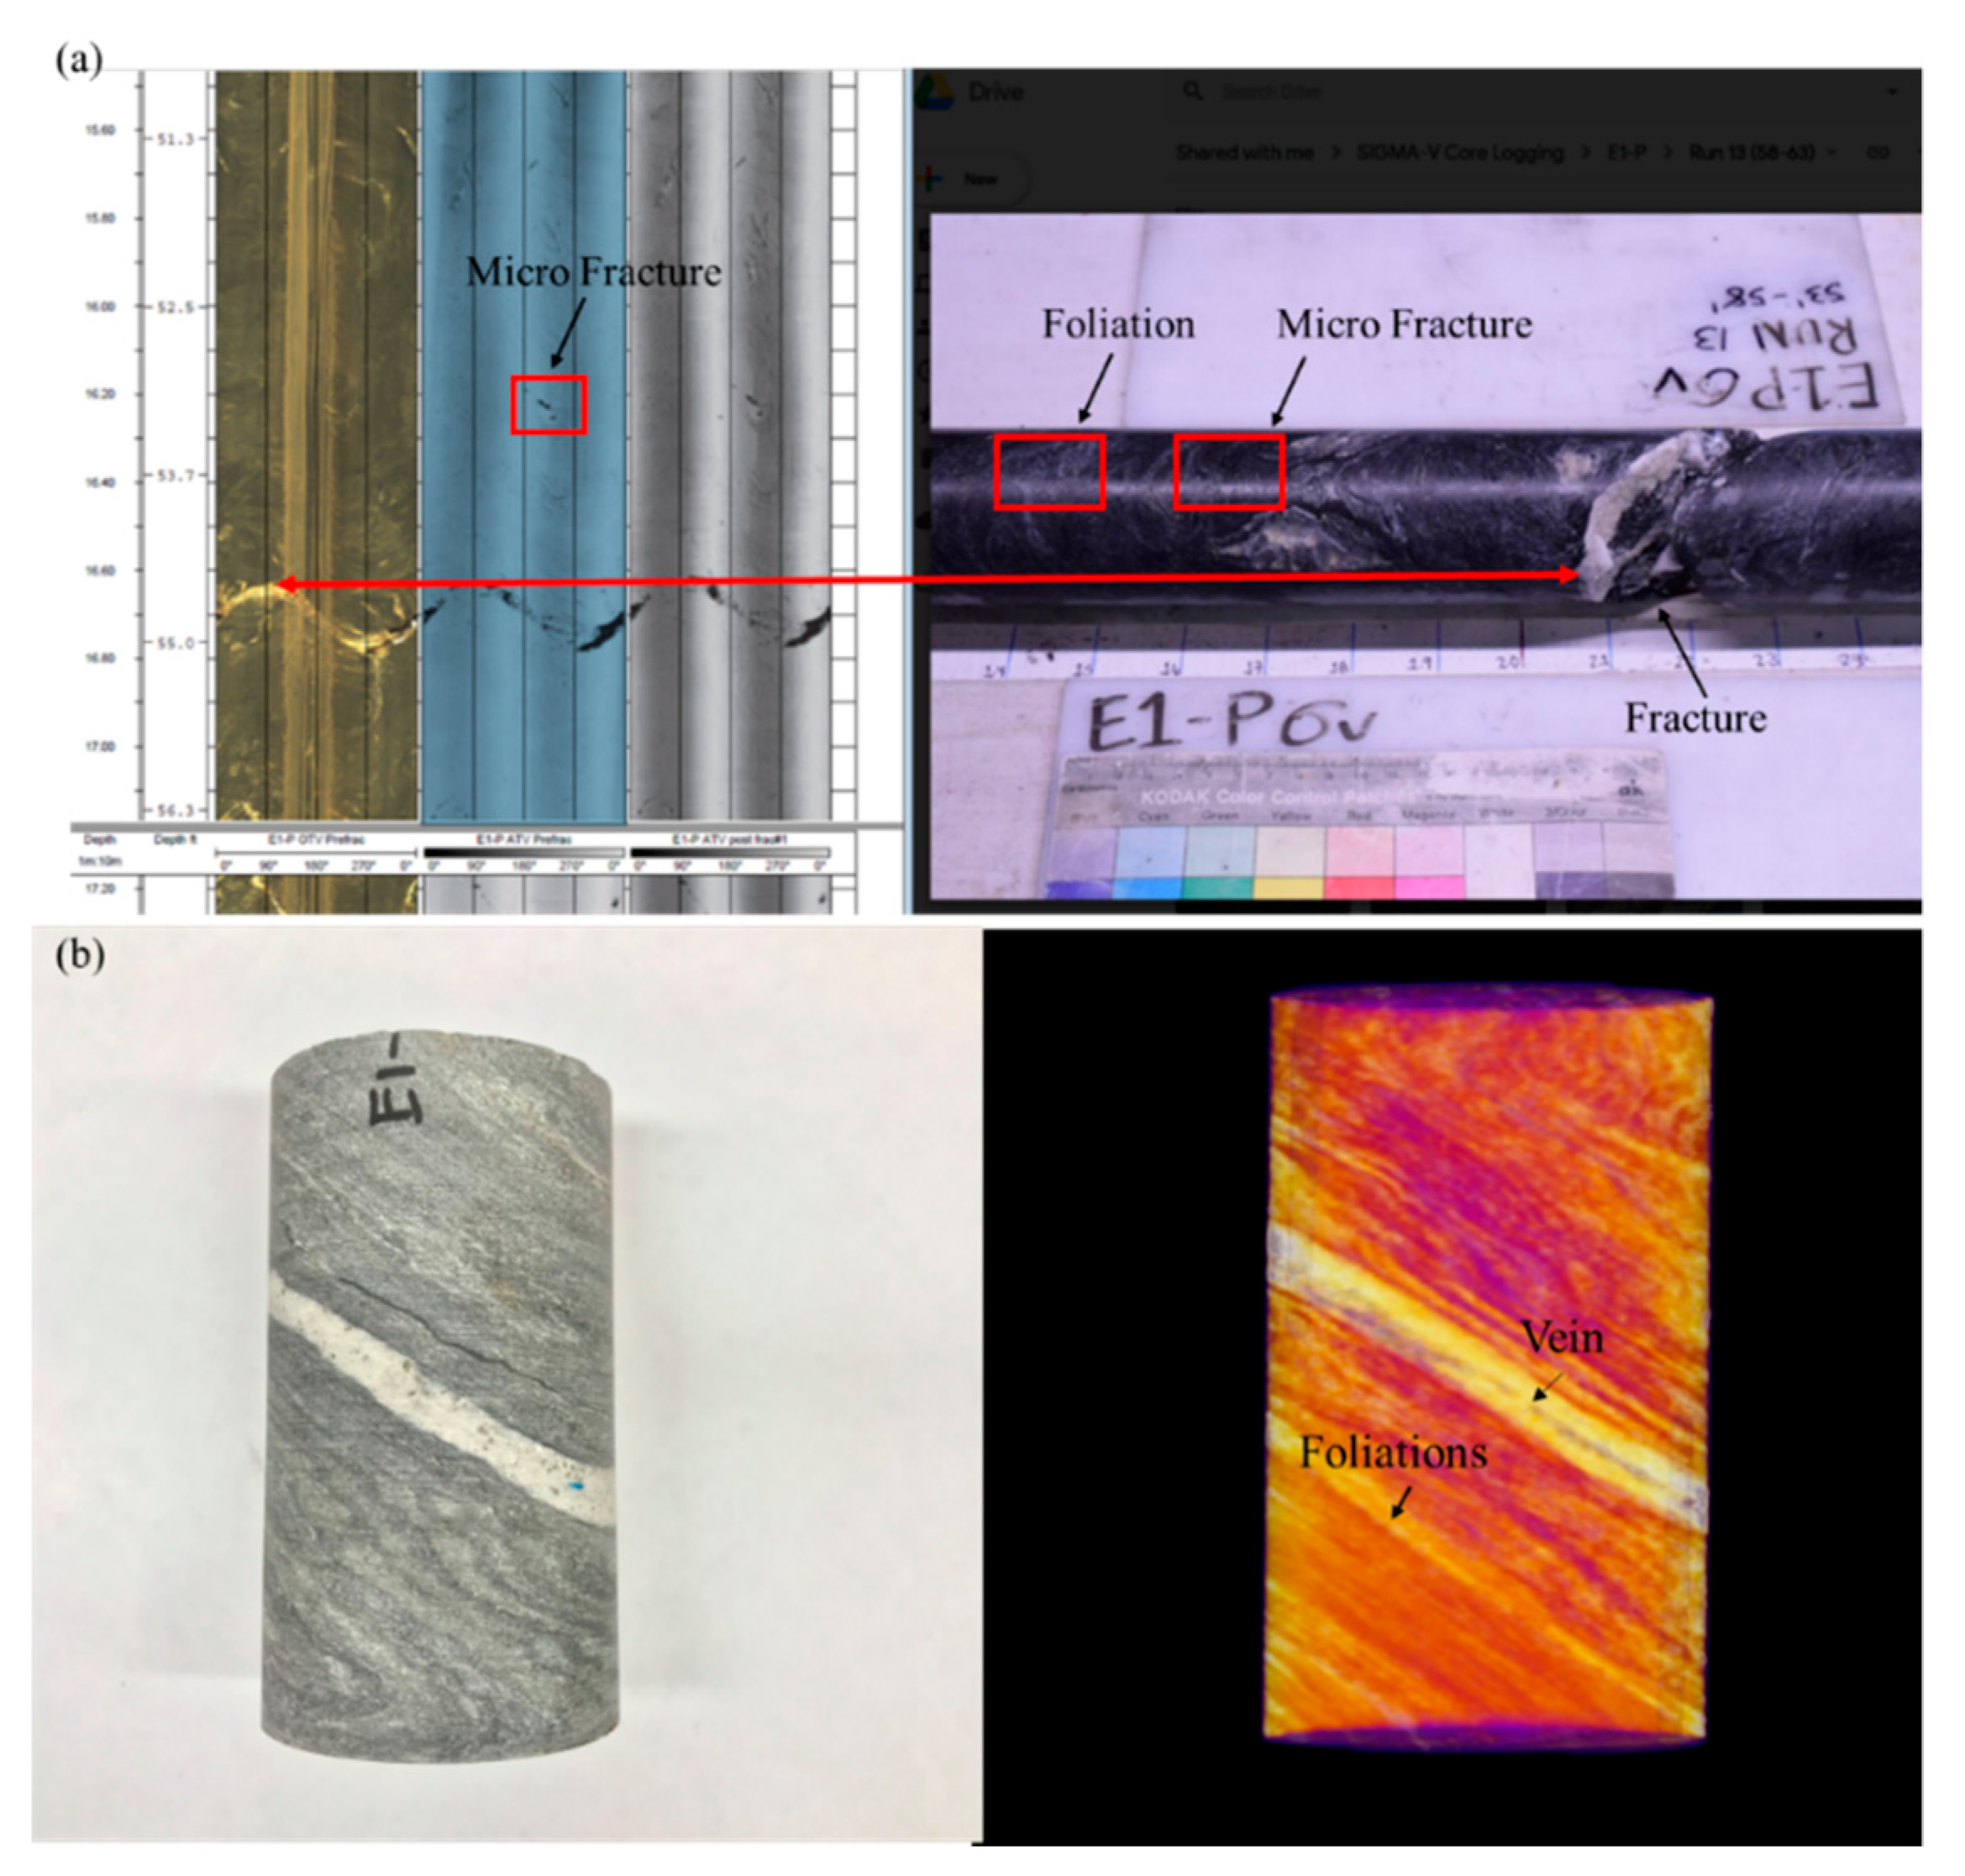
In order to characterize the natural fracture network, the data from geologic mapping of the area, core analysis, televiewer logs and downhole camera have been utilized [4] to identify any fractures which intersected with wellbores. Factures were also surveyed in the mine and altogether two fracture sets have been identified in this testbed. Both sets have high value of dip (> 70 ° ) and strike of set 1 and set 2 is approximately 50 ° and 230 ° , respectively. Although borehole imaging and core only map a small zone around the wellbore, they are still useful as a reference for fracture orientation. In the intermediate-scale (e.g., decameter scale) experiments, the number and location of detected fractures from image logs and core are considered the same as the real system [5,6]. Aside from natural fractures, there are foliations/micro-fractures in the Poorman Schist rock mass (Figure 2) which affect its response to injection.
Therefore, in our approach, the rock mass is viewed to consist of a population of large-scale factures (derived from the borehole image logs and core) and a population of small-scale fractures representing the micro-fracture/foliation population. Note that the major fractures and foliations are considered as the major fracture category, while micro-fractures and micro-foliations are in the micro-fracture group. So, to account for the natural fracture, micro/macro-foliation, and microcrack populations we use a dual-scale approach.
The numerical model presented in this work, consists of four sub-models: (1) a coupled thermo-poroelastic model describing the coupling between rock deformation, fluid flow and heat flow in the fractured rock mass; (2) a dual-scale semi-deterministic fracture network describing the fracture network geometry and fluid transport within the fractures; (3) a fracture slip/dilation and propagation model to analyze fracture network deformation; and (4) a seismicity simulation model describing the events distribution and magnitudes. The latter distinguishes the transition between the aseismic and seismic slip. These aspects are described below, and the model is applied to the field test namely Collab. In this part of the work, the EGS Collab Testbed experiment 1 (Stim-II ≅ 164 Notch) carried out on 24 May 2018 [7,8] is simulated. The simulations provide some insights on the mechanisms involved in the observed phenomena such as micro-seismicity, the resulting fracture network and the flow path, as well as the injection pressure profile.

3. Natural Fracture Network Representation and Modeling

A semi-deterministic fracture network is generated by combining the data from image logs, core and stochastic fracture properties compiled by the EGS Collab Team [3]. Because the complete survey of fracture networks is not feasible, stochastic models are used in conjunction with the surveyed fractures to describe the fracture network geometry [9,10,11,12,13]. The fractures are treated as penny shape and the fracture apertures follow a power law distribution [14] and a Lognormal distribution is used to represent the fracture radius [15,16]. Fracture orientations are extracted from the borehole image logging and core by the Collab Team [3].
The major fractures are explicitly represented in the model so that their deformation and pressure can be explicitly simulated. The distribution of foliations in the Poorman Schist is very irregular and may not follow a certain type of stochastic distribution. The major foliations are accounted for by the heterogeneity in the reservoir properties (e.g., in Young modulus) or discrete fractures. The micro-fracture density away from a major fracture is described by a power law. This is justified in view of the study in [17]. The Young’s modulus of rock mass is assumed to also follows a Lognormal distribution to implicitly represent the effect of micro-fractures. The mean and std of this Lognormal distribution are determined by measuring Young’s modulus of multiple core samples. The reservoir properties are listed in Table 1. Further, micro-fractures are treated as mass points with randomly oriented planes passing through them for use in the FEM for the purpose of stress calculations.
To generate the micro-fracture population, a density of micro-fracture, N, is assumed (500/ m 3 ) over the entire system. They are then distributed in a cubic zone around the major fractures. The length of the cubic is assumed as the three times radius of major fracture. Here the major fracture PDT-114 is utilized to illustrate the generation of micro-fracture population. The information of PDT-114 can be found in EGS Collab site. In the first step, the radius of PDT-114 is R = 3   m and the volume of this cubic contained PDT-114 is 729 m 3 . The number of micro-fractures in this cubic is 729 m 3 × 500/ m 3 3.6 × 10 5 . Note that field studies suggest that the density of micro-fracture can be larger than 10,000/ m 3 [17]. Here, 500/ m 3 is adopted to lower the computation costs. In the second step, the number of accompanying micro-fracture of each major fracture is identified. Field data suggested [17,18] that most micro-fractures are located within a zone surrounding a major fracture which extends nearly 1 m from the major fracture. The volume of surrounding zone (ellipsoid shape) of this major fracture can be calculated as: 4 / 3 · π · 1 [ m ] · ( 1 + R ) [ m ] · ( 1 + R ) [ m ] where R   is the radius of major fracture. In this case, the total volume of surrounding zone (ellipsoid shape) of PDT-114 is 4 / 3 · π · 1 [ m ] · ( 1 + 3 ) [ m ] · ( 1 + 3 ) [ m ] = 67   m 3 . Therefore, the number of accompanying micro-fractures of PDT-114 is N × 67   m 3 = 500 / m 3 ×   67   m 3 = 33 , 500 .
The density of micro-fractures is usually identified by SEM, for example. Thus, the minimum size of micro-fracture is very small (~1 μ m -mm). It is believed that detectable seismicity cannot occur on such small size micro-fracture in-situ. Here, we define an effective micro-fracture size for seismicity generation. We require the radius of the micro-fracture to be larger than a threshold hold value for Collab fracture (here we use 30 mm which is two orders less than the radius of major fracture). The micro-fracture size commonly follows a power law distribution [14,17]. The cumulative power law distribution is [14] is given as F = a · X b . F is the fracture cumulative frequency and X is the fracture radius (mm). Here a = 2.4 ×   10 2 and b = 0.1 is adopted based on the observation of sandstone from field data [14]. Therefore, the number of effective micro-fractures (following power law distribution with radius > 30 mm) around PDT-114 is 1223.
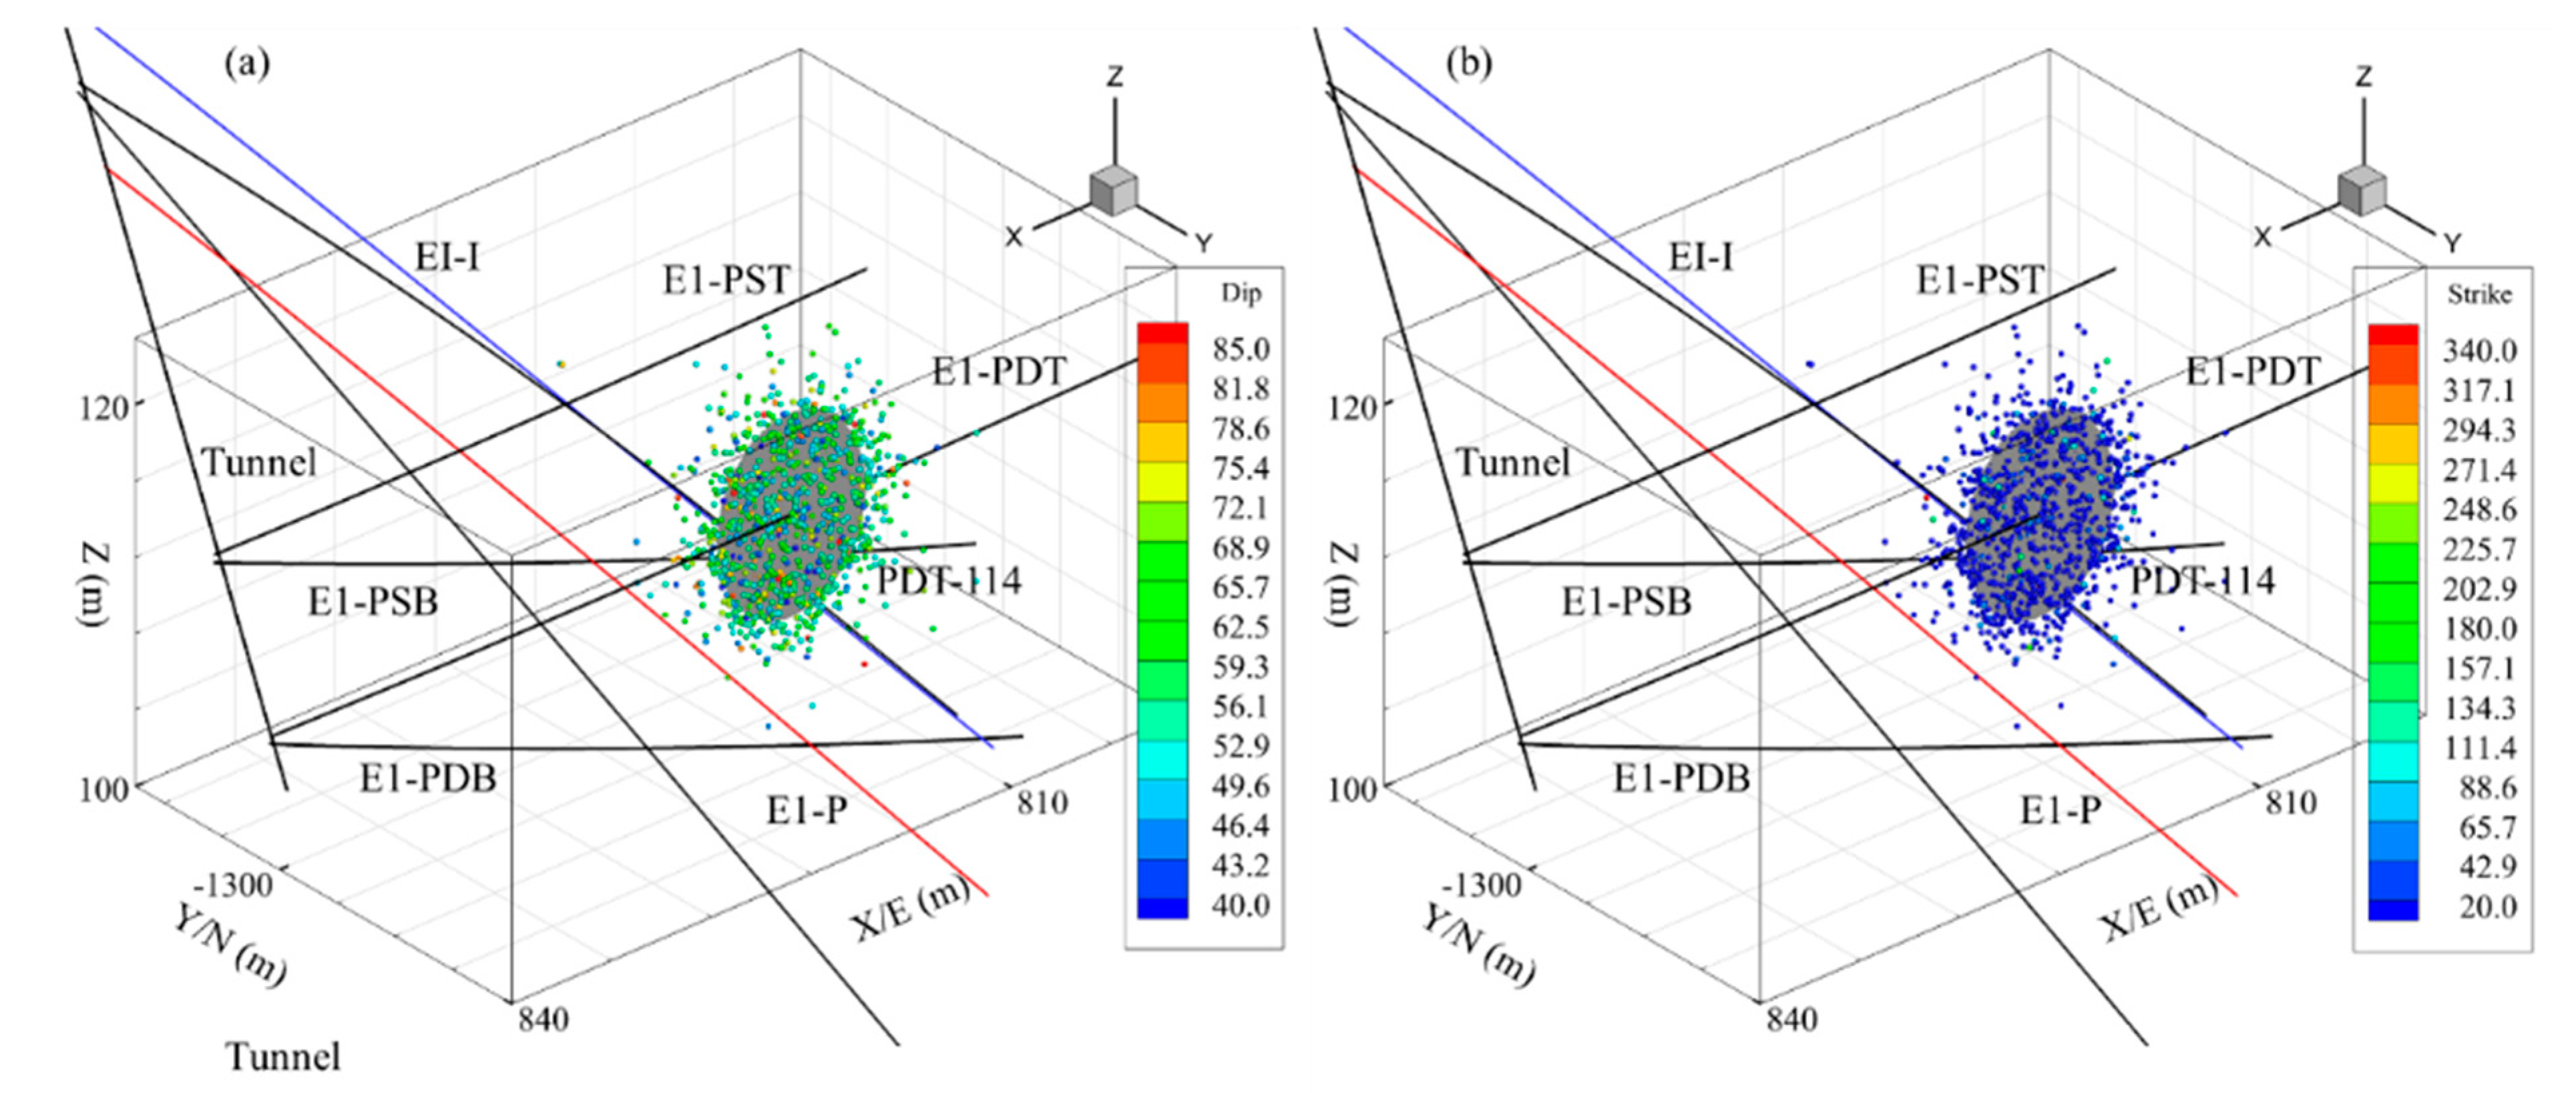
A power law is determined based on field observations or estimation of micro-fractures density within the surrounding zone of each major fracture. Such power law (Pareto distribution, PDF = a · k a / x a + 1 ) is described by two numbers: k > 0 , the location parameter and a > 0 , the shape parameter. Thus, the mean of power law distribution is k · a / ( a 1 ) and the variance is k 2 · a / ( ( a 2 ) · ( a 1 ) 2 ) and assume k = 4 and a = 5 . In this case, PDT-114 have 1223 micro-fractures which is defined in the third step. The micro-fractures generated in first step is selected when the shortest distance between this micro-fracture and major fracture is best to fit the power law. The selected micro-fractures will be considered in FEM (Figure 3). The effective micro-fractures around the major fractures are assigned orientations. Micro-fractures in granite exhibits no strongly preferred orientation [19]. It mostly depends on the its slip direction [17]. In this work, micro-fracture orientation is assumed to follow by lognormal distribution. For instance, the dip of the selected micro-fractures of PDT-114 is followed the lognormal distribution (mean is 58 ° and std is 10 ° ) and the value of mean is the same as dip of PDT-114. While the strike of the selected micro-fractures is also followed the lognormal distribution (mean is 11 ° and std is 50 ° ) and the value of mean is the same as the strike of PDT-114. Figure 3 shows the orientation of the selected micro-fractures surrounding of PDT-114.
The micro-fractures are submitted into FEM to calculate the Coulomb failure function (CFF). The stress and pore pressure fields of micro-fractures can be obtained by interpolating the stress and pressure distribution on the finite elements. The larger the CFF, the larger the event magnitude may occur on this micro-fracture. The CFF is defined as CFF = τ s μ · σ n . τ s   and σ n   is the shear stress and normal stress on fracture, respectively. μ   is friction coefficient which is the same as the major facture. The cohesive strength is assumed as zero.

3.1. Natural Fracture Network

After a 3D dual-scale semi-deterministic fracture network is generated, a fracture flow model is defined for the major fractures. The fracture permeability is defined using the cubic law and the overall rock mass permeability is calculated using the equivalent permeability concept. Here the contribution of micro-fractures is included in the rock matrix permeability. The intersection line between the fractures and finite elements (hexahedrons) faces are calculated based on a geometric surface-surface intersection algorithm [11,13]. The permeability tensor on a finite element can be calculate as [11,13]:
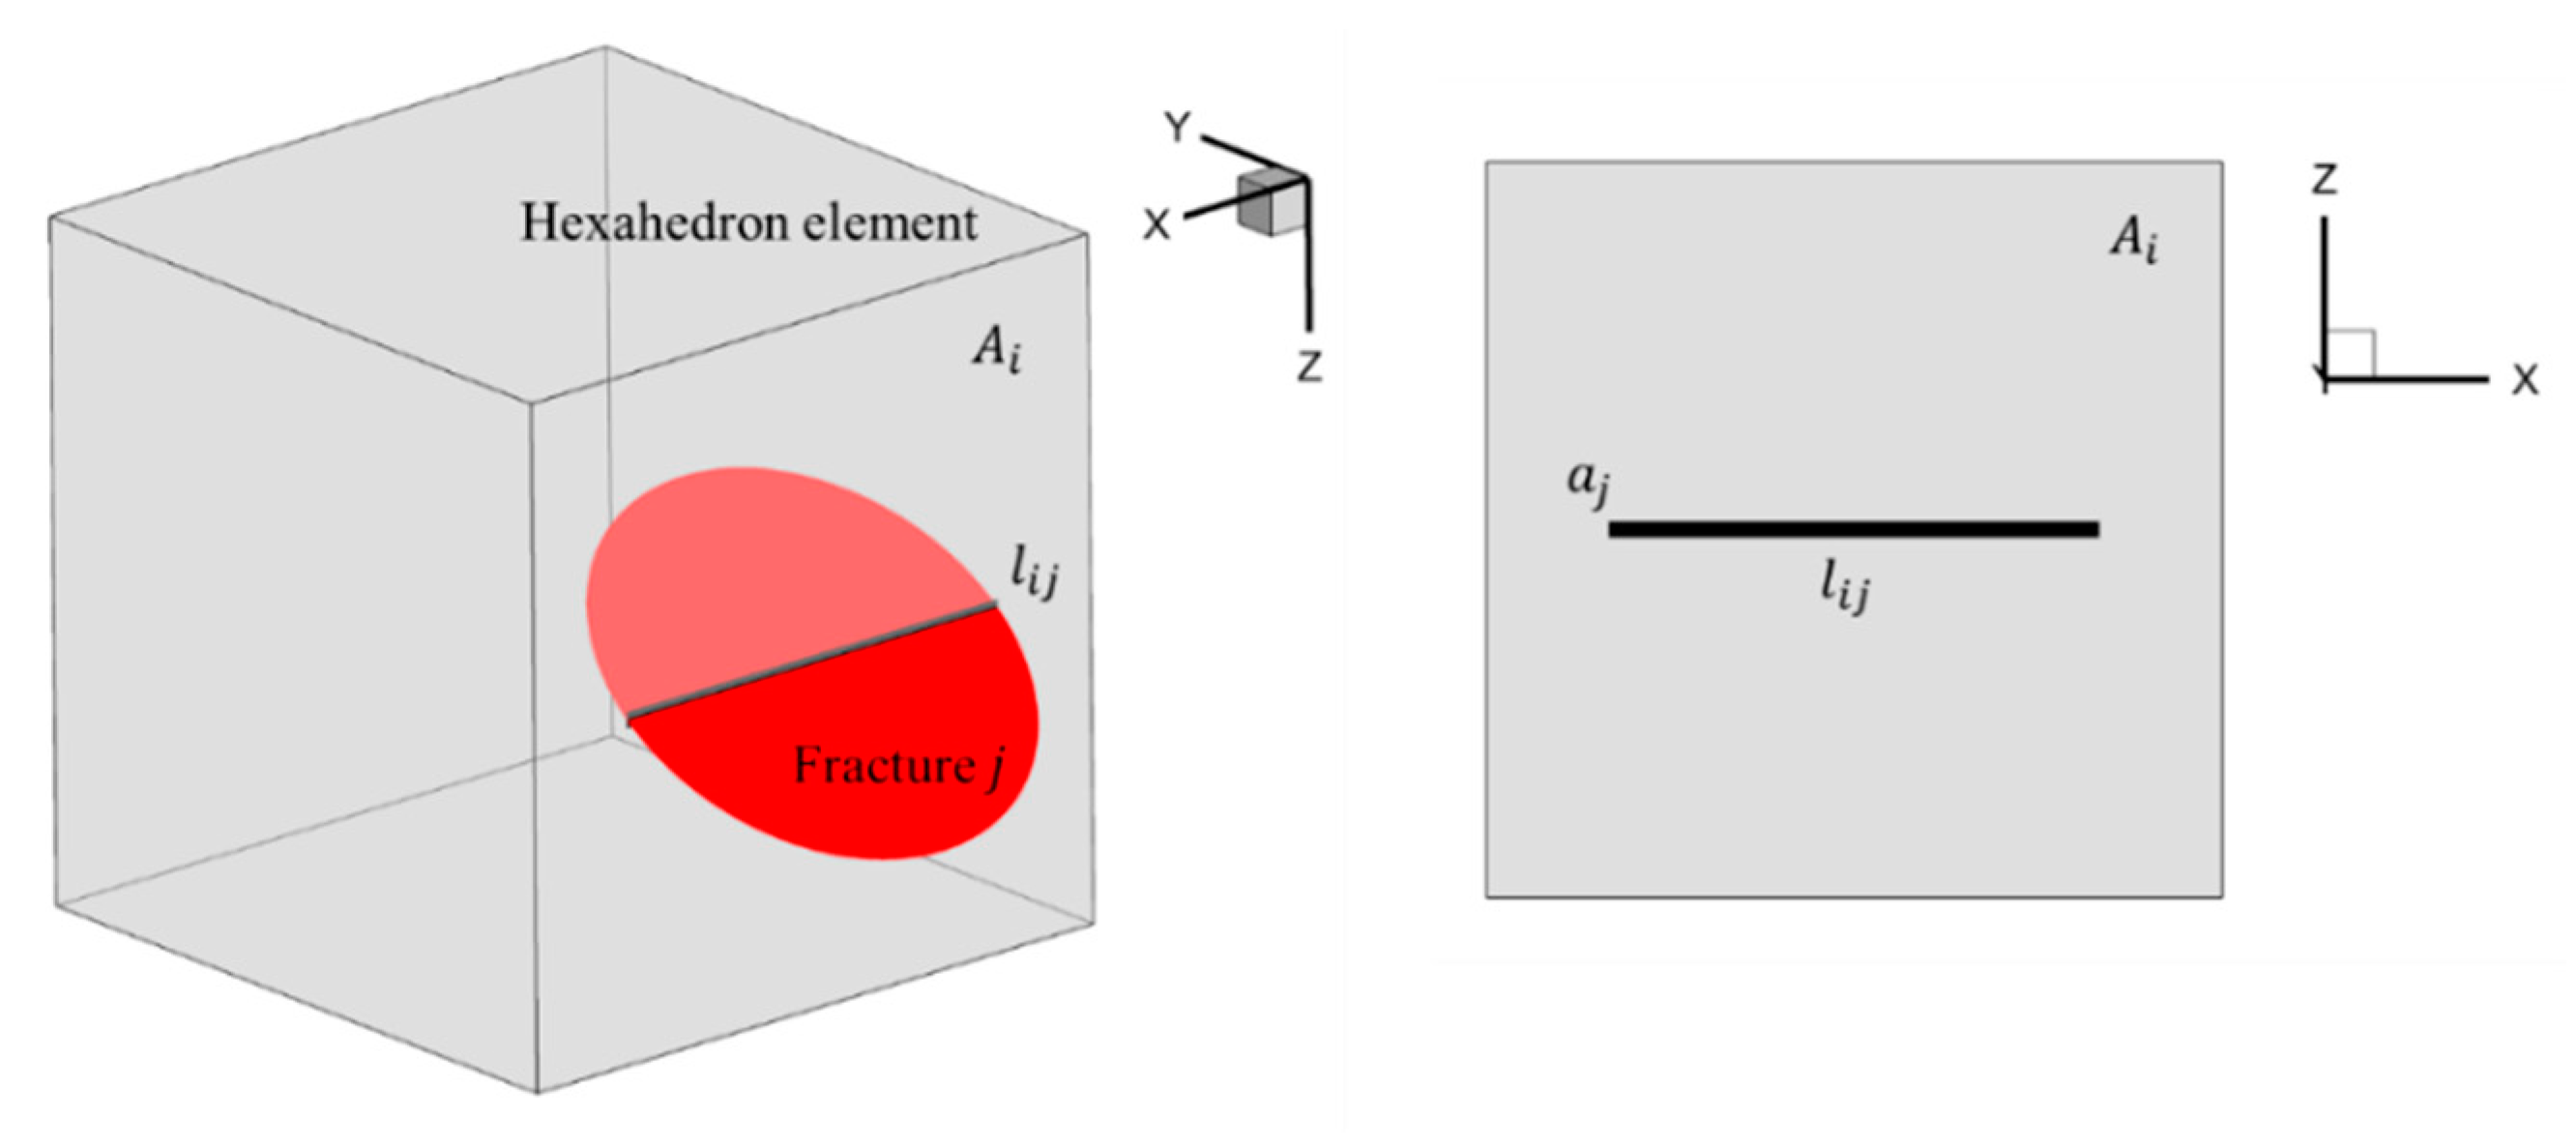
k i = j = 1 n f i a j 3 l i j 12 A i ,   i = x , y , z
where n f i   is the total number of fractures in the volume (finite) element;   a j   is the aperture of the j t h   fracture; l i j   is the length of intersection line on the element interface; A i   is the cross-section area in the corresponding i   direction (Figure 4). k i   ( i = x , y , z )   is represent the permeability of a finite element in x ,   y   and z direction (local coordinate system), respectively.
During injection, the effective normal stress on a fracture can change so that its aperture and permeability would also change and would influence the variation of permeability tensor in the finite element. Therefore, the fracture fluid pressure, displacement, and temperature have to be integrated with those of the equivalent porous medium. The pore pressure, displacement and temperature within the equivalent medium are calculated by the thermal-hydrological-mechanical model at each time step. The fluid pressure in a fracture is approximated by averaging the pressure values of all finite elements intersected by it. The heat transport within the fracture network is obtained by utilizing the method from [13]. Fluid flow and heat transfer occur in the connected fracture network. The fluid and heat transfer within the fracture network is simulated by assuming a 3D flow channel consisting of 1D flow pipes [13]. The temperature of fluid in the fracture and rock matrix are assumed continuous at the fracture well [13]. Thus, the heat transfer model of fracture network is assumed as 1D steady state. The energy conservation of each fracture should be balanced so the convective heat transport from fluid flow should equal the sum of the heat conduction between adjacent rock matrix and fluid in the fracture, and the change of energy retained by the volume of the fluid within the fractures. Details of the energy conservation in each fracture can be found in [13]. The changes of fluid pressure and temperature within the fracture network are substituted into Equation (A9) of Appendix A, for the next time step. Thus, the stress changes around the fractures due to the changes in fracture network are considered. Details of the fluid flow and heat transport aspect of the model can be found in [13]. The normal and shear stress, σ n ,   τ n   on a fracture are calculated depending on the pore pressure and in-situ stress. Patton’s saw tooth fracture model is used to estimate the fracture shear strength, τ p   [20,21]:
τ p = σ e f f tan ( ϕ b a s i c + ϕ d i l e f f )
  ϕ d i l e f f = ϕ d i l 1 + 9 σ e f f / σ n e f f
where σ e f f = σ n p is the effective normal stress on fracture; ϕ b a s i c   is the basic friction angle; ϕ d i l e f f   is the effective shear dilation angle; ϕ d i l   is the experimentally measured dilation angle and σ n e f f   is the effective normal stress required to cause 90% reduction in the natural fracture aperture. Once the Mohr–Coulomb failure criterion is met, the fracture will slip. The shear displacement U s   of a fracture is given by [21,22]:
U s = τ n τ p K s
where K s   is the fracture shear stiffness (e.g., K s = 7 π / 24 · G / r for penny shaped crack [23], r is the fracture radius and G   is shear modulus). The total stimulated fracture aperture is written as [9]:
a = a 0 1 + 9 σ e f f / σ n r e f + a s + a r e s
where a 0   is the initial effective aperture; a s   is the aperture change due to shear displacement; In general, a s   is proportional to the fracture shear displacement U s   (e.g., a s = U s tan ( ϕ d i l e f f ) ). a r e s   is the residual aperture at high effective stress which can cause 90% reduction in fracture aperture; The residual aperture a r e s   is assumed to be zero in this work. If the effective normal stress σ e f f   is become negative, fracture will be fully open. The fracture aperture is given by the aperture-to-length scaling law:
a = K I c ( 1 v 2 ) E π / 8 2 r
where K I c is the fracture toughness; The fluid leak-off rate v L   can be described by the Darcy’s law as [24]:
v L = k μ P f n
where k is the matrix permeability, µ is the fluid viscosity, P f / n is the fluid pressure gradient normal to the fracture surface. The fracture aperture can be calculated by Equations (5) or (6) and used as input for the next time step. Induced stress caused by fractures pressurized also affect the fluid flow and induced seismicity. Since fracture network are embedded into mesh of rock matrix, the induced stress may not comprehensively consider. Thus, the induced stress is calculated based on the Sneddon solution [25] or Eshelby solution [23]. The total induced stress field is obtained as the superposition of induced stress of each fracture. The total induced stress field caused by fracture network are considered as input for the next time step. A flowchart of the coupled thermo-hydro-mechanical-seismic model with 3D fracture network is shown in Appendix B. And the numerical model verification is described in Appendix C.

3.2. Fracture Propagation

At least, two different stimulation mechanisms may occur concurrently during the development of EGS: (1) fracture shear slip and dilation and (2) fracture propagation [26,27,28,29]. The concept of fracture shear dilation has been called upon for EGS design, and several simplified fracture network models have been developed and used [10,13,30]. Experimental works [31,32] have shown that shear dilation could enhance permeability by up to 2–3 orders of magnitude. Further, a recent experimental study [33] has conclusively shown that fracture propagation by shearing of natural fractures can play a role in the development of fracture networks and permeability. Most numerical methods applied to simulate fracture network propagation are based on generalized finite element, displacement discontinuity method, and phase field model. Recent studies on the modeling of fracture propagation consider more physics to solve the problem [27,28,29,34,35]. Those works require less computation effort compared to FEM but still can be challenging for large-scale problems in an industrial setting. To alleviate such computational bottlenecks, analytical or semi-analytical approaches can be used. A major issue to be addressed in the framework of analytical approaches is the fracture propagation and the interaction between hydraulic fractures and natural fractures. In this context, the analytical methods with a sequential crack tip propagation algorithm can be adopted to model fracture propagation at much lower computation costs [36,37]. However, both of those works only considered single fracture propagation and did not address the interaction between hydraulic fracture and natural fractures. In this work, we have mitigated these limitations and developed a rapid analytical approach [38] to simulate the fracture propagation in a network of natural fractures.
The processes of fracture propagation when the fracture is not parallel to a principal stress, usually has two stages: a non-planar stage and a planar propagation. The geometry of the initial fracture is circular so that the stress intensity factors for mode I, II and III for an internally pressurized by a fluid pressure P f   is [37]:
K I ( φ ) = 2 r π σ n ( e f f )
K I I ( φ ) = 4 cos ( φ ω ) 2 v r π τ e f f
K I I I ( φ ) = 4 ( 1 v ) sin ( φ ω ) 2 v r π τ e f f
where r   is the radius of the initial fracture; σ n e f f and τ e f f are the effective normal stress and shear stress. ω   is the shear angle (form by the angle between shear stress direction and reference direction) and φ   is the fracture front angle; according to the maximum tensile stress criterion, a fracture propagates along θ 0 ( φ ) during the non-planar propagation stage if:
K e q = cos θ 0 ( φ ) 2 ( K I ( φ ) cos 2 θ 0 ( φ ) 2 3 2 K I I ( φ ) sin θ 0 ( φ ) ) K I c
where K e q   is the equivalent stress intensity factors; for a fracture not aligned with the maximum stress, the newly created crack tips will not be the on the same plane after fracture propagation because of the different kink angle θ 0 ( φ ) value for a different φ . To represent the newly created fracture surface, a certain number of penny fractures are inserted to best represent the newly created surface. After fracture propagation, the initial tip at fracture front angle φ and updated tip at fracture front angle φ form a pair. So, the discrete penny fracture can be defined as the penny shape fracture intersecting the pair’s tips. The pressure drop, Δ P f   in the fracture plane can be calculate [10]:
Δ P f Δ l = 64 μ q π l a 3
where Δ l   = l j + 1 l j   and j   is the j th iteration step. q is the flow rate in this fracture.

3.3. Induced Seismicity

It is generally accepted that injection seismicity is related to fracture failure in shear (e.g., governed by the Mohr–Coulomb failure criterion) [39,40,41,42,43]. Commonly, in numerical simulations, one event is generated at failure of the fracture. In reality, one fracture may generate multiple events [38,42] on or in the vicinity of the fracture. Numerical generation of induced seismicity has been intensely studied [39,40,41], yet few models exist capable of achieving induced seismic events with realistic quantitative output. Those simulations cannot resolve the number and location and magnitude of multiple seismic events caused by fracture failure. Other studies also use one event whenever the slip rate of an element is larger than an arbitrarily chosen value, or randomly assign a number of events to the failure element, with event hypocenters relocated randomly to approximate the effect of relocation error. However, in these works, energy conservation is not enforced (the seismic energy of the simulated event cloud is not consistent with the seismic energy of the failed element). We use a new model for numerical seismic generation. A micro-fractures population as defined in the previous section is used to generate multiple events on micro- and macro-fractures. Multiple micro-fractures are located on or around the major fracture. The shear slip of the major fracture is assumed to be reflected on the shear slip of micro-fractures, because the micro-fractures are located in the perturbed region of the major fracture. Thus, seismic events may occur on a major portion of the fracture area as well as in its surroundings. Slip on fractures is believed to induce seismic events. In-situ [43,44] and lab experiments [31] indicate that injection-induce fracture slip can enhance the permeability by up to 2–3 orders of magnitude, and a large portion of slip can be aseismic. Therefore, in the model we also account for aseismic to seismic transition.
We argue that aseismic–seismic transition exhibits a dependence on the slip rate and slip distance. Motion (e.g., aseismic–seismic transition) can be described by the dynamic equations of motion where velocity/slip rate and displacement/slip distance are the primary variables. Some studies have attempted to employ the spring system (Figure 5) to represent the instability of faults [45,46] and a threshold velocity was derived [47]. Such a spring system can be exactly described by the dynamic equations of motion. When either the fracture slip distance, or the fracture slip rate, or both are larger than threshold values in a cycle, slip will become unstable (seismic). Or, when the critical stiffness, K c ,   is larger than fracture shear stiffness, K , slip will become unstable (seismic) [47]:
K c = ( b a ) · σ n D c [ 1 + M · V 2 σ n · a · D c ]
K = 7 π 24 G r
where a ,   b   and D c   are the experimentally measured parameters of rate-state friction law (Figure 5b). M   is the mass per unit area ( kg / m 2 ) . σ n   is the normal stress and V   is the slip rate; D c   is a distance for the evolution to steady state. Equation (13) can be found in [47,48]. In practice, K   represents elastic properties of the rock surrounding the fracture/fault and the size of the latter. Equation (14) describes the penny shape fracture shear stiffness [23]; r   is the fracture radius and G   is the shear modulus.
By submitting Equation (14) into Equation (13) ( K c = K ), the threshold slip rate V c   for a penny fracture is given by:
V c = σ n · a · D c M ( 7 π · G · D c 24 ( b a ) · σ n · r 1 )
For example, if fracture radius r = 10   m , rock mass per unit area of fracture M = 5600   kg / m 2 , Young’s modulus E = 40   GPa , Poisson’s ratio is 0.22, a   = 0.003, b   = 0.006, D c = 10   μ m , normal stress is σ n = 2   MPa , the threshold slip rate is V c = 4   mm / s according to Equation (15). The rate-state friction parameters are defined according to the [47]. It suggests that if the average slip rate of fracture is larger than V c = 4   mm / s , fracture slip is eventually unstable. Note that very few works can reliably and explicitly present the threshold slip rate for a penny fracture. If the spring reaches a tangent point (point B), F / u   will decrease faster than K   ( Figure 5c). It suggests that the surrounding rock of fracture is no longer capable of absorbing the energy released during deformation on the fracture, and seismic slip occurs on the fracture. Seismic slip may occur after sufficient aseismic slip is accumulated [49]. Here we use an empirical formula was derived based on direct shear tests [50,51] to determine the peak displacement at which the fracture becomes unstable:
δ p = 1.925 · l 0.09 · J R C 0.97 · J C S 1.19 · σ n 0.24
where JCS is the joint compressive strength and σ n   is the normal stress acting on it; Equation (16) describes the peak displacement of rough ( JRC > 5 ) and hard ( JCS > 50   MPa )   fractures. For example, if fracture (e.g., granite) length l = 10   m , JRC = 6 , JCS = 230   MPa , σ n = 45   MPa , the peak displacement is δ p = 0.0016   m according to Equation (16). If the slip rate is larger than the threshold slip rate from Equation (15) or the slip distance is larger than the threshold slip distance from Equation (16), we assume the shear stiffness K   is less than the critical stiffness   K c . So, the threshold slip distance and threshold slip rate are utilized to distinguish between the aseismic and seismic slip. In our simulation, the slip rate is more likely to reach the threshold slip rate.
The seismic source parameters such as magnitude, location, and the number of events in the cloud needs to be defined properly. Here, a new method is proposed to constrain the uncertainties of the events cloud. In the first step, the major fracture will slip during the injection based on the Mohr–Coulomb failure criterion and one fictitious event occurs at the center of the major fracture. The seismic moment of this fictitious event is calculated as [52,53]:
( M 0 ) 1 = Σ G U s d A
where ( M 0 ) 1 ( N · m ) is the seismic moment; G   is the shear modulus and U s   is the shear displacement (seismic). A   is the slip area, treated here as the area of the fracture. In simulation, the seismic moment from Equation (17) consists of the seismic moment from all the slip events (on/off a fracture). Because those events are all associated with this fracture slip. Thus, the fictitious event should be representative of the events cloud from energy conservation perspective. The moment magnitude of the fictitious event ( M w ) 1 ( N · m ) generated by shear slippage can be estimated as:
( M w ) 1 =   2 3 log 10 ( M 0 ) 1 6.07
The seismic energy of the fictitious event   ( E R ) 1 ( Joule ) can be calculated as:
log 10 ( E R ) 1 = 4.8 + 1.5 · ( M w ) 1
The seismic energy ( E R   ) 1   is the lumping of all seismic energy. Next, we calculate the shear stress and effective normal stress on the micro-fractures by interpolating the stress and pressure distribution on the finite elements. The micro-fractures friction angle is treated the same as the major fracture and micro-fractures cohesion is set to zero in this work. There is one potential seismic event on each failed micro-crack based on the Mohr Coulomb failure criterion. Thus, there may have been an event cloud surrounding a major fracture. However, the number of seismic events on or surrounding a major fracture has to be constrained. It is known that Gutenberg–Richter law expresses the relationship between the magnitude and the total number of events in any given region. Thus, events should follow the Gutenberg–Richter law suggesting that simulated event clouds have the same b-value as the fictitious events because those events occur in the same region. Here, the a-value is used as a fitting constant. The Gutenberg–Richter law on a failure fracture can be represented as:
log 10 N = a b · M
where N   is the number of events having a magnitude larger or equal to the magnitude   M ; b   value can be obtained from the field observation; a   is the fitting number, and is calculated based on the information of numerically generated fictitious event:
a = b · ( M w ) 1
where ( M w ) 1 is the moment magnitude of fictitious event and obtained from Equation (18); The event cloud is assumed to be exactly fitted by the Gutenberg–Richter law (i.e., R-squared is equal to one). The moment magnitude of the n th   event is calculated as:
( M w ) n = a log 10 n b
where ( M w ) n   is the moment magnitude of n th   event and a   is from Equation (21); the seismic energy of n th   event ( E R ) n   is calculated as:
( E R ) n = 10 ( 4.8 + 1.5 · ( M w ) n   )
If n   is equal to one, Equation (23) attempts to calculate the seismic energy of fictitious events. Equation (23) can theoretically be used to generate an infinite number of events and some constrains are needed to limit the number of events. The first prescribed condition is the energy conservation, i.e., the total seismic energy of the real event cloud should be less than the seismic energy of the fictitious event. While the seismic energy of the fictitious event is defined according to Equation (19). In practicality, Equation (19) can describe the seismic moment from all the slip events (on/off a fracture). Thus, Equation (19) in numerical model is supposed to already consider seismic moment from all the slip events (on/off a fracture):
j = 2 n ( E R ) j ( E R ) 1  
where j = 2 n ( E R ) j   is the total seismic energy of the event cloud; ( E R ) 1   is the seismic energy of the fictitious event defined in Equation (19). Another prescribed condition is that the receivers cannot detect very small-magnitude events. So, there is a threshold magnitude imposed. Such a threshold on moment magnitude of event M t h   is set as −3 in this work which is the same as the magnitude of the background seismicity in the regions of our application:
( M w ) n M t h = 3
These two prescribed conditions Equations (24) and (25) constrain the number of generated events in the model. The stress and pore pressure fields of micro-fractures can be obtained by interpolating the stress and pressure distribution on the finite elements. The contribution of the micro-fracture to the matrix permeability have been contained through the concept of the equivalent matrix permeability. Micro-fractures failure is assessed based on the Mohr–Coulomb failure criterion. In general, the number of failing micro-fractures is larger than the number of events. Each failing micro-fracture is assumed to have one event. Multiple events can occur on the same location over time on fracture. But we only consider the cumulated micro-seismicity at the same location. Therefore, the CFF of each selected micro-fracture is calculated. The large CFF, the larger of magnitude of event occurred on this micro-fracture. While other failing micro-fractures could be considered as aseismic.

4. Simulation and Interpretation of EGS Collab Testbed Experiment 1

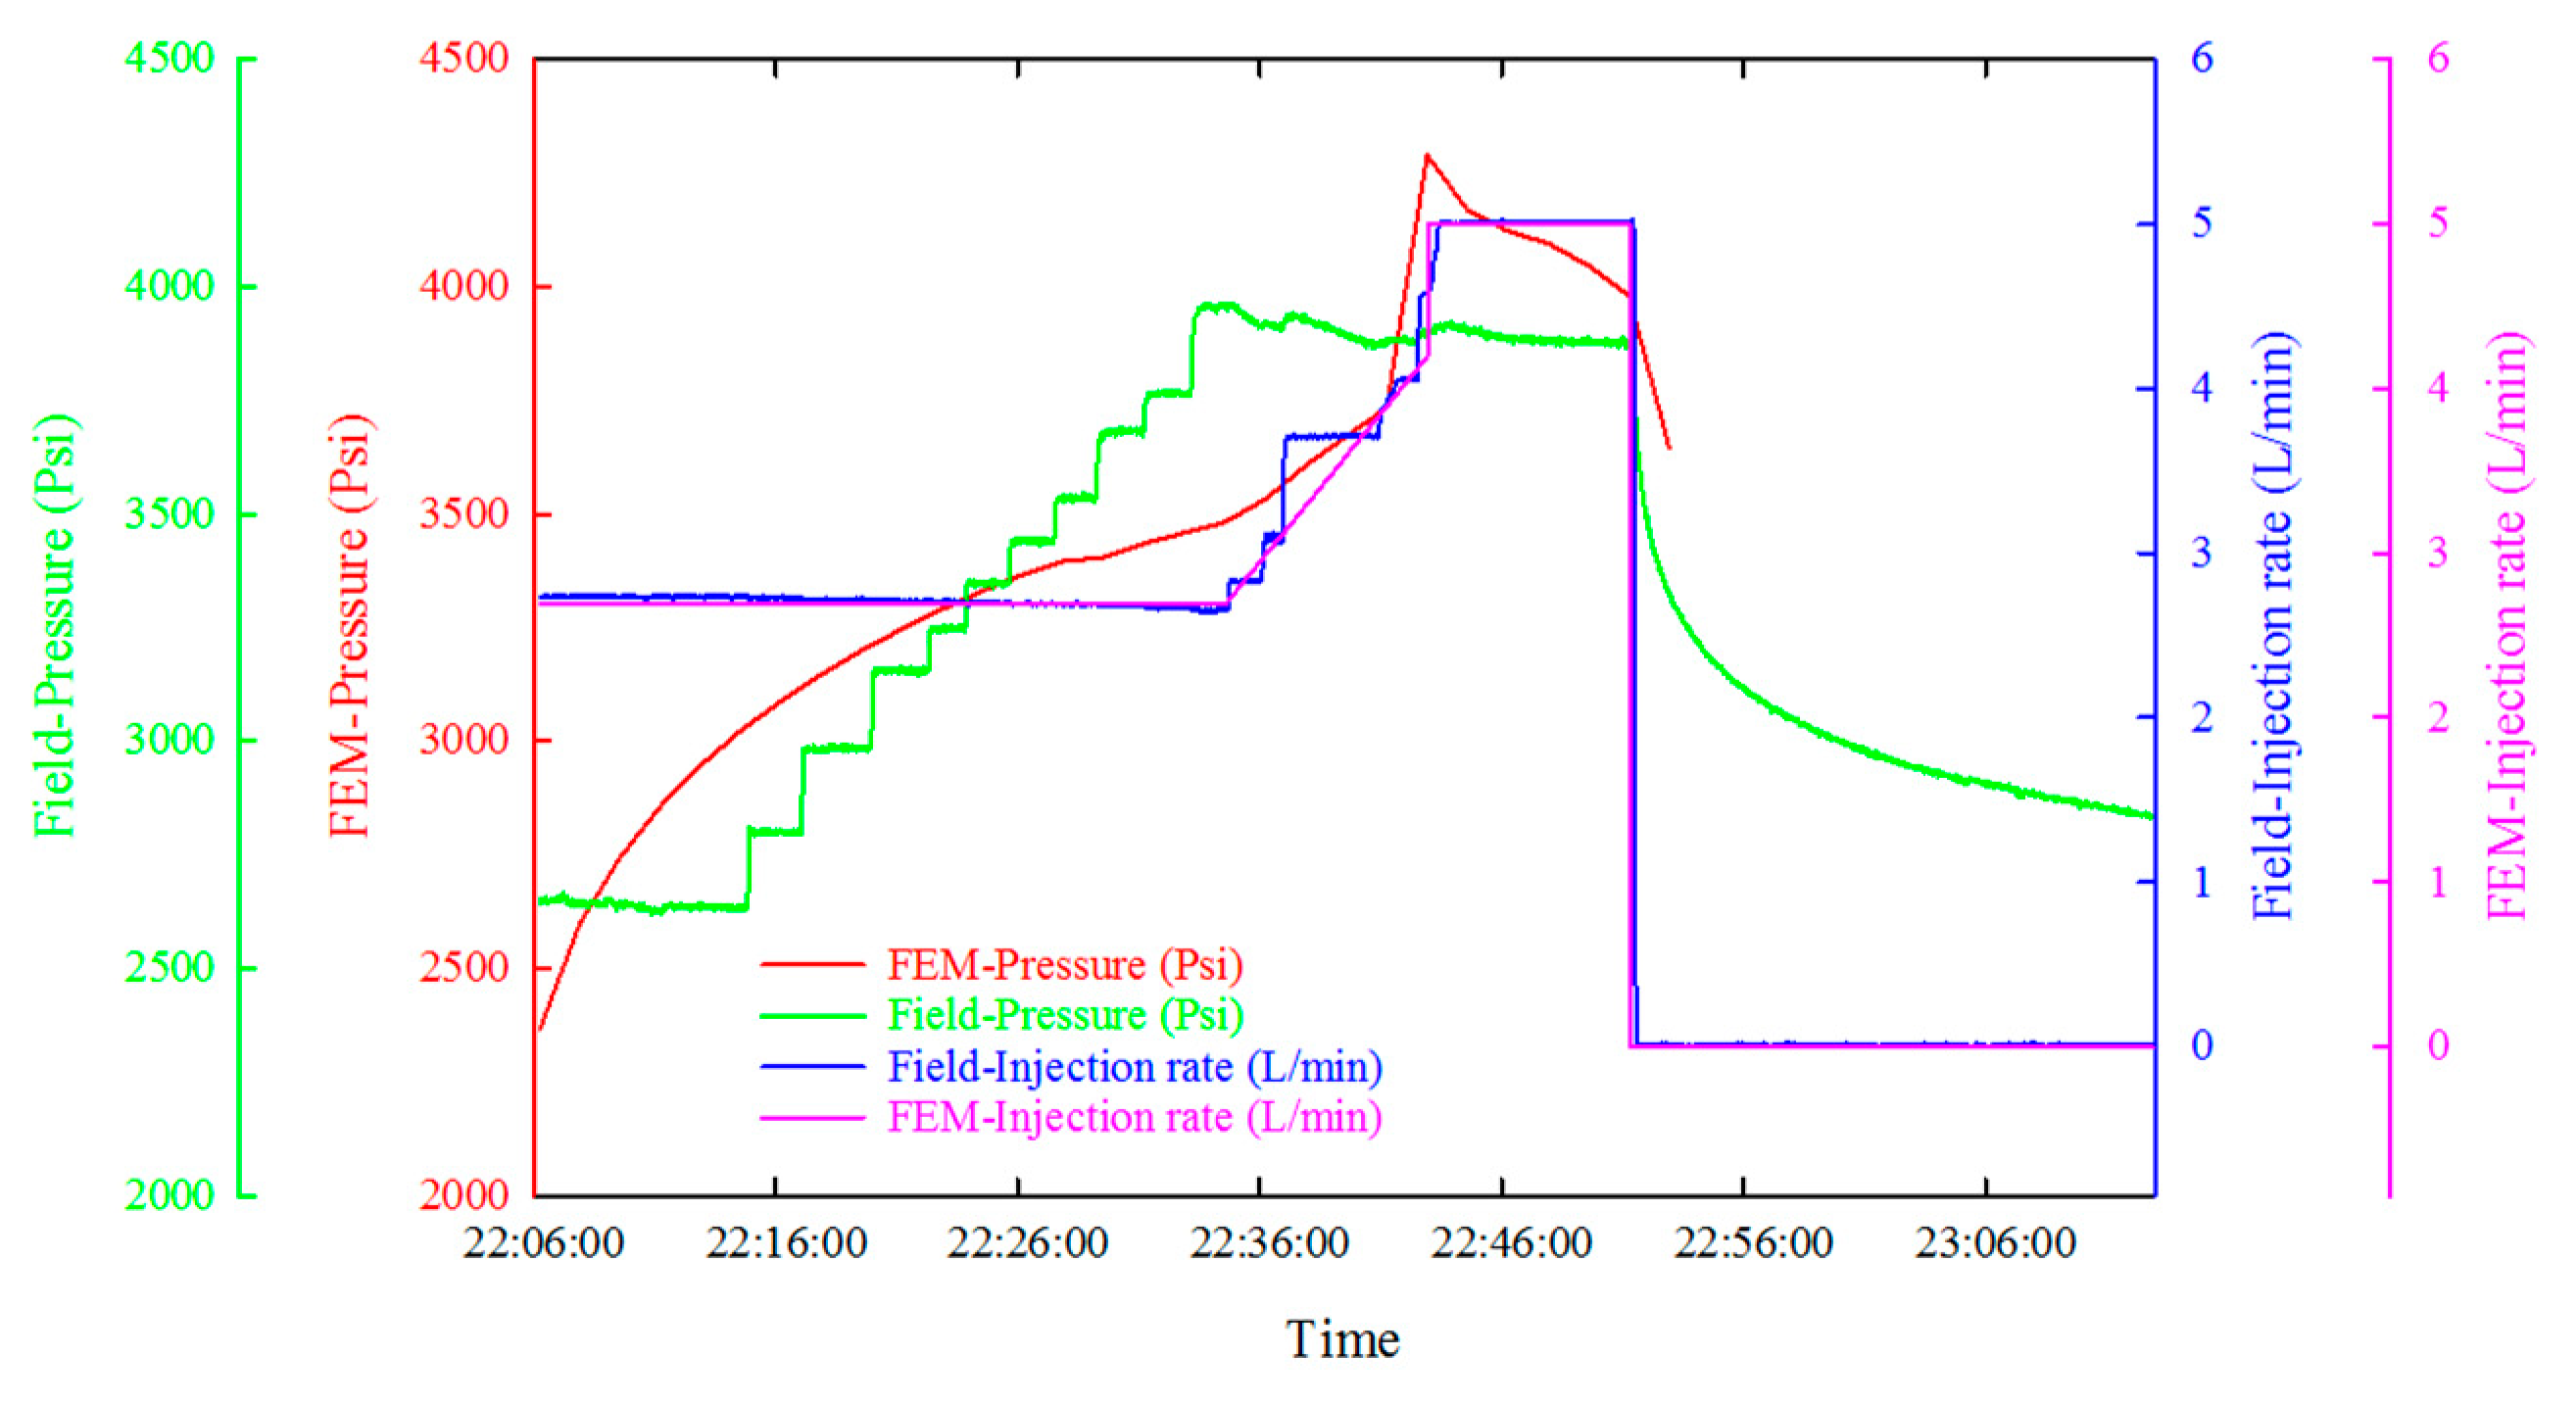
The injection profile of the Stim-II HF ≅ 164 Notch is shown in Figure 6a [2]. As can be seen, the pressure drop is approximately 1 MPa and is indicative of a small hydraulic fracture and/or dilation of natural fractures. Because two natural fractures and Notch ≅ 164 practically are located at the same place in the hole the injected fluid can easily enter the two natural fractures [12]. The injection profile of the test on May 24 shows that the injection rate is relatively high (maximum flow rate is 5 L / min and duration was 31.7 min) in comparison with the injection rate on May 23 (maximum flow rate of 0.4 L / min and duration was 65.2 min). In addition, our simulations how that the pressure drop for fracture initiation form a notch would be larger than 10 MPa. Therefore, it can be suggested that the flow pathway from the injection well was formed by opening and extension of a natural fracture rather than by initiation of a new hydraulic fracture from the notch.
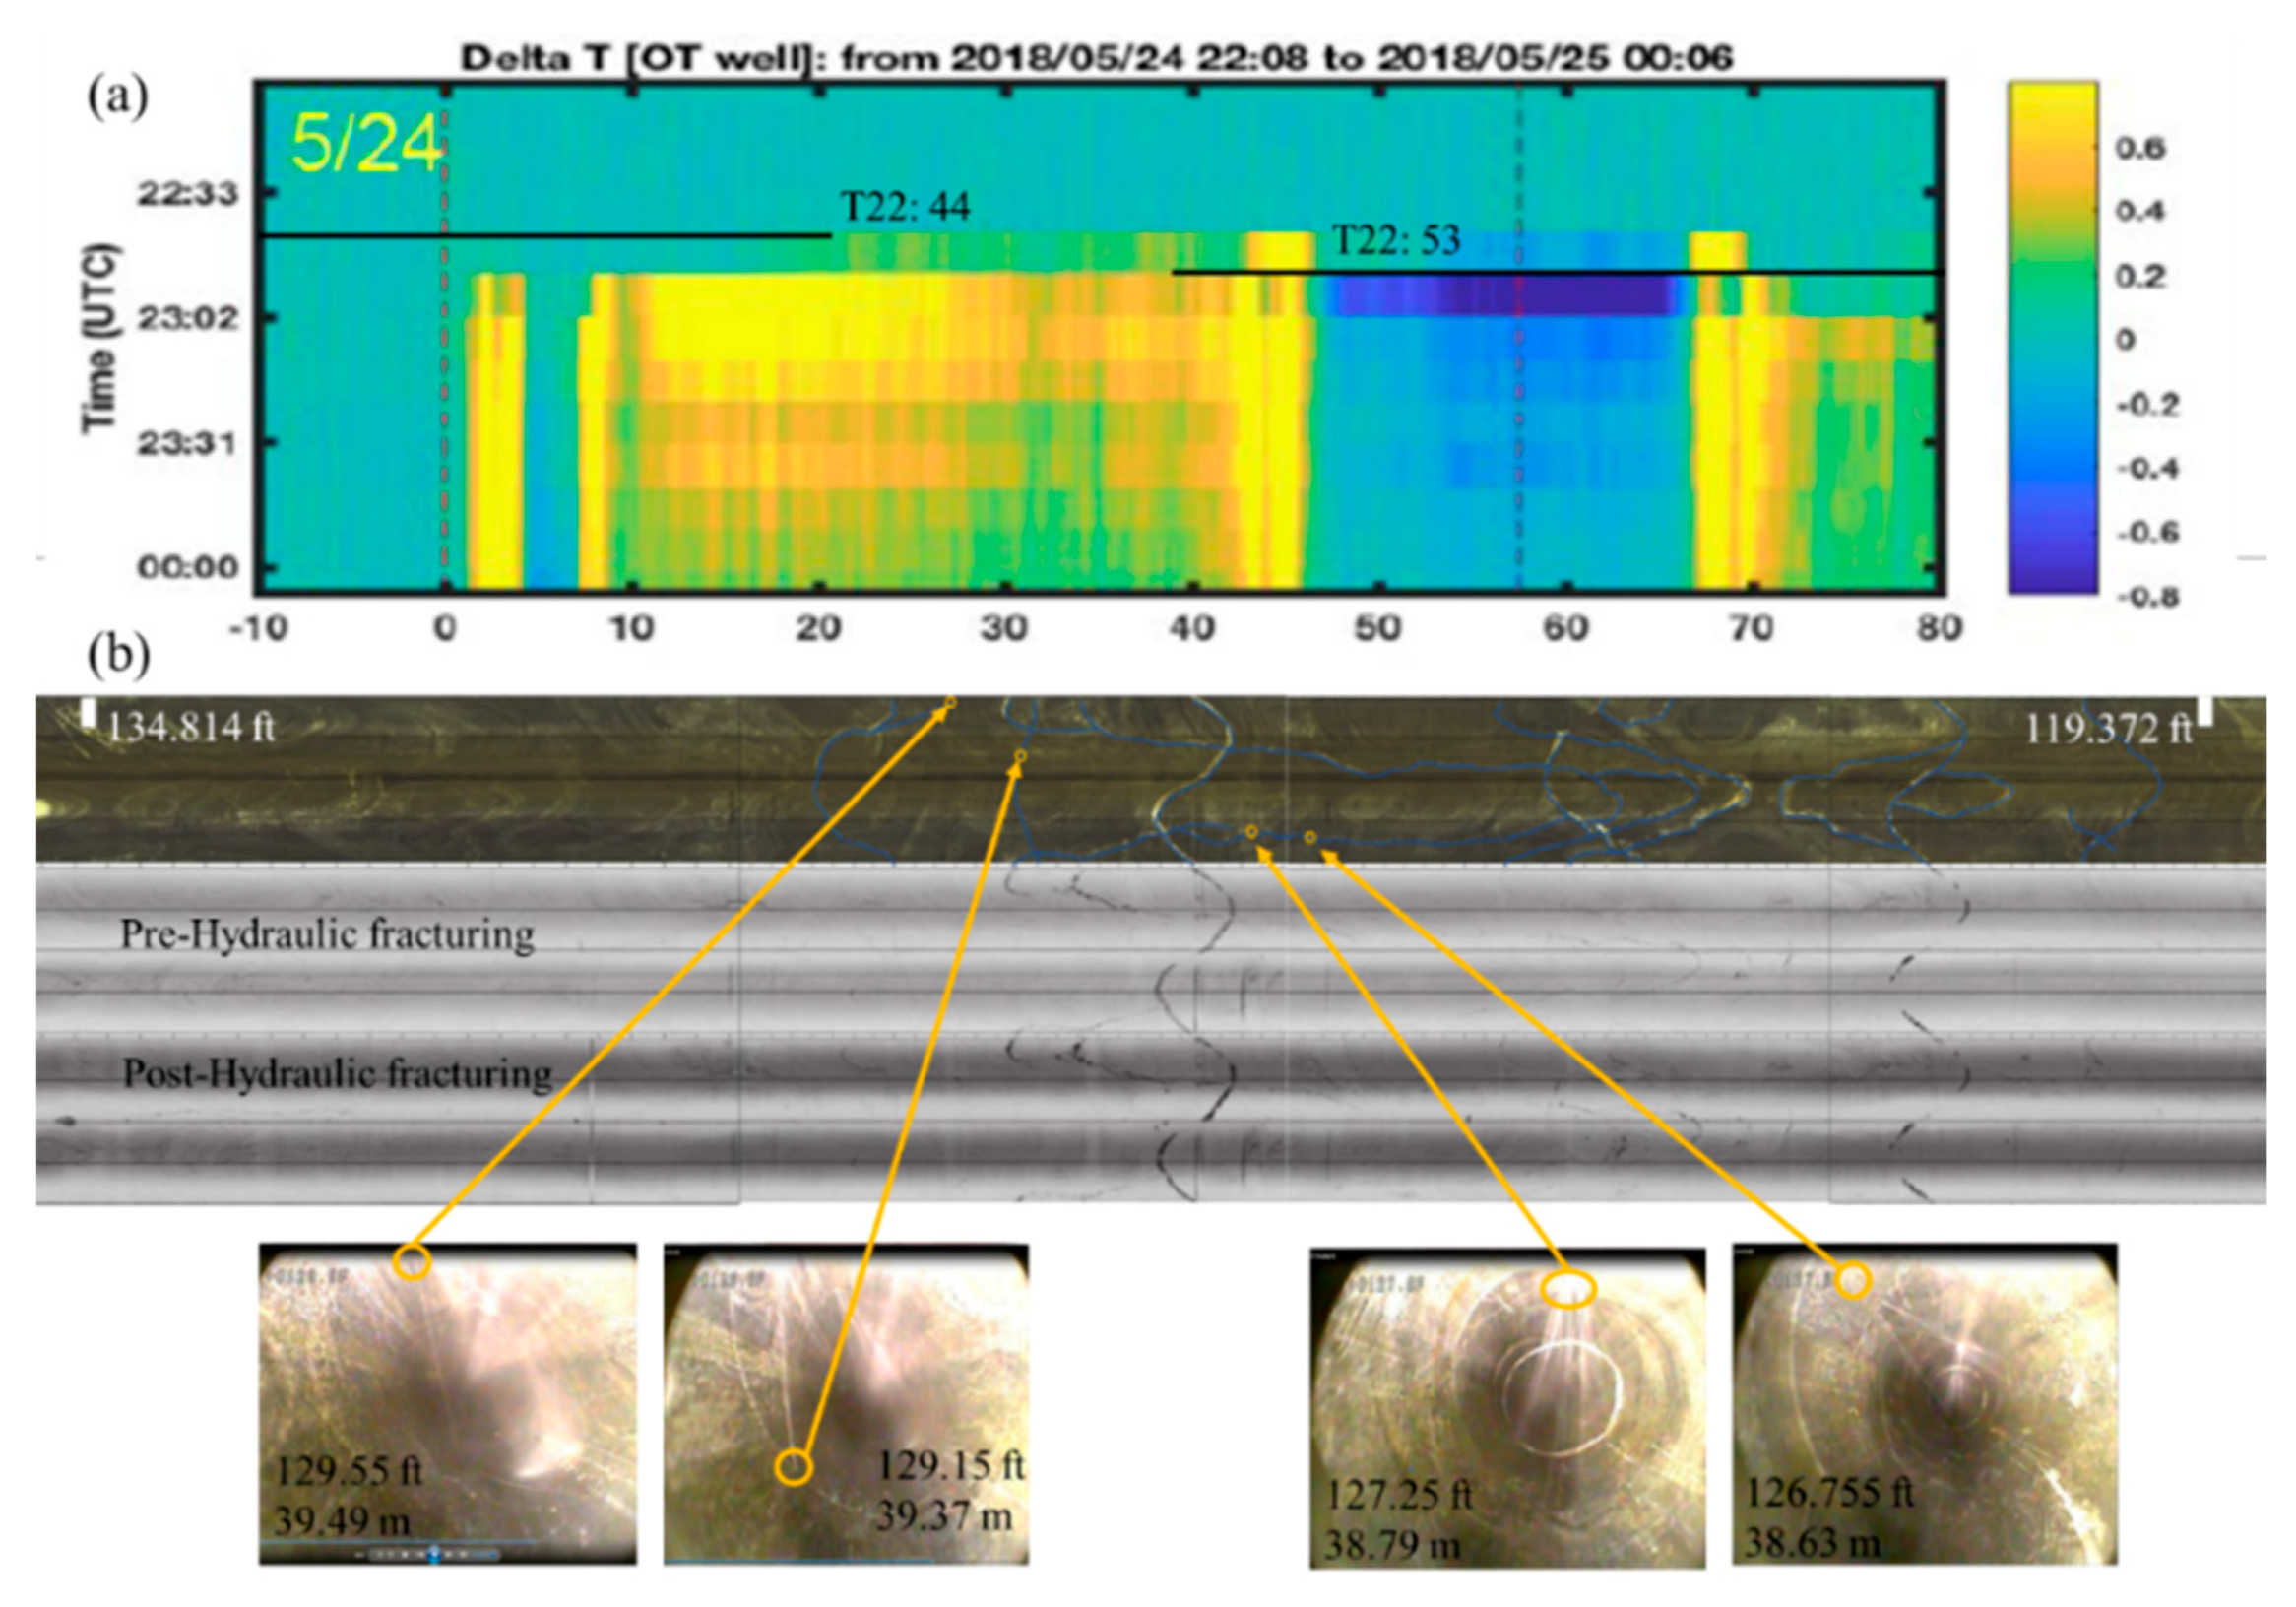
Two direct manifestations of the Stim-II HF ≅ 164 Notch stimulation have been suggested by the Collab team: (1) temperature anomalies at time T22:43 of 2018/05/24 injection in the well E1-OT (Figure 7a) and (2) visible fluid flow out of the production well E1-P during the circulation stage (maximum flow rate of 4.6 L / min for 31.5 min) on 2018/05/25 (Figure 7b). The latter has been suggested to evidence a hydraulic connection between the E1-I and E1-P in response to the Stim-II HF ≅ 164 Notch in the form of a hydraulic fracture from the notch. That is, a hydraulic fracture was initiated from Stim-II HF ≅ 164 Notch and propagated approximately 12 m and subparallel to the S Hmax in a radial manner [54,55]. Further, they have concluded that the outflow in the production well E1-P is due to the hydraulic fracture(s) intersecting the production well. As we mentioned above, the pressure profile and the overall rock mass geometry and its response to injection does not correspond to the initiation and propagation of a radial hydraulic fracture. Furthermore, actual laboratory injection experiments in the Poorman schist clearly show [56,57] water jetting out of a rock sample with veins similar to those observed in the production well. Therefore, it is highly likely that the jetting action in the production well results from a pressurized zone of natural fractures in the vicinity of the production well E1-P. We used numerical simulations to test the latter hypothesis and describe some of the findings below.

4.1. Initiation of a Hydraulic Fracture or Opening of Natural Fractures

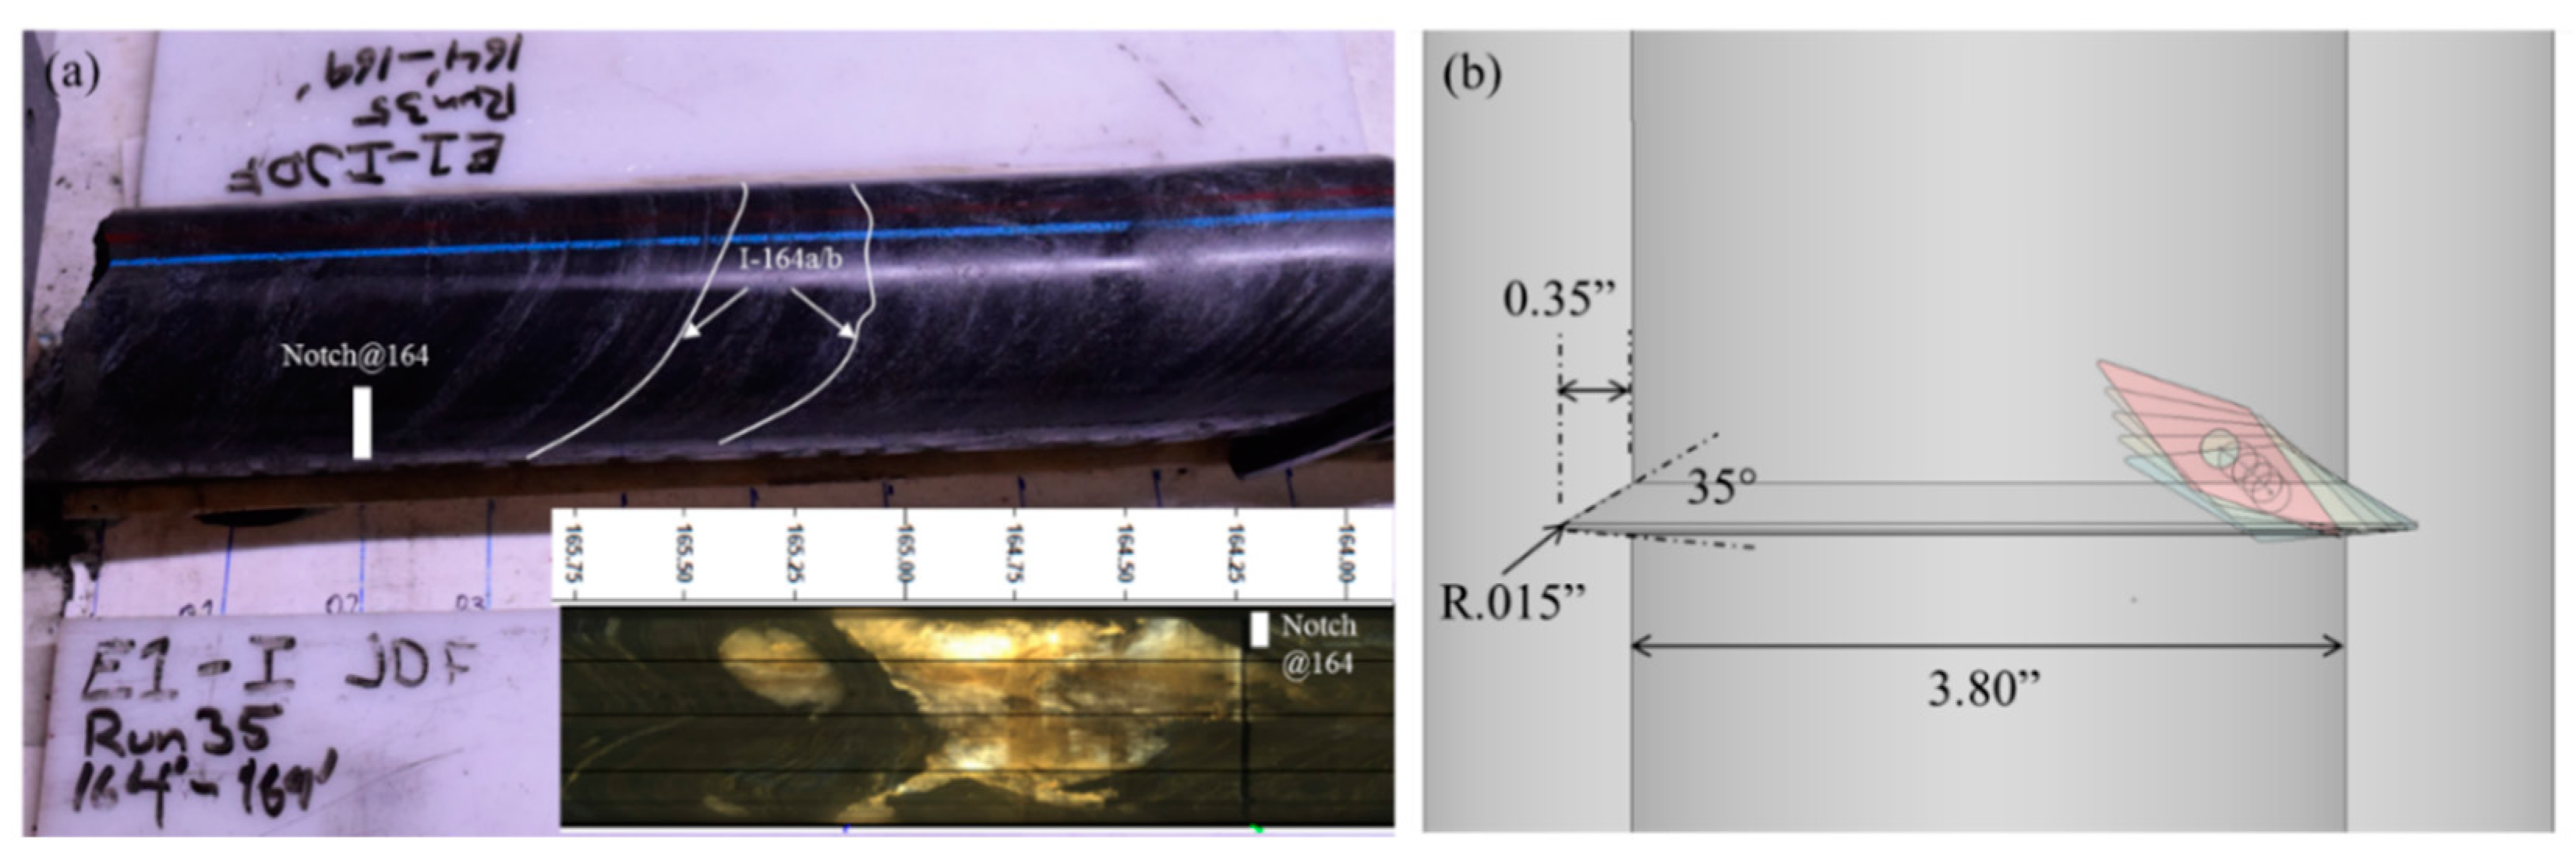
Two natural fractures namely, I-164a/b (at 164.4 and 164.6 ft depths along E1-I, respectively) are situated very close to the Notch ≅ 164 (164.24 ft depth) designed to facilitate a transverse fracture from the wellbore (Figure 8). The injection rate during the May 22 test interval was small (maximum flow rate of 0.2 L/min with a duration of 10.5 min) during the early stage “breakdown” and propagation so that if a hydraulic fracture was formed, it was likely only a very small one at Notch ≅ 164. In fact, our hydraulic fracture propagation modeling, using the model described previously, shows the radius to be only 0.25 m (Figure 9). Such a hydraulic fracture would almost overlap with the two nearby natural fracture I-164a/b. Therefore, it is more likely that the injection interval was connected with the rock mass via the link up of the hydraulic fracture with either or both natural fractures I-164a/b (Figure 8a) prior to extending far into the rock mass towards the production well. Or, the injection merely reactivated/dilated the natural fractures and established a flow path without a hydraulic fracture.
The injection rate of the May 23 test interval was also small (maximum flow rate of 0.4 L / min and duration was 65.2 min) during the early stage of a supposed breakdown and/or propagation, and if a hydraulic fracture did form, it intersected one or both natural fractures observed near the notch (Figure 9). This is because the wellbore is not completely perpendicular to S Hmax . The pressure decay following the test of May 23 (Figure 6a) indicates that the fluid may have leaked from natural fractures I-164a/b into the rock mass fracture (Figure 8a). On May 24 the injection rate was increased to a much higher value (maximum flow rate is 5 L / min for a duration was 31.7 min) but no concomitant significant pressure jump/drop was observed. The injection rate was more than ten times the previous value, so if a hydraulic fracture had extended 5–10 m at 0.2 and 0.4 L / min injection rates, a much larger hydraulic fracture (~30 m) would have resulted and one would expect some perturbations in the pressure profile. Alternatively, the higher injection rate could have likely dilated natural fractures I-164a/b and propagated (or by connection to other natural fractures) them to intersect E1-OT and E1-P. This is supported by the fact that a temperature increase was detected at E1-OT at T22:53 (Figure 7a) and water was produced in E1-P during the test interval on May 25 about 13 h after the injection was restarted (Figure 7b). Additionally, the injection pressure was significantly larger than the expected S hmin .

4.2. Modeling of a Fracture Network Stimulation Conceptual Model for the Notch ≅ 164 Experiment

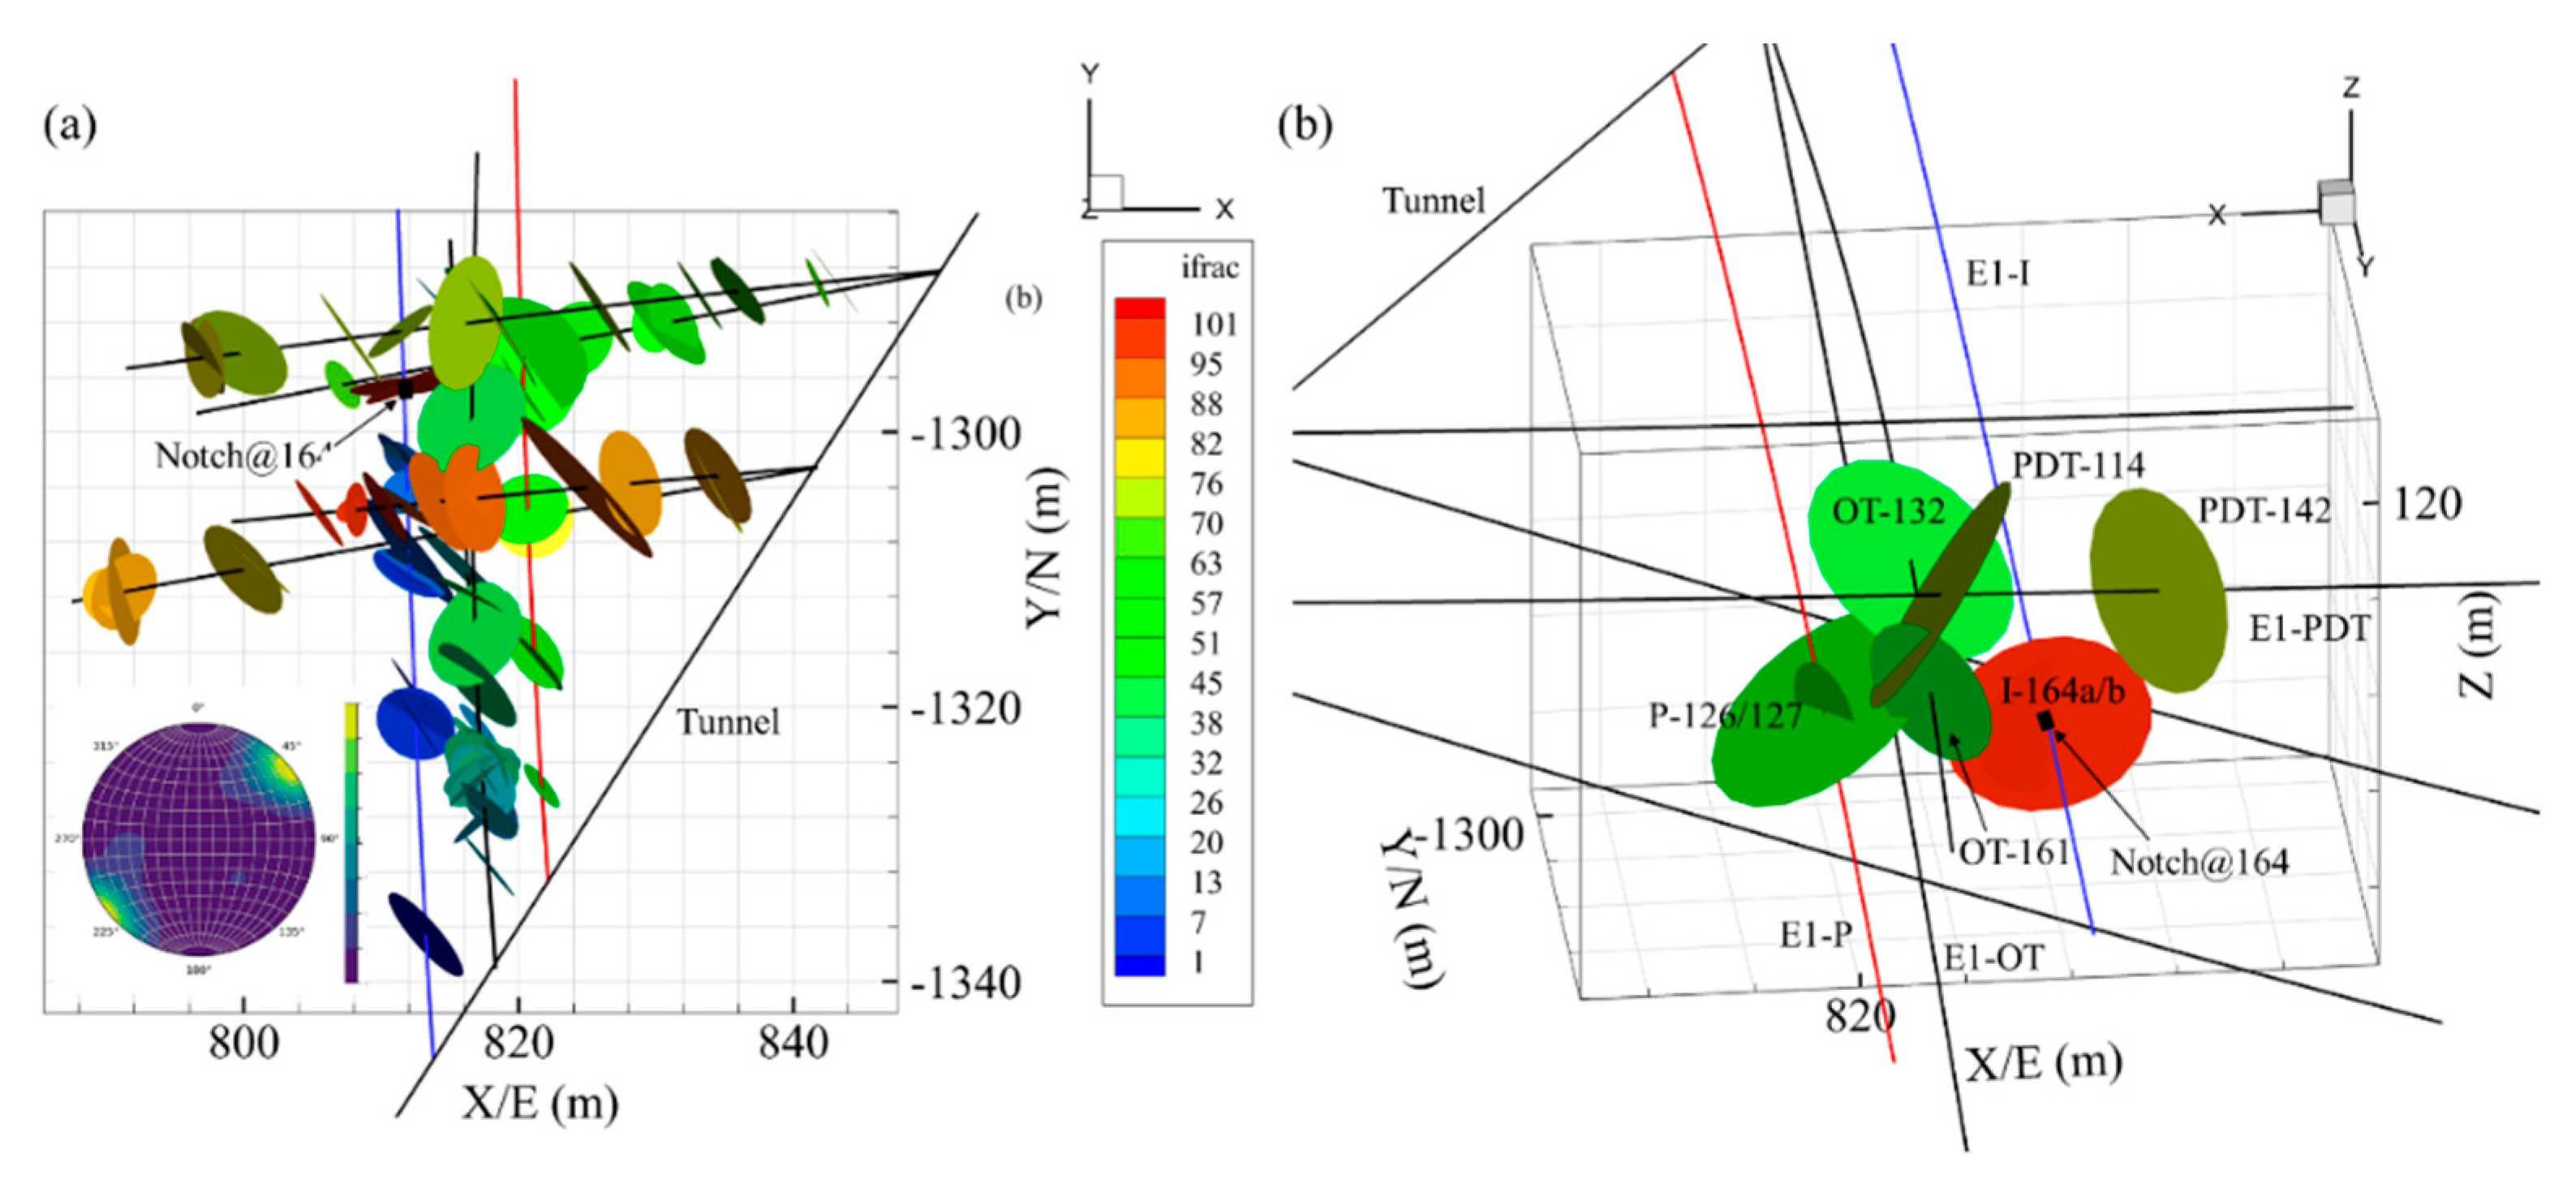
The alternative scenario we propose to describe the stimulation outcome is that the pressurization and/or propagation of natural fractures I-164a/b is responsible for the pathway to the production well and the observed water jets in it rather than a direct hydraulic fracture from Notch ≅ 164 with the E1-I with E1-P. In essence, this is a fracture network conceptual model of the EGS Collab Testbed Experiment 1. This scenario is indicated by results from dynamic fracture network modeling. The modeling relies on a dual-scale semi-deterministic fracture network by combining the data from image logs, foliations/micro fractures, and fracture properties from core and field data (e.g., length and asperity). Image logs and core data have shown 101 major fractures in the EGS Collab Testbed Experiment 1 and most of the fractures steeply dip see stereographic plot in Figure 10a [3]. The geometry of these major fractures and micro-fractures is listed in Table 2.
There are likely small-sized fractures and micro-cracks present near the major fractures, but they are not provided in the available data shown in the Figure 10a. The colors represent the major fractures index as described in the geological survey of the site. For example, the name of fracture 44 is OT-132, denoting the location of the center of the fracture 44 (OT-132) at 132.4 ft along the hole E1-OT. The two main natural fractures I-164a/b intersect the E1-I at 164 ft (Figure 10b). The centers of fractures I-164a/b and the Notch ≅ 164 nearly share the same location (I-164a/b are at 164.4 and 164.6 ft depths along E1-I, respectively) and they are very close to the Notch ≅ 164 (at 164.24 ft depth along E1-I). The length of isolated (via packers) injection zone is 64.8 inches (from 163.918 ft to 169.318 ft depths along E1-I). Thus I-164a/b is in this same injection zone (Figure 9a). Thus, it is likely that NFs I-164a/b are the primary connections, with or without their intersection by a hydraulic fracture from Notch ≅ 164, to the rest of the rock mass because of the low permeability of the rock matrix. An OT-PDT-P connection can be deduced from Figure 11b: E1-OT OT-161 PDT-114 E1-PDT P-122/126 E1-P or E1-OT OT-161 P-122/126 E1-P. Such a connection partly matches the field observation during the fracture mapping exercise [58].
The rock mechanical properties used in our modeling have been measured by various groups including the University of Oklahoma and various compilations can be found in [2,6,33,56,57]. The temperature of injection and rock matrix is 20 °C and 30 °C, respectively. In the current modeling we disregard the difference between the injected water temperature and rock temperature. This is because as shown in [59] thermal stresses develop much slower than the fracture propagation time scale. Although, there could be some impact on the injection temperature at the wellbore, however, in view of the small temperature differences (~10°) the impact is likely small. Here, the initial time step in the finite element model is 100 s. In this work, the Crank–Nicolson method is applied to discretize the time domain and it is unconditionally stable. The wellbore boundary condition is rate control. All unknowns and induced micro-seismicity are calculated at the end of each time step. The input parameters of fracture network are shown in Table 2.
Based on the natural fracture data, E1-I and other wells are not connected prior to stimulation. Fracture PDT-142, OT-132 and P-129 are close to I-164a/b, but they do not intersect each other Figure 10b. The zone surrounding the Notch ≅ 164 is isolated prior to injection. In our simulation, I-164a/b and the Notch ≅ 164 share the same location. I-164a/b (at 164.4 and 164.6 ft depths along E1-I, respectively) are very close to the Notch ≅ 164 (at 164.24 ft depth along E1-I). The length of isolated zone is 64.8 inches and is located from 163.918 ft to 169.318 ft depths along E1-I. Thus, I-164a/b are the primary conduits from the Notch@164 to the rock mass. Water enters the system at Notch ≅ 164 in E1-I and then flows into I-164a/b, pressurizing them. In the simulation, none of the natural fractures (I-164a/b and OT-132) show any propagation before T22:43. However, the field observations (Figure 7a) indicate a temperature change at T22:43 along a short section of E1-OT. This hydraulic communication signature in E1-OT is likely caused because I-164b is very close to OT-132 so the former can feed the latter. The calculated fluid pressure distribution within the rock mass and the fracture network at time steps T22:36 and T22:43 are shown in Figure 11. The natural fractures surrounding I-164a/b is pressurized and weeps zones (e.g., 40–53.5 ft along E1-OT) may be activated during the injection.
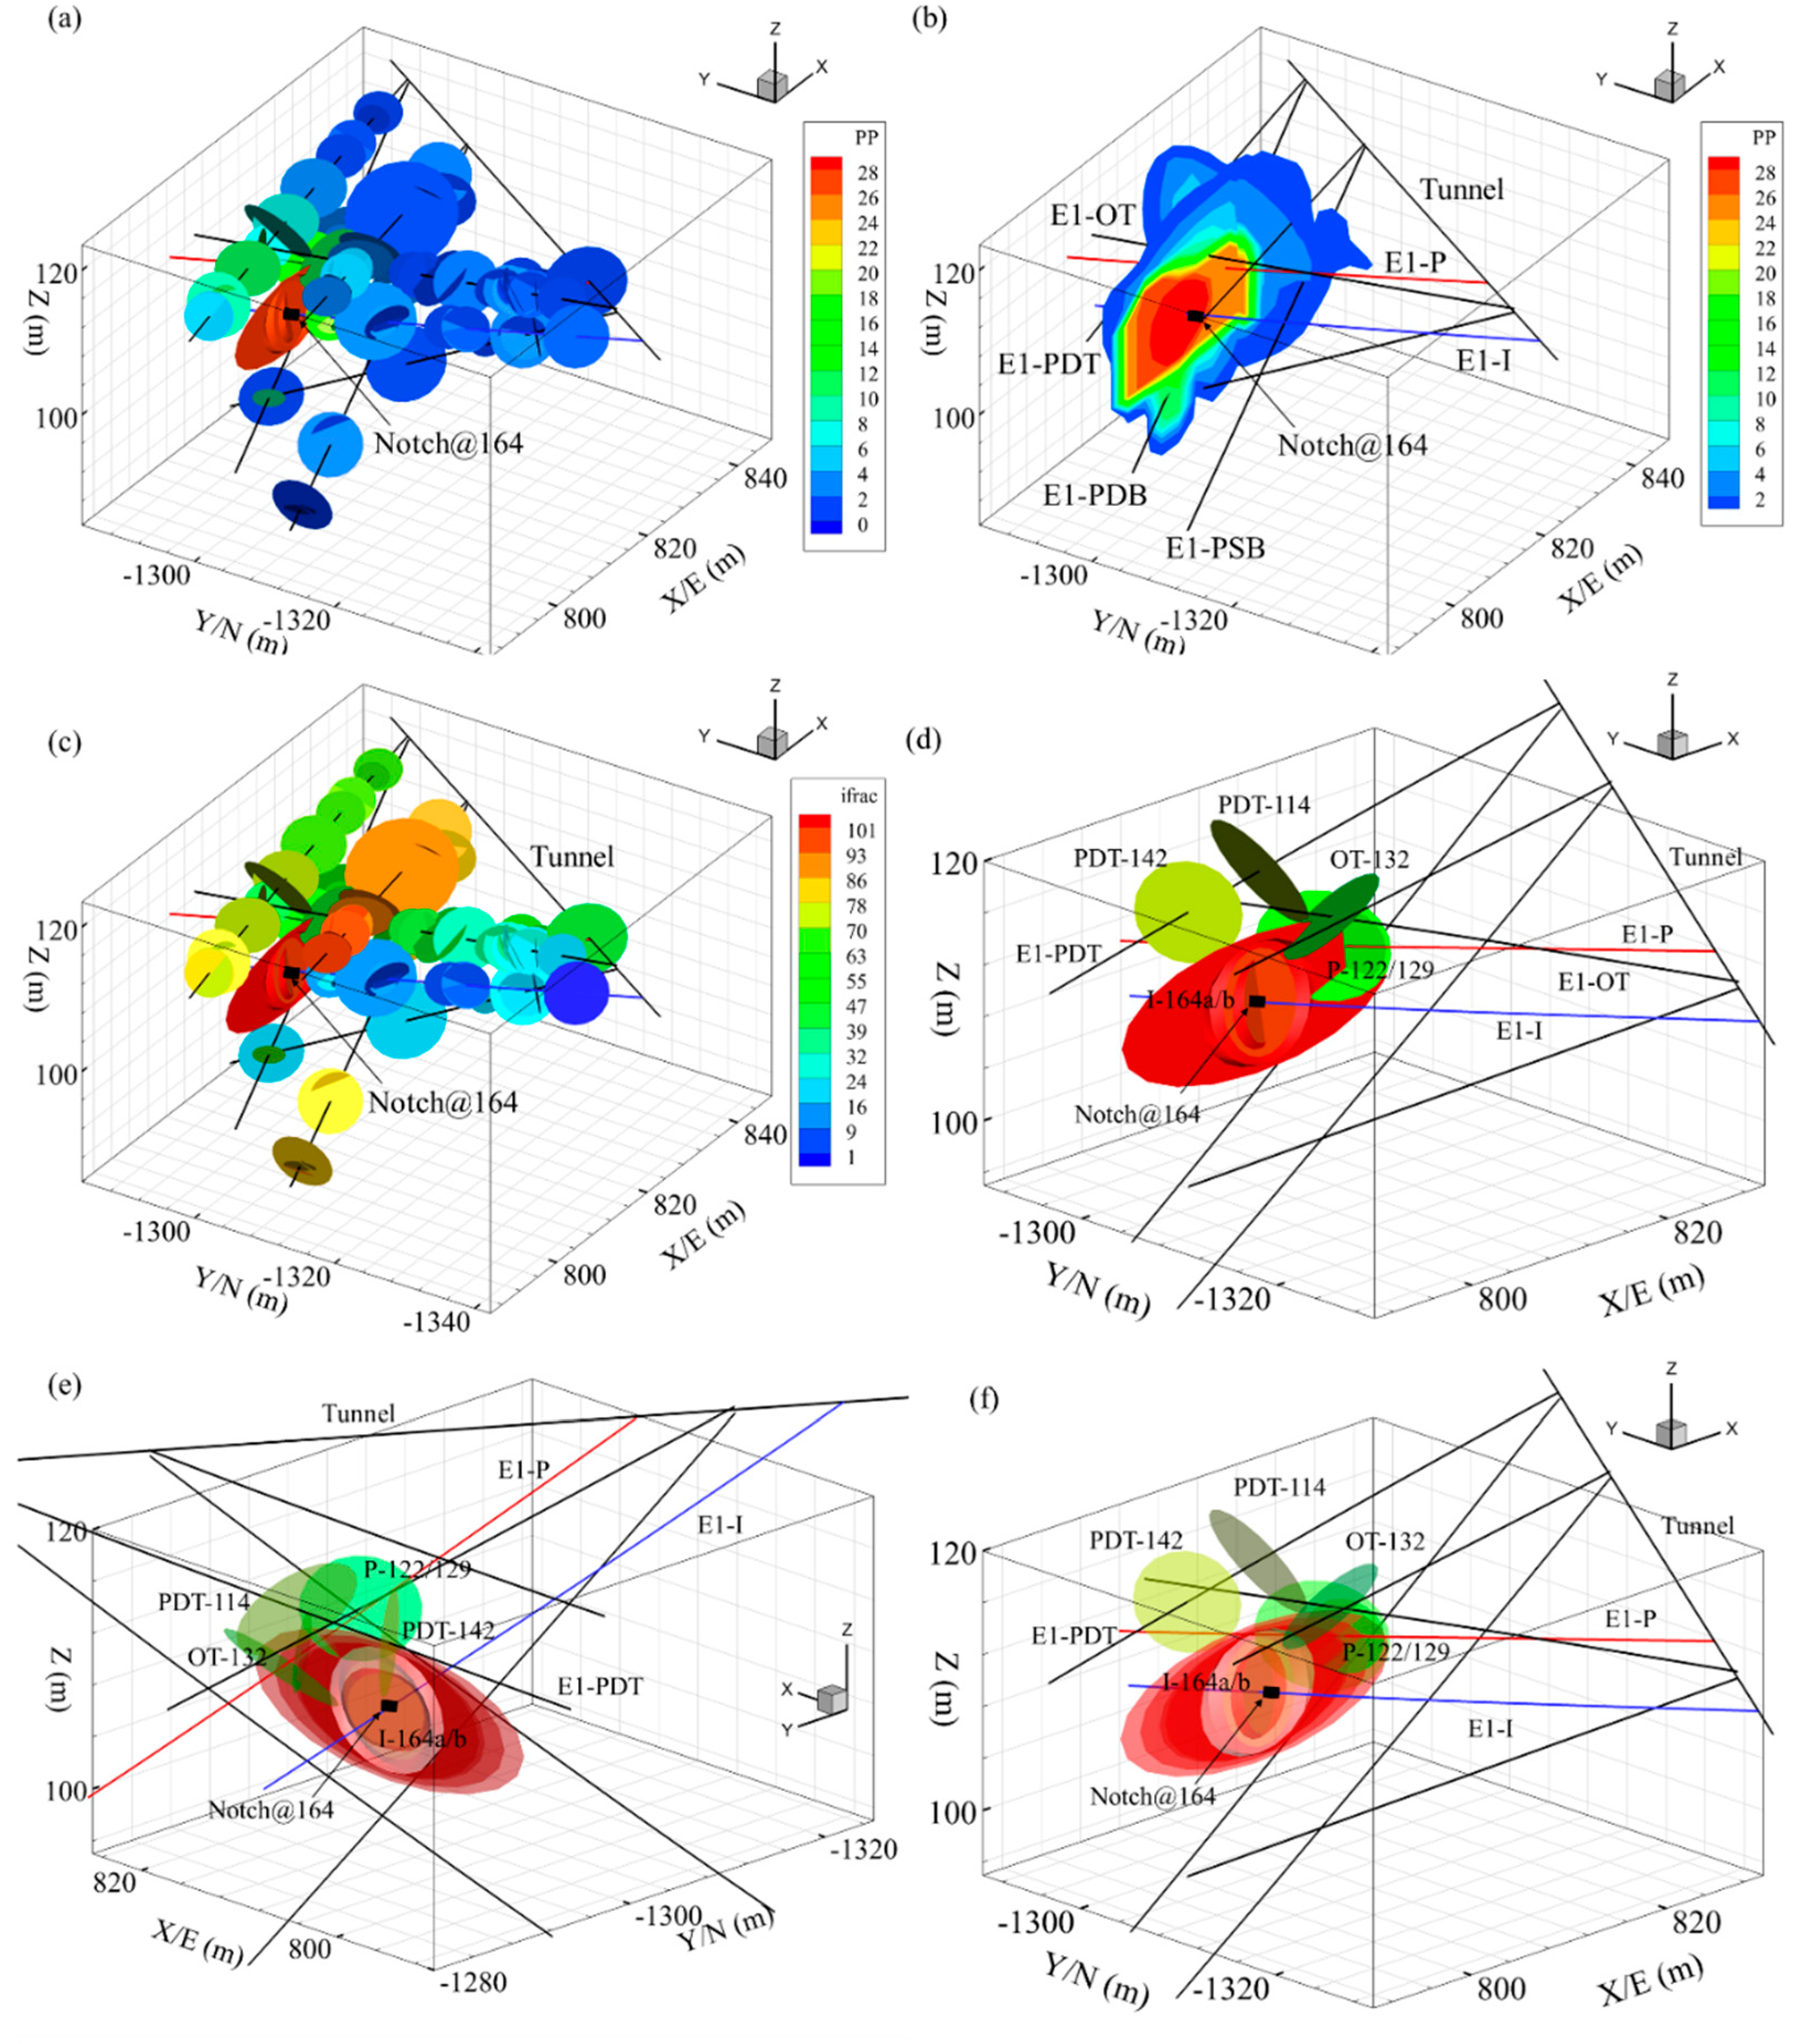
As injection continues, simulation shows that fracture I-164a/b starts to open and propagate (non-planar) at approximately T22:44 (Figure 12a,b). The natural fractures (e.g., PDT-142, OT-132) surrounding I-164a/b continue to be pressurized likely by fluid diffusing from I-164a/b into matrix because fractures I-164a/b is isolated. Figure 12a,b shows the calculated fluid pressure distribution within the reservoir and the fracture network at T22:44 and the total propagation length of I-164b is only approximately 0.5 m (Figure 13a/b). Such a small propagation of natural fractures I-164a/b is not sufficient to yield an effective flow path between E1-I and E1-P because I-164b only intersects OT-132 and its length at intersection is only 0.1 m (Figure 14b). The geometry of fracture propagation from numerical results does reflect the filed-observed variation of temperature in E1-OT (Figure 7a). Field observation indicates a temperature changed at T22:44 detected in a large zone surrounding the E1-OT which suggest injection fluid flowing to E1-OT Figure 7a. However, the values of temperature changes in E1-OT are not high (Figure 7a), suggesting that E1-I and E1-OT are only partially connected.
As the injection continues, I-164b starts to propagate along the maximum stress direction while I-164a remains stationary (Figure 13a,b). The total propagation length of I-164b at T22:45 is approximately 1.1 m. Figure 13c,d shows the calculated fluid pressure distribution within the reservoir and the fracture network at T22:45. Fracture I-164b starts to intersect with P-129 at T22:45, however the extension increment is approximately 0.1 m (Figure 13c,d) and thus E1-I and E1-P cannot not fully connected because their separation is larger 0.1 m. At T22:52, the I-164b has increased in size becoming relatively large (~10 m) which is shown in Figure 14c,d. Figure 14 also shows the calculated fluid pressure distribution within the reservoir and the fracture network at T22:52. The natural fractures (e.g., I-146, OT-161, PDB-116 and PDT-142) surrounding NF I-164a/b are pressurized and yet show no propagation (Figure 15c,d) in the model. Few fractures (e.g., PDT-114) slip after injection shut in (T22:53). The newly created fractures segment of I-164b form an effective flow path which tends to connect E1-I, E1-OT, E1-PDT and E1-P. The length of the planar propagation segment is larger than the length of non-planar propagation segment, and I-164b fully intersects with the OT-132, P-122/126/127/129 and E1-P. Several potential connection paths can be envisioned within the fracture network considering propagation and intersection of some natural fractures. E.g., injection well E1-I to production well E1-P, monitoring well E1-PDT to monitoring well E1-PST and production well E1-P to monitoring well E1-PST. The first potential connection path (Figure 15) is: from injection well E1-I to Notch ≅ 164, from Notch ≅ 164 to fracture I-164b, from I-164b to OT-132, from OT-132 to P-122/126/127/129, from P-122/126/127/129 to production well E1-P. Thus, E1-I and E1-P are effectively connected. The second potential connection path (Figure 15b) is: from monitoring well E1-PDT to PDT-142, from ODT-142 to I-164a/b, from I-164a/b to OT-132, from OT-132 to monitoring well E1-OT/PST-56, from PST-56 to monitoring well E1-PST. Such a connection path generally matches the field observation of flow [58]. The third potential connection path (Figure 15b) is: from monitoring well E1-P to P-126/129, from P-126/129 to I-164b, from I-164b to OT-132, from OT-132 to PST-56, from PST-56 to E1-PST. The uncertainties in connection paths will need be reduced with additional data. The pressure and rate of Notch ≅ 164 (SNL14) is recorded during the injection. Figure 16 shows the comparison between numerical results at Notch ≅ 164 and field data. Given the incomplete nature of the data, the numerical results and field data are in reasonable agreement. The real pressure profile can be captured more closely by considering the effect of near wellbore tortuosity, however, that feature is not included in this work.
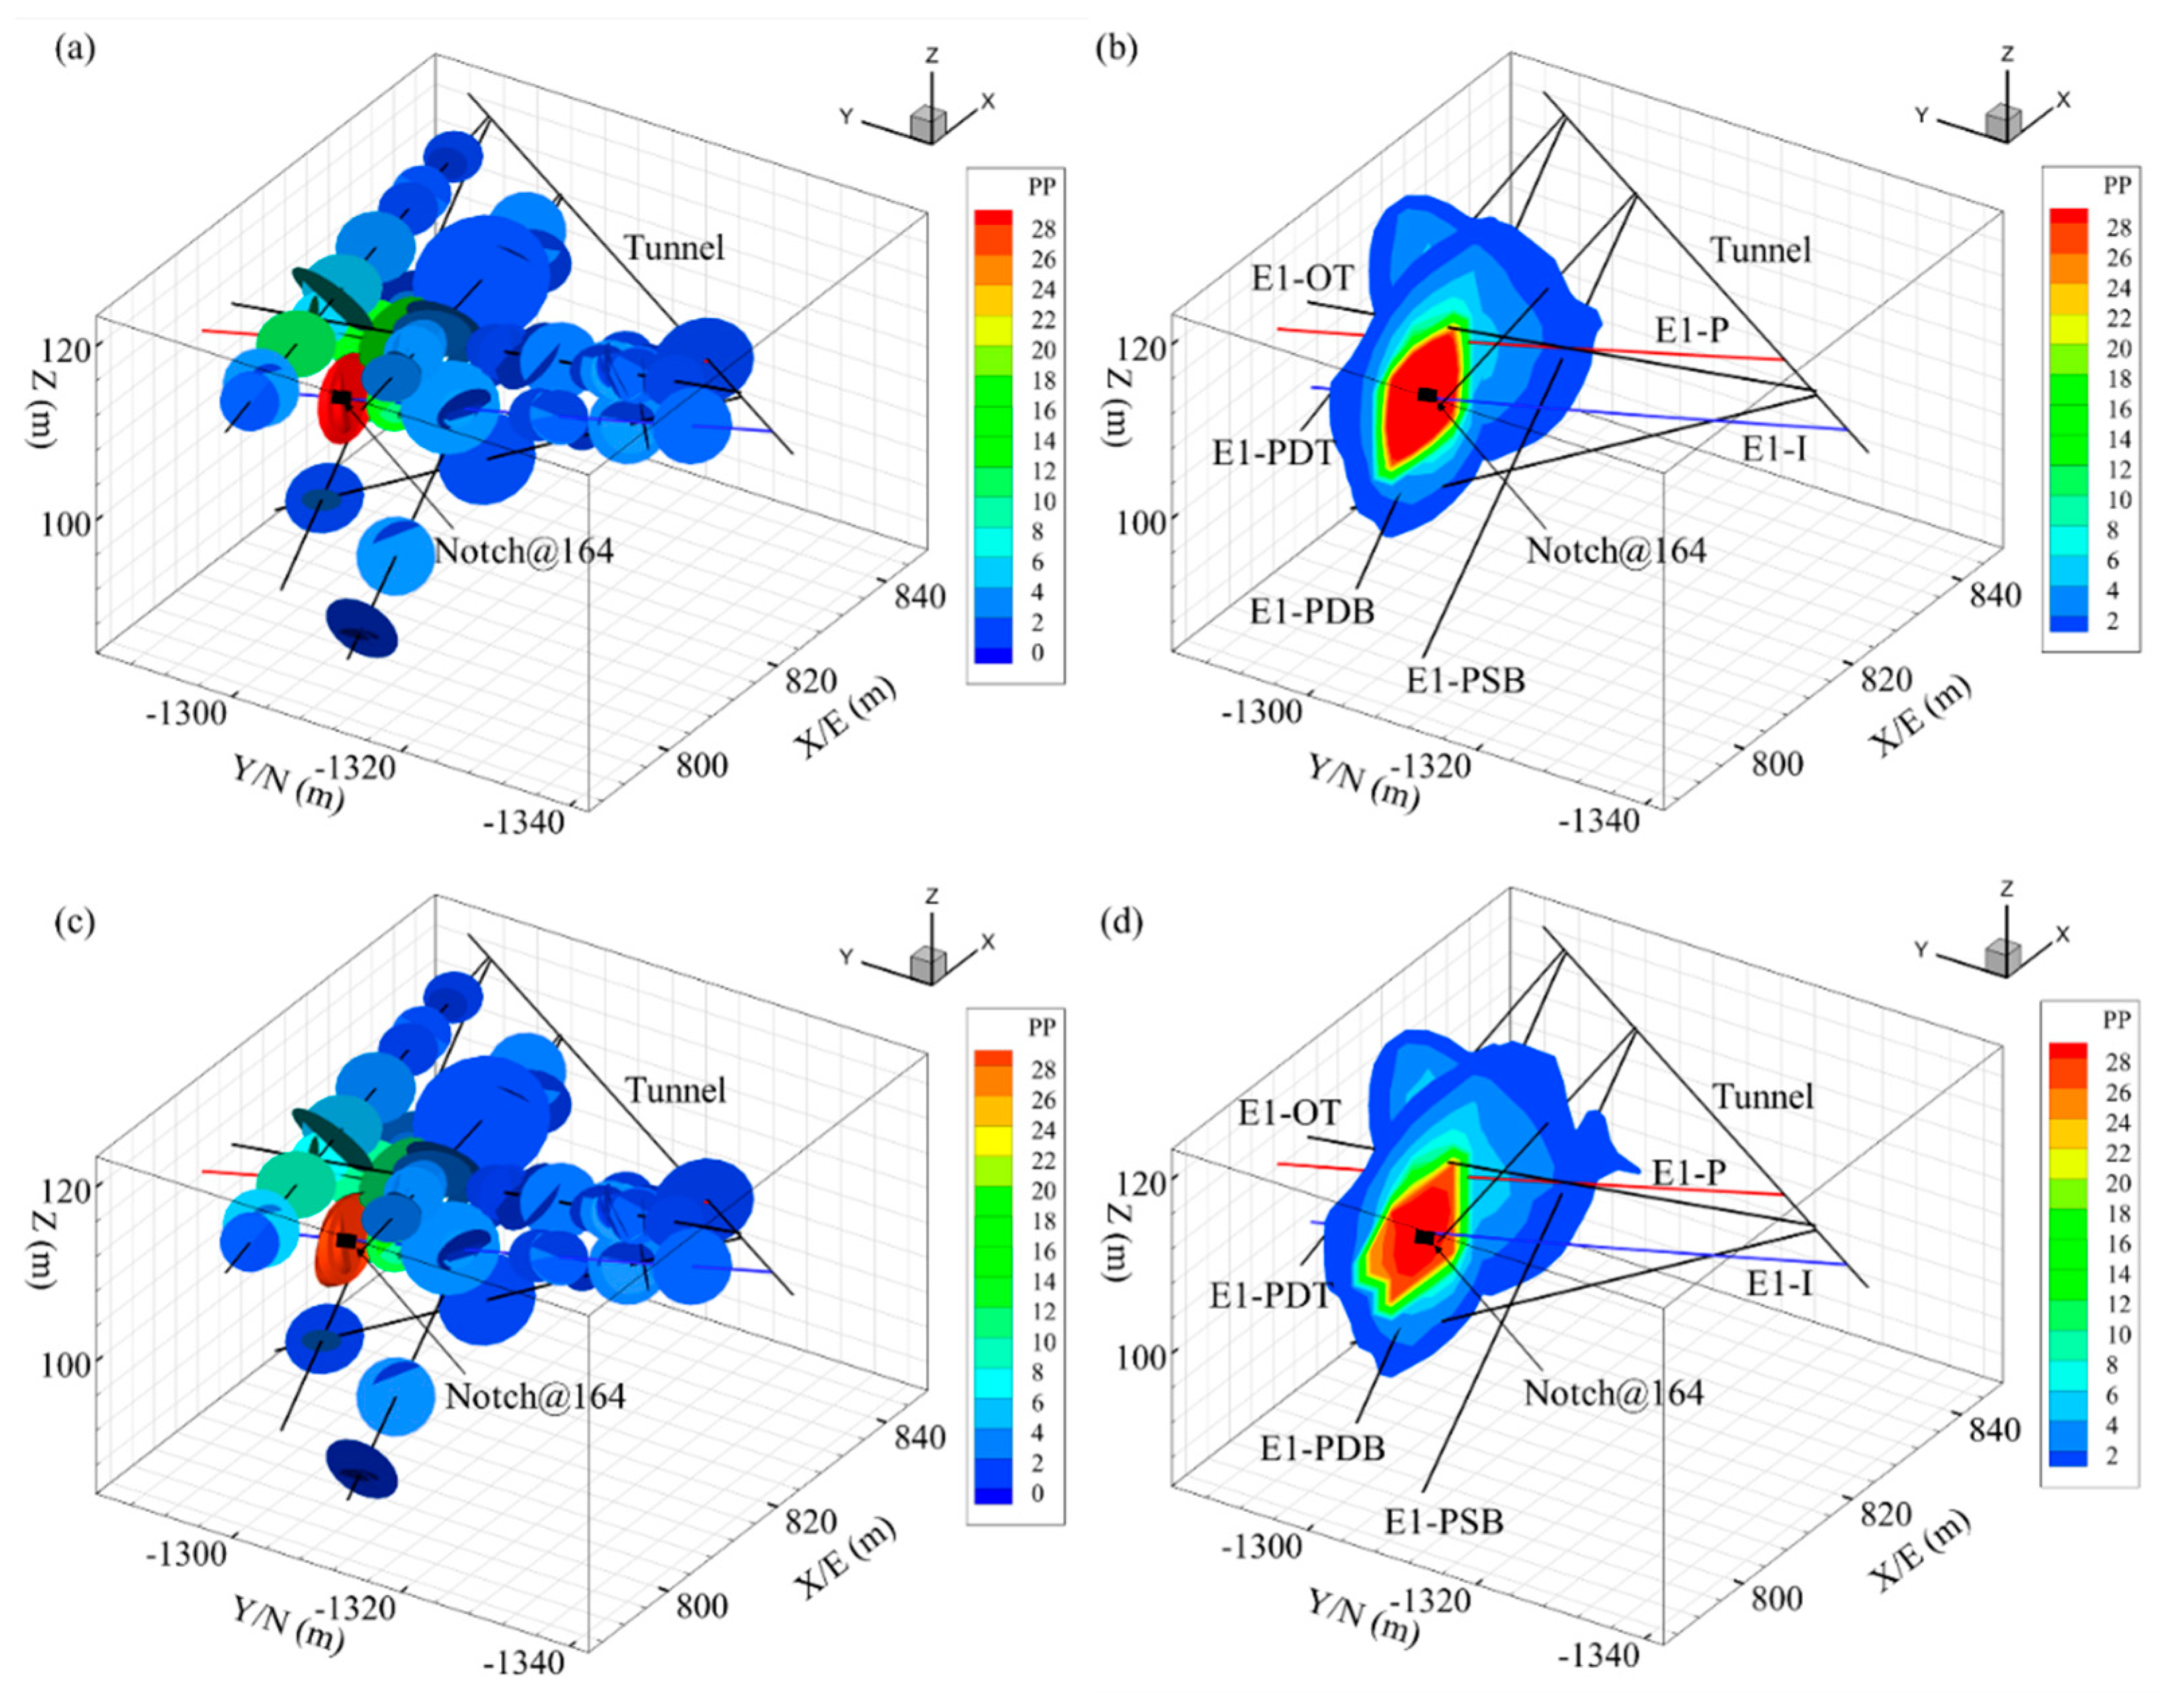
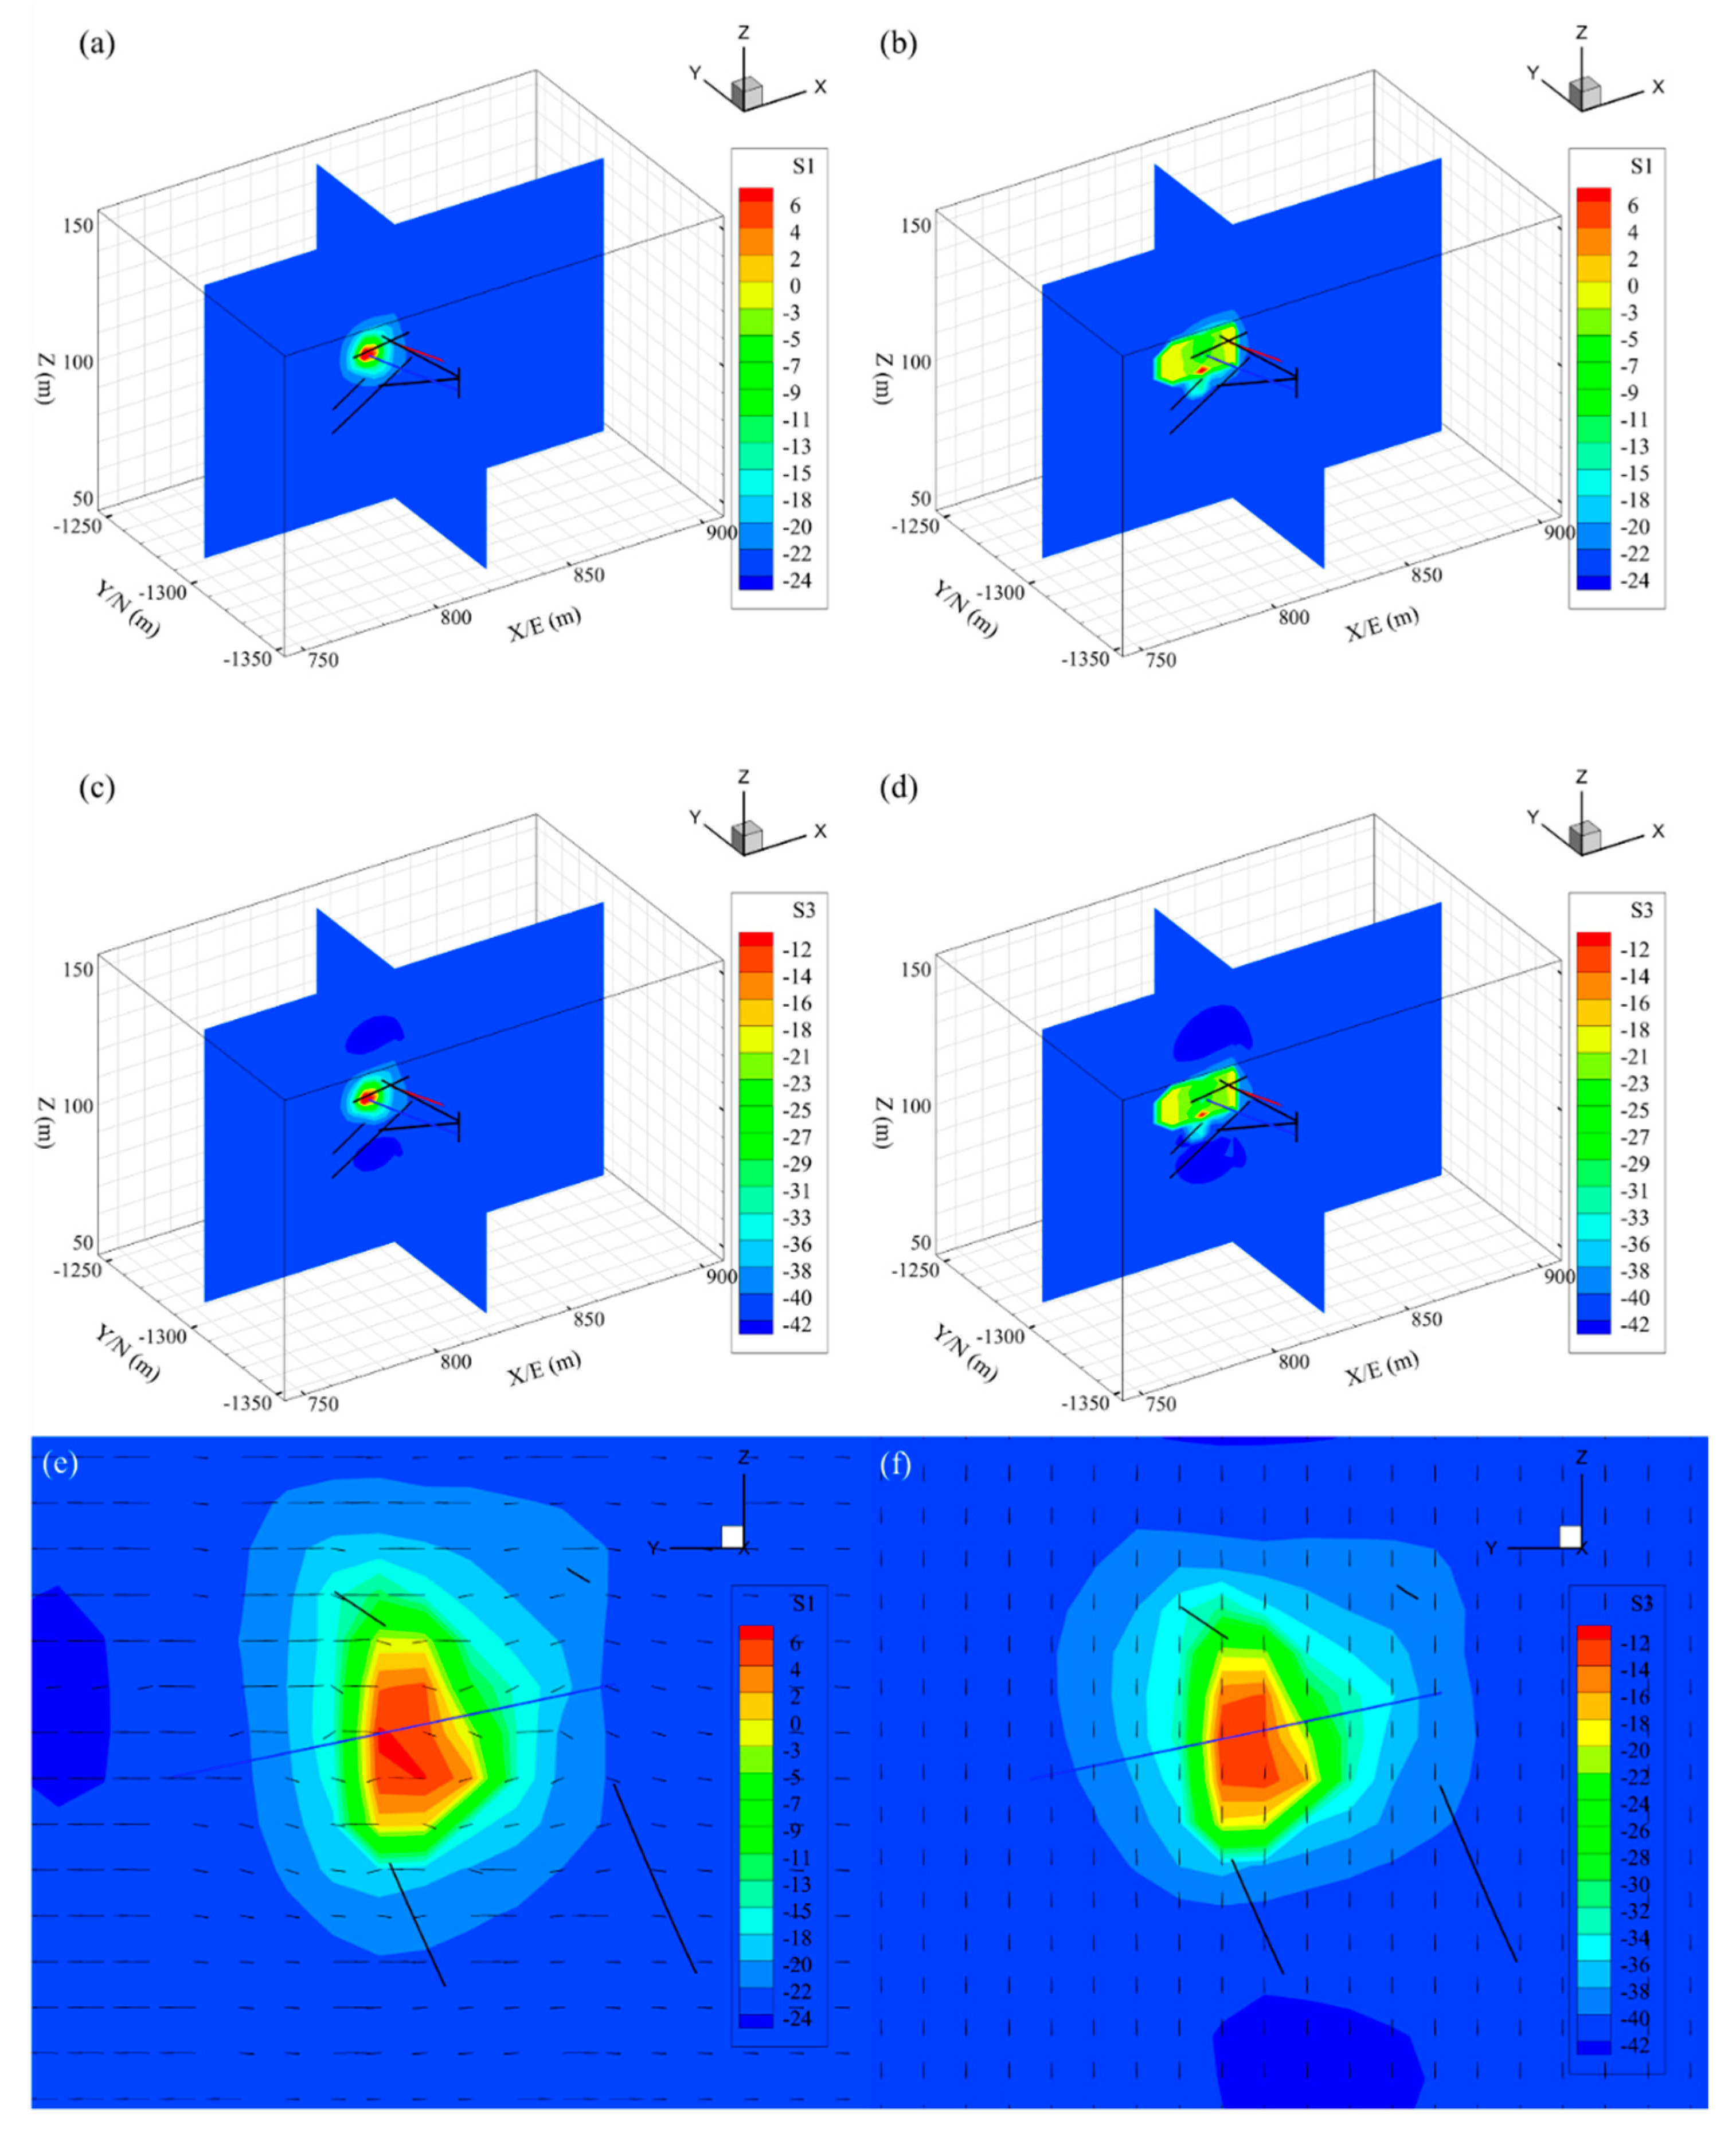
The simulation of the injection test shows that three factures slipped namely, I-164a/b and PDT-114. The number of simulated MEQ events was numerically obtained and is plotted in Figure 17 for comparison with the field-observed data. The number of the simulated events and field-observed events are 298 and 246, respectively. Figure 17d is the magnitude-frequency distributions of the simulated events. The b-value is model is predefined based on the field studies, and the a-values is fitting number. The evolution of the effective principal stress is shown in Figure 18.
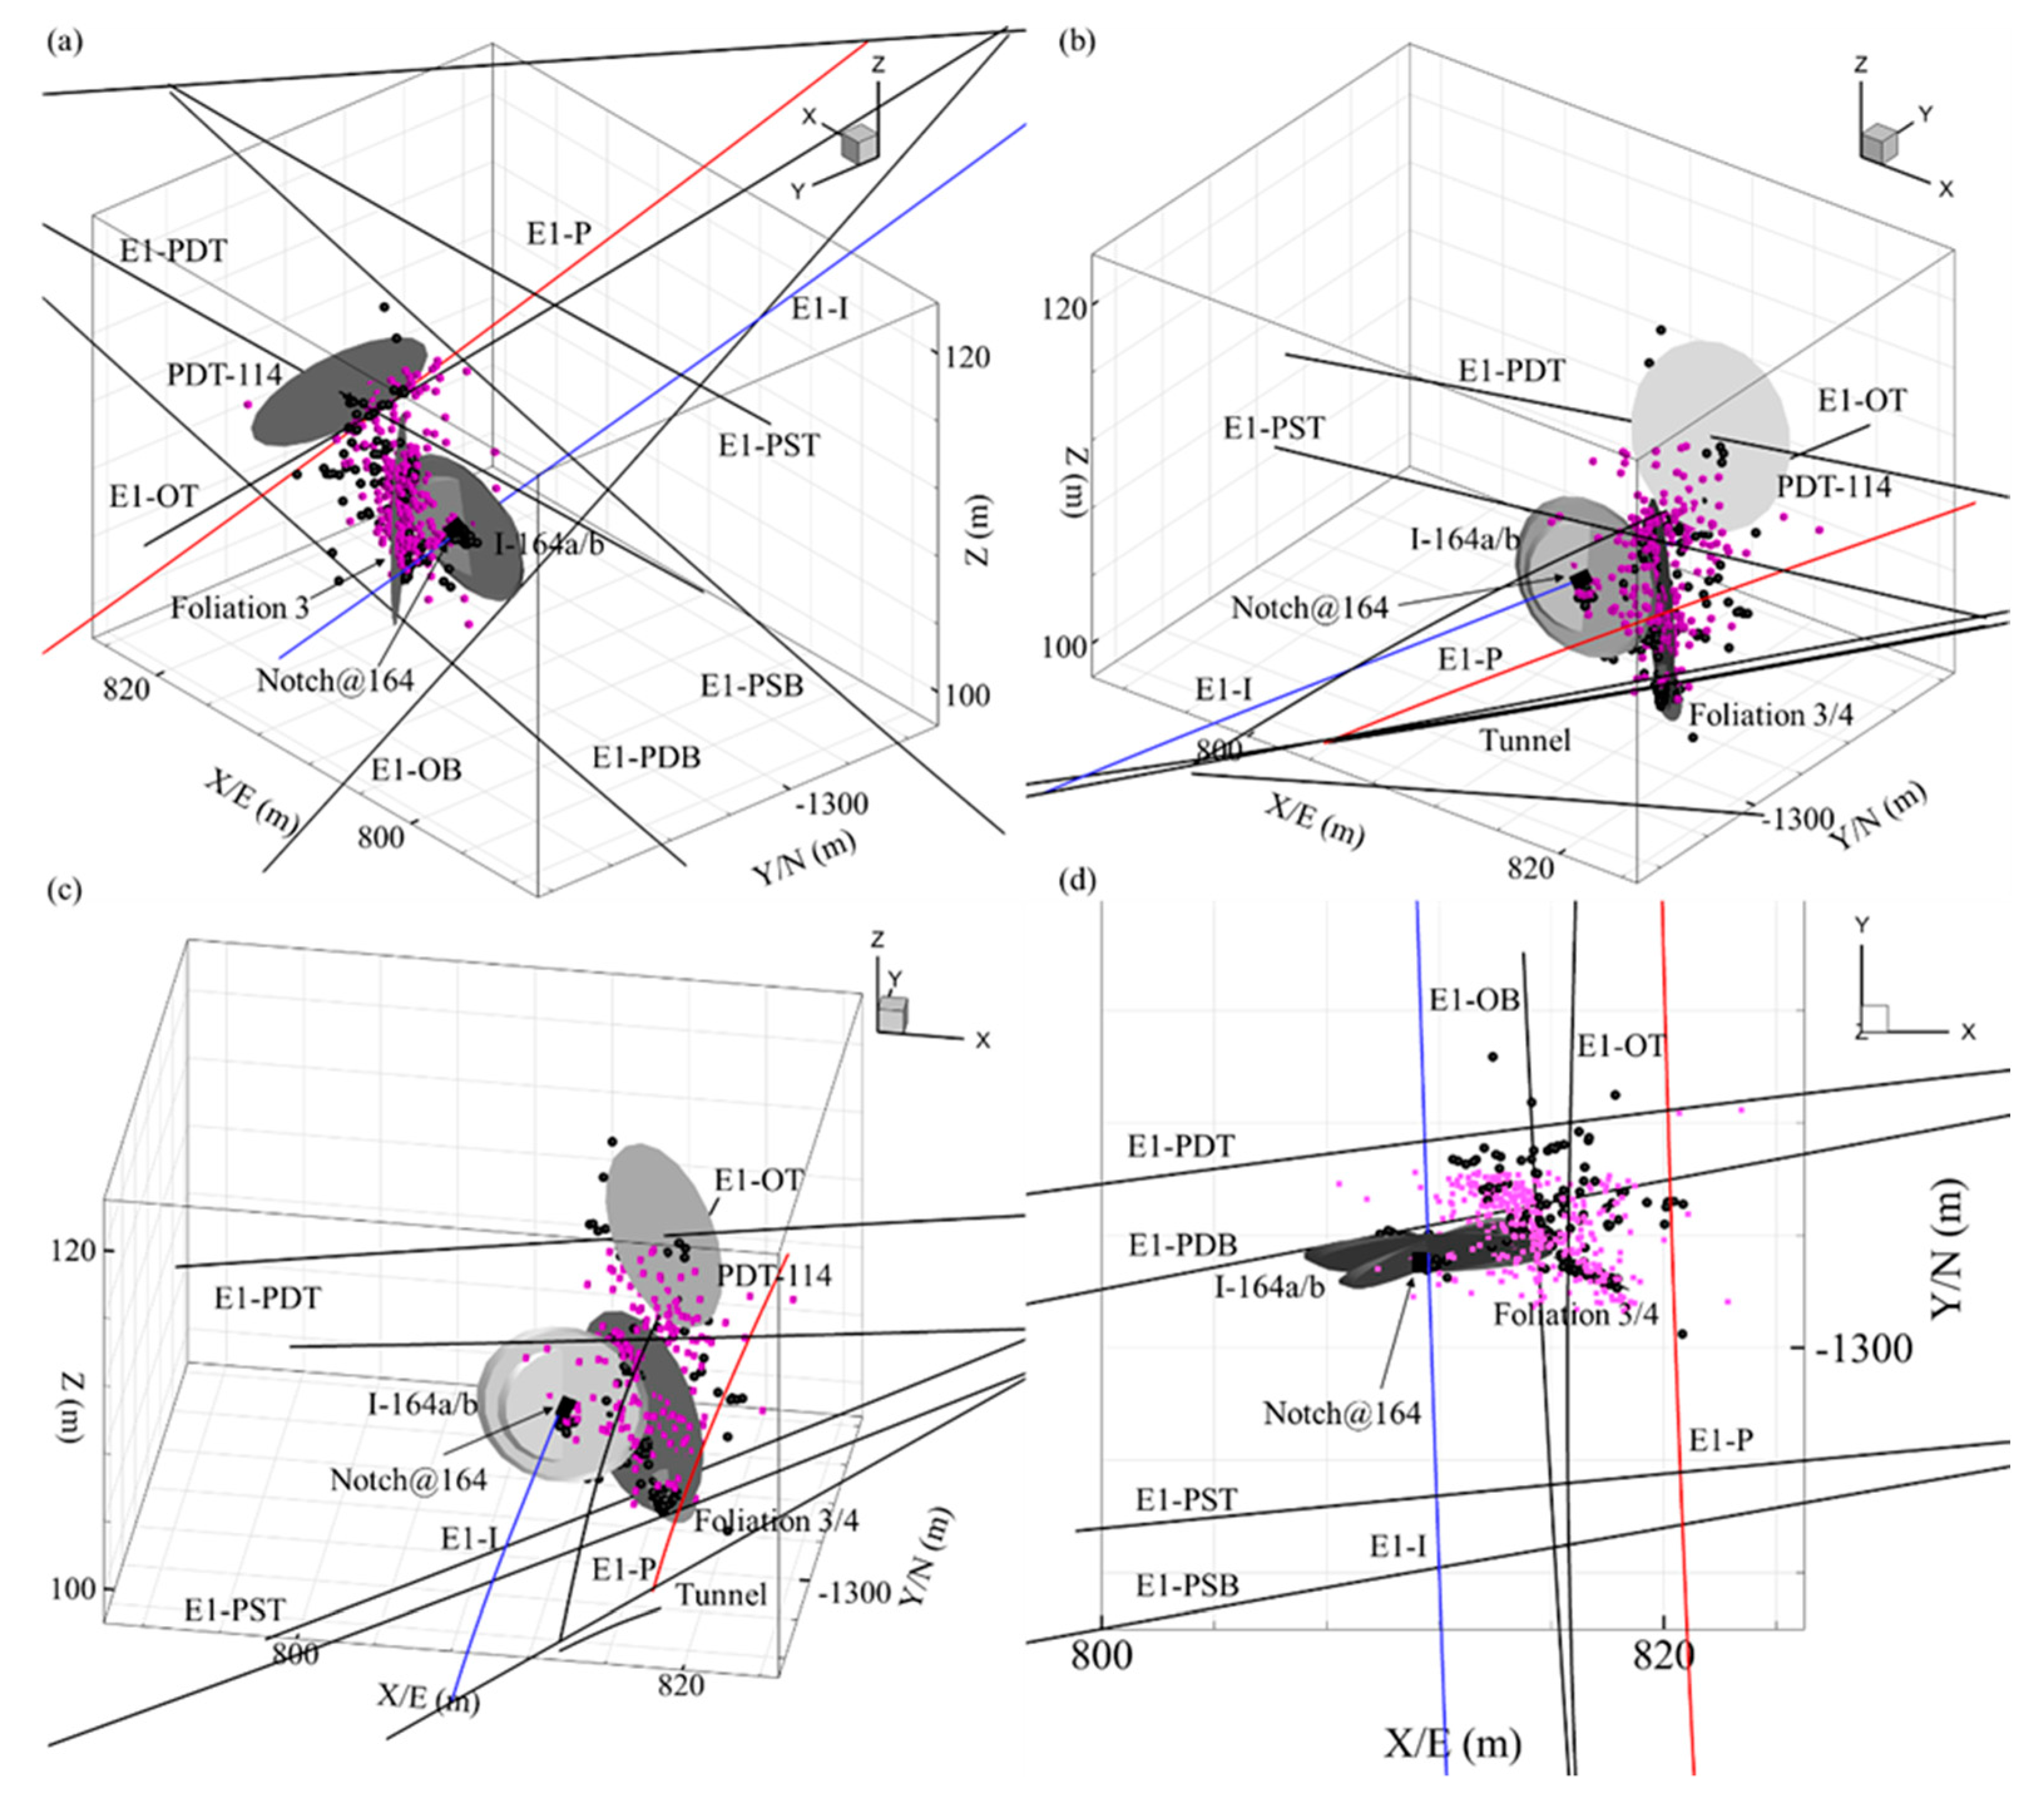
Most field-observed events are distributed in the zone between the E1-I and E1-P. The location of the simulated events matches the field-observed events in this zone very well because the newly extended fractures I-164b penetrates this zone and sub-parallel to S Hmax . It suggests that the geometry of newly created fractures from numerical model may match the field situation. In addition, the differences between the distribution of field-observed seismicity and simulated seismicity may be caused by foliations which tend to become activated during injection [57,58]. No major foliation was recorded in the data provided and used in the dual scale semi-determinist fracture network (Figure 19). However, four major foliations can be estimated from field observations (e.g., seismicity, ERT) [2].
To study the detail of reactivated foliations and their effect on seismicity, we inserted them into the fracture network and carried out the numerical simulations again. The results show that I-164a/b, foliation 3/4 and PDT-114 do slip. The distribution of simulated and field-observed seismicity is shown in Figure 19. It seems that the simulated seismicity generally matches the field-observed seismicity. Further studies need to constrain the uncertainties.

5. Conclusions

In this work, a conceptual numerical model has been developed to simulate the response of EGS Collab Testbed Experiment 1 to water injection. The coupling process between behavior of fracture network, fracture flow, fracture dilation and propagation, and induced seismicity is described using a hybrid EPM/DFN. A dual scale semi-determinist fracture network was generated by combining data derived from the imaging logging and core, with fracture properties which follow a stochastic distribution. An advantage of this semi-determinist fracture network model is that measurement data can be incorporated to constrain the uncertainties in the rock mass. Another advantage of this network model is that micro-fractures are also considered. Integration between the coupled finite element model and the dual scale semi-determinist fracture network model is achieved by linking permeability change with fracture deformation (e.g., dilation and propagation). A stress dependent fracture deformation model with a shear dilation model is utilized to account for shear dilation. An ultrafast analytic approach for fracture propagation is applied using the maximum tensile stress criterion. The induced seismicity during the injection process is also evaluated. A seismic model is developed which allows for multiple seismic events to occur on and around a fracture. Two prescribed conditions are imposed to constrain the number and magnitude of events. The switching conditions between aseismic slip and seismic slip are also resolved. The simulation results (e.g., injection profiles, induced seismicity and fracture propagation) of the Stim-II ≅ 164 Notch on May 24 show match with field observations.

Author Contributions

J.L. carried out modeling, simulations, and analysis. A.G. designed the theoretical framework and analysis. A.G. supervised the overall research. A.G. edited and improved the manuscript. All authors have read and agreed to the published version of the manuscript.

Funding

This work was primarily supported by the OU Reservoir Geomechanics Joint Industry Partnership (JIP). Partial funding of DOE (via the COLLAB EGS) and Sandia National Laboratories is also gratefully acknowledged. The COLLBA EGS is funded by the Department of Energy, Office of Energy Efficiency and Renewable Energy (EERE), Office of Technology Development, Geothermal Technologies Office, under Award Number DE-AC02-05CH11231 with LBNL and other awards to other national laboratories.

Institutional Review Board Statement

Not Applicable.

Informed Consent Statement

Not Applicable.

Data Availability Statement

Not Applicable.

Conflicts of Interest

The authors have no conflict of interest.

Appendix A. Coupled Thermo-Poroelastic Rock Matrix Deformation

Coupled process involving poroelastic deformation, fluid flow and heat transfer occur in EGS where fractures are the primary pathways for fluid migration and production. Thus, convective heat transfer in the low permeable matrix is often insignificant [59] and is not considered. The heat transfer in the reservoir is assumed to occur via the fracture flow and heat conduction between the rock matrix and fracture fluid. The coupled thermo-process in the rock matrix can be described in the following constitutive equations [60]:
σ i j ˙ = 2 G ε ˙ i j + ( K 2 G 3 ) ε ˙ i j δ i j α p ˙ δ i j K α m T ˙ δ i j
ξ ˙ =   α ε ˙ k k + ( α ϕ K s k + ϕ K f ) p ˙ [ α α m + ( α f α m ) ϕ ] T ˙
where σ ˙ i j   is the increment of the total stress components; ε ˙ i j   is the increment of the strain components; ξ ˙   is the change of fluid volume per unit reference pore volume; p   ˙ and T   ˙ are pore pressure change and temperature change, respectively; α   is the Biot’s coefficient; K   is the bulk modulus; G   is shear modulus; ϕ   is porosity; K s k   and K f   are bulk modulus of rock skeleton and fluid and matrix, respectively. The conservation equations for momentum, mass and energy are shown as:
σ i j , j = 0
ξ t = κ p , j j
ρ t C t T t = h i , i C f T q i , i
From the above constitutive equations and conservation equation, the coupled thermo-poroelastic field equation can be derived [59,60,61]:
G u i , j j + ( K + G 3 ) u j , j i α p , j γ 1 T , j = 0
α ε k k t + β d p d t κ p , j j γ 2 d T d t = 0
T t c T T , j j ( κ T T p , i ) , i = 0
A finite element method is developed for solving Equations (A6)–(A8). The details of the mathematical formulation can be found in [62]. It can be shown [13] that after spatial discretization using Galerkin method and Crank–Nicolson approximation in the time domain, the finite element matrix formula of the above equations is written as:
[ K u C u p C u T C p u C p p + Δ t θ C p p C p T 0 0 C T T + Δ t θ ( K c d T + K c v T ) ] [ Δ u Δ p Δ T ] = [ Δ t F ˙ u Δ t F q i n Δ t K p p t Δ t Δ t F h i n Δ t ( K c d T + K c v T ) T t Δ t ]
where Δ u ,   Δ p   and Δ T   are the vectors of unknown variables; Δ t = t n t n 1   is the time step size; θ   is a scalar parameter and set to be 1.0 in this work; F u ,   F q   and F h   are the external load, fluid and heat source terms; p t Δ t and T t Δ t is the pore pressure and temperature of the previous time step. Other matrix are described in [13]. By solving the Equation (A9) with initial and boundary conditions, the primary unknowns of displacement   u , pore pressure p   and temperature T   can be resolved directly.

Appendix B

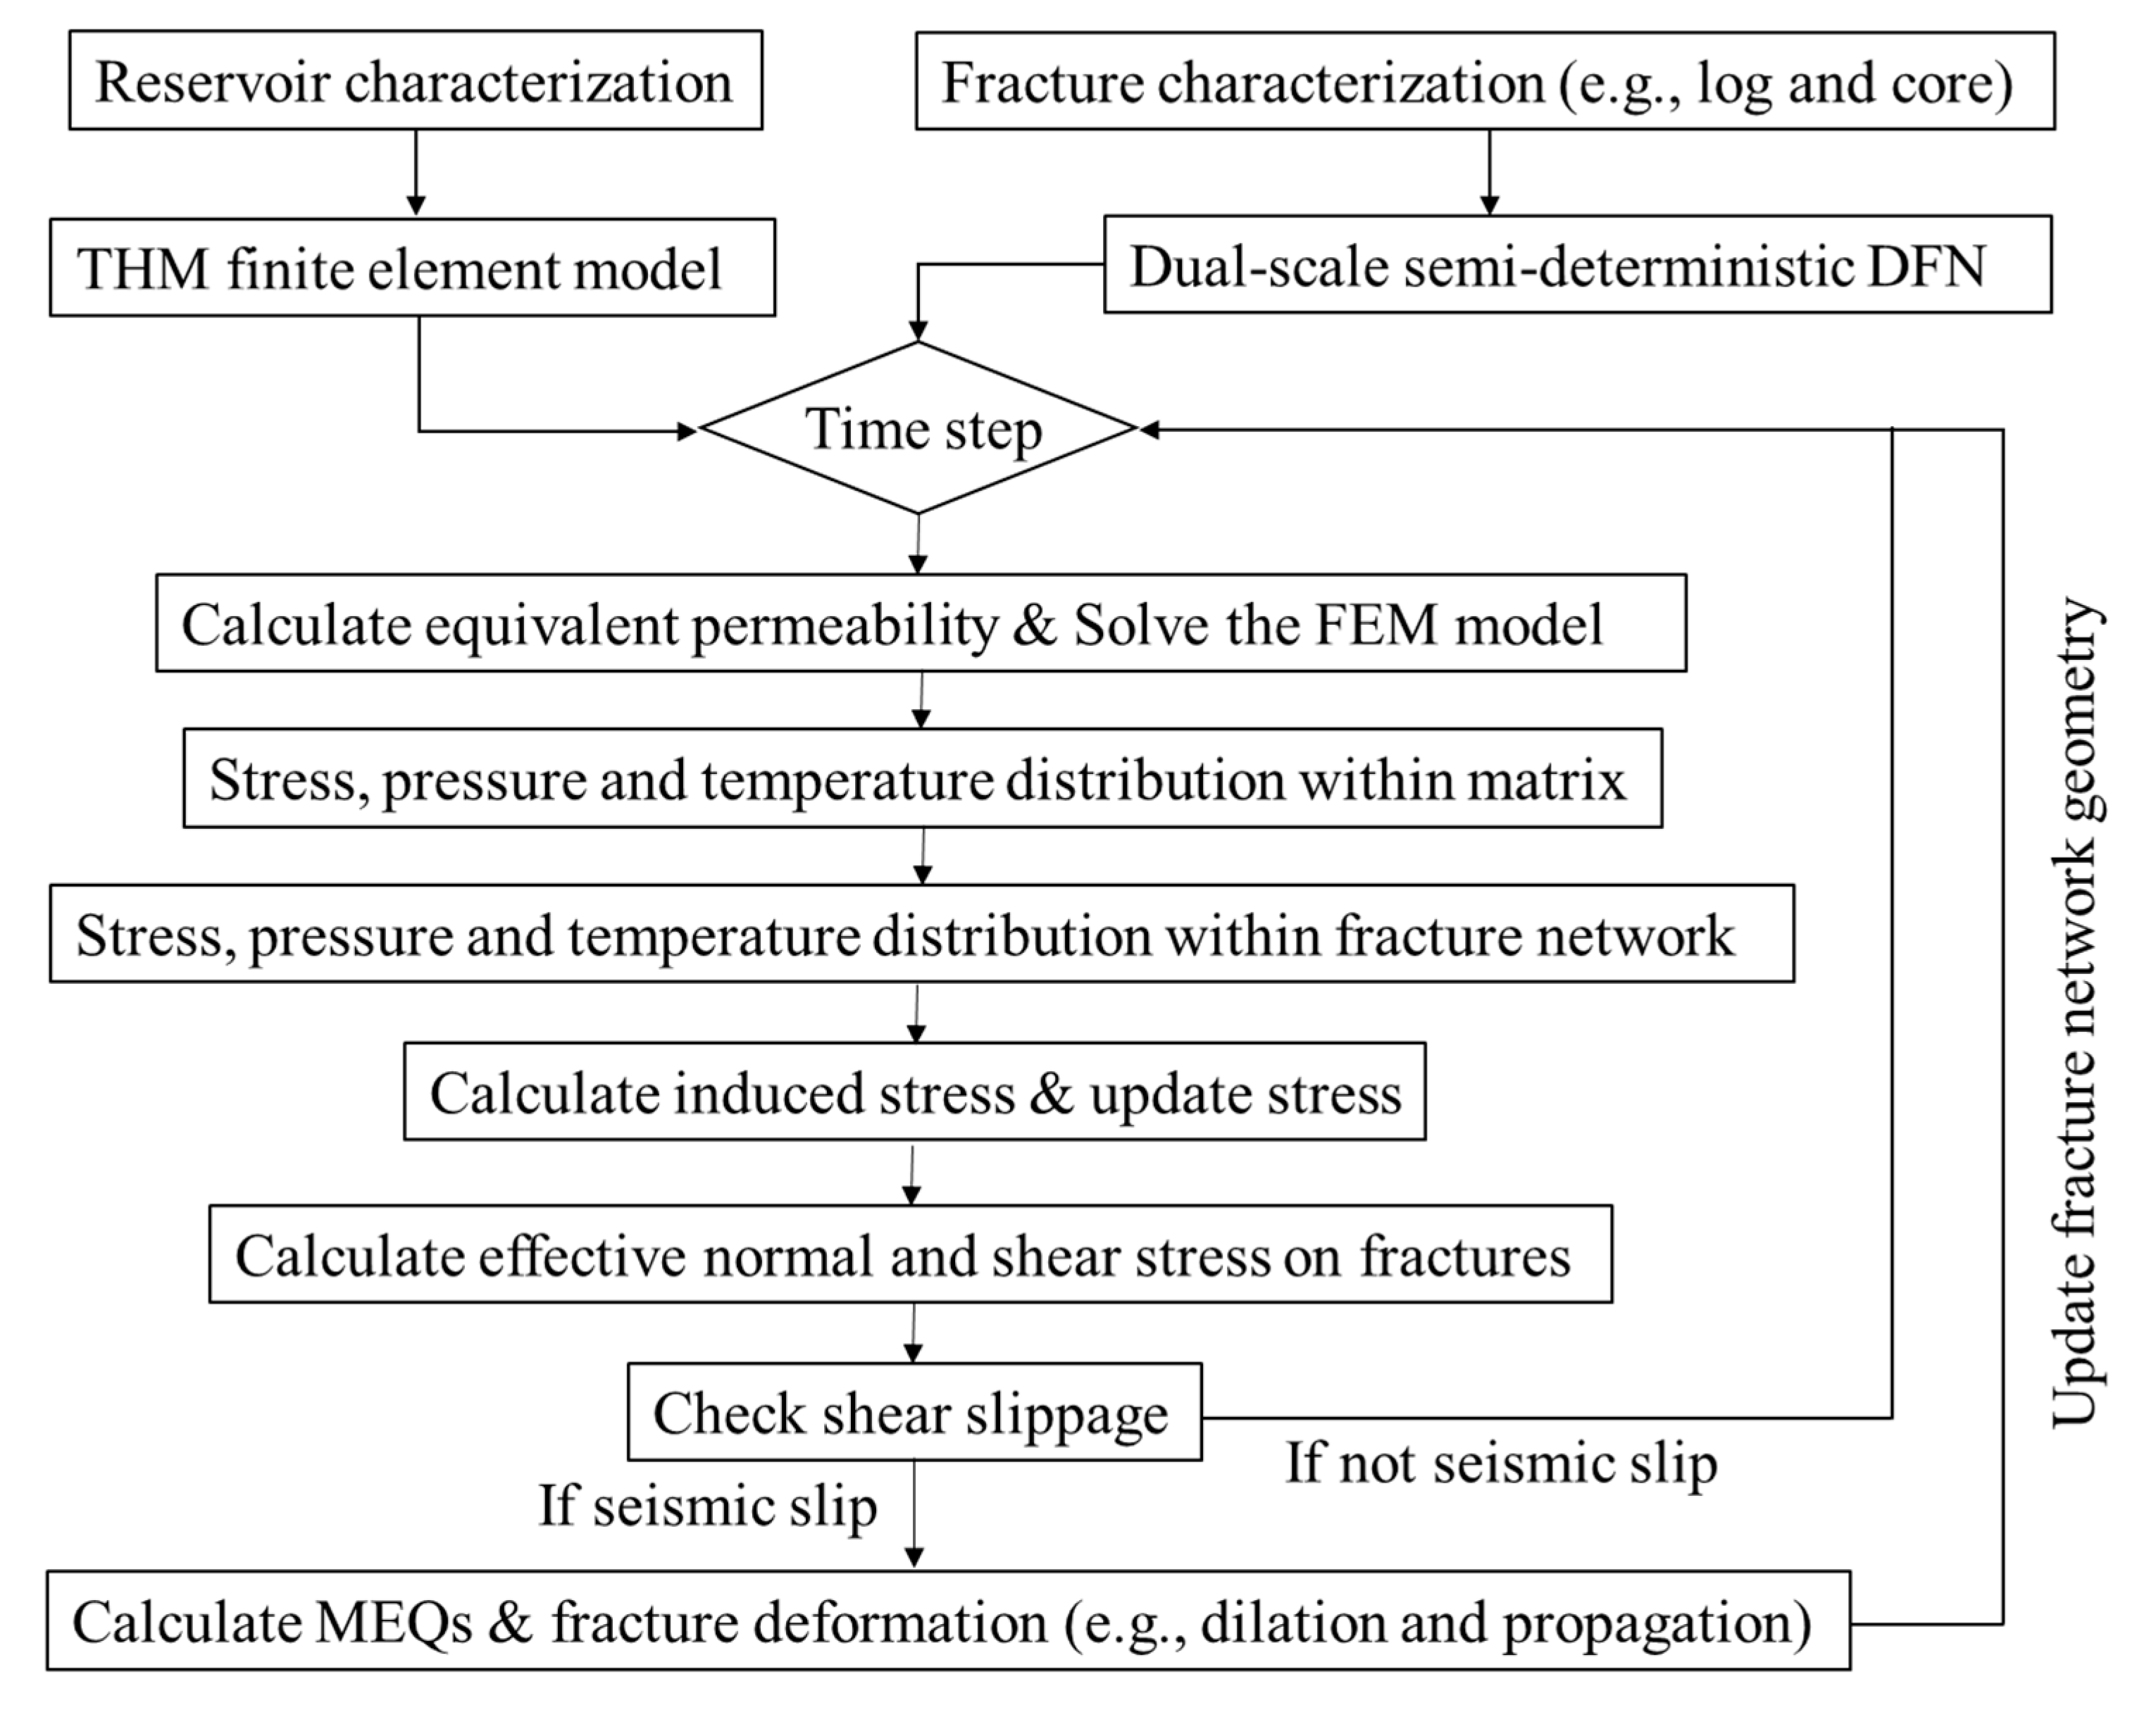
The dual-scale semi-deterministic fracture network model is integrated with the coupled thermo-poroelastic FEM by linking the permeability change, responding to fracture shear dilation and propagation. Fracture network geometry (i.e., aperture and radius) are submitted to FEM for equivalent permeability calculations at each time step. The stress and fluid pressure of fracture are calculated from the FEM solutions. According to the failure criterion, fracture may experience the transition between aseismic and seismic state during the stimulation. If fluid pressure is high enough to make the fracture network propagate, an ultrafast analytical approach is utilized to simulate fracture propagation. Once fractures deformations (i.e., dilation and propagation), the geometry of fracture network are updated, the solution proceeds to the next time step. The flowchart of the integrated model is shown in Figure A1.
Figure A1. Flowchart of the integrated model.
Energies 14 00446 g0a1

Appendix C. Model Verification

Many aspects of the model already have been verified [11,13]. This section presents additional comparison studies to verify the new developments. The first considers the pore pressure surrounding a fracture. A penny shape fracture is suddenly pressurized by a 25 MPa for 10 h. The radius of this fracture is 10.5 m. The permeability of rock matrix is 0.01 mD and initial pore pressure is 20 MPa . The numerical domain is 100 × 100 × 100 m. The results of the pore pressure distribution are shown in Figure A2a, where numerical results for pore pressure at ( X , Z = 0   m ) around the fracture are compared with the analytical solution from [63]. The red zone in Figure A2a is asymmetrical because the meshes cut by fracture is asymmetrical. A very good agreement between the numerical results and analytical solution is observed (Figure A2b).
Figure A2. The distribution of pore pressure around the fracture: (a) is the pore pressure distribution after 10 h of pressurization; (b) is the comparison between the numerical results and analytical solution.
Energies 14 00446 g0a2
For another comparison, frictional slip of a penny fracture is considered. The dip direction is zero and dip angle of the fracture are 60 ° and 75 ° respectively. The fracture diameter L   is 10 m. The friction coefficient of the fracture is 0.6. The numerical domain is subjected to remote uniaxial compression (Figure A3a). The value of uniaxial stress σ   is 41.8   MPa . Young’s modulus is 71   GPa and Poisson’s ratio is 0.219. Figure A3b,c show the compared numerical results with the analytical solution [63]. An acceptable difference (24.4% at the location of maximum slip distance) is observed between the slip distance from current method and analytical solution (Figure A3b). The slip distance of fracture in current method is uniformly distributed because normal and shear stresses on fracture are uniformly assigned in the model. Figure A3c indicates that the normal stress on fracture from current method and analytical solution match very well.
Figure A3. Frictional slip of a single fracture: (a) shows the boundary conditions and fracture geometry in numerical model; (b) is the dimensionless slip distance along the fracture; (c) is the dimensionless normal traction along the fracture.
Energies 14 00446 g0a3
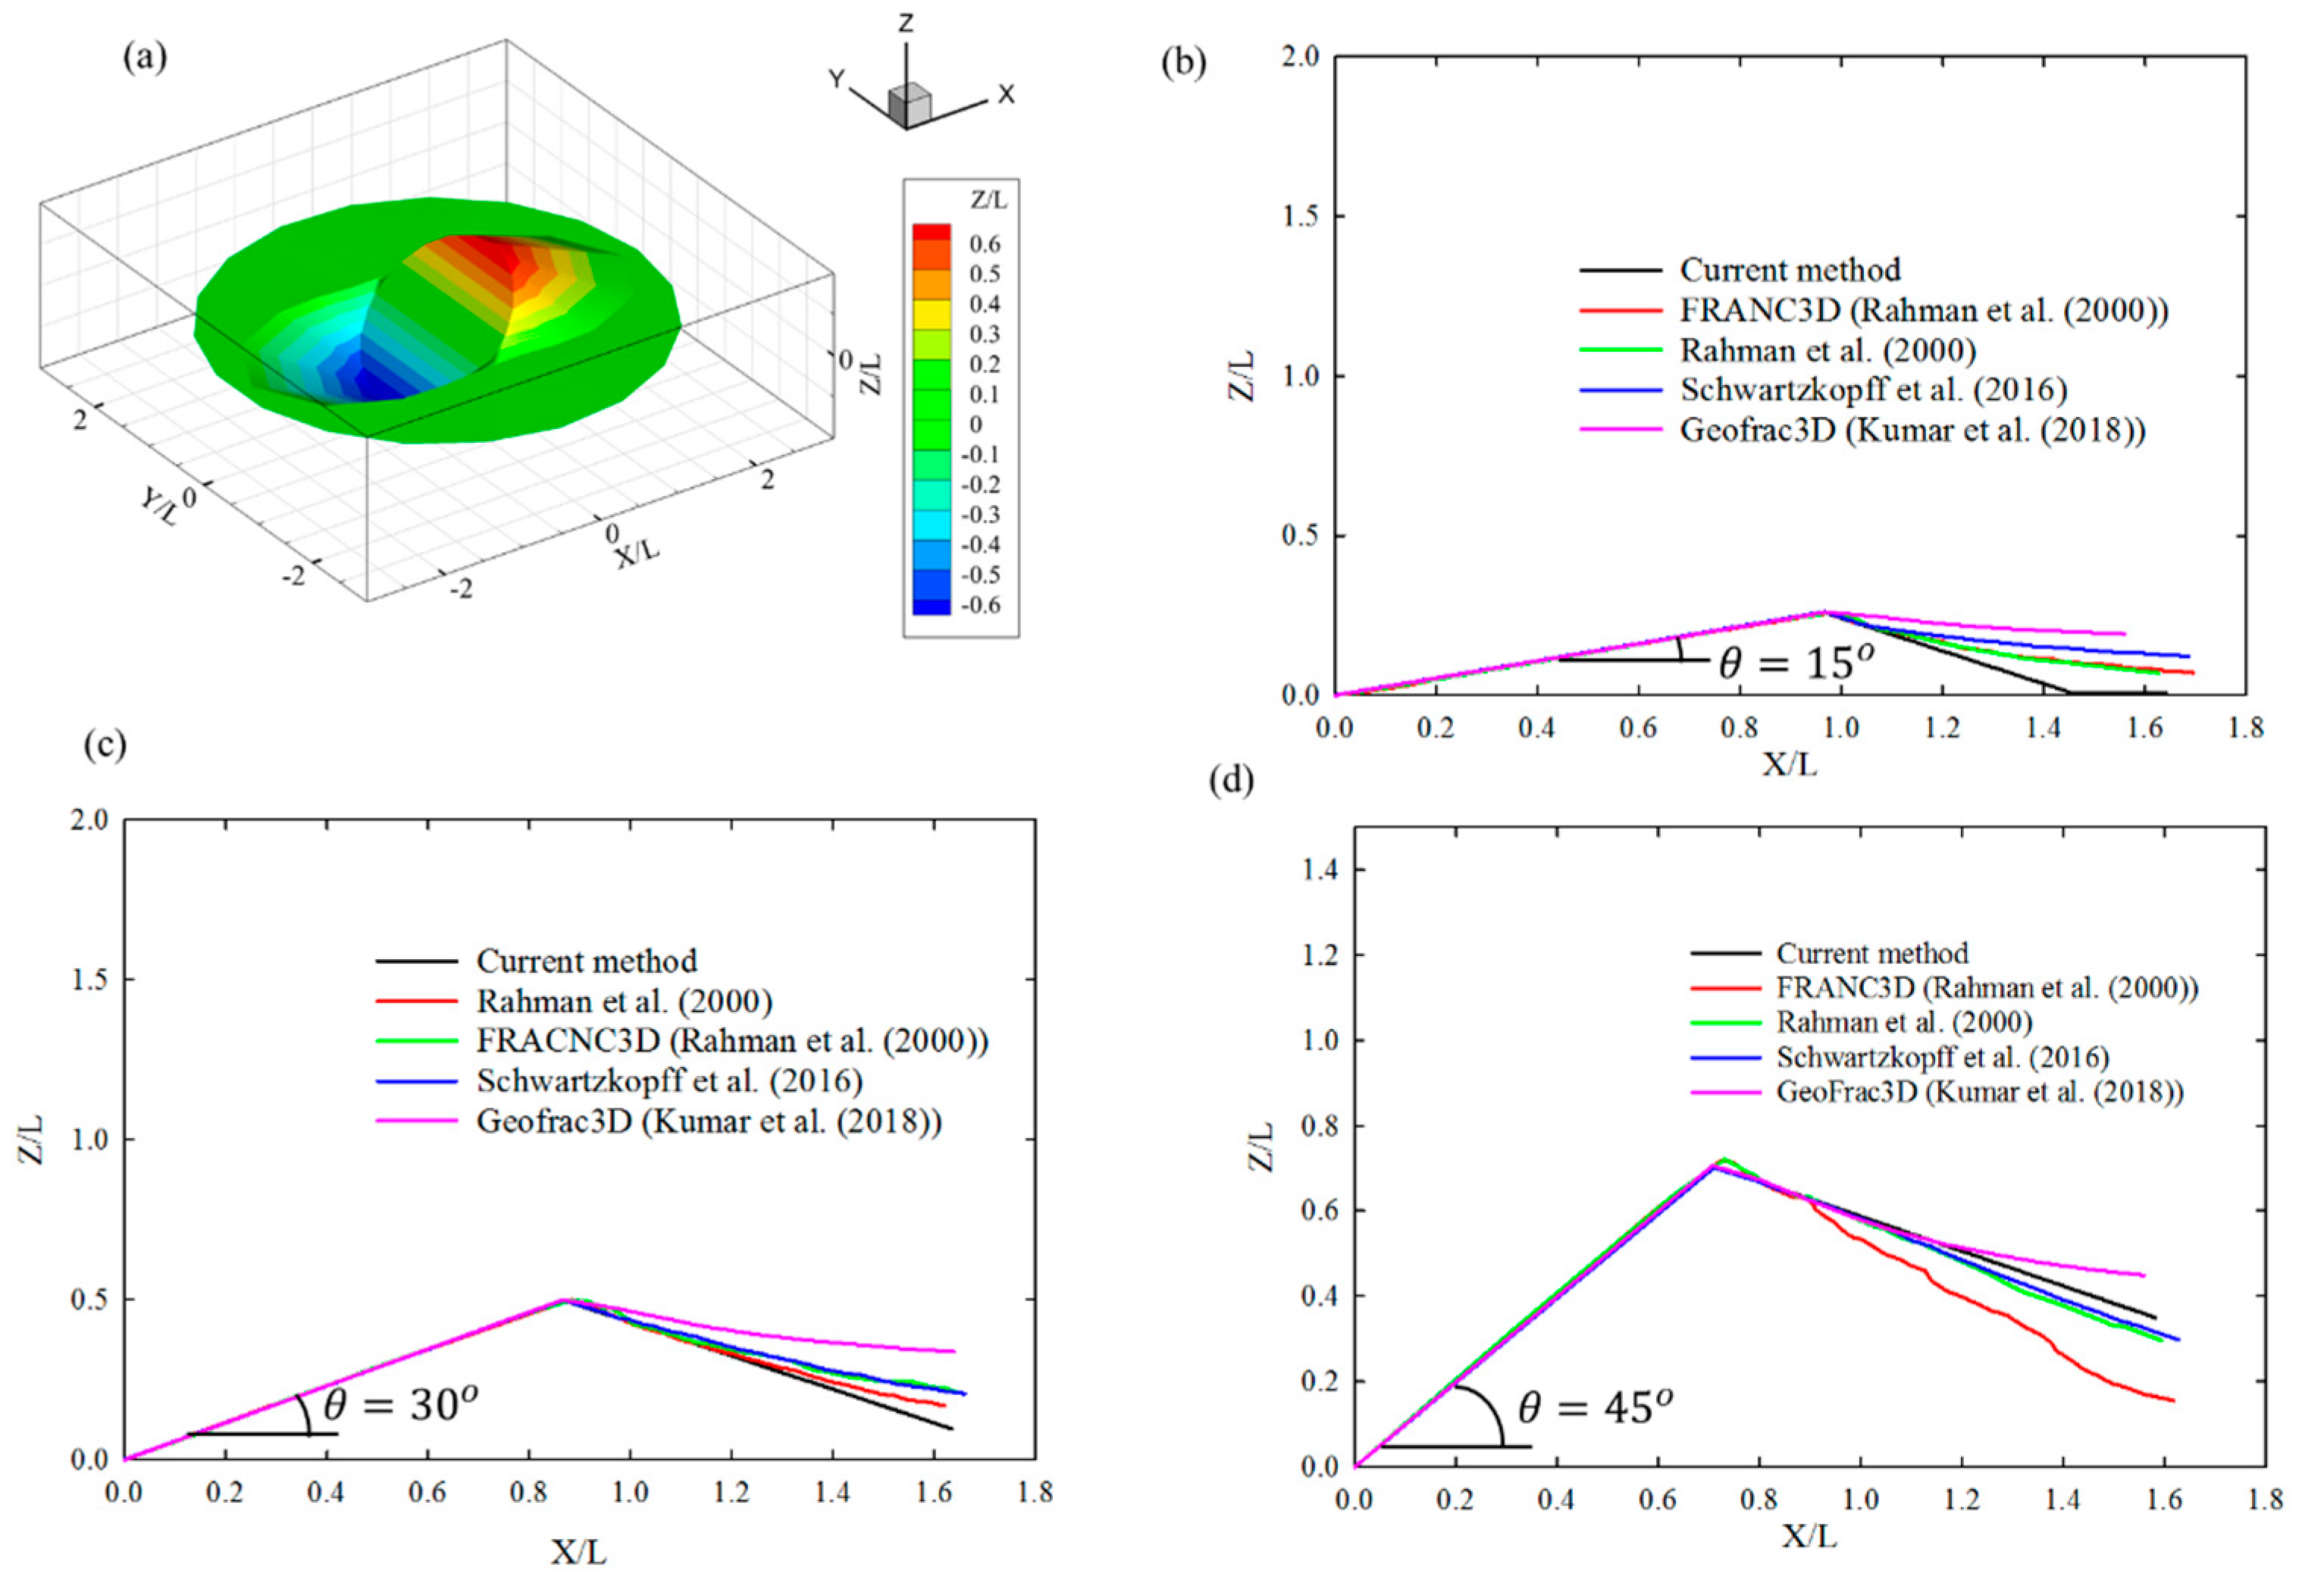
Figure A4. Comparison between current results and published results. L = 0.1m is the initial fracture radius: (a) is the fracture (dip= 45 ° , dip direction = 0 ° propagation surface; (b) is the cross section along Y = 0 of fracture (dip = 15 ° , dip direction =   0 ° ); (c) is the cross section along Y = 0 of fracture (dip =   30 ° , dip direction =   0 ° ); (d) is the cross section along Y = 0 of fracture (dip =   45 ° , dip direction =   0 ° ).
Energies 14 00446 g0a4
The next comparison study is to investigate the fracture propagation aspect of the model. The geometric and mechanical properties of fracture in this comparison are from [36,37]. The fracture only twists in the vertical direction   ( z - axis ) and realigns to the horizontal plane   ( x y - plane ) . Figure A4a is the fracture (dip = 45 ° ,   dip direction = 0 ° ) propagation surface. One must keep in mind that the newly created surface is approximated by a continuous surface rather than a discrete fracture when post-processing, to more readily display the geometry. The propagation profile in the x z cross section follows the same trend as that of published results (Figure A4b–d). Figure A4b indicates that the fracture (dip = 15 ° ,   dip direction = 0 ° ) propagation path from current method is lower than others because the calculation of the kink angle in the current method is based on an initial fracture (penny-shape). The value of kink angle is kept constant during the non-planar propagation stage in current method. The kink angle from published results is updated in each step and this is more realistic to represent the actual situation, but higher computational power is required. Figure A4c suggest that fracture (dip = 30 ° ,   dip direction = 0 ° ) propagation paths defined by the current method are lower than the results from published works, the differences are not significant. It suggests a trend where the difference is smaller for fractures with higher dip. For the fracture (dip = 45 ° ,   dip direction = 0 ° ) with a higher dip, the results from the current method align closely with the published results (Figure A4d). Further, the height of the fracture (the distance between x-axis and fracture tip) propagation is underestimate, especially for fractures with lower dips (Figure A4b).

References

  1. Oldenburg, C.M.; Dobson, P.F.; Wu, Y.; Cook, P.J.; Kneafsey, T.J.; Nakagawa, S.; Ulrich, C.; Siler, D.L.; Guglielmi, Y.; Ajo-Franklin, J.B.; et al. Intermediate-Scale Hydraulic Fracturing in a Deep Mine—kISMET Project Summary 2016; Lawrence Berkeley National Lab. (LBNL): Berkeley, CA, USA, 2016. [Google Scholar]
  2. EGS Collab Team. Geothermal Data Repository. 2020. Available online: https://gdr.openei.org/home (accessed on 15 November 2020).
  3. Caddey, S.W.; Bachman, R.L.; Campbell, T.J.; Reid, R.R.; Otto, R.P. The Homestake Gold Mine, an Early Proterozoic Iron-Formation-Hosted Gold Deposit, Lawrence County, South Dakota; US Geological Survey; US Department of the Interior: Washington, DC, USA, 1992.
  4. Schwering, P.C.; Doe, T.W.; Roggenthen, W.M.; Neupane, G.H.; Johnston, H.; Dobson, P.F.; Ulrich, C.; Singh, A.; Uzunlar, N. Deterministic discrete fracture network (DFN) model for the EGS collab project on the 4850 level of the Sanford Underground Research Facility (SURF). In Proceedings of the 54th U.S. Rock Mechanics/Geomechanics Symposium, Golden, CO, USA, 28 June–1 July 2020; American Rock Mechanics Association: Alexandria, VA, USA, 2020; p. 9. [Google Scholar]
  5. Kneafsey, T.J.; Dobson, P.F.; Ajo-Franklin, J.B.; Guglielmi, Y.; Valladao, C.A.; Blankenship, D.A.; Schwering, P.C.; Knox, H.A.; White, M.D.; Johnston, T.C.; et al. EGS collab project: Status, tests, and data. In Proceedings of the 53rd U.S. Rock Mechanics/Geomechanics Symposium, American Rock Mechanics Association, New York, NY, USA, 23–26 June 2019; p. 19. [Google Scholar]
  6. Ulrich, C.; Dobson, P.F.; Kneafsey, T.J.; Roggenthen, W.M.; Uzunlar, N.; Doe, T.W.; Neupane, G.; Podgorney, R.; Schwering, P.; Frash, L.; et al. The distribution, orientation, and characteristics of natural fractures for experiment 1 of the EGS collab project, Sanford Underground Research Facility. In Proceedings of the 52nd U.S. Rock Mechanics/Geomechanics Symposium, American Rock Mechanics Association, Seattle, WA, USA, 17–20 June 2018; p. 8. [Google Scholar]
  7. Kneafsey, T.J.; Dobson, P.F.; Ajo-Franklin, J.B.; Valladao, C.; Blankenship, D.A.; Knox, H.A.; Schwering, P.; Morris, J.P.; Smith, M.; White, M.D.; et al. The EGS collab project: Stimulation and simulation. In Proceedings of the 52nd U.S. Rock Mechanics/Geomechanics Symposium, American Rock Mechanics Association, Seattle, WA, USA, 17–20 June 2018; p. 10. [Google Scholar]
  8. Kneafsey, T.J.; Dobson, P.F.; Blankenship, D.A.; Morris, J.P.; Knox, H.; Schwering, P.; White, M.; Doe, T.; Roggenthen, W.; Mattson, E.; et al. An overview of the EGS collab project: Field validation of coupled process modeling of fracturing and fluid flow at the Sanford Underground Research Facility, Lead, SD. In Proceedings of the 43rd Workshop on Geothermal Reservoir Engineering, Stanford, CA, USA, 12–14 February 2018. [Google Scholar]
  9. Willis-Richards, J.; Watanabe, K.; Takahashi, H. Progress toward a stochastic rock mechanics model of engineered geothermal systems. J. Geophys. Res. Space Phys. 1996, 101, 17481–17496. [Google Scholar] [CrossRef]
  10. Rahman, M.K.; Hossain, M.; Rahman, S.S. A shear-dilation-based model for evaluation of hydraulically stimulated naturally fractured reservoirs. Int. J. Numer. Anal. Methods Géoméch 2002, 26, 469–497. [Google Scholar] [CrossRef]
  11. Wang, X.; Ghassemi, A. A 3D thermal-poroelastic model for naturally fractured geothermal reservoir stimulation. In Proceedings of the 46th US Rock Mechanics and Geomechanics Symposium, Chicago, IL, USA, 24–27 June 2012. [Google Scholar]
  12. Lu, J.; Ghassemi, A. Coupled thermo-hydro-mechanical-seismic modeling of fractured reservoir stimulation with application to EGS collab. In Proceedings of the 44th Workshop on Geothermal Reservoir Engineering, Stanford, CA, USA, 10–12 February 2019. [Google Scholar]
  13. Cheng, Q.; Wang, X.; Ghassemi, A. Numerical simulation of reservoir stimulation with reference to the Newberry EGS. Geothermics 2019, 77, 327–343. [Google Scholar] [CrossRef]
  14. Hooker, J.N.; Laubach, S.E.; Marrett, R. A universal power-law scaling exponent for fracture apertures in sandstones. GSA Bull. 2014, 126, 1340–1362. [Google Scholar] [CrossRef]
  15. Long, J.C.S.; Remer, J.S.; Wilson, C.R.; Witherspoon, P.A. Porous media equivalents for networks of discontinuous fractures. Water Resour. Res. 1982, 18, 645–658. [Google Scholar] [CrossRef] [Green Version]
  16. Dershowitz, W.S.; Einstein, H.H. Characterizing rock joint geometry with joint system models. Rock Mech. Rock Eng. 1988, 21, 21–51. [Google Scholar] [CrossRef]
  17. Anders, M.H.; Laubach, S.E.; Scholz, C.H. Microfractures: A review. J. Struct. Geol. 2014, 69, 377–394. [Google Scholar] [CrossRef] [Green Version]
  18. Mitchell, T.M.; Faulkner, D.R. The nature and origin of off-fault damage surrounding strike-slip fault zones with a wide range of displacements: A field study from the Atacama fault system, northern Chile. J. Struct. Geol. 2009, 31, 802–816. [Google Scholar] [CrossRef]
  19. Tuttle, O.F. Structural Petrology of Planes of Liquid Inclusions. J. Geol. 1949, 57, 331–356. [Google Scholar] [CrossRef] [Green Version]
  20. Wang, X.; Ghassemi, A. A threedimensional thermal-poroelastic model for natural fractured geothermal reservoir stimulation. GRC Trans. 2013, 37, 871–878. [Google Scholar]
  21. Patton, F.D. Multiple modes of shear failure in rock. In Proceedings of the 1st ISRM Congress, International Society for Rock Mechanics and Rock Engineering, Lisbon, Portugal, 25 September–1 October 1966; p. 5. [Google Scholar]
  22. Hicks, T.; Pine, R.; Willis-Richards, J.; Xu, S.; Jupe, A.; Rodrigues, N. A hydro-thermo-mechanical numerical model for HDR geothermal reservoir evaluation. Int. J. Rock Mech. Min. Sci. Géoméch Abstr. 1996, 33, 499–511. [Google Scholar] [CrossRef]
  23. Eshelby, J.D.; Peierls, R.E. The determination of the elastic field of an ellipsoidal inclusion, and related problems. Proc. R. Soc. Lond. Ser. A Math. Phys. Sci. 1957, 241, 376–396. [Google Scholar]
  24. Valko, P.; Economides, M.J. Hydraulic Fracture Mechanics; Wiley: Chichester, UK, 1995; Volume 28. [Google Scholar]
  25. Sneddon, I.N. The distribution of stress in the neighbourhood of a crack in an elastic solid. Proc. R. Soc. London. Ser. A Math. Phys. Sci. 2006, 187, 229–260. [Google Scholar] [CrossRef] [Green Version]
  26. Min, K.S.; Zhang, Z.; Ghassemi, A. Numerical analysis of multiple fracture propagation in heterogeneous rock. In Proceedings of the 44th U.S. Rock Mechanics Symposium and 5th U.S.-Canada Rock Mechanics Symposium, American Rock Mechanics Association, Salt Lake City, UT, USA, 27–30 June 2010; p. 10. [Google Scholar]
  27. Kamali, A.; Ghassemi, A. Analysis of injection-induced shear slip and fracture propagation in geothermal reservoir stimulation. Geothermics 2018, 76, 93–105. [Google Scholar] [CrossRef]
  28. Kumar, D.; Ghassemi, A. Three-Dimensional Poroelastic Modeling of Multiple Hydraulic Fracture Propagation from Horizontal Wells. Int. J. Rock Mech. Min. Sci. 2018, 105, 192–209. [Google Scholar] [CrossRef]
  29. Sesetty, V.; Ghassemi, A. Effect of rock anisotropy on wellbore stresses and hydraulic fracture propagation. Int. J. Rock Mech. Min. Sci. 2018, 112, 369–384. [Google Scholar] [CrossRef]
  30. Tezuka, K.; Tamagawa, T.; Watanabe, K. Numerical simulation of hydraulic shearing in fractured reservoir. In Proceedings of the World Geothermal Congress, Antalya, Turkey, 24–29 April 2005. [Google Scholar]
  31. Ye, Z.; Ghassemi, A. Injection-Induced Shear Slip and Permeability Enhancement in Granite Fractures. J. Geophys. Res. Solid Earth 2018, 123, 9009–9032. [Google Scholar] [CrossRef]
  32. Ye, Z.; Ghassemi, A.; Kneafsey, T. Deformation, failure and permeability evolution of sealed fractures in EGS collab poorman schist. In Proceedings of the 45th Workshop on Geothermal Reservoir Engineering, Stanford, CA, USA, 10–12 February 2020. [Google Scholar]
  33. Ye, Z.; Ghassemi, A. Injection-Induced Propagation and Coalescence of Preexisting Fractures in Granite Under Triaxial Stress. J. Geophys. Res. Solid Earth 2019, 124, 7806–7821. [Google Scholar] [CrossRef]
  34. Kamali, A.; Ghassemi, A. On the Role of Poroelasticity in the Propagation Mode of Natural Fractures in Reservoir Rocks. Rock Mech. Rock Eng. 2020, 53, 2419–2438. [Google Scholar] [CrossRef]
  35. Masouleh, S.F.; Kumar, D.; Ghassemi, A. Three-Dimensional Geomechanical Modeling and Analysis of Refracturing and “Frac-Hits” in Unconventional Reservoirs. Energies 2020, 13, 5352. [Google Scholar] [CrossRef]
  36. Rahman, M.K.; Hossain, M.M.; Rahman, S.S. An analytical method for mixed-mode propagation of pressurized frac-tures in remotely compressed rocks. Int. J. Fract. 2000, 103, 243–258. [Google Scholar] [CrossRef]
  37. Schwartzkopff, A.K.; Xu, C.; Melkoumian, N.S. Approximation of mixed mode propagation for an internally pressurized circular crack. Eng. Fract. Mech. 2016, 166, 218–233. [Google Scholar] [CrossRef]
  38. Lu, J.; Ghassemi, A. Semi analytical 3D modeling of fracture propagation in a fractured rock. In Reservoir Geomechanics & Seismicity Research Group Internal Report; Reservoir Geomechanics and Seismicity Research Group, The University of Oklahoma: Norman, OK, USA, 2019. [Google Scholar]
  39. Hazzard, J.; Young, R.P. Dynamic modelling of induced seismicity. Int. J. Rock Mech. Min. Sci. 2004, 41, 1365–1376. [Google Scholar] [CrossRef]
  40. Safari, R.; Ghassemi, A. Three-Dimensional poroelastic modeling of injection induced permeability enhancement and mi-cro-seismicity. Int. J. Rock Mech. Min. Sci. 2016, 84, 47–58. [Google Scholar] [CrossRef] [Green Version]
  41. Baisch, S.; Vörös, R.; Rothert, E.; Stang, H.; Jung, R.; Schellschmidt, R. A numerical model for fluid injection induced seismicity at Soultz-sous-Forêts. Int. J. Rock Mech. Min. Sci. 2010, 47, 405–413. [Google Scholar] [CrossRef]
  42. Ye, Z.; Ghassemi, A. Investigation of micro-seismicity and permeability evolution in shale fractures during stimulation. In Proceedings of the 7th Unconventional Resources Technology Conference, American Association of Petroleum Geologists AAPG/Datapages, Denver, CO, USA, 22–24 July 2019; p. 11. [Google Scholar]
  43. Scotti, O.; Cornet, F.H. In-situ stress fields and focal mechanism solutions in central France. Geophys. Res. Lett. 1994, 21, 2345–2348. [Google Scholar] [CrossRef]
  44. Amann, F.; Gischig, V.; Evans, K.; Doetsch, J.; Jalali, M.R.; Valley, B.; Krietsch, H.; Dutler, N.; Villiger, L.; Brixel, B.; et al. The seismo-hydromechanical behavior during deep geothermal reservoir stimulations: Open questions tackled in a decameter-scale in situ stimulation experiment. Solid Earth 2018, 9, 115–137. [Google Scholar] [CrossRef] [Green Version]
  45. Scholz, C.H. The Mechanics of Earthquakes and Faulting, 3rd ed.; Cambridge University Press: Cambridge, UK, 2019. [Google Scholar]
  46. Marone, C. The spectrum of fault slip modes from elastodynamic rupture to slow earthquakes. In Mechanics of Earthquake Faulting; IOS Press: Amsterdam, The Netherlands; pp. 81–94. [CrossRef]
  47. Im, K.; Marone, C.; Elsworth, D. The transition from steady frictional sliding to inertia-dominated instability with rate and state friction. J. Mech. Phys. Solids 2019, 122, 116–125. [Google Scholar] [CrossRef]
  48. Gu, J.-C.; Rice, J.R.; Ruina, A.L.; Tse, S.T. Slip motion and stability of a single degree of freedom elastic system with rate and state dependent friction. J. Mech. Phys. Solids 1984, 32, 167–196. [Google Scholar] [CrossRef] [Green Version]
  49. Dobroskok, A.; Ghassemi, A. Deformation and stability of a discontinuity in a geothermal system. Trans. Geotherm. Resour. Counc. 2005, 29, 349–352. [Google Scholar]
  50. Rashidian, S.; Chang, L.C. Peak shear displacement of rock fractures. In Proceedings of the 46th U.S. Rock Mechanics/Geomechanics Symposium, American Rock Mechanics Association, Chicago, IL, USA, 24–27 June 2012. [Google Scholar]
  51. Asadollahi, P.; Invernizzi, M.C.A.; Addotto, S.; Tonon, F. Experimental Validation of Modified Barton’s Model for Rock Fractures. Rock Mech. Rock Eng. 2010, 43, 597–613. [Google Scholar] [CrossRef]
  52. Hanks, T.C.; Kanamori, H. A moment magnitude scale. J. Geophys. Res. Space Phys. 1979, 84, 2348–2350. [Google Scholar] [CrossRef]
  53. McGarr, A.; Spottiswoode, S.M.; Gay, N.C.; Ortlepp, W.D. Observations relevant to seismic driving stress, stress drop, and efficiency. J. Geophys. Res. Space Phys. 1979, 84, 2251. [Google Scholar] [CrossRef]
  54. Kneafsey, T.J.; Blankenship, D.; Dobson, P.F.; Morris, J.P.; White, M.D.; Fu, P.; Schwering, P.C.; Ajo-Franklin, J.B.; Huang, L.; Schoenball, M.; et al. The EGS collab project: Learnings from Experiment 1. In Proceedings of the 45th Workshop on Geothermal Reservoir Engineering, Stanford, CA, USA, 10–12 February 2020. [Google Scholar]
  55. Makedonska, N.; Jafarov, E.; Doe, T.; Schwering, P.; Neupane, G.; EGS Collab Team. Simulation of injected flow pathways in geothermal fractured reservoir using discrete fracture network model. In Proceedings of the 45th Workshop on Geothermal Reservoir Engineering, Stanford, CA, USA, 10–12 February 2020. [Google Scholar]
  56. Ye, Z.; Ghassemi, A.; Kneafsey, T. Deformation, failure and permeability evolution of sealed fractures in EGS collab poorman schist. In Proceedings of the 54th U.S. Rock Mechanics/Geomechanics Symposium, Golden, CO, USA, 28 June–1 July 2020. [Google Scholar]
  57. Ye, Z.; Ghassemi, A. Failure Behavior of the Poorman Schist and Its Fractures from the COLLAB Simulation Site. In Proceedings of the 44rd Workshop on Geothermal Reservoir Engineering, Stanford, CA, USA, 10–12 February 2020. [Google Scholar]
  58. Neupane, G.H.; Podgorney, R.K.; Huang, H.; Mattson, E.D.; Kneafsey, T.J.; Dobson, P.F.; Schoenball, M.; Ajo-Franklin, J.B.; Ulrich, C.; Schwering, P.C.; et al. EGS Collab Earth Modeling: Integrated 3D Model of the Testbed. In GRC Transactions; Geothermal Resources Council: San Diego, CA, USA, 2019. [Google Scholar]
  59. Ghassemi, A.; Zhang, Q. Porothermoelastic Analysis of the Response of a Stationary Crack Using the Displacement Discontinuity Method. J. Eng. Mech. 2006, 132, 26–33. [Google Scholar] [CrossRef]
  60. McTigue, D.F. Thermoelastic response of fluid-saturated porous rock. J. Geophys. Res. Space Phys. 1986, 91, 9533–9542. [Google Scholar] [CrossRef]
  61. Zhou, X.; Ghassemi, A. Finite element analysis of coupled chemo-poro-thermo-mechanical effects around a wellbore in swelling shale. Int. J. Rock Mech. Min. Sci. 2009, 46, 769–778. [Google Scholar] [CrossRef]
  62. Phan, A.-V.; Napier, J.A.L.; Gray, L.; Kaplan, T. Symmetric-Galerkin BEM simulation of fracture with frictional contact. Int. J. Numer. Methods Eng. 2003, 57, 835–851. [Google Scholar] [CrossRef]
  63. Warpinski, N.R.; Wolhart, S.L.; Wright, C.A. Analysis and Prediction of Microseismicity Induced by Hydraulic Frac-turing. SPE J. 2004, 9, 24–33. [Google Scholar] [CrossRef]
Figure 1. Geological model and layout of holes of EGS Collab Testbed Experiment 1 [2]. (a) EGS Collab Testbed Experiment 1 is entirely located within Poorman Formation at 4850 ft depth. (b) Six holes (E1-OT/OB, E1-PSB/PST and E1-PDT/PDB) are used as monitoring wells. E1-I and E1-P are injection well and production well, respectively. The six pink spheres along E1-I are notches. The contours represent different types of sensor. For example, Sensor 1 is the 24 hydrophones, Sensor 2 is the 18 accelerometers, Sensor 3 is the 4 geophones, Sensor 4 is the 17 continuous active sources seismic monitoring, Sensor 5 is the 96 thermistors, Sensor 6 is the 123 seismic shot and Sensor 7 is the 96 ERT electrode.
Energies 14 00446 g001
Figure 2. (a) Acoustic televiewer log showing the fracture orientation, foliation and micro fracture in borehole E1-P from Collab EGS. (b) Poorman Schist sample from E1-PDT 99.3 ~ 100.25 ft and (Computed Tomography) CT-scan image of the sample (the sample was CT scanned at Berkeley Lab). The rock sample is from Collab EGS and diameter is 61 mm and length is 110 mm. The details of reservoir rock can be found in [3].
Energies 14 00446 g002
Figure 3. (a) The dip of micro-fractures within the surrounding zone of PDT-114. (b) the strike of micro-fractures within the surrounding zone of PDT-114.
Energies 14 00446 g003
Figure 4. The contribution of one fracture permeability to equivalent permeability of a finite element (reproduced from [13]).
Energies 14 00446 g004
Figure 5. Schematic diagram showing the definition of the spring system and rate and state friction law. (a) The spring system, where σ n is the normal stress, K is the stiffness of spring, F is the loading force, V is the slip rate and M is the mass of system. (b) The rate and state friction law. μ d is the experimentally measured dynamic friction coefficient. (c) Force-displacement diagram in the vicinity of the fracture.
Energies 14 00446 g005
Figure 6. Injection profiles and induced seismicity for Stim-II HF ≅ 164 Notch [2]. (a) The injection profiles of the test on 23 May 2018. The green dots represent the micro-seismic events per minutes. The pink dots represent the distance between events and the Notch ≅ 164. (b) The injection profiles (SNL14) of the test on 24 May 2018.
Energies 14 00446 g006
Figure 7. Observations at E1-OT and E1-P caused by injection [2]. (a) The temperature perturbations along E1-OT on May 24. (b) The water jet occurs in E1-P at 126 ft and 129 ft depth. The water jetting was detected on May 25.
Energies 14 00446 g007
Figure 8. The details of core and notch at 164 ft depth along E1-I [2]. (a) Core and acoustic televiewer log showing the fractures in E1-I (at 164 ft to 169 ft depth) [2]. (b) sketch of the geometry of Notch ≅ 164 along E1-I [2].
Energies 14 00446 g008
Figure 9. The details of E1-I around the Notch ≅ 164 on May 23, 2018 [2]. (a) The location of isolated zone. (b) The generation of the hydraulic fracture is assumed to be due to the injection into Notch ≅ 164. Note that the hydraulic fracture almost overlaps with I-164a/b [2].
Energies 14 00446 g009
Figure 10. The configuration of major fractures and their orientation [2]. (a) There are 101 major fractures in this configuration. Most fractures are steeply dipping. (b) Some major fractures surround the Notch ≅ 164. An OT-PDT-P connection can be extracted from Figure 15b: E1-OT→OT-161→PDT-114→E1-PDT→P-122/126 →E1-P or E1-OT→OT-161→P-126/127 →E1-P. Such a connection partly matches the field observation during the fracture mapping exercise [58].
Energies 14 00446 g010
Figure 11. Fracture and matrix pressure at different times: (a,b) show the fracture and matrix pressure at time T22:36, respectively; (c,d) show the fractures and matrix pressure at time T22:43. The slices locations in (b,d) are X = 823 m and Y = −1296.5 m, respectively. Unit: MPa.
Energies 14 00446 g011
Figure 12. The results from numerical simulation: (a,b) show the fractures and matrix pressure at T22:44; (c,d) show the fractures and matrix pressure at T22:45. Unit: MPa.
Energies 14 00446 g012
Figure 13. The results from numerical simulation: (a,b) show the propagation of I-164a/b at T22:44. The length of intersection between I-164b and OT-132 is relatively small (0.1 m). (c,d) is the propagation of I-164b at T22:45. The distance for intersection between I-164b and P-129 is relatively small (~0.1 m). Injection well E1-I partly connects with production well E1-P.
Energies 14 00446 g013
Figure 14. The results from numerical simulation: (a,b) show the fracture and matrix pressure at T22:52; (c,d) is the propagation of I-164b at T22:52. I-164b fully intersects OT-132, P-122/126/127/129 and E1-P. Injection well E1-I fully connects with production well E1-P. (e,f) are transparent views of the fracture network. Unit: MPa.
Energies 14 00446 g014
Figure 15. Three connectors are yielded during the injection: (a) shows the connector between E1-I and E1-P; (b) shows the connector between E1-PDT and E1-PST and the connector between E1-P and E1-PST.
Energies 14 00446 g015
Figure 16. The pressure and injection rate at Notch ≅ 164 (SNL14). The resulting pressure trend generally agrees with field measured values.
Energies 14 00446 g016
Figure 17. Comparison between simulated events with field-observed events. Black spheres represent field-observed seismicity and grey cubes represent the simulated seismicity. (ac) The distribution of simulated events and field-observed events. (d) The magnitude-frequency distributions and seismic b-values for simulated seismicity; b-values is predefined, and a-values is a fitting parameter.
Energies 14 00446 g017
Figure 18. The evolution of the effective principal stress over time: (a,b) show the effective minimum principal stress distribution at T22:43 and T22:53, respectively; (c,d) show the effective maximum principal stress distribution at T22:43 and T22:53, respectively; (e,f) show the directions of the minimum principal stress and the maximum principal stress at T22:46.
Energies 14 00446 g018
Figure 19. Distribution of seismicity and location of four major foliation planes estimated from field observation (e.g., seismicity and ERT). Black spheres represent the field-observed seismicity. Pink cubes represent the simulated seismicity. Foliation planes 3 and 4, I-164-a/b and PDT-114 have slipped. The simulated seismicity generally matches the field-observed seismicity. Different figures (ad) show different views.
Energies 14 00446 g019
Table 1. Reservoir properties used in the model.
Parameter ValueValuesSource/Comments
Young’s Modulus (Lognormal distribution) m e a n =   71 [ GPa ]
v a r i a n c e = 5   [ GPa ] 2
[1]
Drained Poisson’s Ratio0.22[1]
Undrained Drained Poisson’s Ratio0.46Assumed
Biot’s Coefficient0.52Assumed
Vertical stress   S V 41.8   [ MPa ] [1]
Maximum horizontal stress S h m a x 35.5   [ MPa ] [1]
Minimum Horizontal stress S h m i n 21.7   [ MPa ] [1]
Initial pore pressure0.0   [ MPa ] [2]
Matrix Permeability0.05   [ mD ] [2]
Mode I fracture toughness   2   [ MPa m ] [1]
Table 2. Fracture network properties used in the model.
Parameter ValueValuesSource/Comments
Density of micro-fractures N = 500 / m 3 Assumed
a2.4 × 10−2Cumulative power law distribution for micro-fracture radius: F = a · X b . F is the fracture cumulative frequency and X is the fracture radius (mm). [14]
b0.1
R e f f >30 [mm]The minimum radius of effective micro-fracture. Assumed
Dilation angle0.035   [ rad ] Assumed
Fracture radius (Lognormal distribution) m e a n = 3   [ m ] v a r i a n c e = 0.75   [ m ] 2 Estimating from [1]
Fracture asperity (Lognormal distribution) m e a n = 4 · 10 5   [ m ] v a r i a n c e = 10 9 [ m ] 2 Assumed
Cohesive (Lognormal distribution) m e a n = 0   [ MPa ] v a r i a n c e = 0   [ MPa ] 2 Assumed
Frictional angle (Lognormal distribution) m e a n = 0.6   [ rad ] v a r i a n c e = 0.01 [ rad ] 2 Assumed
Publisher’s Note: MDPI stays neutral with regard to jurisdictional claims in published maps and institutional affiliations.