Article

Effect of Pebble Size Distribution and Wall Effect on Inner Packing Structure and Contact Force Distribution in Tritium Breeder Pebble Bed

Center for Fusion Science, Southwestern Institute of Physics, P.O. Box 432, Chengdu 610041, China
*
Author to whom correspondence should be addressed.
Energies 2021, 14(2), 449; https://doi.org/10.3390/en14020449
Submission received: 5 December 2020 / Revised: 12 January 2021 / Accepted: 12 January 2021 / Published: 15 January 2021
(This article belongs to the Special Issue Thermal-Hydraulics in Nuclear Fusion Technology: R&D and Applications)

Abstract

:
In the tritium breeding blanket of nuclear fusion reactors, the heat transfer behavior and thermal-mechanical response of the tritium breeder pebble bed are affected by the inner packing structure, which is crucial for the design and optimization of a reliable pebble bed in tritium breeding blanket. Thus, the effect of pebble size distribution and fixed wall effect on packing structure and contact force in the poly-disperse pebble bed were investigated by numerical simulation. The results show that pebble size distribution has a significant influence on the inner packing structure of pebble bed. With the increase of the dispersion of pebble size, the average porosity and the average coordination number of the poly-disperse pebble bed gradually decrease. Due to the influence of the fixed wall, the porosity distribution of the pebble bed shows an obvious wall effect. For poly-disperse pebble bed, the influenced region of the wall effect gradually decreases with the increase of the dispersion of pebble size. In addition, the gravity effect and the pebble size distribution have an obvious influence on the contact force distribution inside the poly-disperse pebble bed. The majority of the contact force are weak contact force that is less than the average contact force. Only a few of pebbles have strong contact force that is greater than average contact force. This investigation can help in analyzing the pebble crushing characteristics and the thermal hydraulic analysis in the poly-disperse tritium breeder pebble bed.

Graphical Abstract

1. Introduction

Granular matter widely exists in nature and industrial systems, especially in fixed beds or fluidized beds, which are widely used in chemical engineering systems [1,2] or the nuclear energy industry [3,4,5,6,7,8,9,10,11,12]. For instance, adsorption beds, chemical catalytic reaction beds and bubbling fluidized beds [13,14] are used in the form of granular fixed beds in the field of the chemical engineering. For nuclear reactor energy systems, the reactor core of the high temperature gas cooled nuclear reactor is formed by fuel pebbles [9,10,11,12], and the tritium breeder and the neutron multiplier in the tritium breeding blanket of nuclear fusion reactors [3,4,5,6,7,8] are also used in form of pebble beds.
For a pebble beds applied to energy-related systems, the heat and mass transfer performance of the pebble bed play an important role in the pebble bed application. However, the characteristics of the packing structure of pebble beds, such as packing fraction, porosity and permeability, the contact state (coordination number), and so forth, have a significant influence on the heat transfer behaviors and the flow characteristic of fluids inside pebble beds [15,16,17,18,19,20,21,22,23,24,25,26,27,28]. For example, the average porosity and porosity distribution in the bed have a significant influence on the pressure drop and fluid velocity distribution inside a pebble bed [23,24,25,26,27,28]. Further, the effective thermal conductivity of a granular assembly, the thermal diffusion coefficient, the heat transfer coefficient between the pebble bed and the wall [15,16,17,18,19,20,21,22] are all affected by the inner structure of the pebble bed. In addition, the contact state (coordination number) and the contact force of pebbles inside the bed is another very useful and important parameter that characterizes the performance related to the heat transfer and mechanical behaviors of a pebble bed. The heat transfer process of a pebble bed is mainly carried out through the contact heat conduction between pebbles especially the fixed bed with high solid-fluid thermal conductivity ratio and slow fluid flow rate [15,16,17,18,19,20,21,22,23,24,25,26,27,28]. Under the condition, the contact force chain network between pebbles in contact with each other forms a net-like virtual heat transfer path inside a pebble bed [29,30,31,32,33,34,35], the size of which will affects the effective thermal conductivity and heat transfer behaviors of pebble bed, while the size of the virtual path is closely related to the magnitude of the contact force and the contact area. Thus, the contact force distribution will affect the effective thermal conductivity of the pebble bed. What’s more, the magnitude and the distribution of contact force play an important role for the prediction of the lifetime and the breakage of pebbles inside a fixed pebble bed [29,30,31,32,33,34,35,36,37,38,39]. Too strong a contact force may cause cracks and fragmentation near the contact point of a pebble, affecting the mechanical behaviors of the fixed pebble bed. From this perspective, accurately determining and predicting the pebble bed packing structure (porosity distribution and coordination number) and contact force distribution are of great significance for the analyzing the heat and mass transfer characteristics of a fixed bed, which is the key to designing a fixed pebble bed.
In a fixed pebble bed, the packing structure and the contact force distribution have been extensively investigated experimentally and numerically. Especially the radial porosity distribution in the cylindrical mono-sized pebble bed has been studied by a large number of experiments and simulations [40,41,42,43]. In a cylindrical mono-sized pebble bed, the radial porosity distribution of the pebble bed exhibits oscillating and damping characteristics near the fixed wall, the width of the oscillation region is always affected by the ratio of the diameter of the cylinder to the pebbles. This phenomenon of porosity oscillation and damping is the so-called “near-wall channeling effect” or “wall effect”. In further, the global porosity and the coordination number of the cylindrical pebble bed are also affected by the diameter ratio of cylinder to pebble. With the increase of the diameter ratio of cylinder to pebble, the global porosity decreases and the coordination increase gradually, and eventually both tend to a constant value [7,8,44]. In addition, numerous numerical simulations and experiments have been conducted on the contact force distribution and force chain inside pebble bed [29,30,31,32,33,34,35,36,37,38,39]. The force chain network, including strong contact force chain and weak contact force chain, formed by the contact force between pebbles gradually evolves with each other under the external excitation, such as gravity, external compression load, thermal expansion, vibration, and so forth. In a fixed pebble bed, although the magnitude of the contact force is distributed in a relatively wide range, the majority of the contact force is weak contact force chain that is less than the average contact force. With the increase of the contact force, the probability of contact force decreases rapidly. Only a small amount of contact force is much larger than the average contact force, which may cause that the pebbles with large strong contact force may be broken due to the large stress concentration near the contact point. Therefore, in-depth investigation of the contact force distribution and the force chains is very important to predict the crushing behavior of the pebbles inside the fixed pebble bed.
In addition, in numerous previous investigations, most of the attention was focused on the study of the macro- and meso-scale packing structure and contact force distribution of the mono-sized pebble bed [45,46,47,48,49,50,51]. Such as, the average porosity and radial porosity distribution in the mono-sized cylindrical pebble bed various as the increase of the diameter ratio of cylinder to pebble, and the relation between the coordination number and the porosity in bed. For the progress of the radial porosity variation in mono-sized cylindrical pebble bed can refer to the review literature [40]. For binary-sized pebble beds or poly-disperse pebble beds, the average packing density (or average porosity) and the macroscopic compression response were investigated widely. For the progress of the packing density of the binary-sized pebble bed and the poly-disperse pebble bed one can refer to the literature [52,53,54,55]. However, for poly-disperse fixed pebble beds, the inner packing structure features such as the porosity distribution and the coordination number distribution, and so forth, is still insufficiently investigated. Especially there are few reports in the literature about the local porosity distribution close to the fixed wall in poly-disperse pebble bed. In addition, the investigation on the contact force distribution in the poly-disperse pebble bed is insufficient, especially the effect of the pebble size distribution on the contact force distribution in the poly-disperse pebble bed is also few reported in literature.
Therefore, this study is focused on the investigation of the effect of pebble size distribution (discrete normal distribution and discrete uniform distribution) and fixed wall effect on the inner packing structure and the contact force distribution in the poly-disperse fixed pebble bed under gravity packing, based on the discrete element method (DEM). This study can help to analyze the pebble crushing characteristics and the heat transfer behaviors in the poly-disperse tritium breeder pebble bed of a solid tritium breeder blanket in a fusion reactor. In this work, the methodology is mainly concentrated in the Section 2. The results and related discussions are shown in Section 3. Finally, some conclusions obtained in this work are summarized in Section 4.

2. Methodology

2.1. Discrete Element Method

The discrete element method (DEM) was applied to modelling the packing behavior of the poly-disperse pebbles packing, which is an effective numerical modelling method to investigate the dynamic response of granular materials, such as the pebble packing in this work. The motion of pebbles in the DEM simulation follows the Newton’s second law of motion, which is driven by the force interactions, such as the contact force between two pebbles and between pebble and wall, the gravity, the cohesive force, the Van der Waals force, and so forth. In this study, due to the investigation was focused on the packing of the millimeter dry pebbles, the gravity effect and the contact force were considered only. Thus, the resultant acceleration of each pebbles is calculated from the gravity and the contact force. The pebble motion can be expressed as the following:
m i d V i d t = j = 1 N F n j i + F t j i + F g
I i d ω i d t = j = 1 N r i j × F n j i + F t j i
where, mi and Ii are the pebble mass and the motion of inertia. Vi and ωi are the velocity of the translational and rotational movement of pebble i, respectively. N is the number of the surrounding pebbles touched the pebble i. Fn and Ft are normal and tangential contact force between two pebbles, respectively. Fg is the gravity force. rij is the vector pointing from the pebble i to pebble j. Under the influence of the friction interaction between two pebbles, the normal contact force and the tangential contact force satisfy the |Ft|maxμ |Ft|, where μ is friction coefficient.
The contact force is calculated based on the Hertz-Mindlin [56] contact theory, Fn and Ft can be determined as follows:
F n = k n δ n i j η n v n i j   and   F t = k t δ t i j η t v t i j
For normal contact force, kn is the elastic constant of normal contact (also known as normal stiffness), ηn is the normal viscoelastic damping coefficient. δnij is the overlap of two normal contact pebbles. νnij is the normal relative velocity of two pebbles. kn and ηn can be expressed as:
k n = 4 3 Y * R * δ n i j   and   η n = 2 6 5 β S n m *
where S n = 2 Y * R * δ n i j , ηn ≥ 0.
For tangential contact force, kt is the elastic constant of tangential contact (also known as tangential stiffness), ηt is the tangential viscoelastic damping coefficient. δnij is the tangential relative displacement vector of two contact pebbles. νtij is the tangential relative velocity of two pebbles. kt and ηt can be shown as:
k t = 8 G * R * δ t i j   and   η t = 2 6 5 β S t m *
where, S t = 8 G * R * δ n i j , ηt ≥ 0. β is a damping constant determined by the restitution coefficient e as follows:
β = ln e ln 2 e + π 2
For the above formulas, where, Y*, G*, m* and R* are the effective elastic modulus, the effective shear modulus, the equivalent mass and the equivalent radius of two contact pebbles, they are given as follow:
1 Y * = 1 v i 2 Y i + 1 v j 2 Y j
1 G * = 2 2 v i 1 + v i Y i + 2 2 v j 1 + v j Y j
1 R * = 1 R i + 1 R j   and   1 m * = 1 m i + 1 m j
where, Y and G are the Young’s modulus and the Shear modulus of pebble. v is the Poisson ratio. R and m are the radius and the mass of pebble. In this work, the DEM simulation was carried out by using the open-source software LIGGGHTS [57]. More detailed theory of the DEM can be obtained in [7,56,57].

2.2. Modelling Packing Process and Parameter Setup

In the simulation of the present work, all pebbles were assumed to be completely spherical hard spheres. The packing process in this work can be divided into two stages: the gravity settlement stage and the gradually equilibrium stage. Firstly, a specialized number of pebbles was randomly generated in one moment without overlap between pebbles in the computational region according to the predefined pebble size distribution. There are 30,000 pebbles in all simulation cases in this work. The pebble size distribution in number distribution is shown in Table 1. Then, gravity is applied to all pebble body. Under the gravity effect, the pebbles begin to fall freely and pack in the container bottom gradually. The packing process will turn to the gradually balance stage when all pebbles were packed at the bottom of the container. The kinetic energy of pebbles gradually dissipates in the process of the collision effect and the friction interaction between pebbles. Finally, all pebbles will be packed in the container with a balanced and stabled packing state.
During the simulation, the interaction between pebbles is simulated by iterative calculation of the contact force between pebbles, displacement, velocity, and so forth. Firstly, according to the physical model of pebbles and the contact state, the contact force is calculated between pebbles. Secondly, the resultant force of the contact force between the pebble and the surrounding pebbles and the gravity force is computed. Thirdly, solve the dynamic equation of the pebble motion in a specific time-step and update the pebble position, translational velocity, angular velocity and other information. According to the updated pebble information, the contact force and the resultant force can be calculated again. Through multiple iteration calculations, a stable packing state of pebbles is achieved finally. The final convergence criterion is determined by monitoring the total kinetic energy of the entire pebble bed. When the total kinetic energy is lower than a specified value, the iterative calculation can be terminated. In this work, the simulation is stopped when the total kinetic energy of the whole bed is less than 10−10 J. At this time, the translational and rotational motion of pebbles in the packed bed is very weak, and the position of pebbles almost does not change. It can be considered that the packed bed has reached a stable equilibrium state.
In this work, the material parameters shown in Table 2 are used in the simulation. The average diameters of all simulation cases are equal to 1 mm. There are three kinds of pebble size distribution in number, as follows:
(1)
Mono-sized, diameter of all pebbles is equal to 1 mm.
(2)
Discrete normal distribution, N (E, σ2). E is average diameter davg and also equal to 1 mm. σ is the standard deviation of pebble size varying from 0 to 0.3.
(3)
Discrete uniform distribution, U (dmin, dmax). dmin and dmax are the minimum and maximum values of pebble diameter. The pebble diameter is discretized with a step of 0.05 mm from dmin to dmax. the average diameter davg is equal to the mean of dmin and dmax. the diameter difference, Δd, defined as the absolute of the difference between the maximum (minimum) diameter dmax (dmin) and the average diameter davg was used to represent the dispersion degree of discrete uniform pebble size distribution, which varied from 0 to 0.5 mm.
In addition, for each pebble size distribution, the pebble packing under gravity was carried out with fixed side wall and the periodic boundary, respectively. For the pebble bed with fixed wall boundary, the fixed wall was applied in x-axis and y-axis. For the pebble bed with periodic boundary, the container box is periodic in x-axis and y-axis. But in z-axis, the fixed wall was also adopted to carry the gravity of the pebbles in pebble bed with periodic boundary. The bed dimension is 20 mm × 20 mm × 140 mm in all simulation cases. The effect of pebble size distribution and the wall effect on the packing stricture and the contact force distribution was analyzed in detail.

3. Results and Discussions

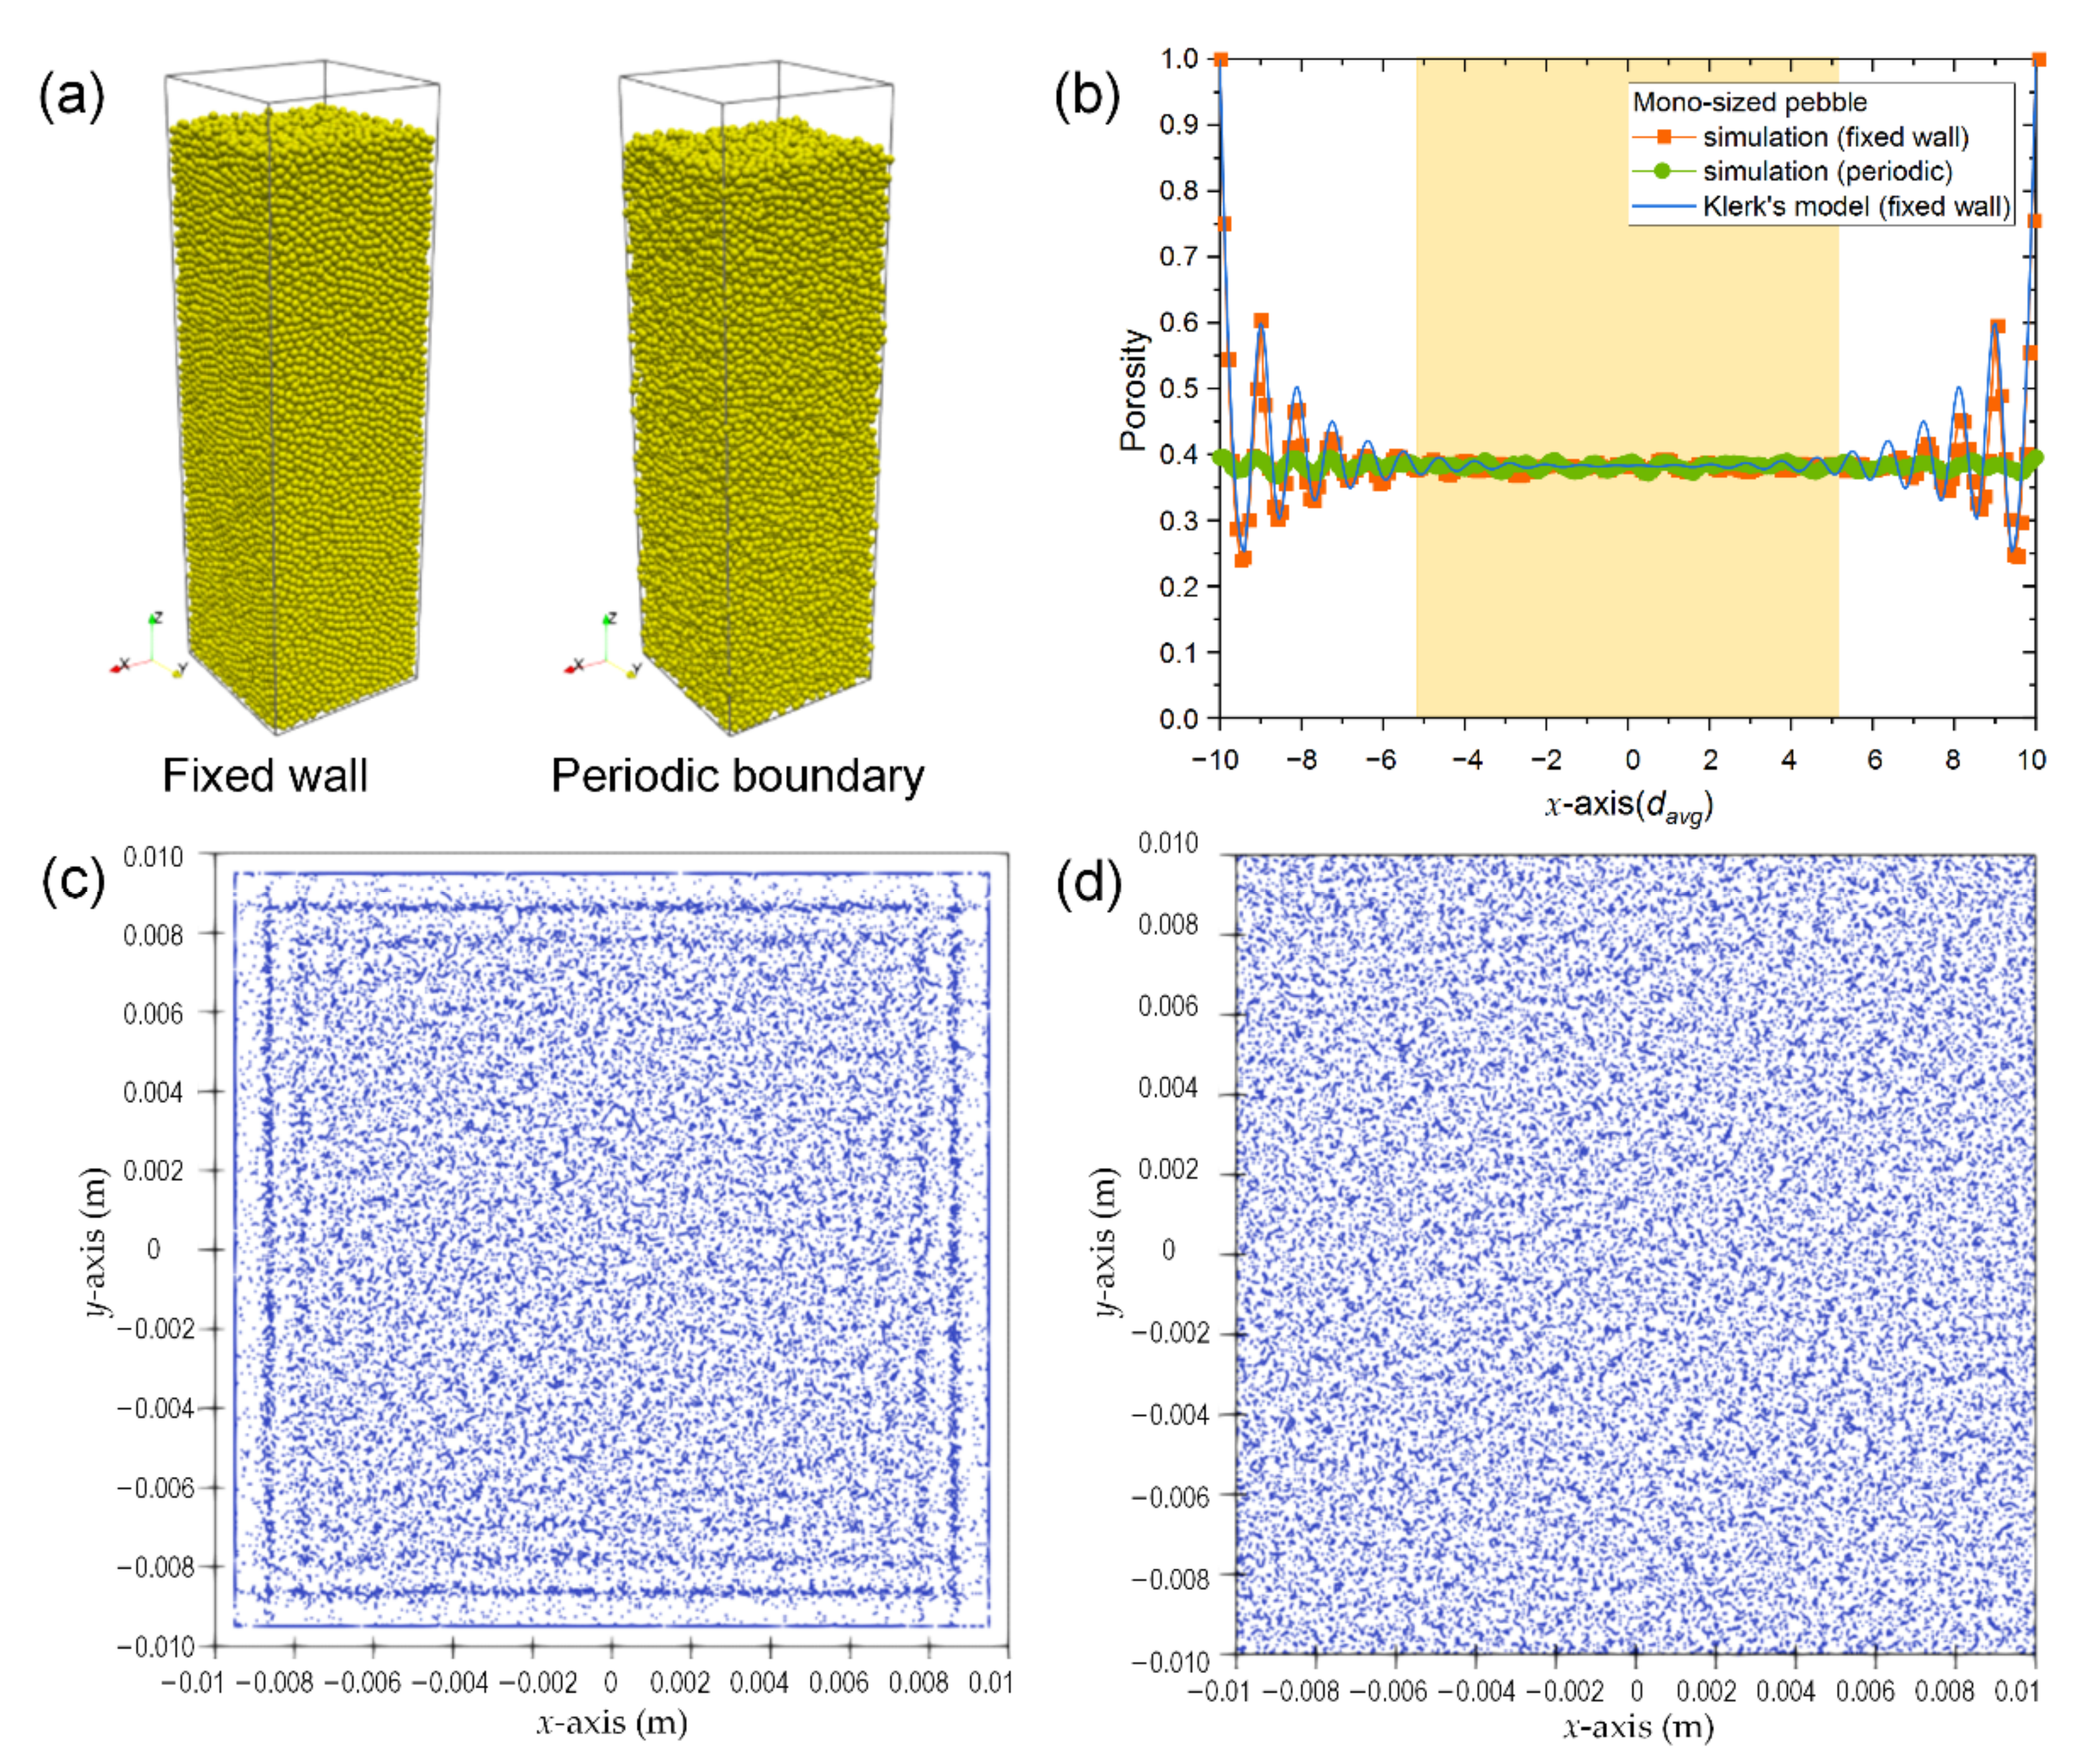
3.1. Mono-Sized Pebble Bed and Validation

3.1.1. Porosity Distribution

The pebble packing structure and the contact force distribution of mono-sized pebble bed was simulated and analyzed to validate the DEM simulation by comparing with the experimental and numerical results reported in literature. Figure 1a shows the 3D view of the mono-sized pebble bed, in which the average porosity of pebble bed with periodic boundary is 0.3819 ± 0.0008. For pebble bed with fixed side wall, the average porosity is 0.3981 ± 0.0007. A relatively lower porosity can be obtained in bed with periodic boundary compared to the pebble bed with fixed wall, which is mainly caused by the influence of fixed wall. There is a relatively larger porosity near the container wall, which can also be revealed from the porosity distribution, as shown in Figure 1b.
Figure 1b shows the porosity distribution along the x-axis direction in the pebble bed. A stable porosity can be observed in the whole pebble bed with periodic boundary. The axial porosity is slightly irregularly disturbed around the average porosity due to the effect of random packing structure. However, for pebble bed with fixed wall, it can be revealed from the Figure 1b that the axial porosity in the whole pebble bed shows a damping and oscillating behaviors as the distance to the fixed wall increase. A wall effect of porosity distribution can be observed obviously. In the region adjacent to the fixed wall, the maximum porosity of about 1 is achieved since the pebbles is almost in point contact with the fixed wall. With the increase of the distance to the fixed wall, the porosity decreases rapidly. A minimum porosity of about 0.25 is obtained when the distance to the wall is about 0.5 d. With further increase of the distance to the wall, the porosity of pebble bed shows a characteristic of damping and oscillation. When the distance to the fixed wall is greater than 5 d, the porosity tends to a constant value, namely, the average porosity in the inner region of pebble bed. In this work, the average porosity in the inner region of mono-sized random packed pebble bed with fixed wall is 0.3826 ± 0.0006, which is similar to the global average porosity of the randomly packed mono-sized pebble bed with periodic boundary. In further, a layered distribution of pebble center close to the fixed wall can be clearly observed by projecting the particle sphere center to the bottom wall (x-y plane), as shown in Figure 1c,d which is also corresponding to the axial porosity variation close to the fixed wall. In addition, the axial porosity variation of the mono-sized pebble bed with fixed wall is in line with the results from the Klerk’s empirical model [43].

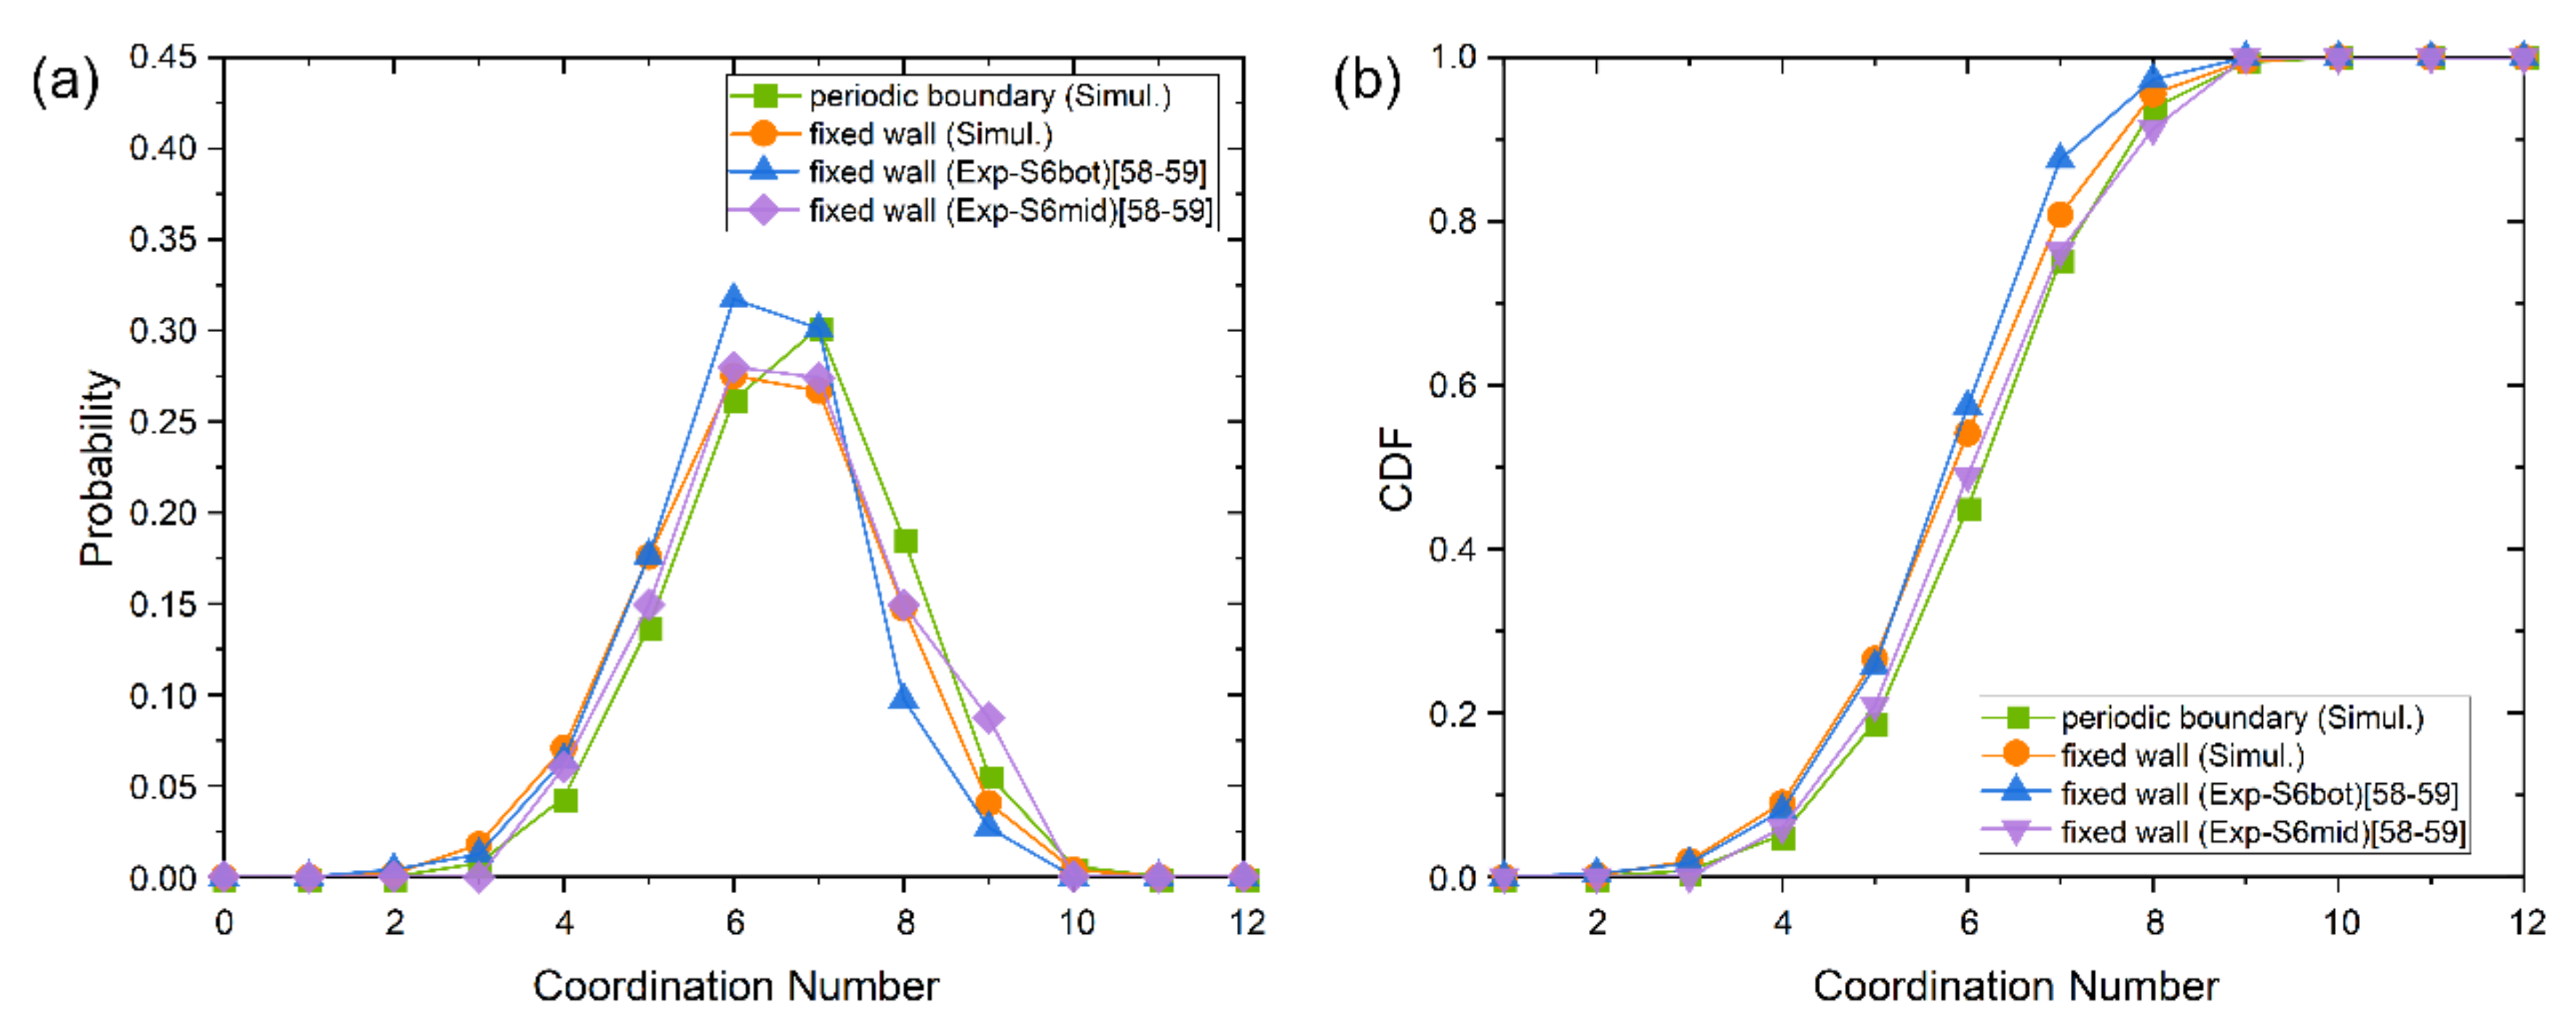
3.1.2. Coordination Number Distribution

The coordination number mainly indicates the number of other surrounding pebbles in contact with the specified pebble in pebble bed. In this work, the average coordination number of the mono-sized pebble bed with fixed wall is 6.3216, which is slightly lower than that of 6.6176 in the bed with periodic boundary. It is mainly because the pebbles directly in contact with the fixed wall and close to the fixed wall have smaller coordination number due to the influence of the fixed wall effect, as shown in Figure 2. While for the pebble bed with periodic boundary, there is no fixed wall effect. Thus, a higher coordination number can be obtained.
Figure 2 shows the probability distribution function (PDF) and the cumulative distribution function (CDF) of coordination numbers in a mono-sized pebble bed. It can be seen from the figure that the coordination numbers with larger probabilities in the mono-sized pebble beds with both fixed wall and periodic boundary are 6 and 7, respectively. For the fixed wall pebble bed, the coordination number with the most probability is 6, and for periodic boundary pebble bed, it is 7. The coordination number of the periodic boundary pebble bed with the highest probability is also slightly higher than that of the fixed wall pebble bed, which is also due to the influence of the fixed wall effect. In addition, the coordination number distribution also reaches an agreement with the experiment results from the literature [59,60], which indicates that the reliable results of pebble packing can be obtained by the DEM simulation.

3.1.3. Contact Force Distribution

The contact force distribution in a mono-sized pebble bed with a periodic boundary and fixed wall is shown in Figure 3. If a cylinder is used to connect the center of two contacted pebbles, the diameter and color are used to indicate the magnitude of contact force, the contact force in bed can form a force chain network, as shown in Figure 3a. It is clearly show that due to the influence of the gravity effect, the strong force chain is mainly concentrated close to the bottom in the mono-sized pebble bed. With the increase of the local height, the magnitude of the contact force gradually reduces, the smallest contact force can be observed in the top region of the pebble bed. In addition, the variation of the contact force along the local height of the pebble bed can be obtained by calculating the average contact force in a micro volume with a step of 0.5 d along the height (z-axial) of the pebble bed. The results, as shown in Figure 3b, reveal that the average contact force inside the pebble bed also decreases gradually with the increase of the local height due to the influence of gravity. The normalized contact force is between 2 and 2.5 near the bottom and tends to 0 at the top of the bed. This is consistent with the contact force chain distribution in Figure 3a.
The probability density distributions of all normalized contact force and the maximum normalized contact force of each pebble are shown in Figure 3c,d. When the normalized contact force is equal to 1, it represents the average contact force inside the pebble bed. It can be found that the weak contact force below the average contact force has the largest probability density. The probability density decreases rapidly with the increase of the contact force. It is demonstrated that the majority of the contact force inside the pebble bed is weak force which maintain the stability of the pebble packing structure, only a few strong contact forces are large than the average contact force, which mainly carry the gravity force and the external load of the pebble bed. In further, the probability density distribution of the uncompressed mono-sized pebble bed is compared with the Ngan’s empirical model [34]. It can be seen that the results of this work are in good agreement with the empirical model.
In further, for each individual pebble inside a fixed pebble bed, there are several contact forces due to the several contact between the pebble and several surrounding pebbles. Among these contact forces, some may be greater than the average contact force, others may be less than the average contact force. A feature of particular interest is the maximum contact force of each individual pebble, which is related to the mechanical stability of the tritium breeder pebble. Once the maximum contact force exceeds the crush load of pebbles, the crack and fragmentation of pebbles may occur. For the Li4SiO4 pebbles fabricated by melt spraying method, the average crush load of the pebbles with diameter of 1 mm is about 7.0 N, the maximum and the minimum crush load are 16 N and 5.2 N, respectively [61,62]. Therefore, in this study, the probability density distribution of the maximum contact force of each pebble was analyzed and compared with the probability density distribution of all contact force calculated by the Ngan’s empirical model [34]. The results show that the maximum contact force of most pebbles in bed is still less than the average contact force of the whole pebble bed. With the increase of the contact force, the probability density distribution of the maximum contact force also decreases rapidly. However, compared with the probability density distribution of all contact force, the probability density of the maximum contact force less than the average contact force is reduced, and the probability density of the maximum contact force greater than the average contact force is increased. It is indicated that all contact forces of most of pebbles is less than the average contact force, which mean that it is difficult to break. Only a small number of pebbles suffer the maximum contact force greater than the average contact force, which means that these pebbles have a higher probability of breaking.
In addition, it can be seen from Figure 3 that the contact force distribution of the pebble bed with fixed wall and periodic boundary conditions is almost same, and the boundary conditions have little influence on the inter-pebble contact force distribution inside the pebble bed in here. Therefore, the contact force in the poly-disperse pebble bed is statistically analyzed only for one kind of boundary condition in the following section.

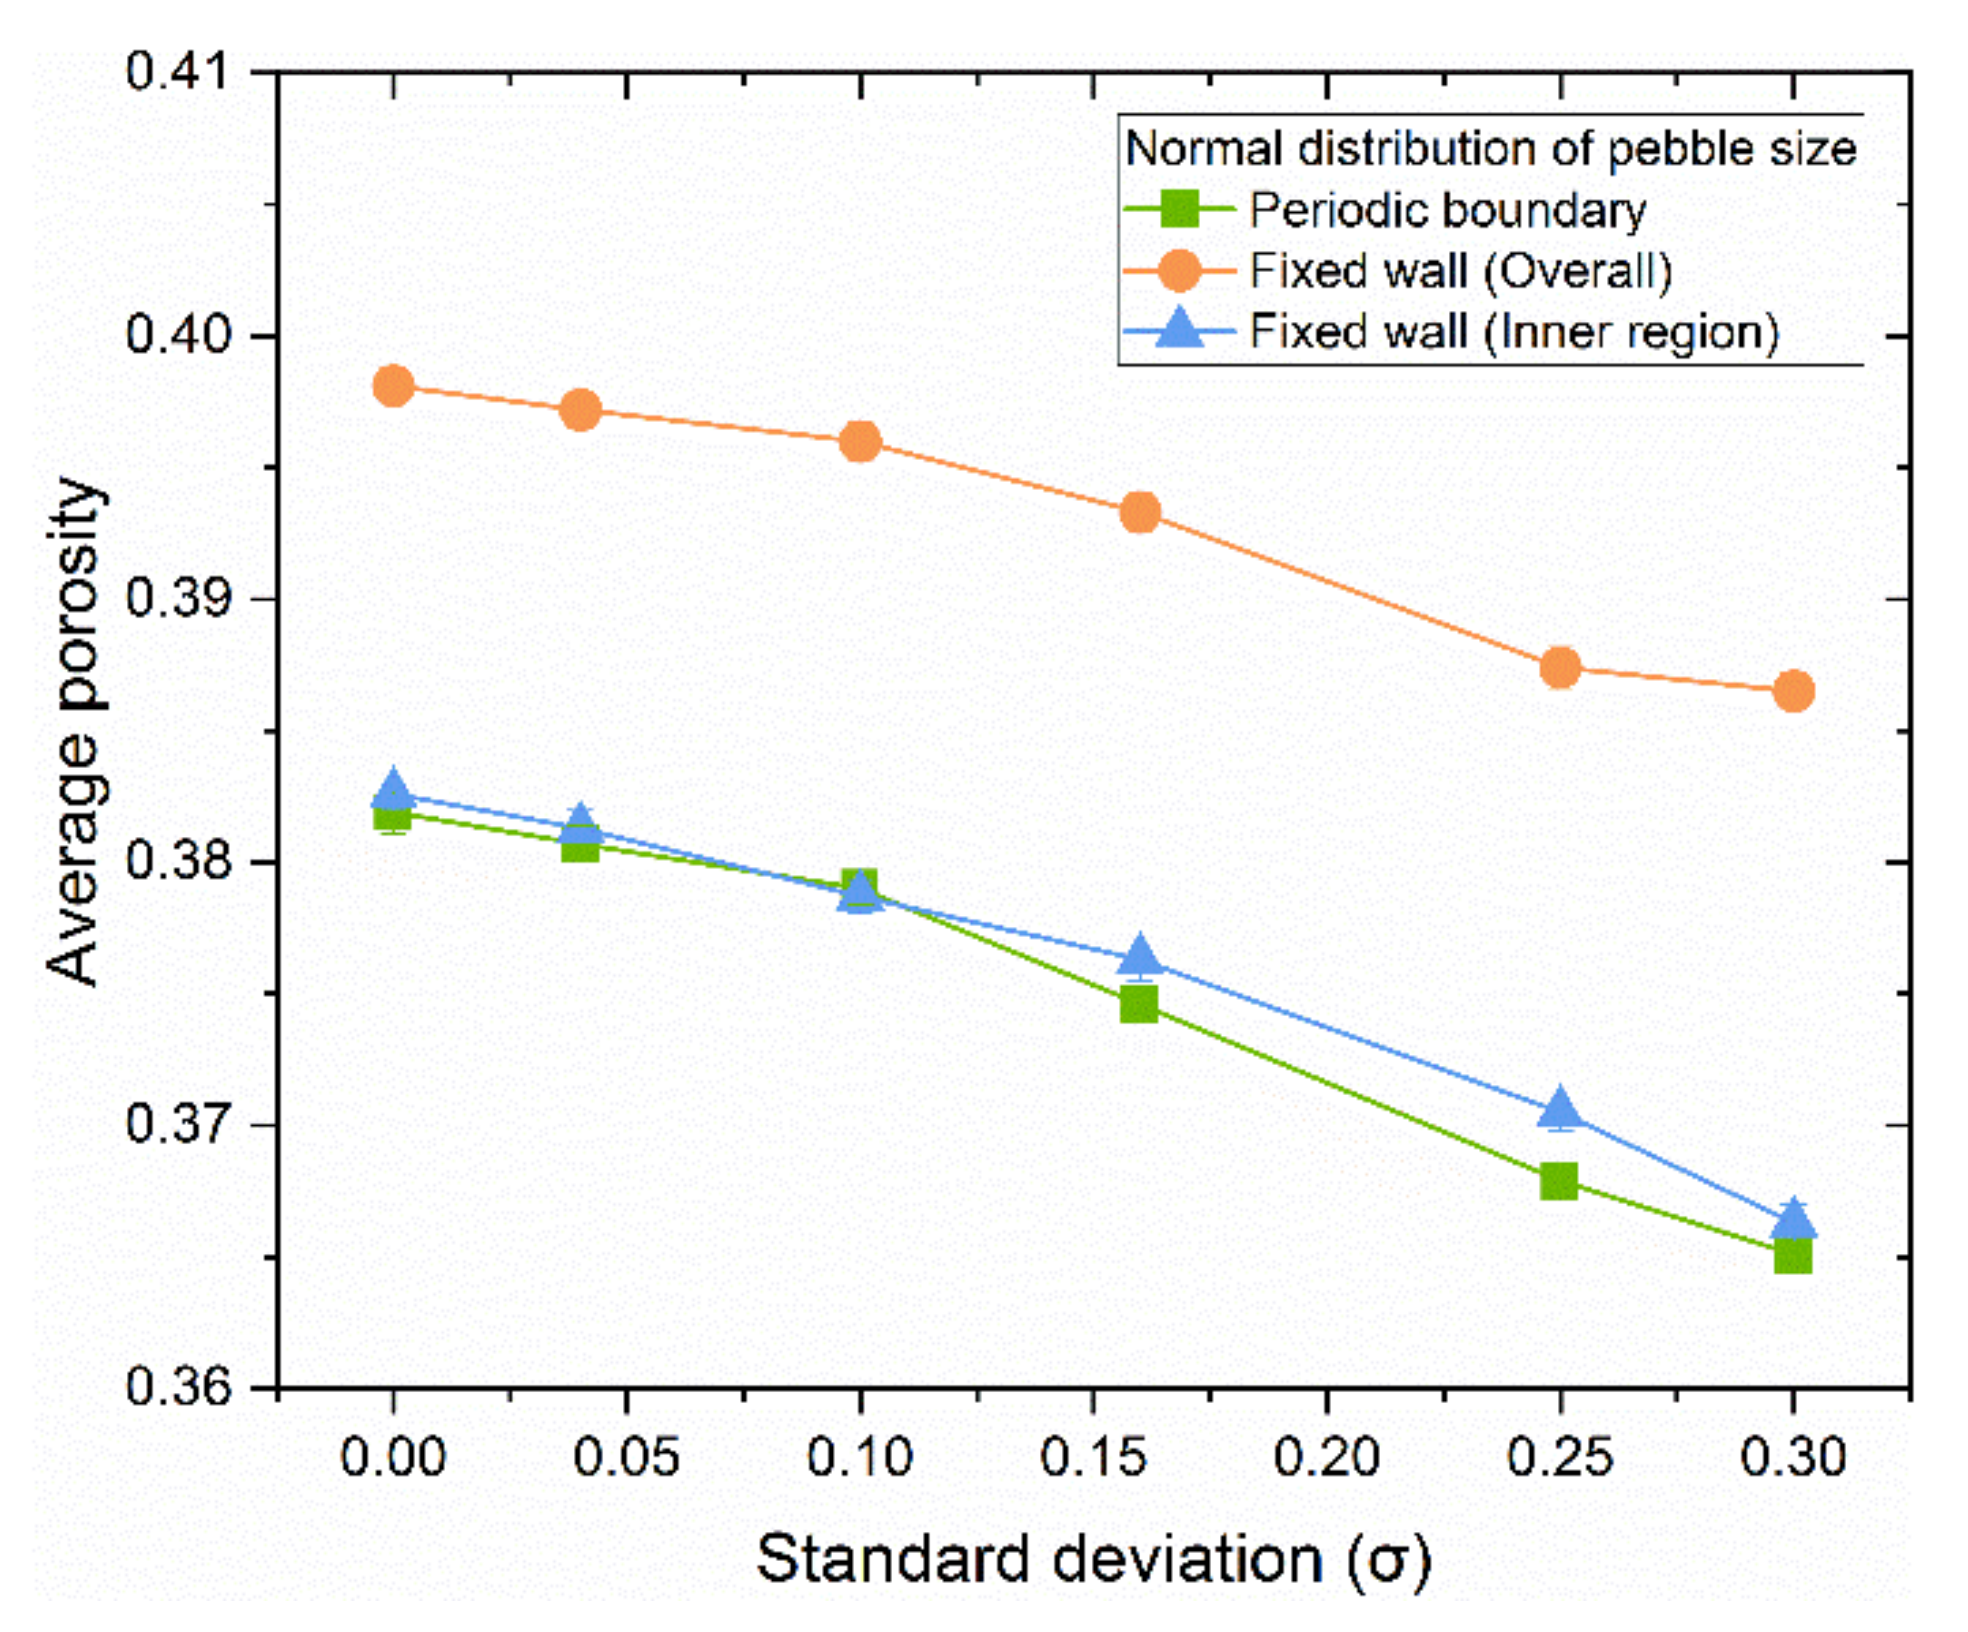
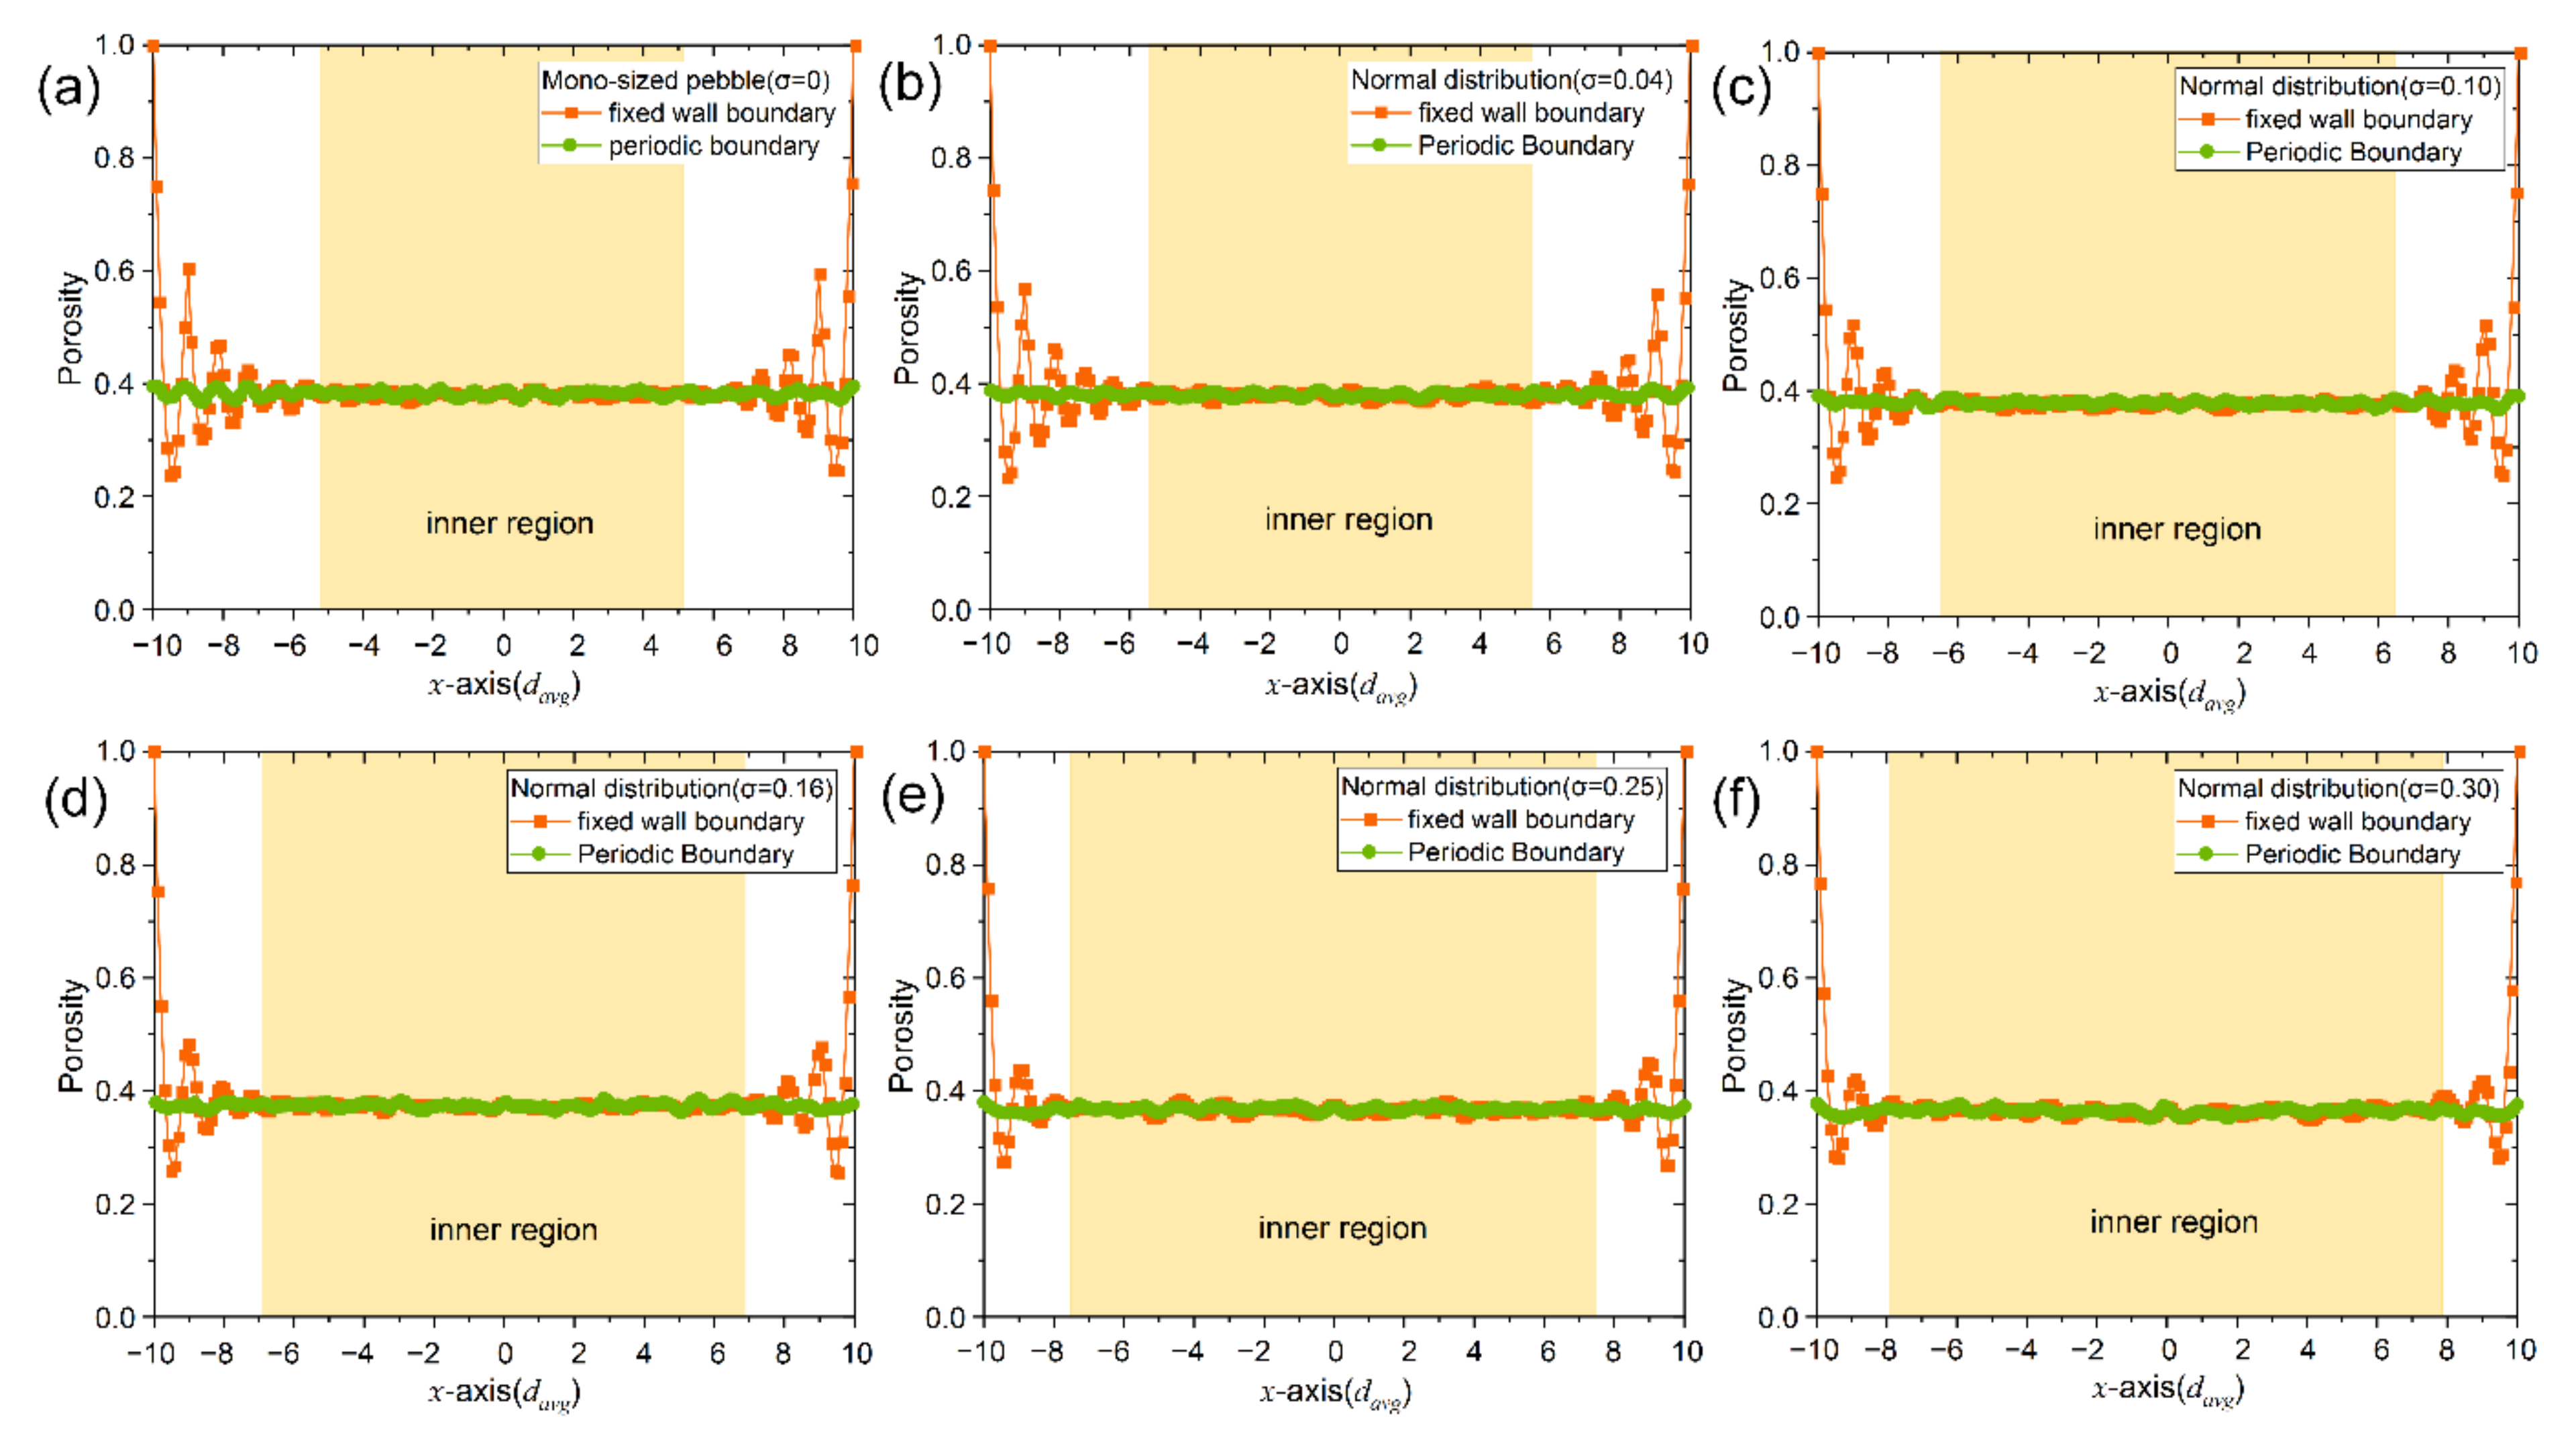
3.2. Pebble Size Normal Distribution Pebble Bed

3.2.1. Porosity Distribution

The average porosity of the poly-disperse pebble bed is shown in Figure 4 when the pebble size is normally distributed in number. The results reveal that the average porosity gradually decreases as the increase of the standard deviation of the pebble size distribution in poly-disperse pebble bed with both the fixed wall and the periodic boundary. For the poly-disperse pebble bed with periodic boundary, the average porosity gradually decreases from 0.3819 ± 0.0008 when the standard deviation is 0 (namely a mono-sized pebble bed) to 0.3651 ± 0.0007 when the standard deviation is 0.3. The decrease is about 4.4%. For the pebble bed with fixed wall, the overall average porosity also decreases from 0.3981 ± 0.0007 to 0.3865 ± 0.0007 when the standard deviation increases from 0 to 0.3. The decrease is about 2.9%. The decrease of average porosity is mainly because with the increase of pebble dispersion, many small pebbles can be filled in the gap formed between large pebbles resulting in forming a denser packing structure.
Furthermore, it is obviously that the fixed wall has a significant effect on the average porosity of pebble bed. Thus, for a poly-disperse pebble bed with fixed wall, the average porosity both in the overall of the bed and in the inner region of the bed were calculated. The calculation of the overall porosity includes the whole pebble bed, while the calculation of the inner region porosity only considers the inner region of the pebble bed by excluding the region near the vessel wall with drastic change of porosity (such as the region near the fixed wall as shown in Figure 5). It is clearly shown in Figure 3 that the overall average porosity of the bed with fixed wall is higher than that with the periodic boundary. However, after excluding the region close to the fixed side wall, the average porosity in inner region of the fixed wall pebble bed is consistent with that of the periodic boundary pebble bed, which further indicates that the fixed wall effect is on limited to the region near the wall of the pebble bed where with a higher porosity.
In order to reveal the characteristics of the wall effect in the poly-disperse pebble bed with fixed wall. The local porosity variation along the x-axis was calculated, as shown in Figure 5. Since the curves of the local porosity along the x-axis and the y-axis are basically consistent, the curves along the x-axis are shown only in Figure 5. The local porosity of the poly-disperse pebble bed with periodic boundary was also calculated for comparison. Figure 5 shows that the local porosity of the poly-disperse pebble bed oscillates significantly and dampens in the region close to the fixed wall. However, unlike the mono-sized pebble bed, in which the oscillation and damping is basically limited to the region of about 5 d close to the fixed wall, the influence region of the wall effect in the poly-disperse pebble bed with normally distributed pebble size is smaller than that in mono-sized pebble bed. With the increase of the standard deviation, σ, the influence region of the wall effect gradually decreases. For instance, when the standard deviation of pebble size is 0 or 0.04, the wall effect region is limited within the range of 4.5 davg–5 davg close to the wall. When the standard deviation increases to 0.3, the wall effect region is reduced to the region of about 2 davg close to the fixed wall. It is mainly due to the fact that many smaller pebbles filled into the void space formed inter-pebbles close to the wall and gaps between pebbles and wall, which improves the packing density and decreases the porosity.
In the inner region of the poly-disperse pebble bed with normally distributed pebble size, the local porosity is relatively stable, which is approximately equal to the average porosity of the inner region of the bed. For comparison, the local porosity is always distributed stably in the whole poly-disperse pebble bed with periodic boundary, which is approximately equal to the average porosity of the inner region of the poly-disperse bed with fixed wall. The results further reveal that the effect of the fixed wall on packing structure is always limited close to the wall, the packing of pebbles with normally distributed pebble size can reduce the wall effect by further filling of small pebbles into the void formed between pebbles and wall and formed between pebbles.

3.2.2. Coordination Number Distribution

Figure 6 shows the variation of the average coordination number and the standard deviation of coordination number in the poly-disperse pebble bed with normally distributed pebble size. It can be seen from Figure 6a that the average coordination number of periodic boundary pebble bed is greater than that of fixed wall pebble bed This is because that the pebbles close to the fixed wall or in direct contact with the fixed wall have a smaller coordination number due to the influence of the fixed wall effect. In further, with the increase of the standard deviation of pebble size, the average coordination number of the pebble bed decrease and the standard deviation of coordination increase gradually, which can be attributed to the increase of the probability of the pebbles with smaller coordination number and the decrease of the probability of the pebbles with coordination number of 6 and 7 (seen Figure 7) when the pebble size becomes more and more dispersed. In addition, the maximum coordination number in poly-disperse pebble bed increase gradually with the increase of the are standard deviation of pebble size, which is due to the pebble have larger surface area to contact with the surrounding small pebbles with the increase of pebble size.
The PDF and the CDF of coordination number in the pebble size normal distributed pebble bed are shown in Figure 7. As can be seen from the figure, the coordination number with the maximum probability decrease with the increase of the standard deviation of pebble size. When the standard deviation is 0 and 0.04, the coordination number with the highest probability is 6, but when the standard deviation increases to 0.3, The coordination number with the largest probability is reduced to 5. In addition, as the standard deviation of pebble size increases, the probability gradually increases when the coordination number is less than 5 and greater than 9. While, when the coordination number is between 5–9, the probability gradually decreases. This is mainly caused by the contact state between large pebbles and small pebbles. In the poly-disperse pebble bed, the large pebble has a higher coordination number, while the small pebbles have a lower coordination number due to the similar “convex wall effect”. It can also be found from the CDF of the coordination number. As the standard deviation increases, the cumulative probability profile of low coordination number shifts to left, while the cumulative probability of high coordination number shifts to right. A turning point has occurred at the coordination number of 6.5654 with cumulative probability of about 0.6805 for the fixed-wall pebble bed and of 6.6917 with cumulative probability of about 0.6535 for the periodic boundary pebble bed.

3.2.3. Contact Force Distribution

For pebble beds with normal pebble size distributions, the weak force chain runs through the entire bed. The strong force chains are mainly distributed in the middle and the bottom due to the gravity effect, as shown in Figure 8. The strong force chains are linked to each other to form an arch so as to carry the gravity of the pebble above and the external load. In further, the normalized average contact force distribution along the local position (z-axis) and the horizontal direction (x-axis) of the packed bed with normally distributed pebble size are shown in Figure 9. The results show that with the increase of the local height (z-axis), the averaged contact force decreases gradually, and tends to 0 at the top of the bed. However, the average contact force is evenly distributed along the horizontal direction (x-axis or y-axis) in the bed. This is mostly because the pebble randomly packed in the horizontal direction, while the upper surface of the pebble bed in the vertical direction is a free surface. No additional compression load was applied to the upper surface of pebble bed. Therefore, under the influence of the gravity the contact force decreases with the increase in height until it is 0 at the top of the bed and is evenly distributed in the horizontal direction. In addition, it can be found that the changes of the pebble bed height and the pebble size distribution have little effect on the average contact force near the bottom wall of the pebble bed with the natural packing under gravity and no additional load. The normalized average contact force is between 1.75 and 2.75 close to the bottom wall. This is mainly attributed to the friction interaction between the pebbles and between pebbles and side walls supports part of the gravity force of the pebbles.
Figure 10 shows the probability density distribution of the normalized contact force in the poly-disperse pebble bed with a normal particle size distribution. The probability density distribution of all contact force is shown in Figure 10a,b. It can be seen from the figure that the probability density of the contact force decreases rapidly as the contact force increases. Most of the contact forces in the pebble bed are weak contact force, which is less than the average contact force. When the contact force less than average contact force, the probability density of the contact force shows a trend of first increasing and then decreasing, as shown in Figure 10b, which also be influenced by the pebble size distribution.
When the normalized contact force is less than 0.12, the probability density of the contact force gradually increases with the increase of the standard deviation. When the normalized contact force is greater than about 0.12 and less than 1, the probability density of the contact force gradually decreases as the standard deviation increases. With the further increase of normalized contact force, the probability density of strong contact force decreases rapidly. The standard deviation of the normal distribution of particle size has less influence on the probability density distribution of strong contact force. However, compared with the mono-sized pebble bed (solid line in Figure 10), the probability density of weak contact force is reduced, and the probability density of strong contact force is increased. This is mainly because as the standard deviation of pebble size increases, the contact between large pebbles and small pebbles tends to form a strong contact force due to the influence of gravity, especially the contact directly under the large pebbles. Figure 10c,d show the probability density distribution of the maximum contact force of each pebble. It can be seen from the figure that the maximum contact force of each pebbles obtains a probability density distribution which is similar to that of all contact forces. But compared with the probability density distribution of all contact forces, the probability density of the maximum contact forces less than 1 is reduced, and the probability density of strong contact forces greater than 3 is increased.

3.3. Pebble Size Uniform Distribution Pebble Bed

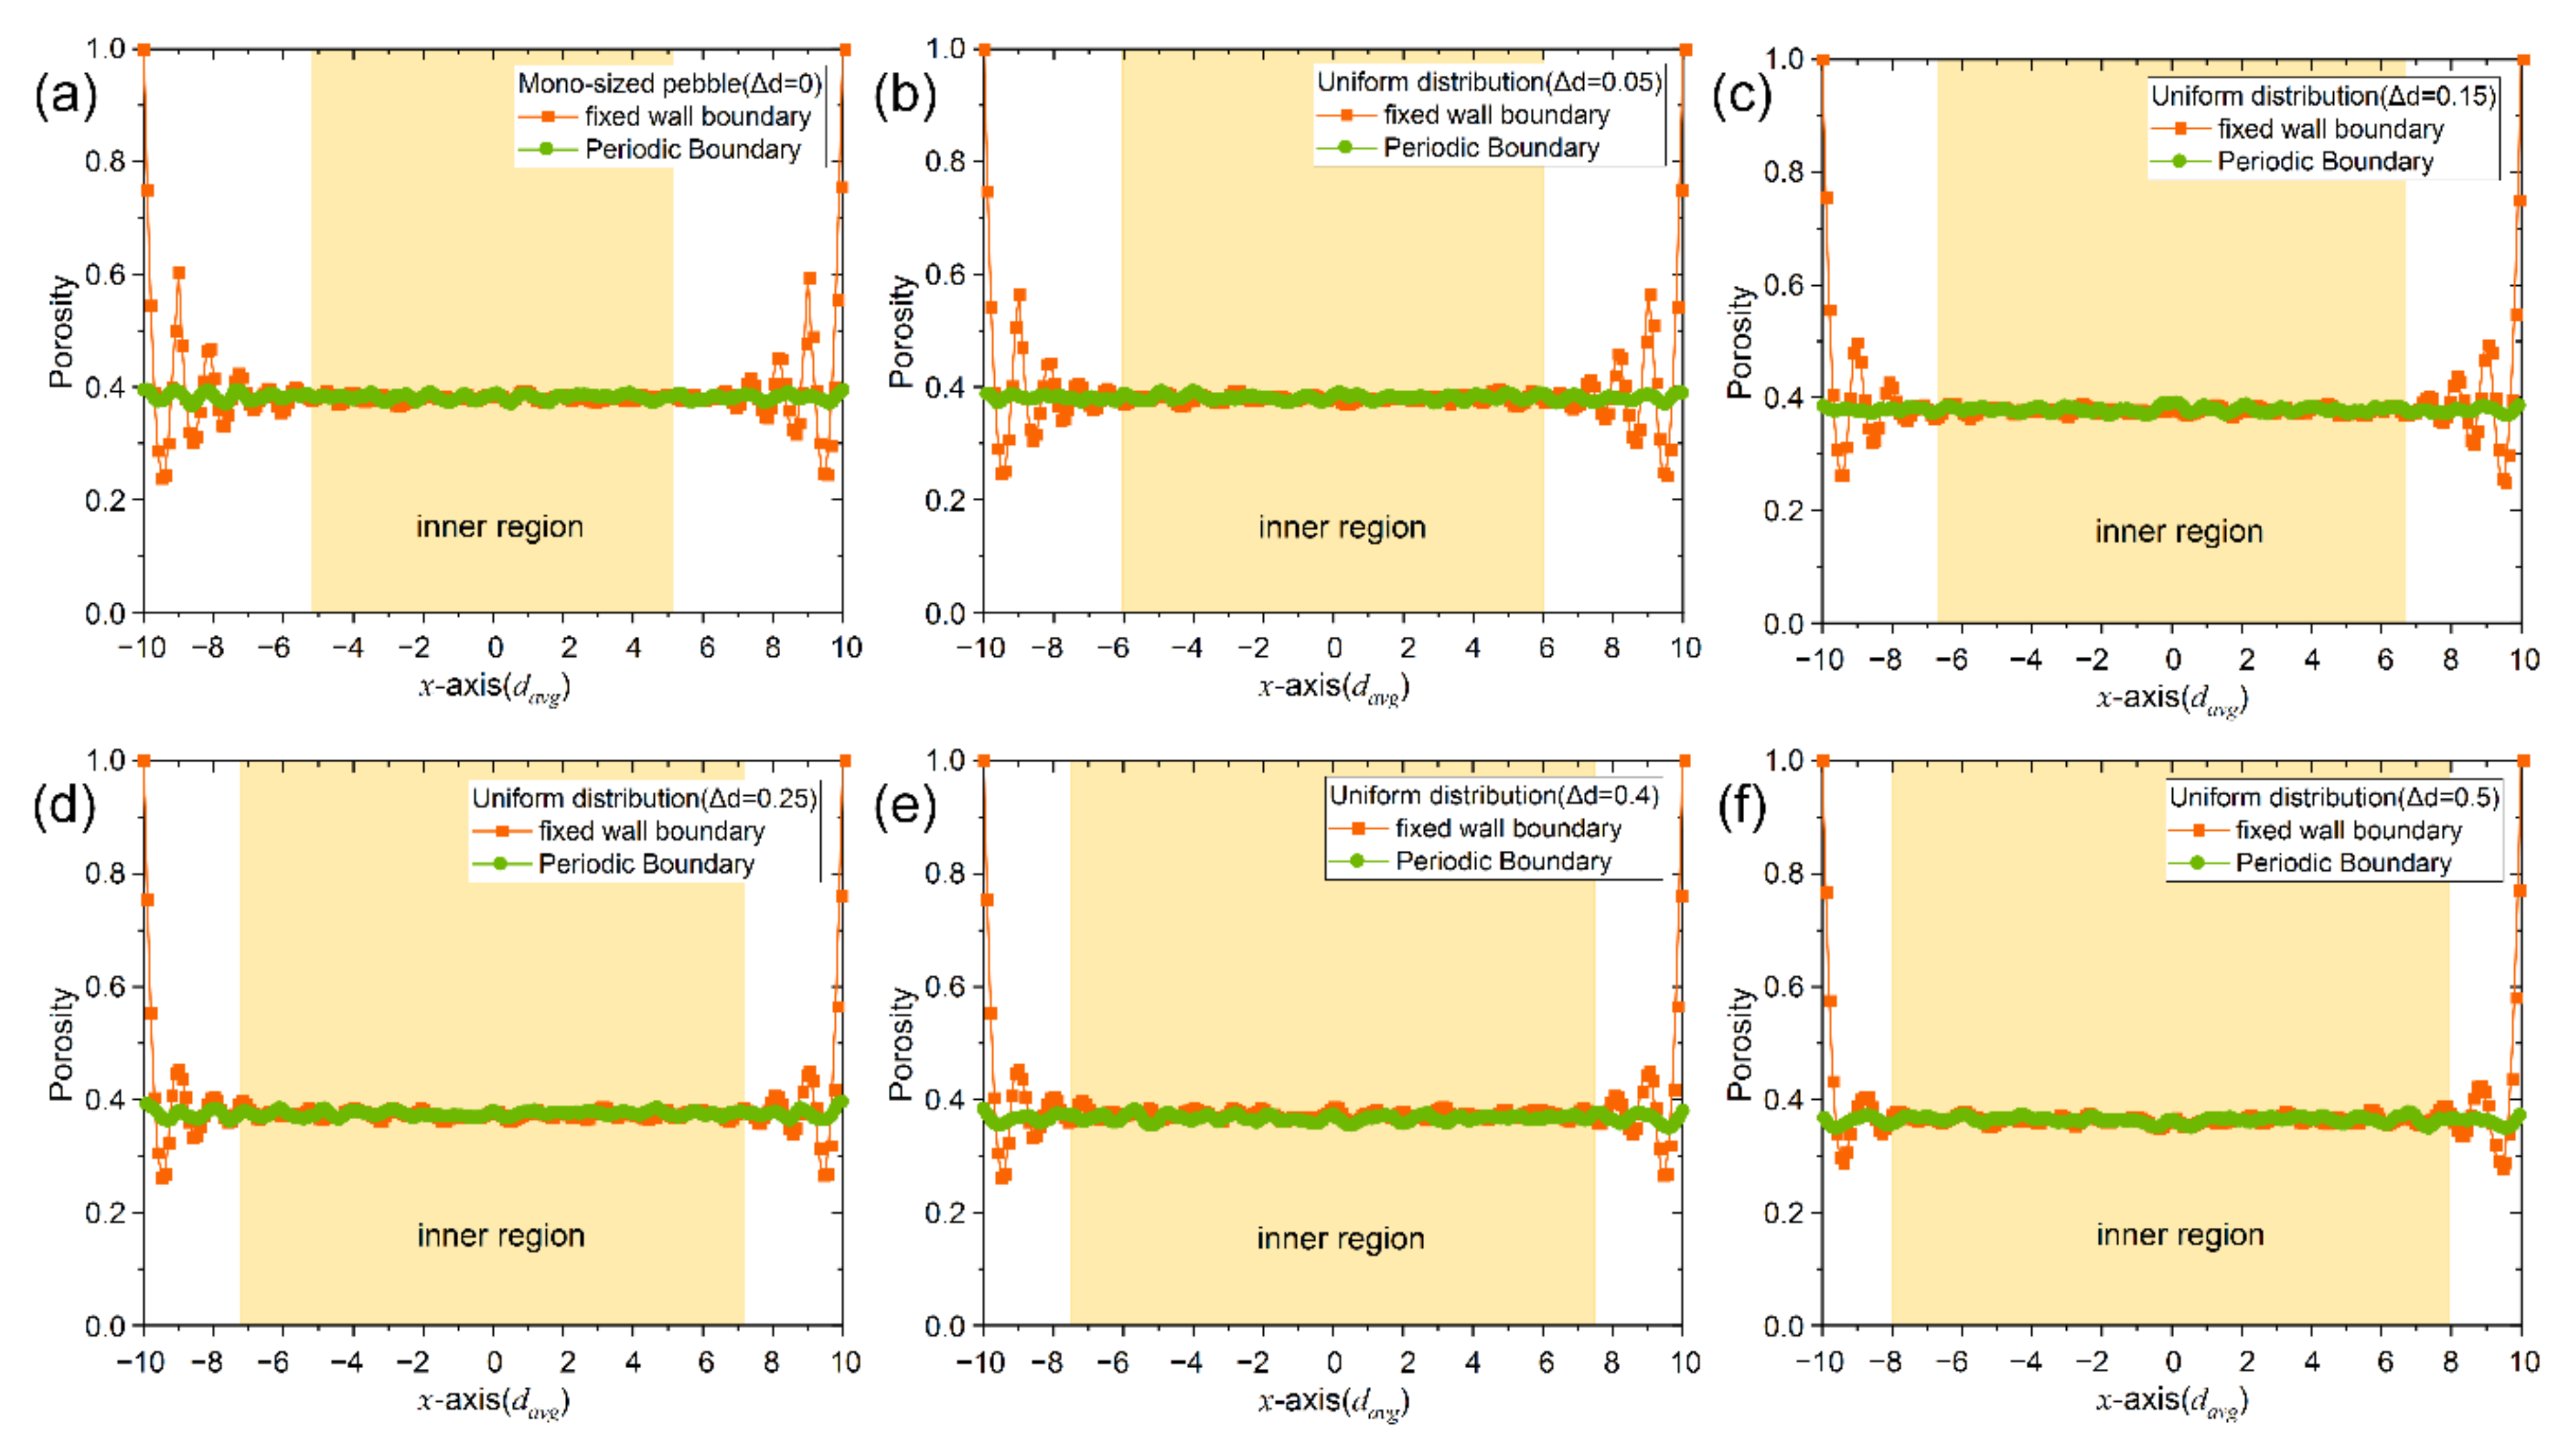
3.3.1. Porosity Distribution

The poly-disperse pebble packing with uniformly distributed pebble size was also simulated and analyzed by DEM modelling. The average porosity variation of the pebble size uniform distribution pebble bed is shown in Figure 11. With the increase of the diameter difference, Δd, the average porosity of the pebble bed decreases gradually. For the pebble bed with periodic boundary, when the Δd is about 0 and 0.05, the average porosity of the pebble bed is about 0.3819 ± 0.0008 and 0.3814 ± 0.0006, respectively. With the increase of the Δd, the average porosity of the poly-disperse pebble bed gradually decreases to 0.3661 ± 0.0008 when the Δd is increased to 0.5. This is also because the small pebbles occupy the voids between large pebbles, which increases the packing density of the poly-disperse pebble bed. For the poly-disperse pebble bed with fixed wall, due to the influence of the fixed wall, the average porosity is greater than that of the periodic boundary. The average porosity of the fixed-wall poly-disperse pebble bed decreases from 0.3977 ± 0.0007 when the Δd is 0.05 to 0.3849 ± 0.0006 when the Δd is 0.5. However, after excluding the influence of the fixed-wall effect, the average porosity in the inner region of the fixed wall pebble bed is consistent with that of the periodic boundary pebble bed. In other words, the influence of the fixed-wall effect is only limited to the area close to the wall.
To reveal the effect of fixed wall on the packing structures of the pebble size uniform distribution pebble bed, we obtained the local porosity distribution along the x-axis (perpendicular to the wall) inside the pebble bed, as shown in Figure 12. The results indicate that the axial porosity is basically uniformly distributed in the periodic boundary poly-disperse pebble bed. The variation of the pebble side distribution only affects the average porosity of the bed. However, in fixed wall poly-disperse pebble bed with uniformly distributed pebble size, the local porosity distribution along the direction perpendicular to the wall is significantly affected by the fixed wall. As the distance from the fixed wall increase, the axial porosity exhibits the characteristics of damping and oscillation. However, the proportion of the wall affected regions in the uniform particle size distribution pebble bed gradually decreases with the increase of the Δd, compared to the mono-sized pebble bed (see Figure 12a). The fixed wall affects the pebble packing structures in the region of ~5 d close to the wall in mono-sized pebble bed. With the increase of the Δd, the region affected by the wall decreases rapidly. For instance, when the Δd increases to 0.5, the wall effect region is reduced to the range of only ~2 d close to the wall. It is mainly because as the increase of the Δd, smaller pebbles can fill the large pores formed inter-pebbles or between pebble and wall. In the inner region away from the wall, the porosity distribution in the fixed wall bed is similar to that in the periodic boundary poly-disperse pebble bed with the uniformly distributed pebble size, which reveals that without considering or by excluding the wall effect, the pebble size distribution only affects the average porosity of the natural packed pebble bed under the gravity only.

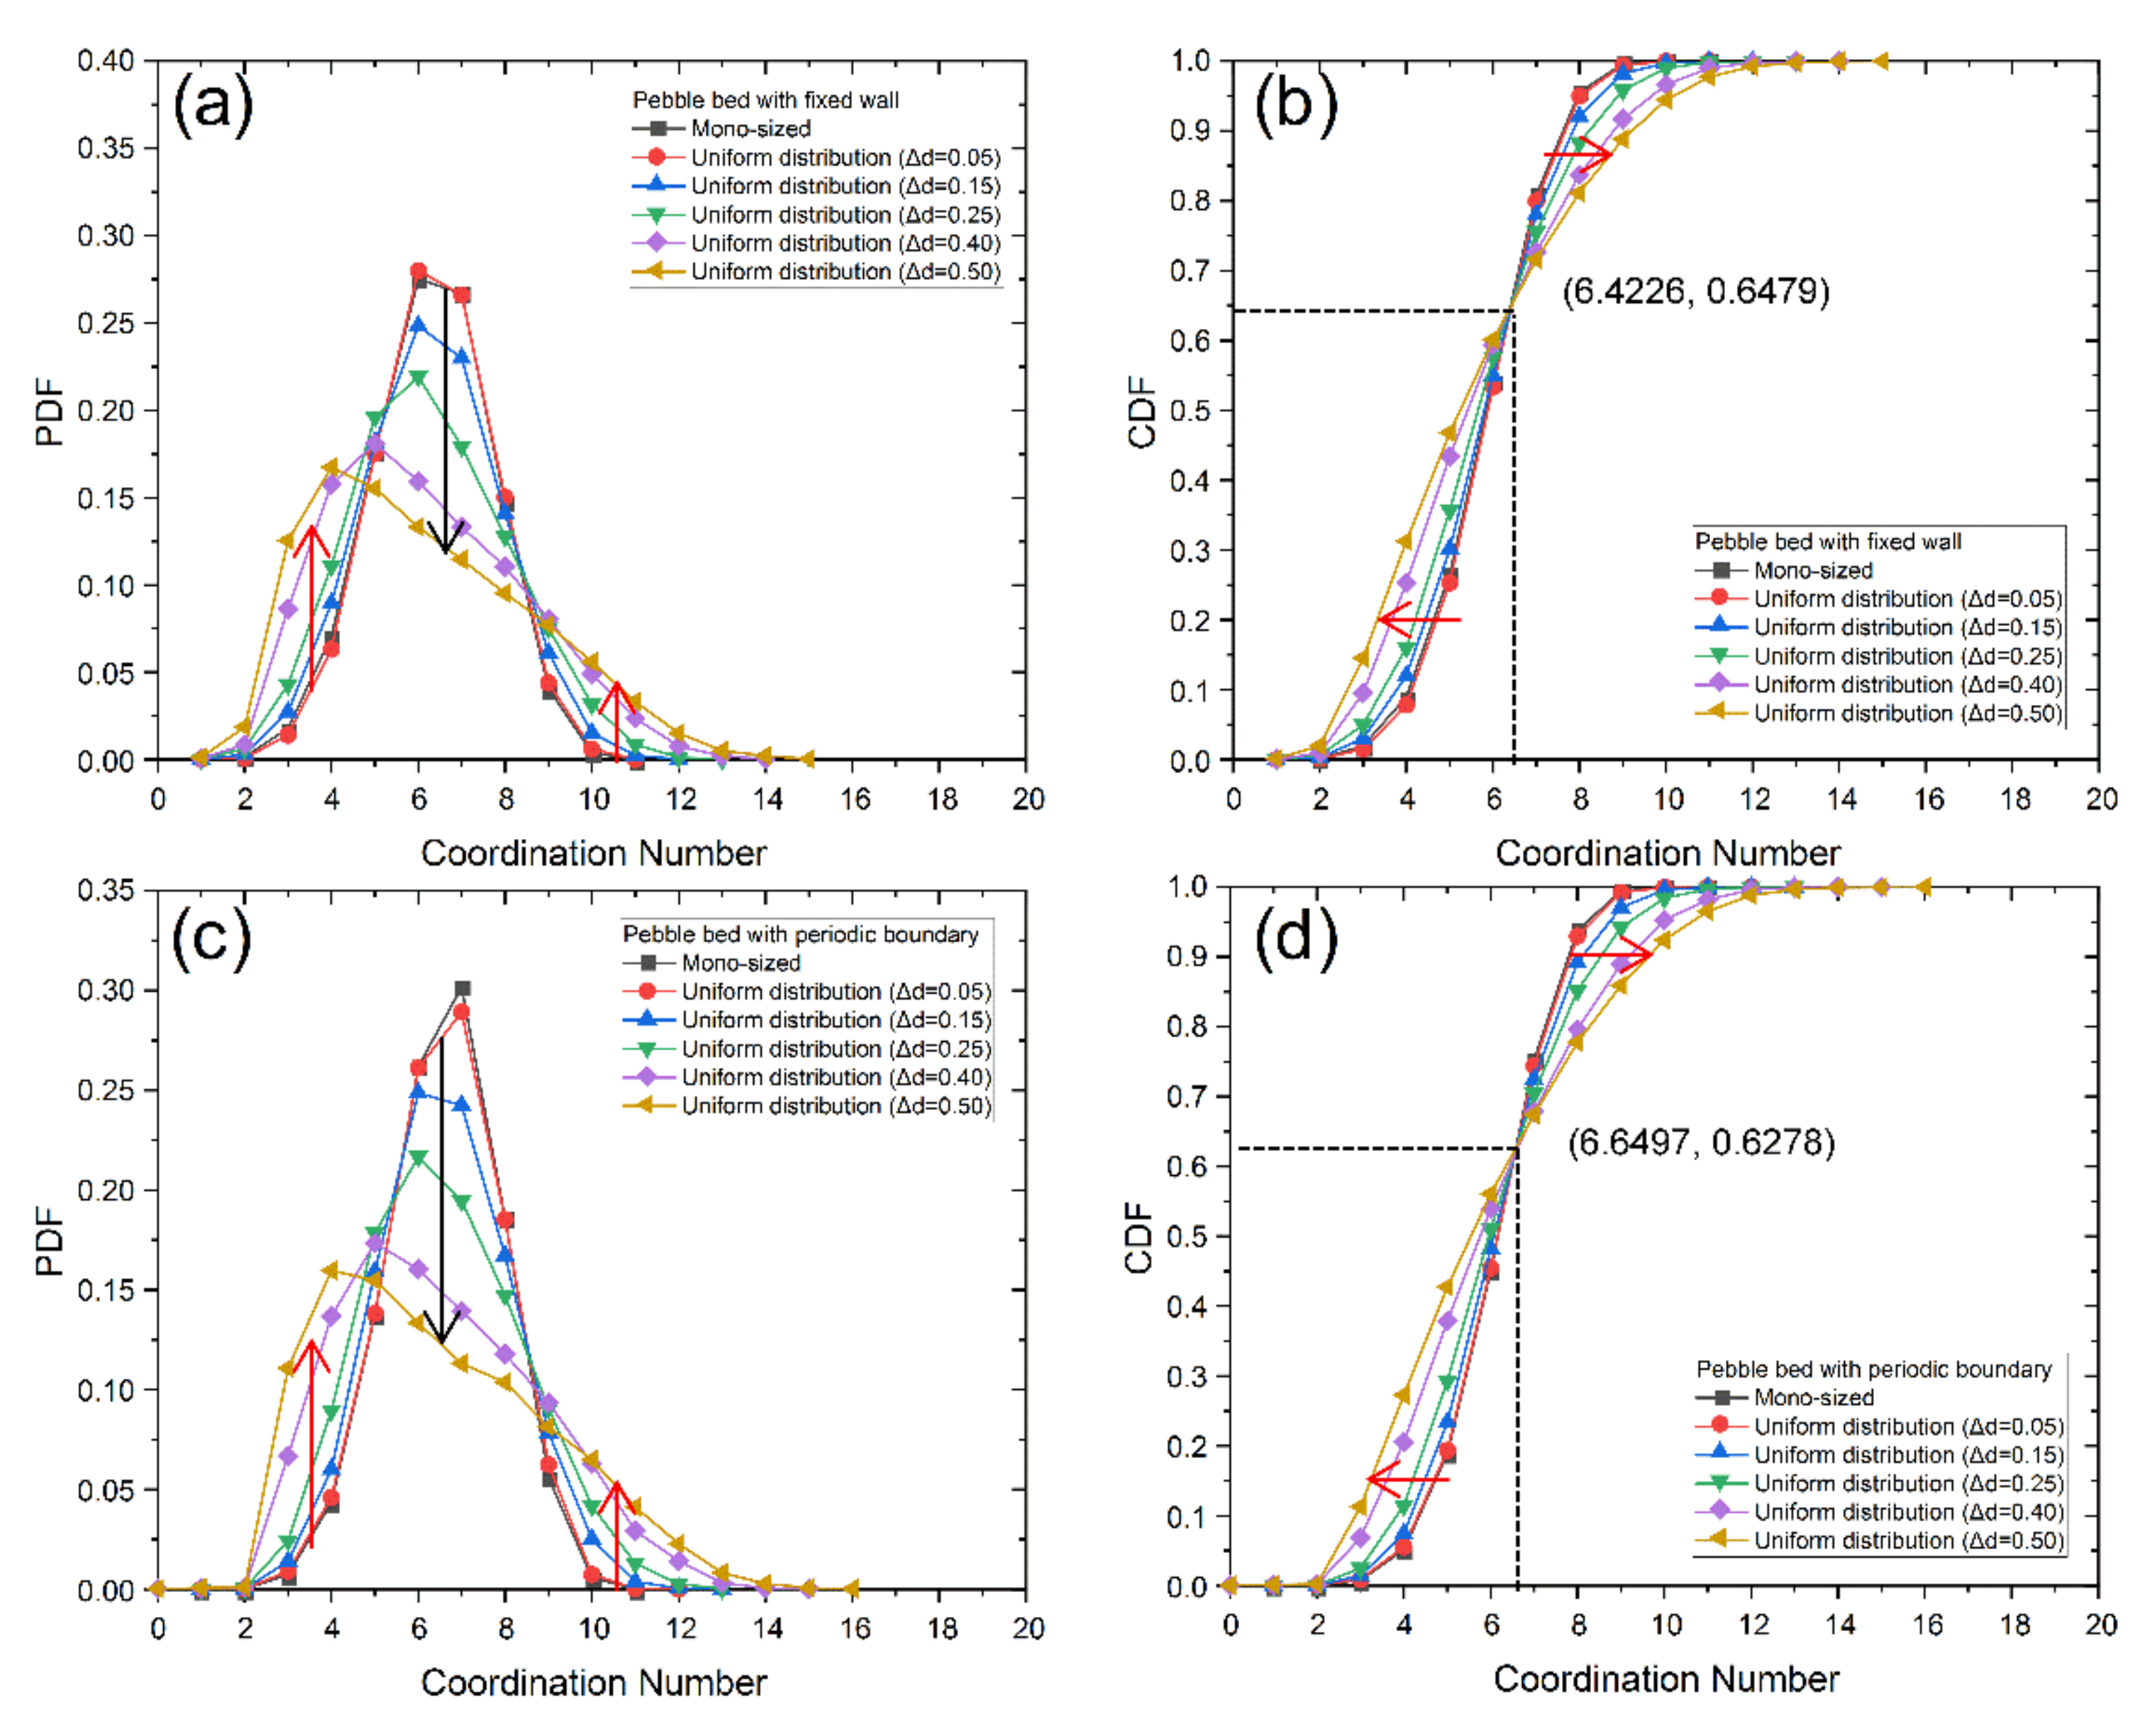
3.3.2. Coordination Number Distribution

In the pebble bed with uniform pebble size distribution, the average coordination number of the pebble bed changes with the pebble size difference, Δd, as shown in Figure 13. It can be seen from the figure that as the Δd increases, the average coordination number of the pebble bed gradually decreases, while the standard deviation of the coordination number gradually increases. This is due to the fact that the pebble size becomes more and more dispersed with the increase of the Δd. A small number of large pebbles are in contact with many surrounding small pebbles. Owing to the influence of a similar “convex wall effects”, the surrounding small pebbles has a lower coordination number, which results in a decrease in the average coordination number and an increase of the standard deviation of the coordination number as the Δd increases.
In further, it can be seen from Figure 13b that with the increase of the Δd, the maximum coordination number in the pebble bed gradually increases. When the Δd is 0, the maximum coordination number is 11, and when the Δd increases to 0.5, the maximum coordination number of the pebble bed has increased to 15 and 16. It is due to the rapidly increase of the number of small pebbles in contact with the central large pebbles with the increase of pebble size. In addition, it can be seen from the Figure 13 that the average coordination number of the pebble bed with periodic boundary is about 0.3 higher than that of the fixed wall pebble bed, which is also due to the influence of the wall effect. The pebbles in contact with the wall have a lower coordination number.
The PDF and the CDF of the coordination number in the pebble size uniform distribution pebble bed is shown in Figure 14. It can be seen from the distribution that as the particle size difference increases, the coordination number with the highest probability gradually decreases in the pebble size uniform distributed pebble bed. When the Δd is very small (such as 0.05), the maximum probability coordination number for periodic pebble beds is 7 and for fixed-wall pebble beds is 6. The probability distribution of the coordination number is consistent with that of the mono-sized pebble bed due to the pebble size is distributed in a very narrow range. When the Δd increases to 0.15 and 0.25, the coordination number with the maximum probability is 6. As the Δd increases, the highest probability coordination number further decreases to 5 when the Δd is 0.4. There is a similar trend of the probability distribution of coordination number in both the fixed wall pebble bed and the periodic boundary pebble bed. This is mainly attributed to that the influence of the wall effect in the pebble bed gradually decreases with the increase of the Δd, Small, consistent with the change of porosity inside the pebble bed, which corresponds to the variation of the porosity in the pebble size uniform distributed pebble bed.
In addition, the CDF of coordination number shows a similar trend in pebble bed, compared to that of the pebble size normal distributed pebble bed. A turning point exist in the cumulative distribution curve of the coordination number. With the Δd increases, the cumulative probability curves shift to the left when the coordination number is less than 6.4226 for the fixed wall pebble bed and 6.6497 for the periodic boundary bed, while when the coordination number is greater than turning point, the cumulative distribution profile is shifting to the right, which reveal that with the increase of the Δd, the proportion of the pebbles with lower coordination number gradually increase in the poly-disperse pebble bed.

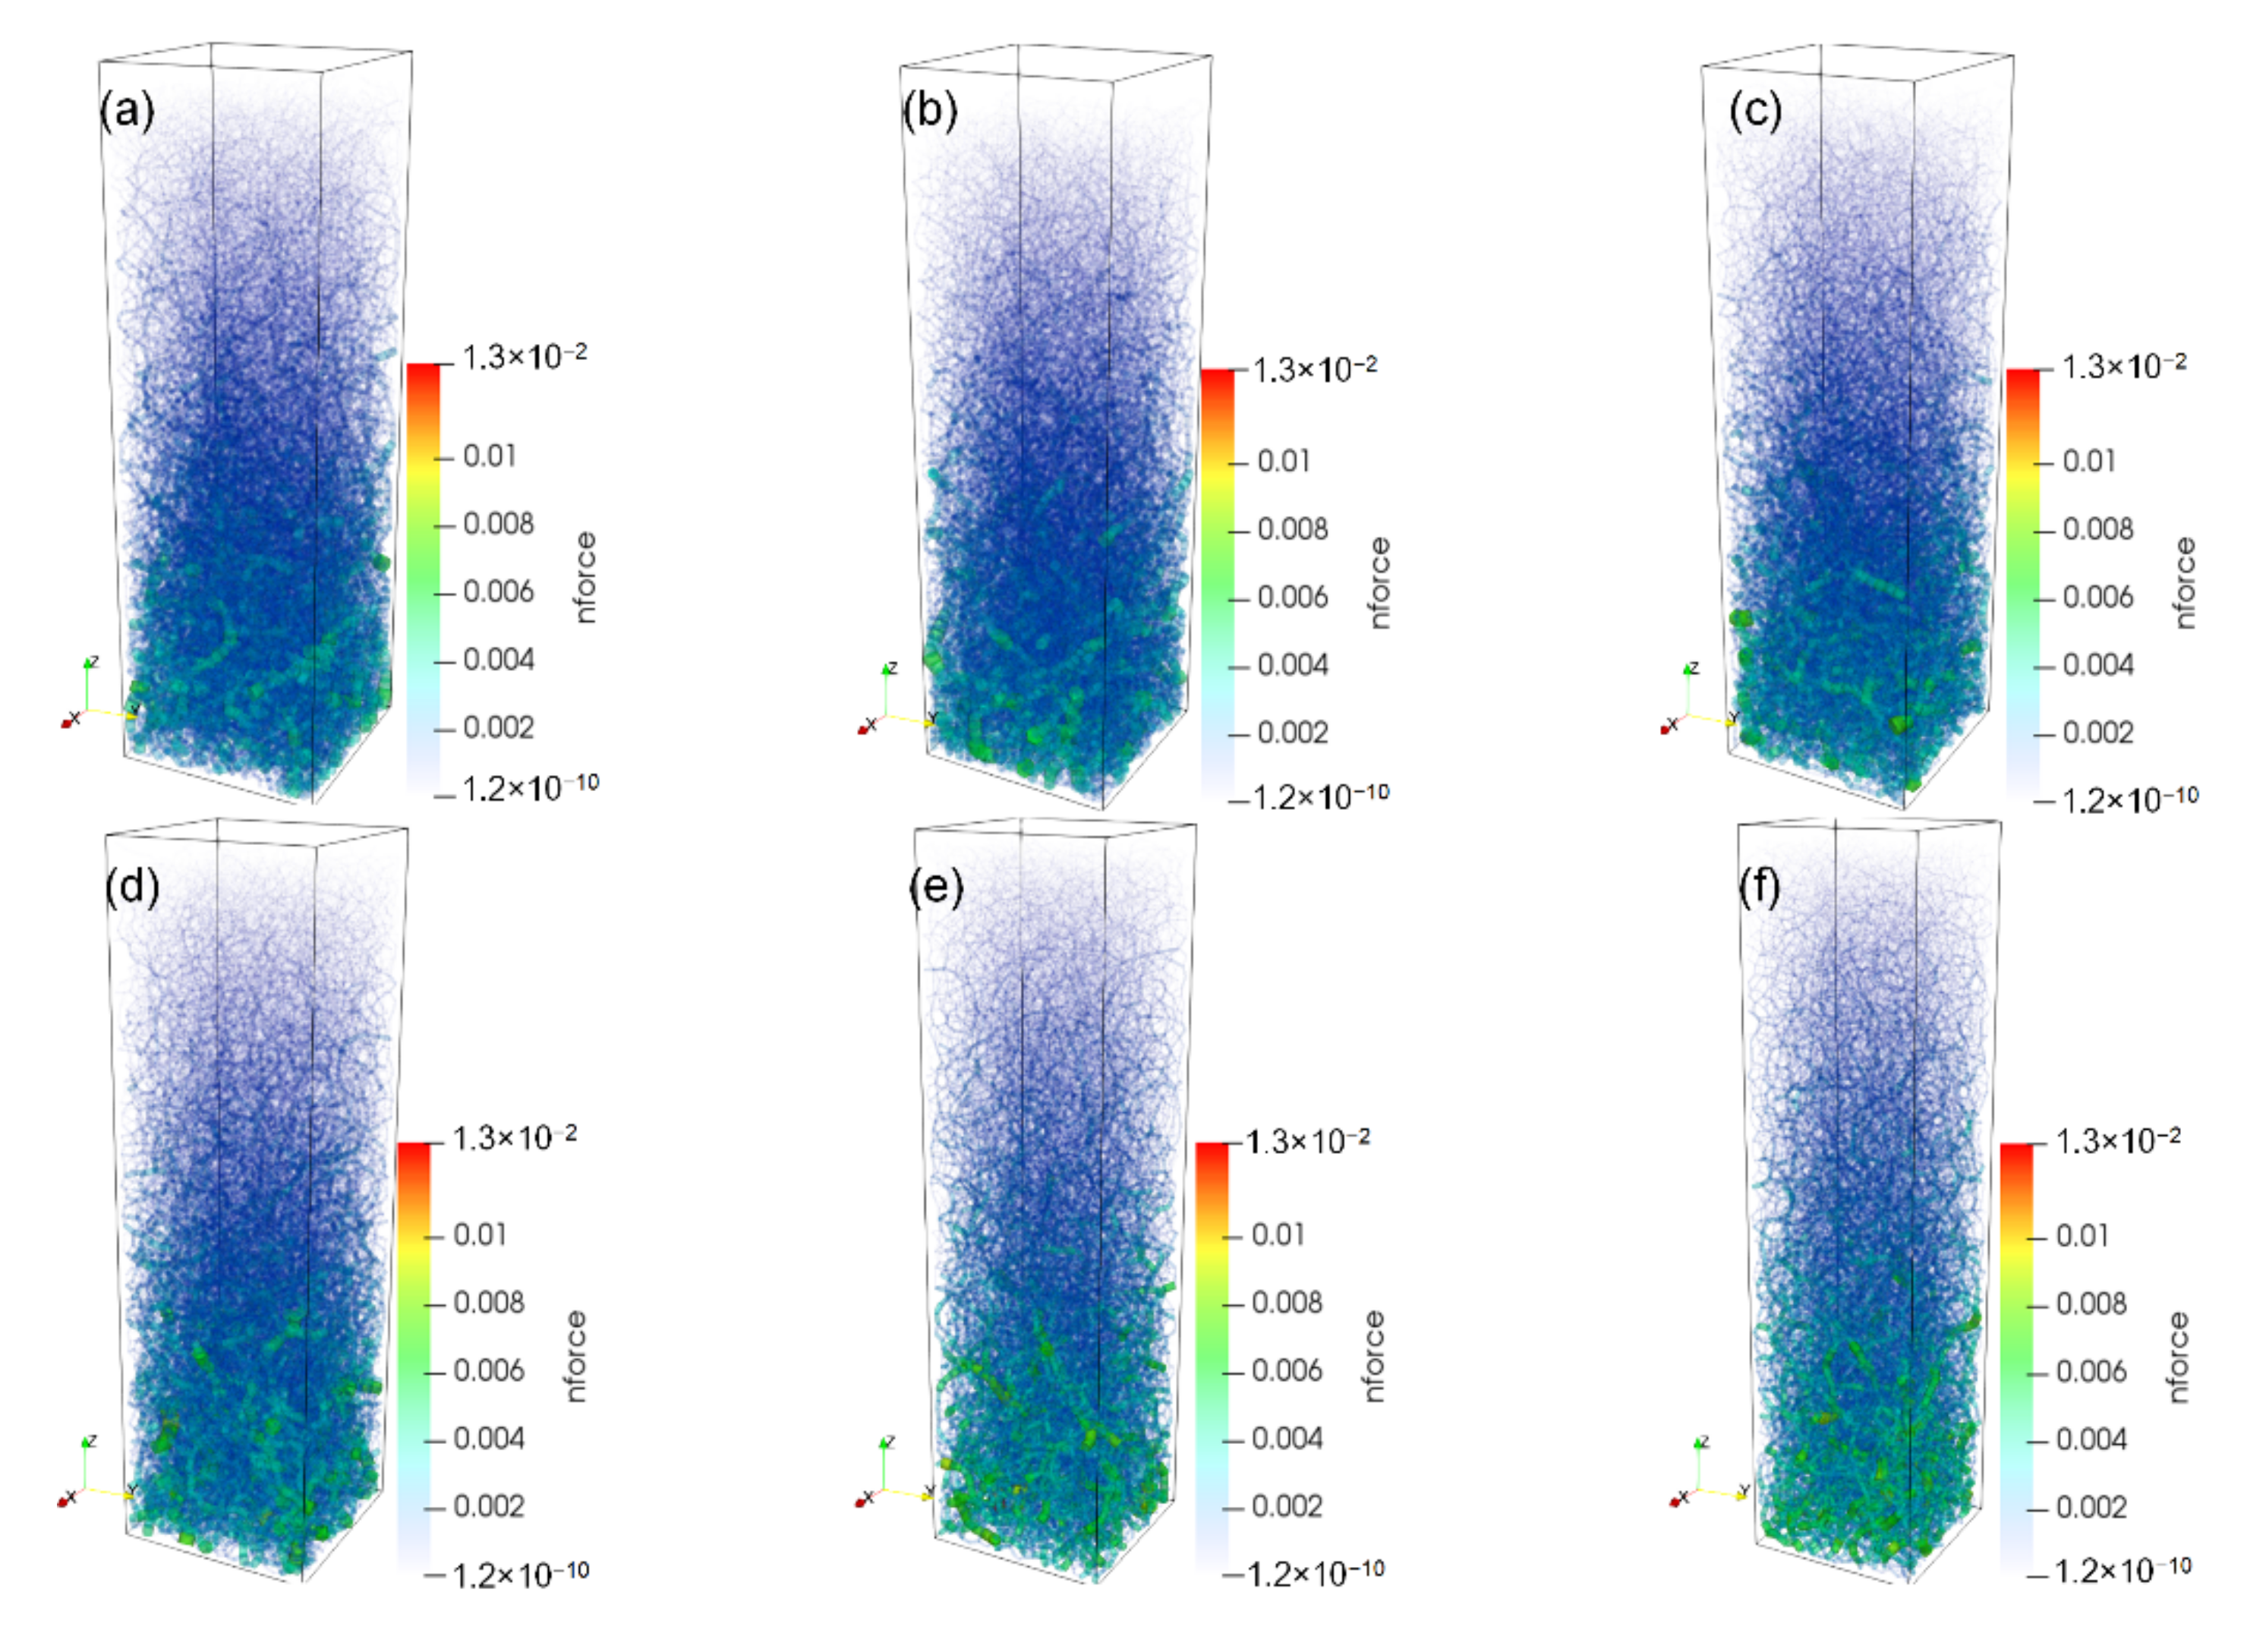
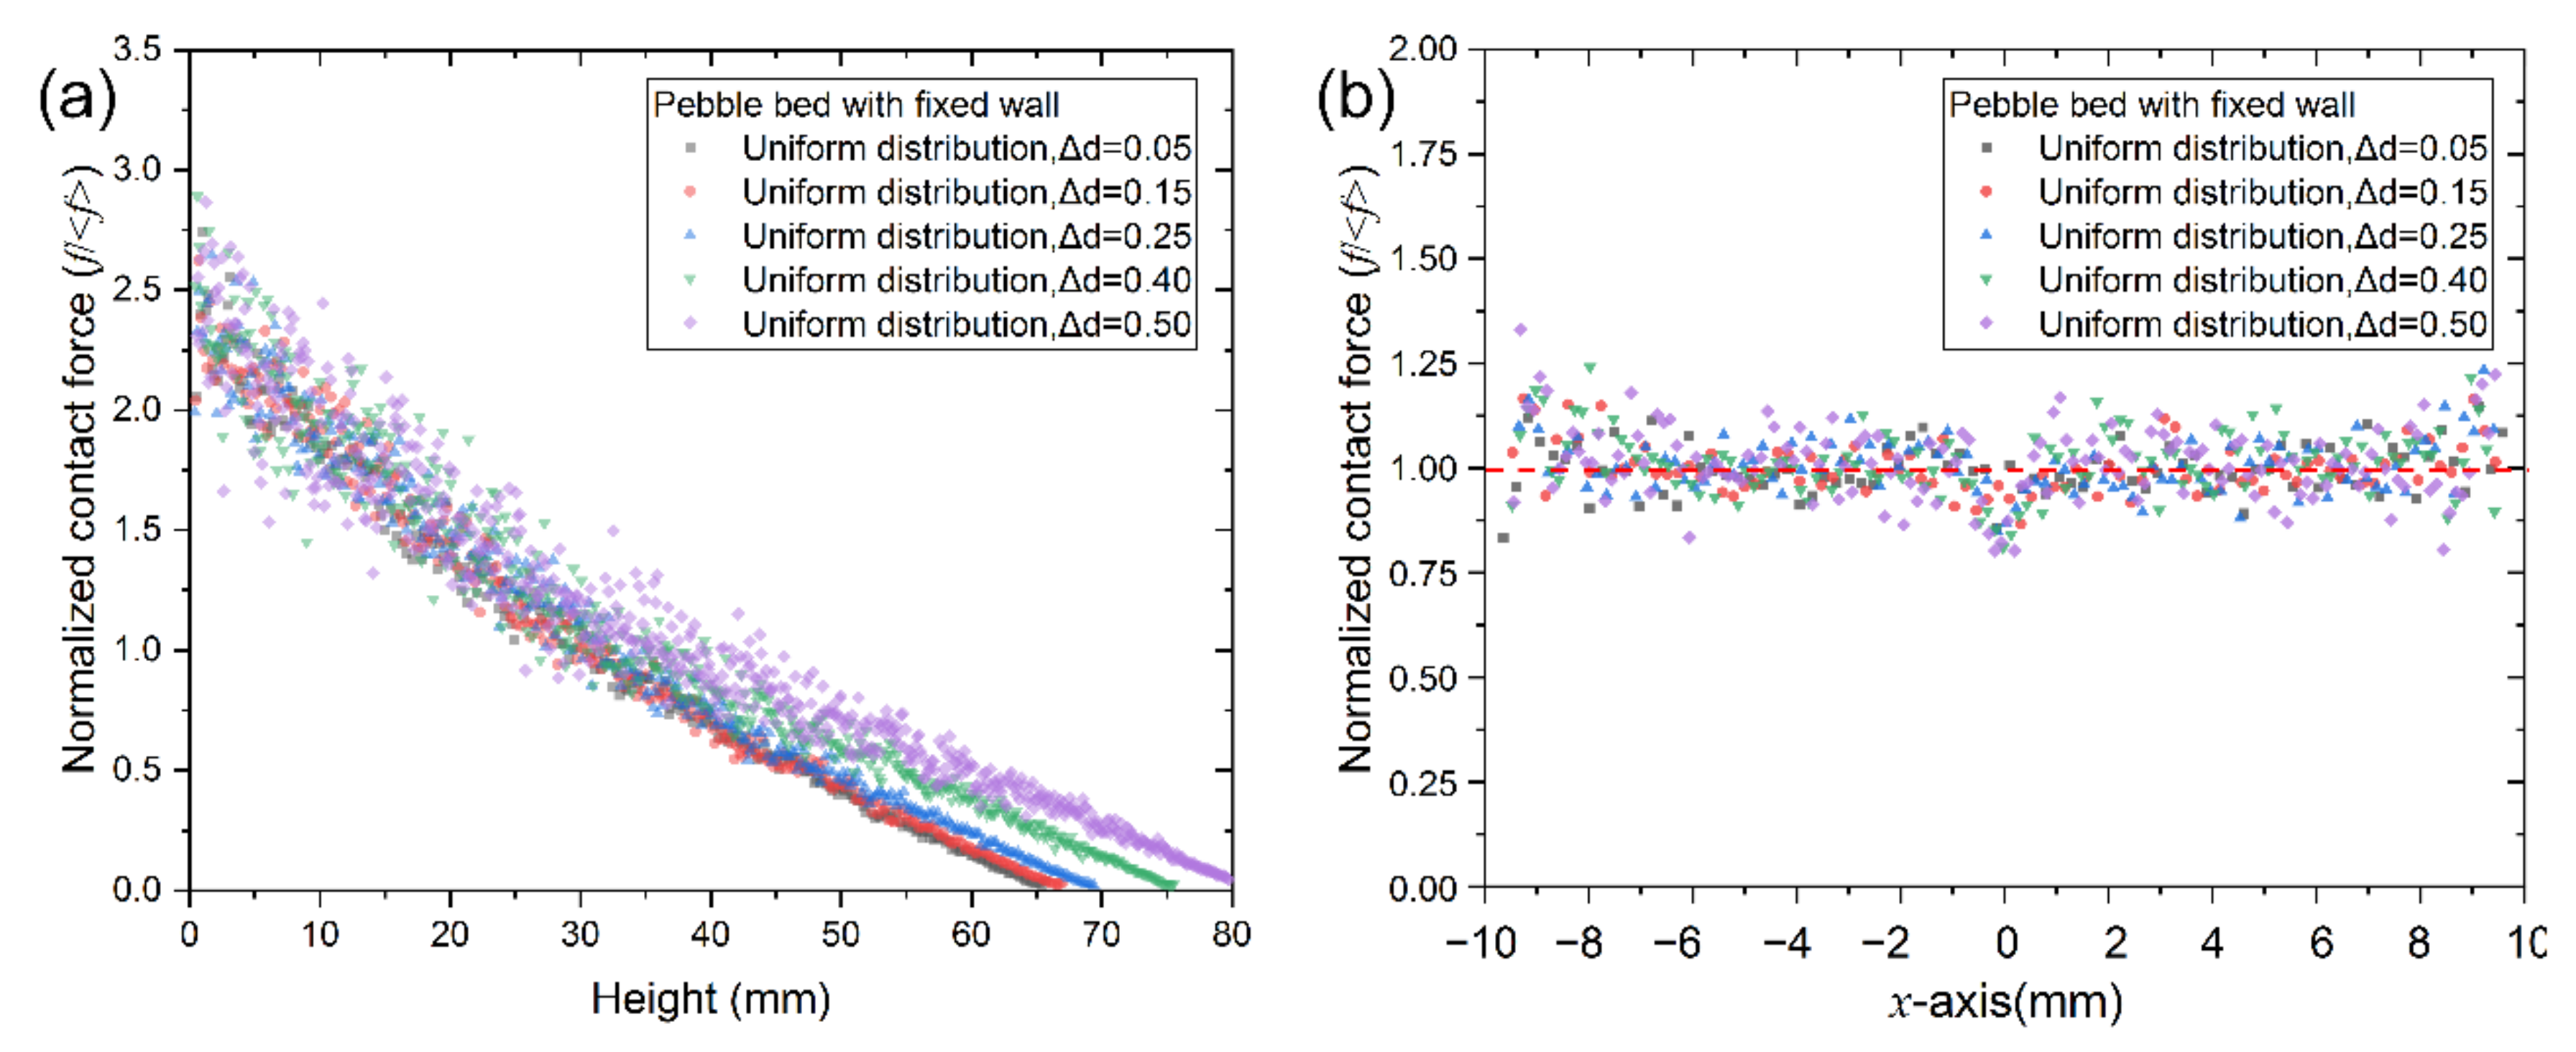
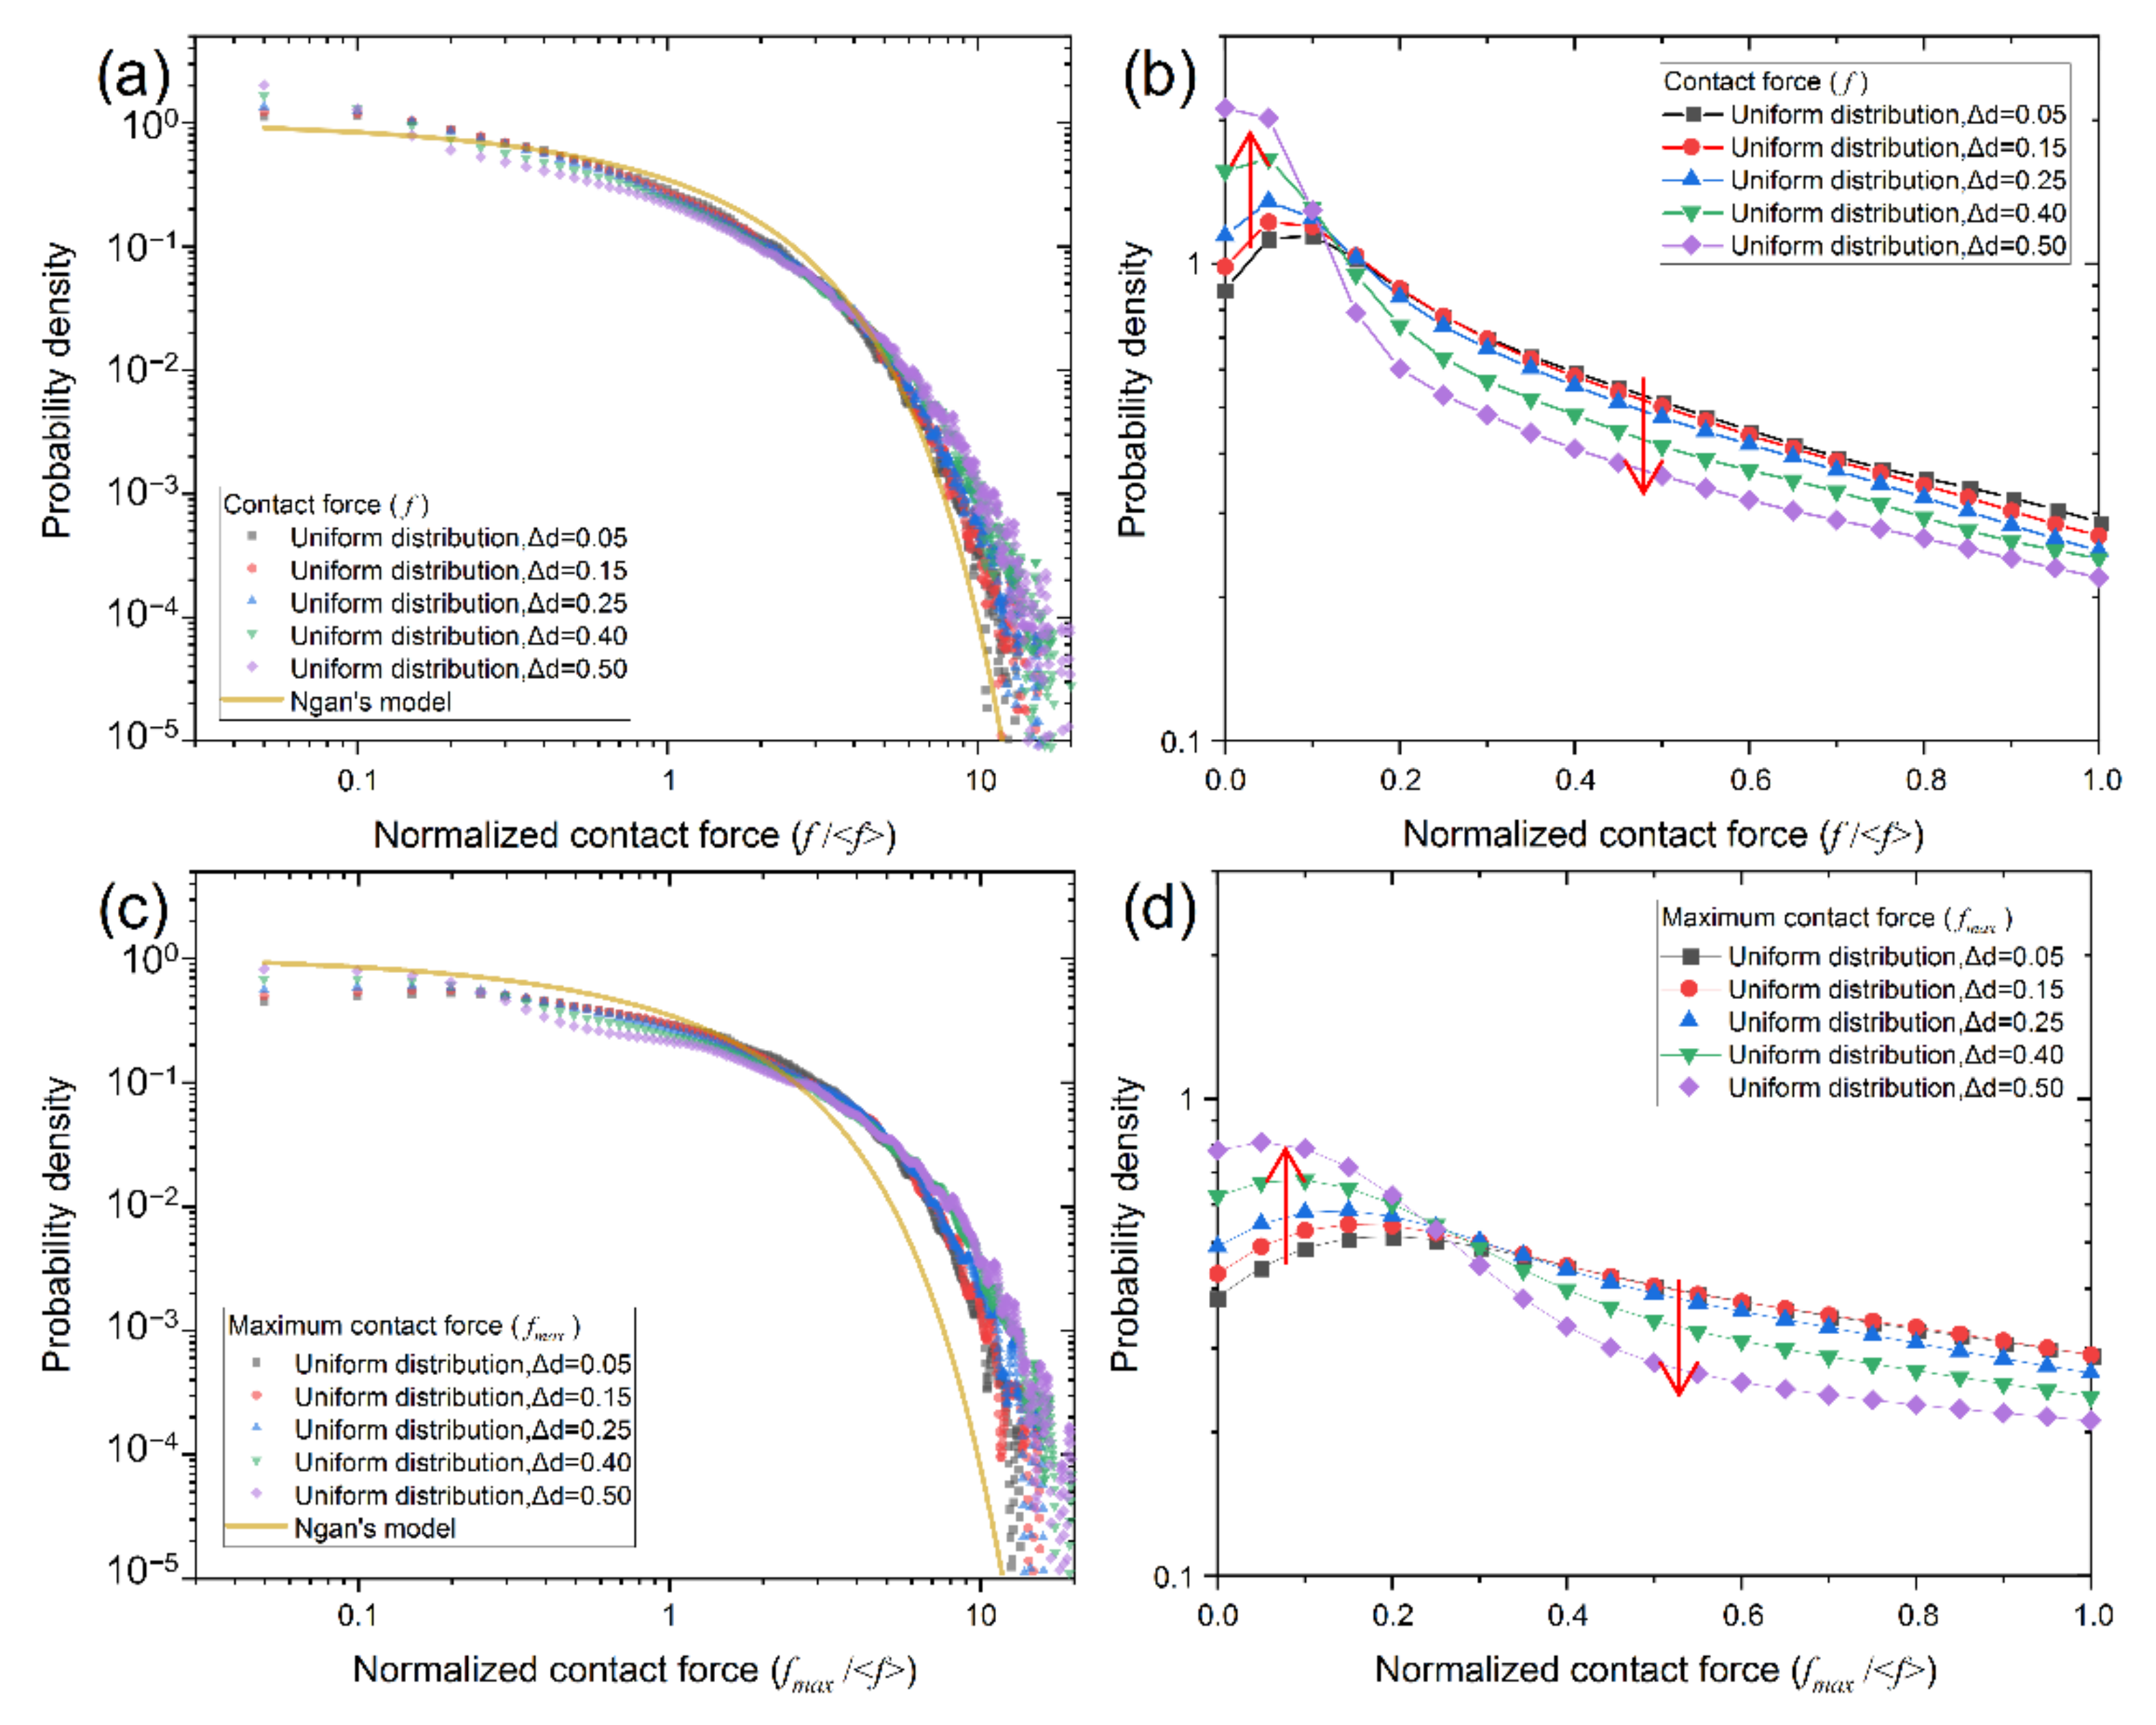
3.3.3. Contact Force Distribution

Figure 15 shows the force chain network in the poly-disperse pebble bed with uniformly distributed pebble size. To clearly show the strong contact force inside the pebble bed, the most of the weak contact forces have been made transparent, as shown in Figure 15. It can be seen from the figure that due to the influence of gravity effect, in the poly-disperse pebble bed with different particle size distribution, the magnitude of the force chain gradually decreases with the increase in local height. The strong contact force chain is mainly distributed in the lower part of the pebble bed, which is consistent with the variation of the local average contact force along the height, as shown in Figure 16a. While the weak contact force is distributed throughout the poly-disperse pebble bed. In further, the normalized average contact force in the bed with different particle size distribution and different bed height is always between 2 and 2.75 in the region near the bottom wall of the pebble bed, which is also owing to the friction interactions between pebbles and between pebble and side walls carry part of the pebble gravity in the poly-disperse pebble bed with uniformly distributed pebble size. In addition, the local average contact force is evenly distributed as shown in Figure 16b owing to the isotropic packing structures along the horizontal direction.
The probability density distribution of contact force in the pebble bed with uniform particle size distribution is shown in Figure 17. The results show that the probability density of weak contact force below the average contact force is the largest, and weak force account for the majority of the pebble bed. With the increase of the contact force, the probability density of the contact force drops rapidly. If we enlarge the distribution profile when the normalized contact force is less than 1, the probability density distribution of weak contact force can be obtained as shown in Figure 17b. It can be found that the probability density of weak contact force increases first and then decreases. In further, the pebble size distribution has an influence on the probability density distribution of weak contact force. When the normalized contact force is less than 0.1, the probability density is gradually rising with the Δd increases. While, the probability density reduces gradually with the increase of the Δd when the normalized contact force is greater than 0.1. A turning point occurs when the normalized contact force is equal to 0.1.
Figure 17c,d shows the probability density distributions of the maximum contact force of each pebble in the poly-disperse pebble bed with uniformly distributed pebble size, which is similar the probability density distribution of all contact force in the pebble size uniform distribution pebble bed. It can be seen that the maximum contact force of the majority of the pebbles is still less than the average contact force. In other word, all contact force of the majority of the pebbles is lower than the average contact force in the poly-disperse pebble bed. Only a few pebbles have a contact force greater than the average contact force, which might break when suffering external load.

4. Conclusions

In terms of the packing structure and the contact force distribution of the poly-disperse pebble bed with normally and uniformly distributed pebble size, respectively, a numerical simulation was conducted based on the DEM method to reveal the influence of the pebble size distribution on the packing structures and the contact force distribution. The results obtained in this work show that the pebble size distribution has a significant effect on the packing structure of the poly-disperse pebble bed. Compared with mono-sized pebble bed, smaller porosity and higher packing fraction can be obtained by the poly-disperse pebbles packing. The average porosity of the poly-disperse pebble bed gradually decreases with the increase of the pebble size dispersion in the poly-disperse pebble bed. In further, compared with the periodic boundary pebble bed, the fixed wall effect can be observed in the local porosity distribution. Close to a fixed wall, the local porosity distribution shows an obvious characteristic of damping and oscillating. The volume fraction of the fixed wall influenced region gradually decrease with the increase of the degree of pebble size dispersion in the poly-disperse pebble bed. The gravity and the pebble size distribution have a significant influence on the contact force distribution of the poly-disperse pebble bed, while the boundary conditions have a relatively small effect on the contact force distribution. In addition, the probability density of contact force decreases rapidly with the increase of the contact force in the poly-disperse pebble beds. the probability density of strong contact force gradually increases with the increase of the pebble size dispersion.

Author Contributions

B.G.: Methodology, Validation, Investigation, Data curation, Visualization, Writing-original draft, review & editing. H.C.: Validation, Visualization, Methodology, Data curation. Y.F.: Conceptualization, Methodology, Supervision, Writing—review & editing. X.L.: Conceptualization, Methodology. L.W.: Conceptualization, Methodology. X.W.: Conceptualization, Resources, Funding acquisition, Writing—review & editing. All authors have read and agreed to the published version of the manuscript.

Funding

This work was funded by the National Key Research and Development Program of China under Grant No. 2017YFE0300602, by the National Natural Science Foundation of China under Grant No. 11905047, and by Sichuan Province Science and Technology Program from the Department of Science & Technology of Sichuan Province of China under Grant No. 2018JZ0014.

Institutional Review Board Statement

Not applicable.

Informed Consent Statement

Not applicable.

Data Availability Statement

The data presented in this study are available on request from the corresponding author.

Acknowledgments

The simulation was supported by the HPC Platform, Southwestern Institute of Physics.

Conflicts of Interest

The authors declare no conflict of interest.

References

  1. Lu, J.; Chen, Y.; Ding, J.; Wei, X. High temperature energy storage performances of methane reforming with carbon dioxide in a tubular packed reactor. Appl. Energy 2016, 162, 1473–1482. [Google Scholar] [CrossRef]
  2. Yang, J.; Bu, S.; Dong, Q.; Wu, J.; Wang, Q. Experimental study of flow transitions in random packed beds with low tube to particle diam-eter ratios. Exp. Therm. Fluid Sci. 2015, 66, 117–126. [Google Scholar] [CrossRef]
  3. Wang, X.Y.; Feng, K.M.; Chen, Y.J.; Zhang, L.; Feng, Y.J.; Wu, X.H.; Liao, H.B.; Ye, X.F.; Zhao, F.C.; Cao, Q.X.; et al. Current design and R&D progress of the Chinese helium cooled ceramic breeder test blanket system. Nucl. Fusion 2019, 59, 076019. [Google Scholar]
  4. Chen, H.; Li, M.; Lv, Z.; Zhou, G.; Liu, Q.; Wang, S.; Wang, X.; Zheng, J.; Ye, M. Conceptual design and analysis of the helium cooled solid breeder blanket for CFETR. Fusion Eng. Des. 2015, 89–94. [Google Scholar] [CrossRef]
  5. Liu, S.; Pu, Y.; Cheng, X.; Li, J.; Peng, C.; Ma, X.; Chen, L. Conceptual design of a water cooled breeder blanket for CFETR. Fusion Eng. Des. 2014, 89, 1380–1385. [Google Scholar] [CrossRef]
  6. Chen, L.; Chen, Y.; Huang, K.; Liu, S. Investigation of effective thermal conductivity for pebble beds by one-way coupled CFD-DEM method for CFETR WCCB. Fusion Eng. Des. 2016, 106, 1–8. [Google Scholar] [CrossRef]
  7. Gong, B.; Feng, Y.; Liao, H.; Liu, Y.; Wang, X.; Feng, K. Discrete element modeling of pebble bed packing structures for HCCB TBM. Fusion Eng. Des. 2017, 121, 256–264. [Google Scholar] [CrossRef]
  8. Gong, B.; Feng, Y.; Liao, H.; Wu, X.; Wang, S.; Wang, X.; Feng, K. Numerical investigation of the pebble bed structures for HCCB TBM. Fusion Eng. Des. 2018, 136, 1444–1451. [Google Scholar] [CrossRef]
  9. Wu, M.; Gui, N.; Wu, H.; Yang, X.; Tu, J.; Jiang, S. Effects of density difference and loading ratio on pebble flow in a three-dimensional two-region-designed pebble bed. Ann. Nucl. Energy 2019, 133, 924–936. [Google Scholar] [CrossRef]
  10. Gui, N.; Huang, X.; Yang, X.; Tu, J.; Jiang, S. HTR-PM-based 3D pebble flow simulation on the effects of base angle, recirculation mode and coefficient of friction. Ann. Nucl. Energy 2020, 143, 107442. [Google Scholar] [CrossRef]
  11. Jiang, S.; Tu, J.; Yang, X.; Gui, N. A review of pebble flow study for pebble bed high temperature gas-cooled reactor. Exp. Comput. Multiph. Flow 2019, 1, 159–176. [Google Scholar] [CrossRef] [Green Version]
  12. Khane, V.; Taha, M.M.; Mueller, G.E.; Al-Dahhan, M. Discrete Element Method–Based Investigations of Granular Flow in a Pebble Bed Reactor. Nucl. Technol. 2017, 199, 47–66. [Google Scholar] [CrossRef]
  13. Lin, J.; Luo, K.; Wang, S.; Sun, L.; Fan, J. Particle-Scale Simulation of Solid Mixing Characteristics of Binary Particles in a Bubbling Fluidized Bed. Energies 2020, 13, 4442. [Google Scholar] [CrossRef]
  14. Hofer, G.; Märzinger, T.; Eder, C.; Pröll, F.; Pröll, T. Particle mixing in bubbling fluidized bed reactors with continuous particle exchange. Chem. Eng. Sci. 2019, 195, 585–597. [Google Scholar] [CrossRef]
  15. Mandal, D.; Sathiyamoorthy, D.; Vinjamur, M. Void fraction and effective thermal conductivity of binary particulate bed. Fusion Eng. Des. 2013, 88, 216–225. [Google Scholar] [CrossRef]
  16. Mandal, D.; Dabhade, P.; Kulkarni, N. Estimation of effective thermal conductivity of packed bed with internal heat generation. Fusion Eng. Des. 2020, 152, 111458. [Google Scholar] [CrossRef]
  17. Wongkham, J.; Wen, T.; Lu, B.; Cui, L.; Xu, J.; Liu, X. Particle-resolved simulation of randomly packed pebble beds with a novel fluid-solid coupling method. Fusion Eng. Des. 2020, 161, 111953. [Google Scholar] [CrossRef]
  18. Zhao, Z.; Feng, K.; Feng, Y. Theoretical calculation and analysis modeling for the effective thermal conductivity of Li4SiO4 pebble bed. Fusion Eng. Des. 2010, 85, 1975–1980. [Google Scholar] [CrossRef]
  19. Guo, Z.; Sun, Z.; Zhang, N.; Ding, M.; Zhou, Y. Influence of flow guiding conduit on pressure drop and convective heat transfer in packed beds. Int. J. Heat Mass Transf. 2019, 134, 489–502. [Google Scholar] [CrossRef]
  20. Tian, X.; Yang, J.; Guo, Z.; Wang, Q.; Sunden, B. Numerical Study of Heat Transfer in Gravity-Driven Particle Flow around Tubes with Different Shapes. Energies 2020, 13, 1961. [Google Scholar] [CrossRef]
  21. Sohn, D.; Lee, Y.; Ahn, M.-Y.; Park, Y.-H.; Cho, S. Numerical prediction of packing behavior and thermal conductivity of pebble beds according to pebble size distributions and friction coefficients. Fusion Eng. Des. 2018, 137, 182–190. [Google Scholar] [CrossRef]
  22. Panchal, M.; Chaudhuri, P.; Van Lew, J.; Ying, A. Numerical modelling for the effective thermal conductivity of lithium meta titanate pebble bed with different packing structures. Fusion Eng. Des. 2016, 112, 303–310. [Google Scholar] [CrossRef]
  23. Panchal, M.; Saraswat, A.; Chaudhuri, P. Experimental measurements of gas pressure drop of packed pebble beds. Fusion Eng. Des. 2020, 160, 111836. [Google Scholar] [CrossRef]
  24. Lee, Y.; Choi, D.; Hwang, S.-P.; Ahn, M.-Y.; Park, Y.-H.; Cho, S.; Sohn, D. Numerical investigation of purge gas flow through binary-sized pebble beds using discrete element method and computational fluid dynamics. Fusion Eng. Des. 2020, 158, 111704. [Google Scholar] [CrossRef]
  25. Choi, D.; Park, Y.-H.; Han, J.; Ahn, M.-Y.; Lee, Y.; Park, Y.-H.; Cho, S.; Sohn, D. A DEM-CFD study of the effects of size distributions and packing fractions of pebbles on purge gas flow through pebble beds. Fusion Eng. Des. 2019, 143, 24–34. [Google Scholar] [CrossRef]
  26. Abou-Sena, A.; Arbeiter, F.; Boccaccini, L.V.; Schlindwein, G. Measurements of the purge helium pressure drop across pebble beds packed with lithium orthosilicate and glass pebbles. Fusion Eng. Des. 2014, 89, 1459–1463. [Google Scholar] [CrossRef]
  27. Bale, S.; Tiwari, S.S.; Sathe, M.; Berrouk, A.S.; Nandakumar, K.; Joshi, J. Direct numerical simulation study of end effects and D/d ratio on mass transfer in packed beds. Int. J. Heat Mass Transf. 2018, 127, 234–244. [Google Scholar] [CrossRef]
  28. Abdulmohsin, R.S.; Al-Dahhan, M.H. Pressure Drop and Fluid Flow Characteristics in a Packed Pebble Bed Reactor. Nucl. Technol. 2017, 198, 17–25. [Google Scholar] [CrossRef]
  29. Iikawa, N.; Bandi, M.M.; Katsuragi, H. Force-chain evolution in a two-dimensional granular packing compacted by vertical tappings. Phys. Rev. E 2018, 97, 032901. [Google Scholar] [CrossRef] [Green Version]
  30. Akella, V.S.; Bandi, M.M.; Hentschel, H.G.E.; Procaccia, I.; Roy, S. Force distributions in frictional granular media. Phys. Rev. E 2018, 98, 012905. [Google Scholar] [CrossRef] [Green Version]
  31. Kruyt, N.P. On weak and strong contact force networks in granular materials. Int. J. Solids Struct. 2016, 135–140. [Google Scholar] [CrossRef]
  32. Desu, R.K.; Annabattula, R.K. Particle size effects on the contact force distribution in compacted polydisperse granular assemblies. Granul. Matter 2019, 21, 29. [Google Scholar] [CrossRef]
  33. Minh, N.H.; Cheng, Y.P.; Thornton, C. Strong force networks in granular mixtures. Granul. Matter 2014, 16, 69–78. [Google Scholar] [CrossRef]
  34. Ngan, A. On distribution of contact forces in random granular packings. Phys. A Stat. Mech. Appl. 2004, 339, 207–227. [Google Scholar] [CrossRef]
  35. Yang, Y.; Cheng, Y. A fractal model of contact force distribution and the unified coordination distribution for crushable granular materials under confined compression. Powder Technol. 2015, 279, 1–9. [Google Scholar] [CrossRef]
  36. Annabattula, R.K.; Gan, Y.; Kamlah, M. Mechanics of binary and polydisperse spherical pebble assembly. Fusion Eng. Des. 2012, 87, 853–858. [Google Scholar] [CrossRef]
  37. Desu, R.K.; Gan, Y.; Kamlah, M.; Annabattula, R.K. Mechanics of binary crushable granular assembly through discrete element method. Nucl. Mater. Energy 2016, 9, 237–241. [Google Scholar] [CrossRef] [Green Version]
  38. Wang, S.; Wang, S.; Xu, Q.; Chen, H. Crushed model and uniaxial compression analysis of random packed ceramic pebble bed by DEM. Fusion Eng. Des. 2018, 128, 53–57. [Google Scholar] [CrossRef]
  39. Gan, Y.; Kamlah, M.; Riesch-Oppermann, H.; Rolli, R.; Liu, P. Crush probability analysis of ceramic breeder pebble beds under mechanical stresses. J. Nucl. Mater. 2011, 417, 706–709. [Google Scholar] [CrossRef]
  40. Van Antwerpen, W.; du Toit, C.G.; Rousseau, P.G. A review of correlations to model the packing structure and effective ther-mal conductivity in packed beds of mono-sized spherical particles. Nucl. Eng. Des. 2010, 240, 1803–1818. [Google Scholar] [CrossRef]
  41. Mueller, G.E. A modified packed bed radial porosity correlation. Powder Technol. 2019, 342, 607–612. [Google Scholar] [CrossRef]
  42. Du Toit, C.G. Radial variation in porosity in annular packed beds. Nucl. Eng. Des. 2008, 238, 3073–3079. [Google Scholar] [CrossRef]
  43. De Klerk, A. Voidage Variation in Packed Beds at Small Column to Particle Diameter Ratio. AIChE J. 2003, 49, 2022–2029. [Google Scholar] [CrossRef]
  44. Wang, S.; Wang, S.; Chen, H. Numerical influence analysis of the packing structure on ceramic breeder pebble beds. Fusion Eng. Des. 2019, 140, 41–47. [Google Scholar] [CrossRef]
  45. Wang, X. Computational study of the elastic modulus of single size pebble beds for fusion applications. Fusion Eng. Des. 2016, 112, 486–491. [Google Scholar] [CrossRef]
  46. Calderoni, P.; Ying, A.; Sketchley, T.; Abdou, M.A. Experimental study of the interaction of ceramic breeder pebble beds with structural materials under thermo-mechanical loads. Fusion Eng. Des. 2006, 81, 607–612. [Google Scholar] [CrossRef]
  47. Zaccari, N.; Aquaro, D. Mechanical characterization of Li2TiO3 and Li4SiO4 pebble beds: Experimental determination of the material properties and of the pebble bed effective values. Fusion Eng. Des. 2007, 82, 2375–2382. [Google Scholar] [CrossRef]
  48. Pupeschi, S.; Knitter, R.; Kamlah, M.; Gan, Y. Numerical and experimental characterization of ceramic pebble beds under cycling mechanical loading. Fusion Eng. Des. 2016, 112, 162–168. [Google Scholar] [CrossRef]
  49. Pupeschi, S.; Moscardini, M.; Gan, Y.; Knitter, R.; Kamlah, M. Cyclic behavior of ceramic pebble beds under mechanical loading. Fusion Eng. Des. 2018, 134, 11–21. [Google Scholar] [CrossRef]
  50. Reimann, J.; Fretz, B.; Pupeschi, S. Thermo-mechanical screening tests to qualify beryllium pebble beds with non-spherical pebbles. Fusion Eng. Des. 2015, 1851–1854. [Google Scholar] [CrossRef] [Green Version]
  51. Zhang, C.; Ying, A.; Abdou, M.A.; Park, Y.-H. Ceramic breeder pebble bed packing stability under cyclic loads. Fusion Eng. Des. 2016, 109, 267–271. [Google Scholar] [CrossRef] [Green Version]
  52. Yu, A.; Standish, N. Porosity calculations of multi-component mixtures of spherical particles. Powder Technol. 1987, 52, 233–241. [Google Scholar] [CrossRef]
  53. Roquier, G. A Theoretical Packing Density Model (TPDM) for ordered and disordered packings. Powder Technol. 2019, 344, 343–362. [Google Scholar] [CrossRef]
  54. Kwan, A.; Wong, V.; Fung, W. A 3-parameter packing density model for angular rock aggregate particles. Powder Technol. 2015, 274, 154–162. [Google Scholar] [CrossRef]
  55. Chan, K.; Kwan, A. Evaluation of particle packing models by comparing with published test results. Particuology 2014, 16, 108–115. [Google Scholar] [CrossRef]
  56. Kloss, C.; Goniva, C.; Hager, A.; Amberger, S.; Pirker, S. Models, algorithms and validation for open-source DEM and CFD-DEM. Prog. Comput. Fluid Dyn. Int. J. 2012, 12, 140–152. [Google Scholar] [CrossRef]
  57. Liggghts(R)-Public Documentation, Version 3.X. Available online: http://www.liggghts.com (accessed on 1 October 2020).
  58. Liao, H.; Wang, X.; Yang, G.; Feng, Y.; Wang, P.; Feng, K. Recent progress of R&D activities on reduced activation ferritic/martensitic steel (CLF-1). Fusion Eng. Des. 2019, 147, 111235. [Google Scholar] [CrossRef]
  59. Reimann, J.; Pieritz, R.; Ferrero, C.; Di Michiel, M.; Rolli, R. X-ray tomography investigations on pebble bed structures. Fusion Eng. Des. 2008, 83, 1326–1330. [Google Scholar] [CrossRef]
  60. Reimann, J.; Pieritz, R.; Di Michiel, M.; Ferrero, C. Inner structures of compressed pebble beds determined by X-ray tomography. Fusion Eng. Des. 2005, 1049–1053. [Google Scholar] [CrossRef]
  61. Feng, Y.; Feng, K.; Cao, Q.; Zhang, J.; Hu, J. Current Status of the Fabrication of Li4SiO4 and Beryllium Pebbles for CN HCCB TBM in SWIP. Plasma Sci. Technol. 2013, 15, 291–294. [Google Scholar] [CrossRef]
  62. Feng, Y.; Feng, K.; Cao, Q.; Hu, J.; Tang, H. Fabrication and characterization of Li4SiO4 pebbles by melt spraying method. Fusion Eng. Des. 2012, 87, 753–756. [Google Scholar] [CrossRef]
Figure 1. Structures of mono-sized packed pebble bed: (a) 3D view, (b) local porosity distribution, (c,d) pebble center distribution bed with fixed wall and periodic boundary.
Energies 14 00449 g001
Figure 2. Coordination number distribution of mono-sized pebble bed: (a) probability distribution, (b) cumulative distribution function.
Energies 14 00449 g002
Figure 3. Contact force distribution of mono-sized pebble bed: (a) 3D view of contact force chains, (b) contact force distribution along local height, (c,d) probability density distribution of all contact force and the maximum contact force of each pebble.
Energies 14 00449 g003
Figure 4. Average porosity of the poly-disperse pebble bed with normally distributed pebble size.
Energies 14 00449 g004
Figure 5. Local porosity distribution in the poly-disperse pebble bed with normally distributed pebble size: (a) σ = 0, mono-sized pebble bed, (b) σ = 0.04, (c) σ = 0.1, (d) σ = 0.16, (e) σ = 0.25, (f) σ = 0.3.
Energies 14 00449 g005
Figure 6. Coordination number of the poly-disperse pebble bed with normally distributed pebble size: (a) average coordination number, (b) maximum coordination number.
Energies 14 00449 g006
Figure 7. Coordination number distribution of the poly-disperse pebble bed with normally distributed pebble size: (a,c) PDF in bed with fixed wall and periodic boundary, (b,d) CDF in bed with fixed wall and periodic boundary respectively.
Energies 14 00449 g007
Figure 8. Force chains of contact force in the poly-disperse pebble bed with normally distributed pebble size: (a) σ = 0, (b) σ = 0.04, (c) σ = 0.1, (d) σ = 0.16, (e) σ = 0.25, (f) σ = 0.3.
Energies 14 00449 g008
Figure 9. Contact force distribution along (a) the height and (b) the horizontal of the bed with normally distributed pebble size.
Energies 14 00449 g009
Figure 10. Probability density distribution of contact force in the poly-disperse pebble bed with normally distributed pebble size: (a,b) all contact force, (c,d) maximum contact force of each pebble.
Energies 14 00449 g010
Figure 11. Average porosity of the poly-disperse pebble bed with uniformly distributed pebble size.
Energies 14 00449 g011
Figure 12. Local porosity distribution in the poly-disperse pebble bed with uniform distributed pebble size: (a) Δd = 0, (b) Δd = 0.05, (c) Δd = 0.15, (d) Δd = 0.25, (e) Δd = 0.4, (f) Δd = 0.5.
Energies 14 00449 g012
Figure 13. Coordination number of the pebble bed with uniformly distributed pebble size: (a) average coordination number, (b) maximum coordination number.
Energies 14 00449 g013
Figure 14. Coordination number distribution in pebble bed with uniformly distributed pebble size: (a,c) PDF in bed with fixed wall and periodic boundary, (b,d) CDF in bed with fixed wall and periodic boundary respectively.
Energies 14 00449 g014
Figure 15. Force chain in the poly-disperse pebble bed with uniformly distributed pebble size: (a) Δd = 0, mono-sized pebble bed, (b) Δd = 0.05, (c) Δd = 0.15, (d) Δd = 0.25, (e) Δd = 0.4, (f) Δd = 0.5.
Energies 14 00449 g015
Figure 16. Contact force distribution along (a) the height and (b) the horizontal of the bed with uniformly distributed pebble size.
Energies 14 00449 g016
Figure 17. Probability density distribution of the poly-disperse pebble bed with uniformly distributed pebble size: (a,b) all contact force, (c,d) maximum contact force of each pebble.
Energies 14 00449 g017
Table 1. Pebble size distribution used in the DEM simulation.
Pebble Size DistributionParameterValues
Mono-sizedd = davg1 mm
Normal distributiondavg1 mm
σ0–0.3 mm
Uniform distributiondavg1 mm
Δd0–0.5 mm
Number of pebblesN30,000
Average diameterdavg1 mm
Time-stepdt1 × 10−8 s
Table 2. Material parameters used in the DEM simulation.
ParametersLi4SiO4 Pebbles [7,8]Wall (CLF-1 Steel [58])
Young’s modulus90 GPa225 GPa
Poisson ratio0.240.33
Density2323 Kg/m37847 Kg/m3
Restitution coefficient0.90.9
Static friction coefficient0.10.1
Rolling friction coefficient0.0010.001
Publisher’s Note: MDPI stays neutral with regard to jurisdictional claims in published maps and institutional affiliations.

