1. Introduction
The transport sector in the European Union (EU) consumes one-third of the total primary energy and accounts for one-fifth of total EU Carbon Oxide emissions [
1,
2]. The combustion of petroleum-based fuels powers most of today’s transport sector and is mainly responsible for the high pollution in this sector [
3]. The use of biofuels is considered a medium to a long-term alternative to petroleum-based fuels, which can reduce harmful emissions from the transport sector. Most of the biofuels used in the EU are mixed with conventional fuels in smaller ratios. Their usage is also promoted by the European Union, which predicts that, in 2020, 10% of petroleum-based fuels should be replaced by biofuels [
4]. The first generation of biofuels produced from rapeseed, cooking oil, animal fat, etc., represented the majority of biodiesel used in the EU in 2016 [
5]. In the recent decade, a lot of research work was done on second-generation biofuels, which are compared to first-generation biofuels produced from non-edible biomass sources [
6]. Much investigation has also focused on the development of synthetic fuels [
7]. Their usage in compression ignition engines can also contribute to emission reduction in the transport sector [
8] and increase the combustion efficiency [
9].
The efficiency of combustion in modern diesel engines depends heavily on the fuel injection parameters, the fuel atomization process, the fuel properties and other related parameters. In order to improve those processes, injection pressure in modern compression ignition engines was increased to 2000–2500 bar, and multiple injection processes per cycle are being used [
10,
11,
12]. These strategies resulted in an increased number of injection holes with a smaller diameter, which, combined with high injection pressure, can create flow conditions that promote cavitation formation. The cavitation can have a negative effect on fuel injector parts since it induces cavitation erosion. Nevertheless, it can be beneficial for the fuel spray atomization process [
13,
14,
15,
16].
In recent decades, numerical models have undergone great development. Using modern, numerical programs, experimental testing can be replaced with numerical experiments in several research and engineering fields [
17].
The influence of fuel properties and engine operating conditions on in-nozzle cavitation and the spray break-up processes can be studied experimentally and/or numerically. Due to its tiny dimensions, experimental observations of flow characteristics inside the injector nozzle are usually performed using large scale optical nozzle models. These models allow easier observation, but the results can differ from real-sized injector nozzles [
18,
19]. In these studies, the similarity flow in real size and scale-up nozzles is usually achieved based on dynamic flow similarity based simultaneous on the Reynolds and cavitation number. The problem in large scale models is with cavitation phenomena at the microscale of cavitation bubble dynamics (bubble formation and development). Since this effect is related to the number of cavitation bubbles which further coalesce and form the cavitation structures (clouds), it is dependent on nozzle size and can differ in real size nozzles and large scale nozzles (models). The X-ray phase-contrast imaging technique and X-ray tracer imaging methods can be used to monitor real conditions during the injection process using petroleum-based fuels [
20]. All the presented experimental methods are appropriate for monitoring flow conditions and cavitation inside the injector nozzle, but they are usually related to high costs of experimental equipment and long measurement procedures in the case of studying several fuels and operating regimes.
These disadvantages can be overcome by the use of 3D numerical simulations, which are performed using Computational Fluid Dynamic (CFD) programs like ANSYS CFX, ANSYS FLUENT, OpenFOAM, AVL FIRE, etc. Similar to X-ray imaging methods, these programs allow us to determine fuel flow conditions like velocity, cavitation inception, etc., in a non-intrusive way. When using numerical simulation, RANS, LES, or DNS approaches can be used [
21]. Simulations can be performed at fixed or transient needle positions. Since the injection times are very short, the transient needle movement and transient conditions inside the injector are dominant. Needle movement during the injection process should be considered in the simulations to predict the transient conditions accurately. Numerical methods have been used and validated as a promising tool for studying flow conditions with cavitation inception in a fuel injector in several studies [
12,
13,
21,
22,
23,
24,
25].
Modern compression ignition engines are very complex systems. Before using a new fuel or biofuel as a substitute or as an additive to conventional fuels, extensive testing must be done in several research and development areas, since differences in fuel properties can influence fuel injection processes, fuel combustion processes, obtained engine characteristics, and emission formation [
26,
27]. The presented work focuses on the research area of fuel injection.
Several studies have also discussed the influence of fuel properties on the cavitation formation inside the injection nozzle and on the conditions at the injection hole outlet. Yu et al. [
28] numerically studied the influence of gasoline, diesel, wide distillation fuels, and kerosene on internal nozzle flow, spray formation, combustion, and emissions characteristic. The numerical studies of internal nozzle flow were made for one nozzle injection hole using the RANS approach at a constant needle position and different injection pressures. From the obtained results, they concluded that a lower fuel kinematic viscosity leads to higher values of Reynolds number, which causes higher turbulent kinetic energy and higher velocity of fuel flow. This correlation between lower viscosity and higher fuel velocity was also found in the study of Battistoni et al. [
23], where the influence of Soybean oil methyl ester biodiesel and diesel on inner nozzle flow and spray atomization was studied. Again, the RANS approach was used for studying the conditions inside the injector, but transient needle movement of Bosch CRI1 common-rail injector was considered. Torelli et al. [
29] used the RANS approach with the standard k-ε turbulence model and tested the behavior of two gasoline-like fuels, and n-Dodecane fuel in internal nozzle flow at constant injection pressure and transient needle lifts. They also concluded that lower viscosities promote higher fuel velocities. Higher fuel velocities lead to an increase in fuel mass flow rate inside the injector or at the injector outlet [
23,
28,
29,
30]. Rapid changes in fuel flow and high fuel velocities significantly influence pressure variations inside the injector. This can cause the immediate pressure to drop to almost 0 Pa, which lowers the impact of different fuels saturation pressures on cavitation formation [
23]. The amount of cavitation fraction also depends on the difference between injection and in-cylinder pressure [
28].
This brief literature review shows that no extensive studies were made about the influence of GTL fuel and its properties on conditions inside the injector. We also did not find any studies regarding the influence of in-cylinder back pressure on GTL fuel flow conditions and fuel atomization.
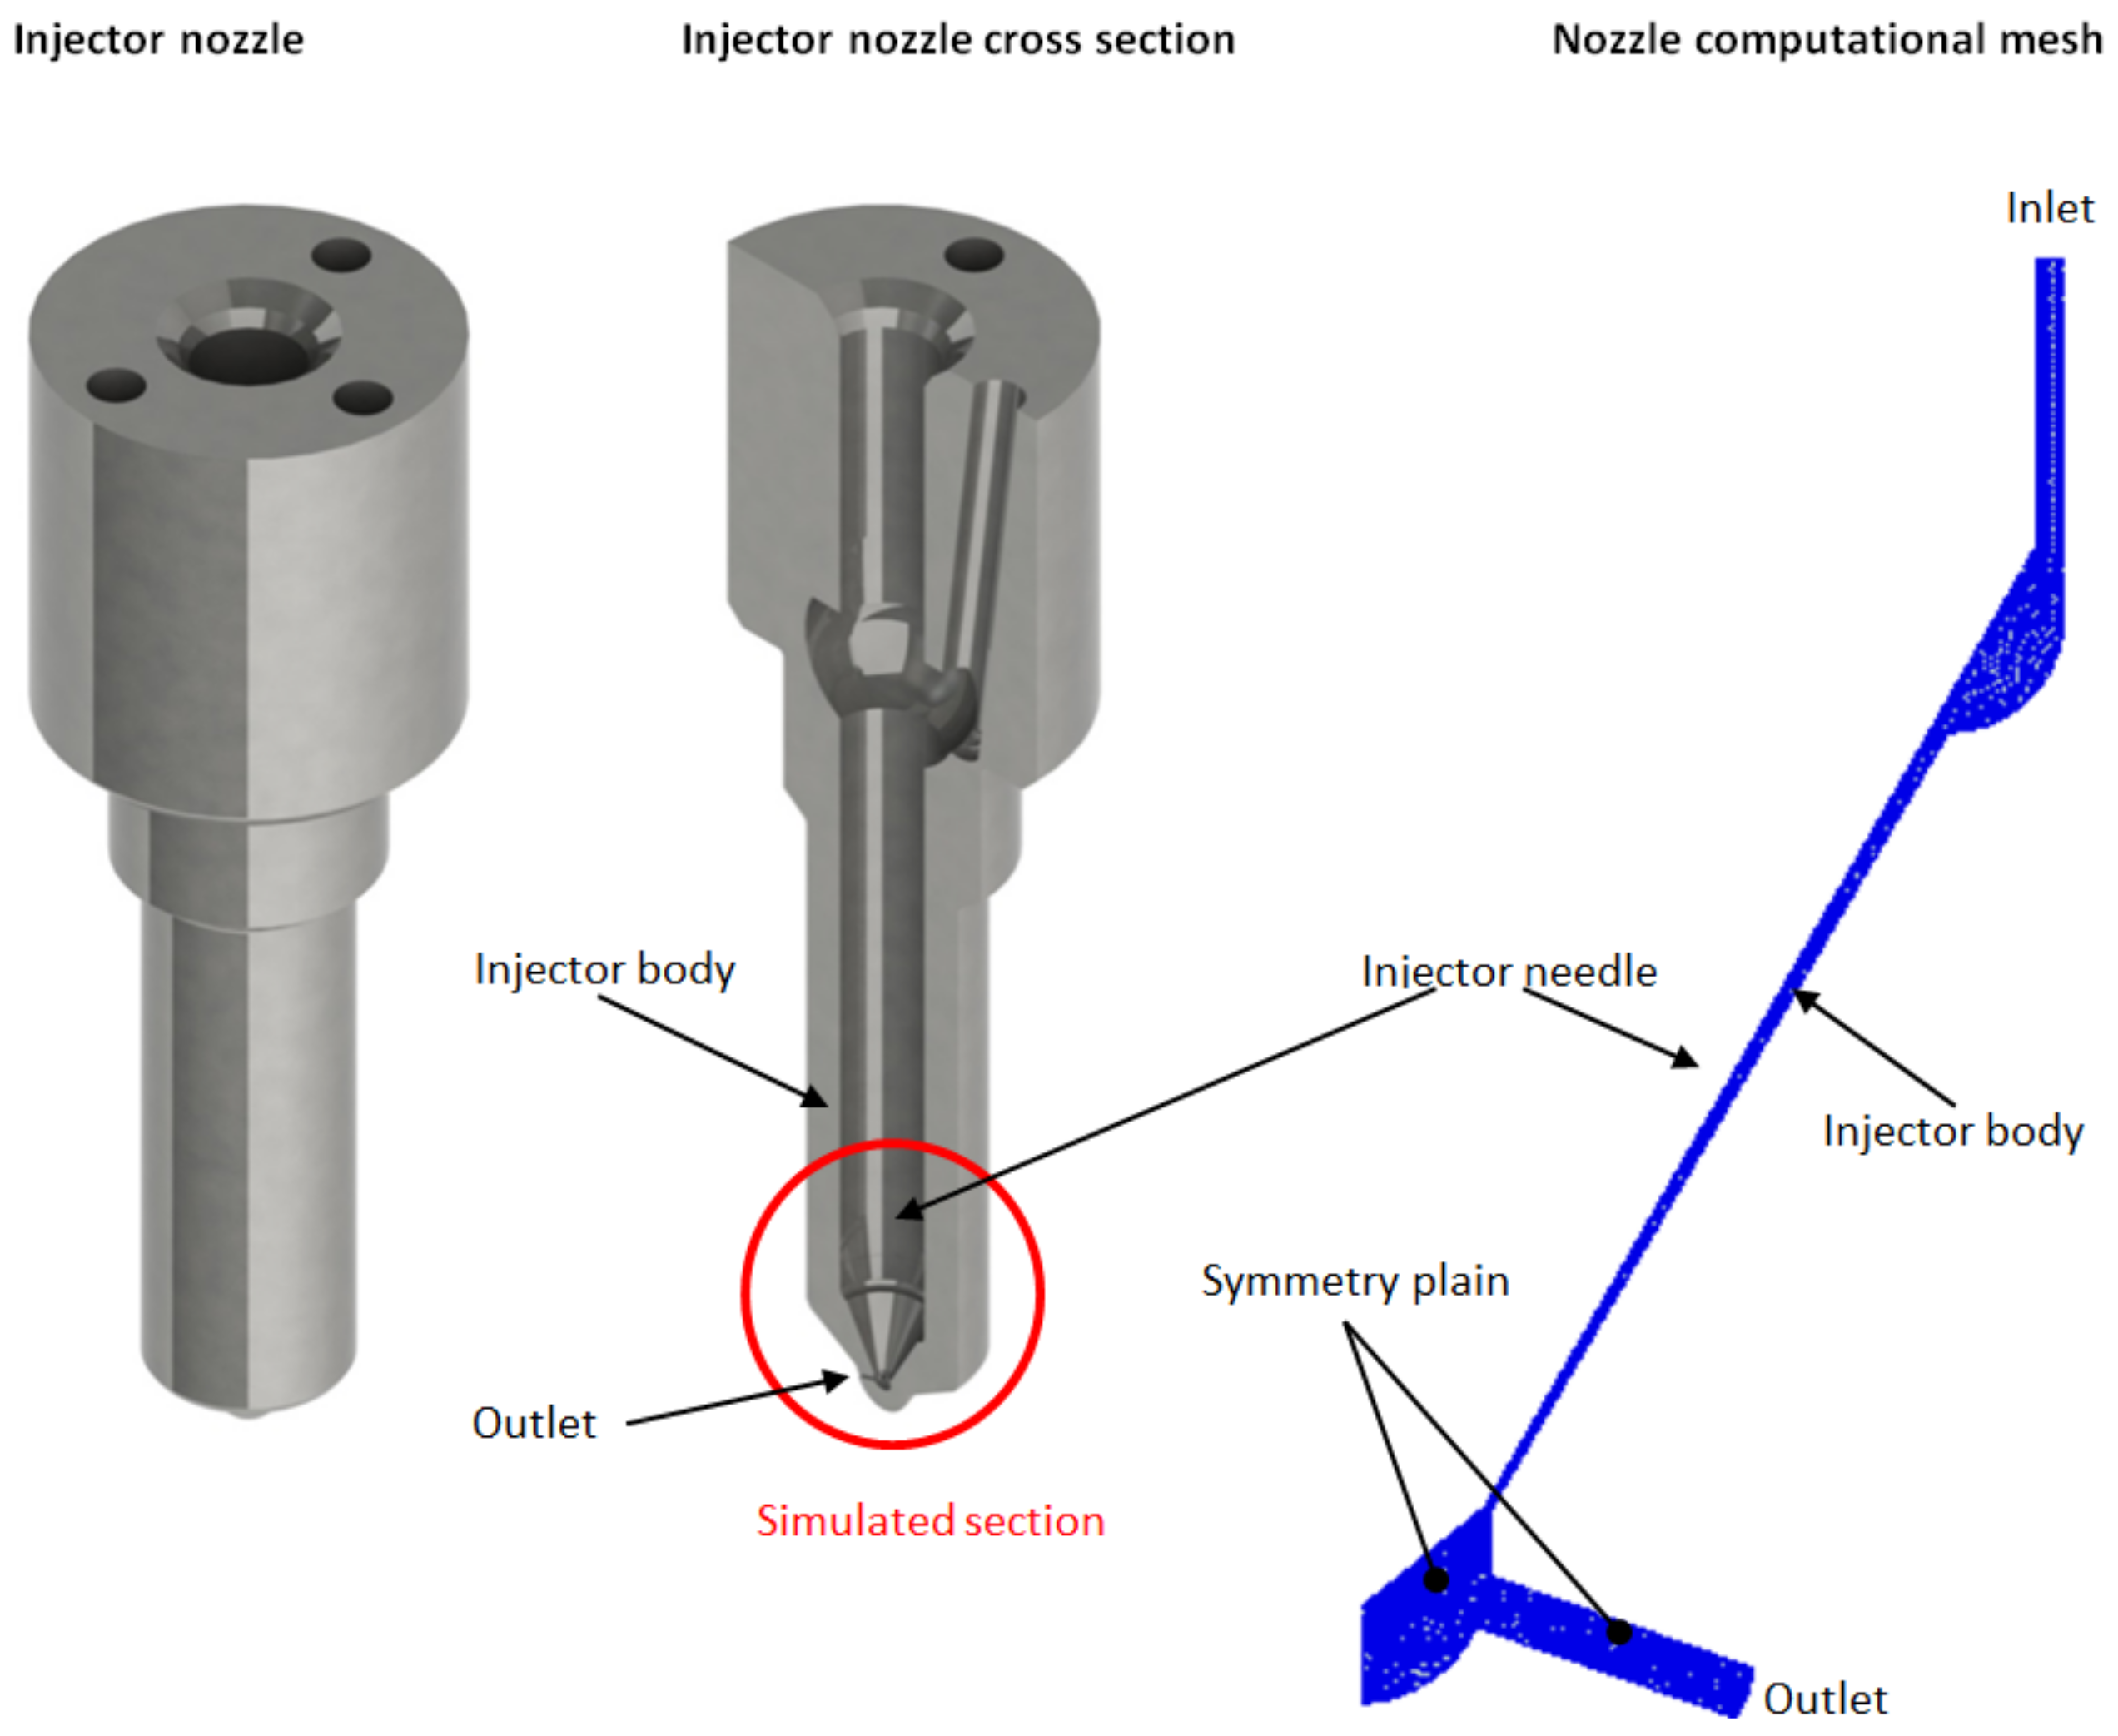
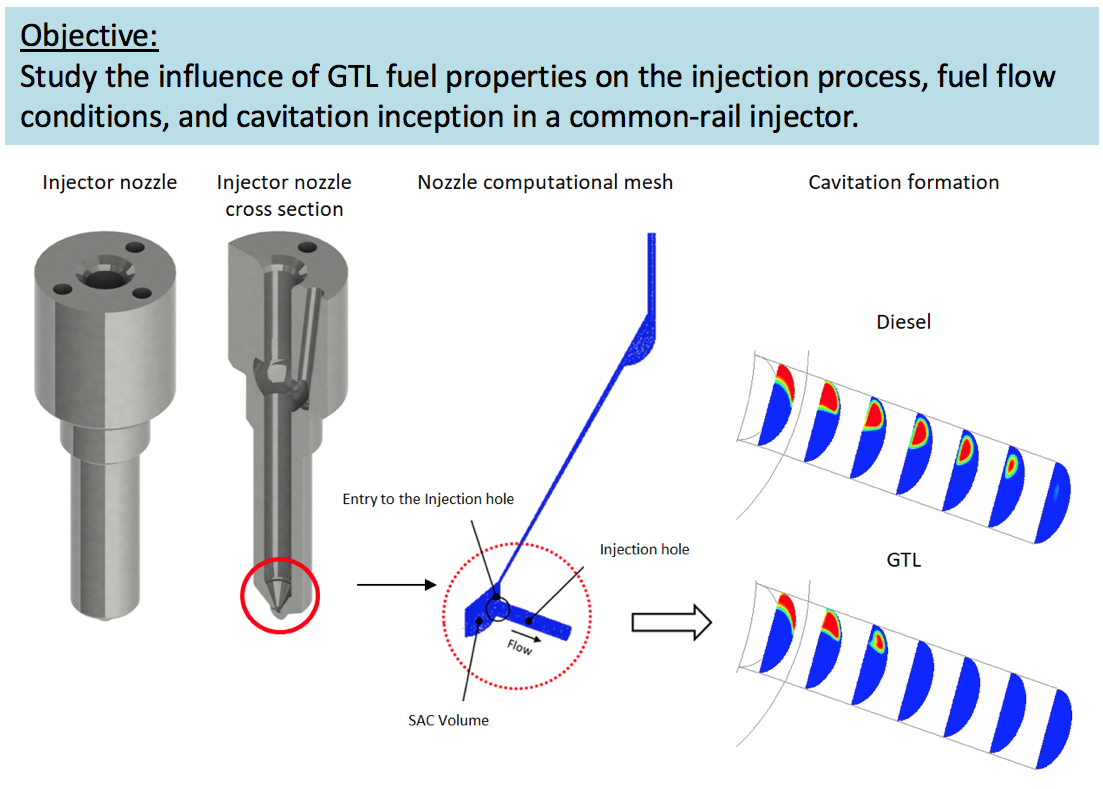
To fill this gap, the objectives in this study are to study the influence of GTL fuel properties on the injection process, fuel flow conditions, and cavitation inception in a modern common-rail injector. The study was performed on a Denso solenoid injector taken from a commercial NISSAN YD1-K2-Type engine. Conventional mineral diesel fuel and synthetic GTL fuel, produced from natural gas, were tested. Their influence on the injection process was tested experimentally and numerically using the 1D AVL Hydsim program at 60 bar of in-cylinder back pressure. The influence on cavitation inception and fuels flow conditions was tested using a 3D computational program AVL FIRE. Using this program, transient simulations, considering needle movement during injection of each fuel, have been carried through the RANS approach, standard mathematical, and turbulence models implemented in commercial software. Different ambient pressures of 40, 60, and 80 bar were applied at the injection nozzle outlet in order to extend the work and study the effect of in-cylinder back pressure on conditions inside the injection nozzle.
The obtained results indicate that differences in GTL fuel properties and in-cylinder back pressures influence flow conditions and cavitation inception inside and at the outlet of the common-rail solenoid injector. These differences can have a potential influence on further processes in the combustion chamber of direct injection diesel engines. The possible influence of GTL fuel on fuel atomization, combustion, and emission formation will be discussed in the conclusion section.
5. Discussion
The influence of the physical–chemical properties of the tested fuels and in-cylinder back pressure on the injection process, in-nozzle flow, and cavitation inception was tested in the presented paper. The study was made numerically, using a modern injector with a solenoid valve taken from the common rail injection system of a Nissan diesel engine. First, the influence on the injection process was tested numerically, using the one-dimensional program, and then experimentally. The obtained results were used further for three-dimensional simulations, where we used only one-fourteenth of the whole injection nozzle tip and considered transient needle motion during the injection process. In the following chapters, only the most relevant results are presented at different times of the injection process.
5.1. Influence on Injection Process
In the presented study, only the main fuel injection, without pre-injection, was modeled. The results of numerical simulations (NS) were compared to the experimentally obtained results (EXP). The results of fuel mass flow rates and needle lifts are presented in
Figure 5.
The results regarding fuel mass flow,
Figure 5a, show that the Hydsim program predicts slightly higher maximal values of fuel mass flows for diesel (NS D2) and GTL (NS GTL) fuels. Hydsim also over predicts the total time of injection slightly, so, by the end of the injection process, we have higher values of fuel mass flow compared to the experiment.
The injection duration of diesel fuel is longer compared to GTL fuel. The reason for this is the longer energizing time of the solenoid valve when diesel fuel is used. These experimental results were obtained from a Nissan engine, where injection duration was optimized in order to operate the test engine at the desired engine speed and load. The numerically calculated start of injection was at 2.78 ms for diesel fuel and 2.8 ms for GTL fuel. In the experiment, the injection of both GTL and D2 fuel started at 2.82 ms. The duration of the numerically obtained injection process for D2 and GTL fuels is 1.26 ms and 1.16 ms, respectively. The total injection duration during the experiment was 1.07 ms for D2 and 1.01 ms for GTL fuel.
In order to consider dynamic needle motion in the 3D simulation, we require needle lift in each time of the injection process. The obtained needle lifts for diesel and GTL fuels are presented in
Figure 5b. A clear connection between needle lift and mass flow rate can be seen from the results. A start of needle lift for D2 fuel is a little advanced compared to GTL fuel, which influences on advanced diesel fuel injection (mass flow). The gradient of the GTL fuel needle lift is steeper shortly after the injection start, which leads to higher needle lift for GTL fuel at around 3 ms and causes higher GTL fuel mass flow at the same time of injection.
The time at needle lift start for each fuel was taken as the initial time for 3D simulations. As there is no injection process or internal fuel flow before this time, there is no point in simulating when the needle is closed.
The higher value of diesel fuel density, compared to GTL fuel, slightly increases its fuel mass flow obtained numerically and experimentally. This fact affects the total injected fuel mass per injection cycle further, as presented in
Figure 6.
The numerical and experimental results of injected fuel mass presented in
Figure 6 show higher injected mass for diesel fuel. This is a result of the higher maximal values of diesel fuel mass flow due to higher diesel fuel density. Numerically obtained values of injected fuel masses are approximately 10% higher than experimental values. This is a consequence of a longer injection duration predicted by the numerical Hydsim program.
The comparison of fuel mass flows and total injected fuel masses show good agreement between numerical and experimental results, which indicate that results from the BOOST Hydsim program (needle lift) can be used for further research.
5.2. In-Nozzle Flow and Cavitation Inception
In the following sections, only the most relevant results are presented at different times of the injection process. The results are divided into two sub-sections. First, the influence of fuel properties on flow characteristics is discussed at 60 bar of in-cylinder back pressure. The influence of in-cylinder back pressure was tested in the following step.
5.2.1. Influence of Fuel Properties
The influence of fuel properties on fuel flow condition and cavitation inception inside the injector was studied numerically. When fuel flows through the injector it undergoes significant changes in flow direction, which causes fluctuation in velocity and pressure. This further influences the formation of cavitation. There are two regions inside the injector where most of the cavitation structures are formatted. The fuel undergoes the most significant changes in flow direction when it flows into the injection hole. This change in flow direction causes the formation of an area with very low pressure at injection hole entry, marked in
Figure 7. Because the pressure at the nozzle exit is usually lower than the fuel pressure inside the injector SAC volume and inside the injection hole, the formed cavitation structures travel with the fuel flow and stretch throughout the injection hole towards the nozzle exit denoted with S1 at
Figure 7. The second area of cavitation formation is in the space between the injector needle and the injector body, which is very narrow when opening and closing the needle. Since the most significant area of cavitation formation is at the fuel entry to the injection hole, the second area was not studied in the scope of the work presented in this paper. The schematic presentation of the injection hole entry and different locations inside the injection hole are presented in
Figure 7.
The results of the vapor volume fraction at different locations (S1 to S7) inside the injection hole are presented in
Figure 8. The results for D2 and GTL fuels are provided at the same time during the injection process. The results in
Figure 8f show the last simulation time step, which differs in time for each tested fuel.
The results indicate that both fuels induce cavitation formation (denoted with a light blue, green, yellow, and red color) in the upper part of the injection hole entry. Since the injector has seven injection holes, the majority of the fuel which flows under the injector needle enters directly to the injection holes, and not to the nozzle SAC volume, marked in
Figure 7. This creates the area of low pressure at the upper part of the injection hole entry, which further induces the cavitation formation [
24]. Since both fuels undergo significant changes in flow direction and the pressure drop is very high (practically to 0 Pa of absolute pressure [
23]), the differences in the cavitation area for both fuels are quite small. Slightly wider regions of the cavitation area were obtained using diesel fuel. This can be related to higher values of diesel fuel saturation pressure. The difference in cavitation area can also be related to difference in fuel kinematic viscosity. The higher viscosity of GTL fuel results in less cavitation. This agrees with the results of Saleh at al. [
37], and Nouri et al. in [
38] where they also concluded that higher viscosity of fluid results in less formatted cavitation. At needle closing, cavitation vapor fraction dissipates (declines) later, so it was still visible on S6 and S7 at 1 ms after the injection starts, when the needle is almost closed.
Figure 9 presents the results of normalized maximal values of Vapor Volume Fraction for diesel and GTL fuel at slices S1 to S7 of the injection hole. From these results, the movement of cavitation structures through the injection nozzle can be observed. As can be seen, the cavitation formation is first triggered at fuel entry to the injection hole (S7). For diesel fuel, this happened at 0.26 ms after the injection start, while for GTL fuel at 0.29 ms. This coincides with the results from
Figure 10a where no Vapor Volume Fraction (VVF) is visible at 0.25 ms after the injection start. In
Figure 8b, 0.5 ms after the injection start, the VVF can be noticed for both fuels. Since diesel fuel advances the cavitation formation, the VVF can be noticed on the slices from S7 to S1, while for GTL fuel, it is only from S7 to S5 at the time 0.5 ms after the injection start. The fluctuation of VVF inside the injection nozzle can be seen around 0.8 ms for D2 fuel and at 0.7 ms for GTL fuel. This can be noticed as a decrease in the normalized VVF values,
Figure 9. The fluctuation of the cavitation structure is more evident for diesel fuel, where a drop in VVF was obtained at all slices of the injection hole.
The results for fuel mass flow, average normal velocity, average turbulent kinetic energy, and maximal values of vapor volume fraction at the nozzle exit are presented in
Figure 10.
The results of the fuel mass flow rate show that the mass flow for D2 fuel starts to rise earlier than in the case of GTL fuel,
Figure 10a. This leads to higher fuel velocity and faster formation of cavitation structures at the start of the injection process. There is a slight increase in the mass flow of GTL at 0.8 ms. This further influences cavitation formation, which starts to decline later in the injection process compared to D2 fuel,
Figure 8. The fluctuation in fuel mass flow also influences the average normal fuel velocity at the nozzle hole exit, see
Figure 10b. During most of the injection process, diesel fuel showed slightly higher velocities and mass flow rates than GTL. This can be related to its lower kinematic viscosity compared to GTL fuel [
23,
28,
29,
30]. The same was also found in work of Battistoni et al. [
23], where they concluded that lower fuel viscosity results in lower pressure losses inside the injection hole.
Figure 10c presents the results of the average values of turbulent kinetic energy (TKE) at the nozzle exit hole. The value of the average TKE increases with the increase in mass flow. The maximal values of average TKE at the nozzle exit hole collide with the time when the maximal values of mass flow, normal fuel velocity, and Vapor Volume Fraction appear at the nozzle outlet (see
Figure 10d). This indicates that the magnitude of turbulent kinetic energy increases with the increase of the fuel mass flow rate, but it is also influenced by the appearance of the vapor phase at the nozzle exit hole.
The results of the maximal values of VVF show three distinctive sections. At first, VVF appears at the nozzle outlet at the time of mass flow rise. In this first section, the values of VVF for GTL fuel are significantly higher than the values for diesel fuel. The second section indicates the Vapor Volume Fraction peaks for D2 and GTL fuels, which collide with the first peak of fuel mass flows. This occurs around 0.5 ms for D2 fuel and 0.6 ms for GTL fuel. In the second section, maximal values of VVF are obtained when using diesel fuel. The third section indicates the region where the maximal values of mass flows occur. For GTL fuel, this happens around 0.8 ms after the injection start, while for D2, shortly after 1 ms after the injection start. The first and third sections are distinctly more evident for GTL fuel, while for D2 fuel, only a slight bump in the VVF maximal values is noticed, which is hard to connect directly with the first peak, or with a maximal value of D2 mass flow rate.
5.2.2. Influence of In-Cylinder Back Pressure
The difference between common-rail fuel pressure and in-cylinder pressure is the governing force for the fuel flow in the injector nozzle. If these conditions change, which can happen in the case of a pre- or post-injection, they can influence fuel flow conditions, which further influences the cavitation formation. Two additional in-cylinder pressures of 40 and 80 bars were tested in the following section.
Figure 11 and
Figure 12 show the result of cavitation vapor structure formation on different locations inside the nozzle at 40 and 80 bar of in-cylinder atmospheric pressure.
The significant influence of in-cylinder back pressure on cavitation Vapor Volume Fraction formation can be seen in
Figure 11 and
Figure 12. These results were expected since the pressure difference between injected fuel and in-cylinder pressure governs the injector’s fuel flow. Similar trends were also observed by Dai et al. in [
24], where a higher difference between fuel injection pressure and atmospheric pressure results in an increase in cavitation. The results for both fuels and both in-cylinder pressures indicate that cavitation appears at the upper part of the injection hole entry and then spreads towards the outlet, as in the case of 60 bar of in-cylinder pressure. The area of cavitation fraction at 0.5 ms is significantly higher when lower in-cylinder pressure is applied. A similar trend can be observed at needle closing (
Figure 11e and
Figure 12e). At 40 bars of in-cylinder pressure, the cavitation is still fully developed at 1 ms after the injection start. In comparison, at 80 bars, the area of cavitation at this time of injection is negligible. As far as the fuel type influence is concerned, diesel fuel gives a slightly wider region of cavitation area compared to GTL fuel. The opposite trend is only evident at 80 bar of in-cylinder pressure at 0.75 ms, where GTL fuel cavitation vapor fraction dissipation (decline) is delayed, so there the cavitation area is wider (S4–S7,
Figure 11 and
Figure 12). Wider regions of cavitation structures for diesel fuel are the result of the higher diesel fuel saturation pressure.
The results for fuel mass flow, average normal velocity, average turbulent kinetic energy, and maximal values of Vapor Volume Fraction at nozzle exit for different in-cylinder pressures are presented in
Figure 13.
The results of fuel mass flow (see
Figure 13a) indicate a slightly higher fuel mass flow for diesel fuel, which is a result of the higher diesel fuel density and lower kinematic viscosity. The fuel mass flow for diesel starts to increase earlier compared to GTL fuel at both in-cylinder pressures. Because of the shorter injection duration, the fuel mass flow for GTL starts to decline faster than for D2 fuel.
The fluctuation of fuel average normal velocity, average values of turbulent kinetic energy, and maximal values of Vapor Volume Fraction at the nozzle hole outlet is again strongly influenced by the value of fuel mass flow. The higher mass flow rates and higher velocities for D2 fuel can be attributed to the lower viscosity and higher density of diesel fuel. The lower viscosity of diesel fuel increases fuel velocities, which, combined with the higher diesel fuel density, increases the fuel mass flow rate.
The maximal fluctuations of fuel velocity, turbulent kinetic energy, and Vapor Volume Fraction occur between 0.5 and 1 ms. In this interval of the injection process, the fuel mass flow rates are maximal. There is a significant fall in diesel fuel average normal velocity and a significant increase in the average value of turbulent kinetic energy at 40 bar of in-cylinder pressure. These fluctuations occur at the moment of the sudden rise of the Vapor Volume Fraction at the nozzle hole exit, which occurs around 0.5 ms after the injection start. There are also some fluctuations of the Vapor Volume Fraction for GTL fuel at the nozzle hole outlet, but these are significantly lower compared to the fluctuations of VVF for diesel fuel. This indicates that smaller values of cavitation structures at the nozzle hole outlet always have a smaller influence on the values of the normal fuel velocity and turbulent kinetic energy. When the fuel vapor structures at nozzle outlet exceed a certain value (amount), they influence fuel average normal velocity, and the average value of turbulent kinetic energy becomes significant. Because the diesel fuel mass flow does not drop at the same time as the fuel normal velocity, we believe that the occurrence of Vapor Volume Fraction might cause the formation of eddies in the fuel flow, which increases other fuel velocity components and further increases values of turbulent kinetic energy.
6. Conclusions
In the present paper, 1D and 3D numerical simulations were performed to study the influence of the physical-chemical properties of diesel and GTL fuels on the injection process, in-nozzle flow, and cavitation inception in a solenoid injector of a common-rail injection system. The obtained influences are:
Higher average mass flow rates and velocities were obtained for the diesel fuel injection process. This behavior can be associated with the higher diesel fuel density and lower viscosity compared to GTL fuel. Higher mass flow rates of diesel fuel can also be connected to larger injected diesel fuel mass.
The cavitation in the injection hole is triggered regardless of the differences in fuel properties. It occurs in the upper part of the injection hole entry for both fuels tested and spreads through the injection hole towards the hole exit. The difference in fuel properties influences the number of formed cavitation structures. The higher viscosity and lower saturation pressure of GTL fuel leads to slightly smaller areas of cavitation compared to diesel fuel.
The occurrence of cavitation in the injection hole is highly influenced by the difference between injection and in-cylinder back pressure. Higher pressure differences produce larger areas of cavitation fraction and vice versa.
The occurrence of cavitation (Vapor Volume Fraction) at the injection hole exit influences the effective flow area, which strongly influences the velocity at the hole exit. When a large amount of cavitation is present at the hole exit, fluctuations in flow velocity are obtained. The observed phenomenon is more significant when the difference between injection and in-cylinder back pressure is high.
The obtained results indicate that the appearance of Vapor Volume Fraction at nozzle exit influence the magnitude of turbulent kinetic energy. This phenomenon is also more significant at higher differences between injection pressure and in-cylinder back pressure.
The appearance of Vapor Volume Fraction at the nozzle outlet might cause the formation of eddies in fuel flow, which further effects the magnitude of each fuel velocity component.
The authors believe that the observed differences at the injection hole exit can have a significant and positive impact on fuel atomization as a means of better fuel disintegration and larger spray cone angles. This can usually lead to enhanced fuel evaporation and better, cleaner combustion. According to our previous study [
21], cavitation at the injection hole exit can influence the center axis of fuel spray cone, which can decline. This can cause the formation of asymmetrical fuel spray and further increase the possibility of two fuel spray collisions, which will have a negative impact on fuel atomization. The collision of sprays can cause the fuel droplets to merge and make them harder to evaporate, which can lead to poor combustion and increase the formation of harmful emissions.
Overall, the presented results indicate that the GTL fuel can be used as a substitute fuel in the modern common-rail diesel engines. However, the influence of GTL properties on fuel spray development, emission formation, etc., must be studied before its integration.
Finally, the agreement between experimental and numerical results confirms the suitability of the used numerical procedure to study the effect of fuel properties in a common-rail injection nozzle.


 ,
, 


