Article

The Effects of Social Distancing on Electricity Demand Considering Temperature Dependency

by
Mohannad Alkhraijah
1,2,
Maad Alowaifeer
2,3,
Mansour Alsaleh
1,*,
Anas Alfaris
1 and
Daniel K. Molzahn
2
1
Center for Complex Systems, King Abdulaziz City for Science and Technology, Riyadh 11442, Saudi Arabia
2
School of Electrical and Computer Engineering, Georgia Institute of Technology, Atlanta, GA 30313, USA
3
Electrical Engineering Department, King Fahd University of Petroleum & Minerals, Dhahran 31262, Saudi Arabia
*
Author to whom correspondence should be addressed.
Energies 2021, 14(2), 473; https://doi.org/10.3390/en14020473
Submission received: 12 December 2020 / Revised: 29 December 2020 / Accepted: 5 January 2021 / Published: 17 January 2021
(This article belongs to the Section F: Electrical Engineering)

Abstract

:
To mitigate the spread of the Novel Coronavirus (COVID-19), governments around the world have imposed social distancing policies ranging from minor social activity suspensions to full curfews. These social distancing policies have altered electricity consumption behaviors in numerous countries. Many governments imposed strict social distancing policies during a temperature transition season where the impacts of temperature variations are particularly important for the operation of the electric grid. This paper studies how strict social distancing policies affect the relationship between electricity demand and ambient temperature. We first review the expected short- and long-term impacts of social distancing on the electricity demand. We then present a case study on the electricity demand of the Kingdom of Saudi Arabia during strict social distancing policies. The results of this case study suggest that strict social distancing policies result in a stronger correlation between temperature and electricity demand compared to previous years. Additionally, we observe a reduction in the time required for the electricity demand to respond to temperature changes. Power system regulators can use the results in this paper to better design energy policies. The results can also be used by power system operators to more accurately forecast electricity demands and avoid inefficient and insecure operation of the electric grid.

1. Introduction

The Novel Coronavirus (COVID-19) has impacted every aspect of our lives and the way we interact with our environment. As of January 2021, the pandemic has resulted in roughly two million deaths and 89 million infected persons [1]. Governments around the world have imposed social distancing policies, such as requiring a minimum of a six-foot separation between people and curfews of public places [2]. By minimizing person-to-person contacts, these policies reduce the spread of the virus [3,4]. Social distancing from COVID-19 has a profound impact on the global economy, energy trade, and consumption behavior (e.g., see [5,6,7,8,9,10]).
Social distancing has significantly modified people’s consumption behaviors [5,6]. For instance, with people staying home more frequently, online shopping and food delivery services have grown significantly. On the other hand, many commercial activities have completely or partially shut down during the strict social distancing measures [11]. Social distancing has disrupted the social system in various ways, which, in turn, have significantly changed global consumption behaviors. Numerous examples of large-scale consumption behaviors have emerged during COVID-19, such as avoiding public transportation [6], an increasing consumption of plastic materials [12], and an unprecedented demand on healthcare facilities, influenced by the implementation of new healthcare procedures. Many other socioeconomic factors have also contributed to changes in demand, such as travel bans, unemployment, and government interventions to stimulate economies [2,13].
Restrictions on social activities and policies imposed to mitigate the spread of the pandemic have significantly impacted the electricity demand. Many countries have reduced their consumption of nearly all energy resources [14]. The closing of large social gathering places has reduced electricity demands from the government and commercial sectors. The industrial sector also faces several changes, as numerous manufacturers have closed or are reducing their demand, whereas other manufacturers are actually increasing their demands [15,16]. As mobility is restricted and consumption is concentrated in the residential sector, the daily demand patterns become more similar. This can be observed with respect to the similarities between the weekend and weekdays during curfews [10,17]. Using data obtained from 30 countries, the International Energy Agency in [18] reported that the monthly electricity demand decreased on average by 20% when imposing a full curfew. The change in the electricity demand can vary between the regions in the same country depending on the social and consumption behaviors. Furthermore, most of the restrictions occurred in a seasonal transition period, i.e., from winter to summer for the northern hemisphere, causing significant temperature fluctuations that influence the electricity demand.
The COVID-19 pandemic has created an unprecedented opportunity for a natural experiment to examine electricity demand. The unique characteristics of the electricity demand during the imposed social distancing policies due to COVID-19 and the seasonal transition have intensified the impact of the cooling demand in the residential sector, allowing a more profound investigation of the relation among energy consumption behavior, temperature, and the imposed social distancing policies. In this paper, we use Saudi Arabia as a case study for investigating the impacts of social distancing policies on total electricity demand while considering temperature variations. The Saudi electricity demand is highly dependent on the temperature. This temperature dependency is particularly pronounced in the residential sector, which accounts for a large portion of both the total demand (45.6%) and the overall cooling demand (more than 50% in normal years) [19]. The significant variation in the temperature during the period of this study, from 17 C to 40 C, allows us to explore the relationships among the electricity demand, ambient temperature, and imposed social distancing policies. Our main contributions can be summarized as follows:
  • We discuss factors that influence the electricity demand and review the effects of social distancing reported from different countries. We also describe the anticipated long-term impacts of social distancing on power systems.
  • We present a detailed case study analyzing the electricity demands and ambient temperatures before, during, and after imposing various social distancing policies. We discuss the effect that social distancing has on the demand–temperature relationship, and we show, through this case study, that the evident shift towards the residential sector has caused unprecedented levels of correlation between the demand and temperature.
Although there is a substantial existing literature studying the effects of temperature on electricity demands in many countries, the consideration of temperature–demand correlation and the associated changes during strict social distancing have not yet been addressed. With this work, we study how the temperature–demand correlation has changed via deducing information from the electricity demand during COVID-19, especially in countries with high cooling demand such as Saudi Arabia.
Roadmap. The rest of the paper is organized as follows. Section 2 discusses factors impacting the electricity demand and describes the short- and long-term impacts that social distancing has on power systems. Section 3 introduces our case study and shows how the electricity demand is affected by social distancing policies. Section 4 presents the results and main findings of our study. Section 5 concludes the paper.

2. Overview of Electricity Demand during Strict Social Distancing

Social distancing policies imposed due to COVID-19 have significantly disrupted power systems. The impacts of social distancing policies may vary from very short-term, as a response to the imposed policies, to long-term factors that might permanently change the electricity consumption behavior. In the next section, we discuss the factors impacting the electricity demand and the significance of cooling demand. We then focus on the impact that social distancing has had on the electricity demand in Section 2.2. After that, we present the anticipated long-term impacts in Section 2.3.

2.1. Factors Impacting Electricity Demand

The dependency between electricity demand and social activity is evident. Demand forecasting models employed by power system operators usually consider nation-wide social events (e.g., holidays) and sudden social changes (e.g., school openings, daylight saving time changes, major sport events) [20]. Forecasting models use historical demand data to infer consumption behavior and improve the forecast accuracy. However, during rare events similar to the pandemic, the demand is unusual and historical data does not capture the consumption behavior. The typical relationship between the electricity demand and other external factors such as temperature might change due to social distancing, and there is a need to recalibrate the forecasting models to account for these changes.
The suspension of most social activities occurred during a seasonal transition period between March and April 2020 [18]. Such periods are characterized by significant temperature fluctuations impacting the electricity demand. Considering the impacts of temperature is crucial for understanding electricity demand during the pandemic. This is especially the case for countries with high proportions of cooling and heating loads. The dependency between electricity demand and ambient temperature in such countries is significant [21]. For instance, Narajewski et al. suggest in [22] that the high-temperature dependency of the electricity demand in France has intensified the impact of COVID-19 on the electricity demand even before imposing strict social distancing policies.
Currently, 20% of the global electricity demand is consumed by cooling loads. Climate change and the decreasing cost of energy are expected to lead to an expansion in the number of air conditioning units from 1.6 billion in 2018 to 5.6 billion by 2050 [23,24]. A study shows that 38 out of the 50 most populated metropolitan areas around the world are in developing countries, and most of them face warm to hot weather conditions; hence, an unprecedented increase in the global cooling demand is expected as incomes increase in developing countries [25]. For these reasons, there have been extensive studies of the cooling loads in many countries such as the United States [26], India [27], Spain [28], Brazil [29], China [30], and Saudi Arabia [21,31,32,33,34]. The cooling load contributes heavily to the peak demand in these countries. For instance, the cooling load in United States can reach up to 60% of the peak demand in some cities [24]. In Spain, around 33% of the peak demand is consumed by cooling load in 2018. Furthermore, a heat wave recorded in France in 2003 caused the peak demand to rise around 10% compared to the normal peak demand [23]. Considering the penetration of air conditioning on the household demand, Saudi Arabia has the highest penetration (70%), followed by United Arab Emirates (57%), United States (25%), Malaysia (20%), and India (18%) [21].

2.2. Social Distancing Impact on the Demand

The impact of COVID-19 on the electricity demand depends on strength of the social distancing restrictions. Throughout January and February 2020 in China, an 8.2% decrease in the daily power generation occurred as compared with 2019 [35]. France, India, Italy, Spain, and the U.K. experienced a minimum 15% decrease in their daily electricity demand during full curfew relative to 2019 [36]. Bahmanyar et al. [37] showed that, for countries with strict restrictions such as Spain, Italy, Belgium, and the U.K., the demand reduction is higher than countries with less rigorous restrictions, such as Sweden. Furthermore, throughout March and April 2020, the central region of the United States experienced a 9–13% reduction in weekday demand as compared with the expected demand [38]. The New York Independent System Operator reported a reduction in the New York City electricity demand by 6% to 18%, while the electricity demand of an average apartment increased by 7% to 23% during working hours, with a slight decrease in the demand during non-work hours [39]. Although the residential demand exhibited a significant increase, the decrease from large-scale industrial and commercial sectors demands have had a more dominant impact.
A quantitative analysis in [40] shows the impacts of social distancing policies on electricity demand, power system security, generation mix, and retail electricity price in the United States. The analysis highlighted several abnormalities in the electricity demand with diverse responses to the social distancing polices observed in different operational areas [40]. Other results in [41] show a strong correlation between the electricity demand reduction and the number of COVID-19 cases, the strictness of social distancing restrictions, and the level of commercial activity. These authors emphasize the importance of considering locational socioeconomic variations and the need to augment cross-domain data to understand the electricity demand [41]. Another study shows that the impact of social distancing policies on the electricity demand in India differs between regions based on their consumers’ wealth. Compared to low-income regions, the electricity demands in affluent regions of India more quickly returned to similar levels as before the pandemic once the government relaxed the social distancing restrictions [42].

2.3. Anticipated Long-Term Impact

The end of the pandemic remains uncertain. The strictness of social distancing policies, and thus the impact on electricity demand, varies with the severity of the pandemic in each region. This uncertainty imposes substantial challenges to the systems impacted by the spread of the pandemic and may lead to changes that will endure even after the synthesis and distribution of a reliable vaccine [43]. In the long-term, the price of electricity and advances in technology have a dominant influence on the electricity consumption [44]. However, the changes in consumer behavior due to social distancing may persist for longer periods. The characteristics of electricity demand after removing the social distancing policies are hard to predict. Several examples of large-scale changes in consumption behavior due to restricted social distancing measures suggest that the electricity demand will also experience changes. Furthermore, the return to normal may cause the energy consumption to rebound in a manner that will eliminate all the benefits and emissions reduction that occurred during strict social distancing, possibly becoming higher than the level of consumption before COVID-19.
There are numerous signs that the change in the demand due to social distancing may continue even after the elimination of strict social distancing measures [22,45]. Social distancing forces people to stay at home more, which increases the residential demand. Social distancing measures have forced many companies and government entities to practice “Work from Home” (WFH) policies at a scale that has never occurred before. WFH causes employees to use their own internet connection and air conditioning, as well as to pay for their energy consumption during working hours. Many organizations observed multiple advantages from these WFH policies and will likely attempt to integrate these policies as part of the future manner of conducting business [17]. Furthermore, the education system is experiencing a significant increase in the amount of online learning. Universities and schools around the world found themselves forced to move to online education during social distancing. This movement injected billions of dollars of investment and increased the amount of innovation in online education, making it a viable option in the future [46]. Telemedicine is another emergent concept resulting from social distancing. During a telemedicine appointment, the basic medical material and pre-examination equipment are procured by the patient. Although the electricity demand may not be significant, the example of the telemedicine provides insight into how energy consumption may shift to the residential sector in the future as more services are performed from home.

3. Case Study: Impact of Social Distancing on the Electricity Demand of Saudi Arabia

This section analyzes the electricity demand of the Kingdom of Saudi Arabia (KSA) and the impacts caused by the imposed social distancing policies. We begin by presenting an overview of the Saudi power system in Section 3.1. Next, in Section 3.2, we describe the social distancing policies imposed in the KSA to reduce the spread the virus. Then, in Section 3.3, we illustrate the electricity demand trends observed during the social distancing measures. Finally, in Section 3.4, we present the core analysis of this section by incorporating temperature data into the analysis.

3.1. State of the Power System in Saudi Arabia

The power system in the KSA is operated by the Saudi Electricity Company (SEC), which also owns most of the power system infrastructure. Over 30 million people are served by the Saudi power grid, with a peak demand of 62 GW and an energy consumption of 289 TWh in 2019 [19]. The load factor, defined as the average demand divided by the peak demand over some period of time, indicates how fully the generation units are used. In the KSA, the load factor is as low as 0.53 . This low load factor is attributable to the high summer temperature and resulting cooling requirements causing a strong seasonal variation in the electricity demand of the KSA.
The total installed capacity of the generation in the Kingdom is 88.7 GW, where 66% of the generation is owned by the SEC and the remaining 34% by different independent power producers. The generation mix in the KSA is mainly based on fossil fuels, where natural gas accounts for 37% while the remaining 63% is served by oil products. Renewable energy represents only a small fraction of the generation mix. In 2017, however, the government announced the National Renewable Energy Program (NREP) as part of its Vision 2030 initiative to install 9.5 GW of renewable energy resources by 2023 [47].
In 2019, the demand in the Kingdom was distributed among the electricity sectors as follows: (a) residential (45.6%), (b) industrial (17.6%), (c) commercial (16.7%), (d) governmental (13.5%), and others (6.2%) [19]. The building demand, which contains the residential and a small number of other sectors, represents 70% of the demand in the KSA. A building stock model developed in [33] shows that 66% of the total energy end-use for the buildings in the KSA is space cooling demand. The extreme heat during the summer leads to this excessive cooling demand. We note that the power losses in the transmission and distribution network account for 9.26% of the generated power [19].

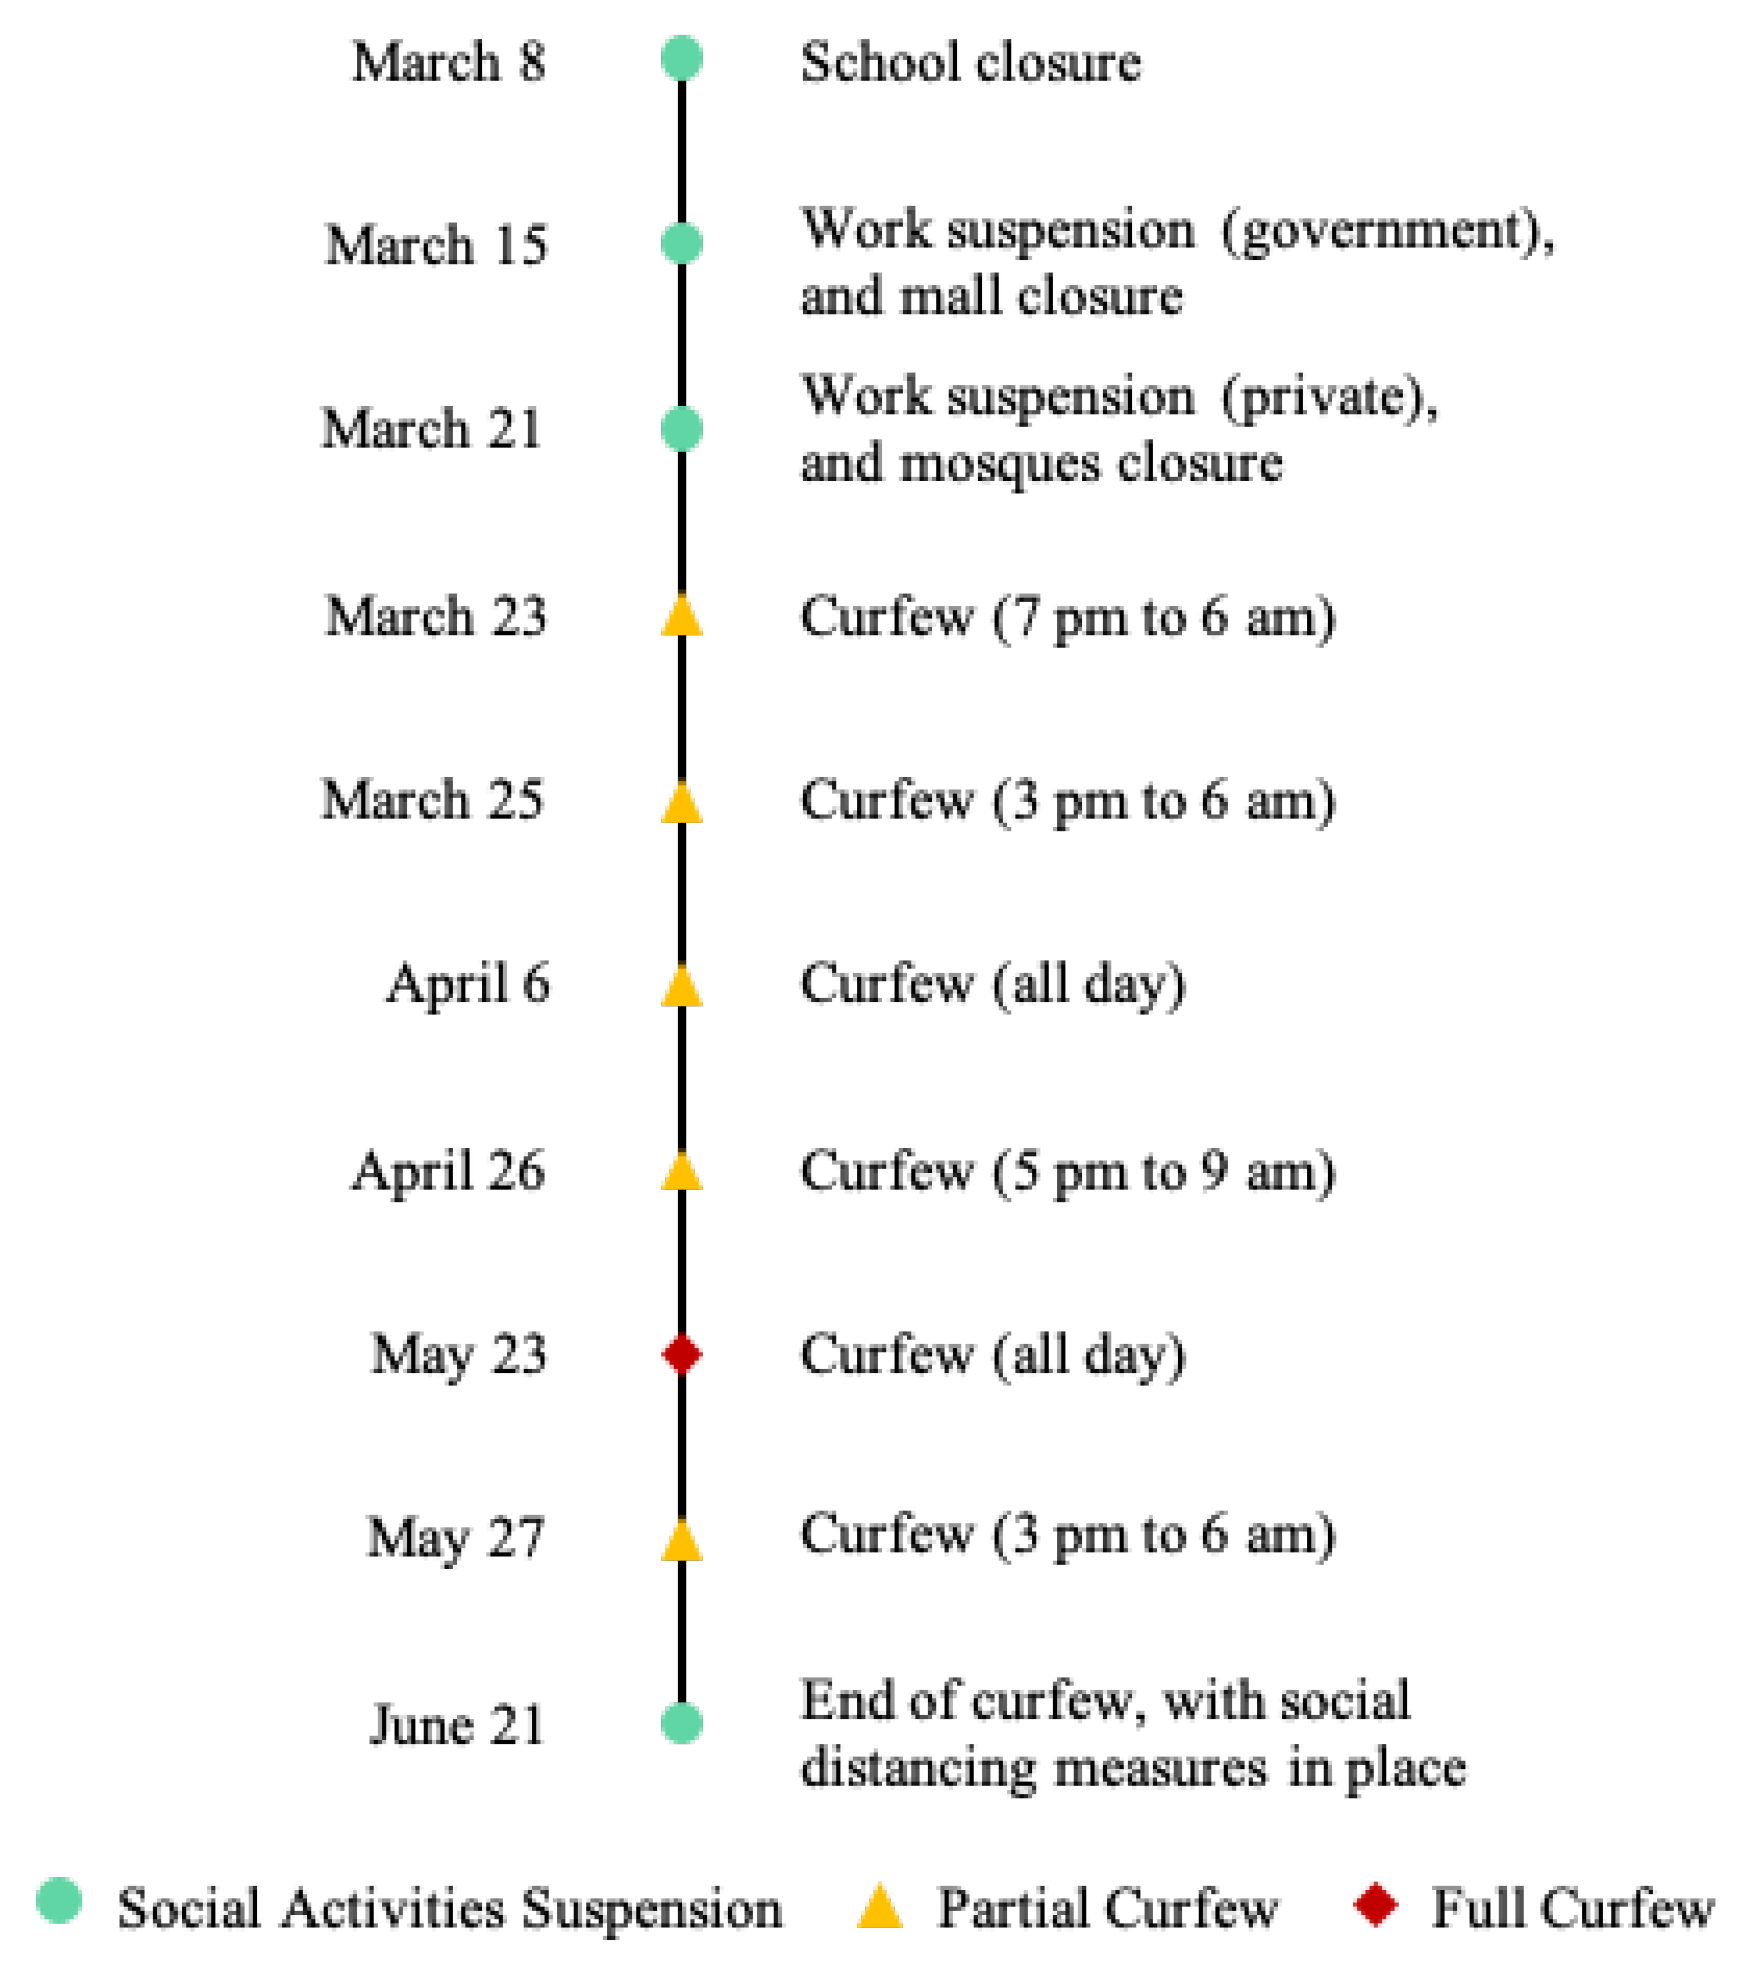
3.2. Social Distancing Policies

Since the first case of COVID-19 was detected in the KSA on 2 March 2020, the KSA implemented a series of actions to prevent the spread of the virus, as summarized in Figure 1. Since 21 June, the Saudi government lifted the curfew on most of the regions in the country. However, less strict social distancing measures are still enforced, e.g., many large social gathering activities remain restricted.

3.3. Demand Trends during Social Distancing

Figure 2 shows the hourly demand used in this study from the beginning of 2020 until 21 June 2020. Figure 2 categorizes the policies in the previous subsection as either (a) social activity suspensions, (b) partial curfew, or (c) full curfew. The electricity demand and temperature data are described in Appendix A.
A decreasing trend in the electricity demand occurs during the full curfew periods. Furthermore, a general increase in the demand can be observed as summer approaches at the end of April. As the imposed social distancing policies became stricter (i.e., from the green period to the red period), weekday demand profiles became more similar to weekend profiles. In addition, we observe that the magnitude of the oscillation in the daily demand during the middle of the full curfew period was less than the other periods. The average daily variation between the peak and valley during April 2020 is estimated to be 4.92 GW (i.e., 8.1% of the 2019 peak demand), as compared with variations of 6.00–6.79 GW (i.e., 9.8% to 11.1% of the 2019 peak demand) observed since April 2016. Such findings suggest that the demand concentration in the residential sector leads to a more similar consumption behavior due to the reduced consumption distribution over the day, i.e., similar energy end-use and appliance efficiency over the day. Table 1 depicts the relationship between the peak demand and temperature in April. Comparing 2020 with 2019, the peak demand and energy consumption in April increased by 3.53% and by 3.15%, respectively.

3.4. Relationship between Demand and Temperature

Figure 3 shows the daily peak demand and average temperature of the KSA from the beginning of 2020 until 21 June 2020, as well as a zoomed-in view of the full curfew period from 6 to 26 April 2020. We observe that the demand generally follows the temperature. In addition, an increase, followed by a sudden decrease, in the temperature coincides with the full curfew periods. Therefore, specifying the exact reduction in electricity demand that can be attributed to the curfew is difficult. Nonetheless, we observe an increase in the correlation between the electricity demand and temperature during the full curfew periods. Figure 3 also shows how closely the demand correlates with the temperature during the first full curfew. We used the linear correlation coefficient to measure the temperature-demand relationship, as described in Appendix B. Relative to the last four years (2016–2019), April and May 2020 had record-high levels of linear correlation coefficients between the electricity demand and temperature for the study period. Figure 4 shows the variability in the linear correlation value over the last five years. During the winter months (January and February), the demand correlation with the temperature is low in the KSA, as the demand dependence on the temperature is low in the winter.
Considering the full curfew enforced in April, we observe an interesting reduced-lag behavior between the electricity demand and temperature. Normally, the correlation between the hourly electricity demand and ambient temperature of the same hour is high; however, the correlation with the temperature of the previous hours is higher. This can be observed in the electricity demand profile shown in Figure 5 (April 2019). We observe that the demand lags behind the temperature with respect to time. This is generally attributed to the response of a cooling system to the changing temperature. As the ambient temperature increases, the thermal energy begins to penetrate the walls of the buildings. However, a building’s inner temperature only substantially increases when enough energy has transferred through the walls. This process requires time and is dependent on the installed thermal insulation, causing the “lagged” increase in the demand with the response of the cooling systems. During the full curfew periods, however, we observe a reduction in the lag between the demand and temperature. Figure 6 shows the electricity demand for three days during the first full curfew (April 2020). Comparing the demand profiles in Figure 5 and Figure 6, the demand between 9 a.m. and 2 p.m. increases rapidly as the temperature rises during the full curfew, while the demand increase in response to the rise in temperature is slower during the same period of the previous year.
A more general view of the lag reduction relative to previous years can be observed in Figure 7. The y-axis in Figure 7 shows the linear correlation between the demand at hour hd and the temperature at hour ht. The x-axis indicates the number of hours that the demand lags behind the temperature (lag = hd − ht). The correlation in April 2020 peaks at a 3-h lag while the peak correlation for the last four years was between 4 and 5 h. The hour when the peak correlation occurs can be used as a measure to obtain the response time of the demand to a change in the temperature. In April 2020, faster responses were observed for the demand to the changes in temperature. This may be attributed to a shift toward residential cooling and the associated inefficient insulation in residential buildings. Inefficient insulation yields a more rapid response in the cooling demand to changes in the temperature.

4. Further Discussion

4.1. Temperature, Cooling, and Other Countries

In countries such as the KSA, where temperatures are extremely high, the annual peak demand typically coincides with extremely hot weather from June to August (in the Northern Hemisphere) [48]. The cooling demand is specifically important due to the impact that climate change has on the ambient temperature [49]. In this paper we demonstrated how an event such as the pandemic can change the relationship between the electricity demand and temperature. The concentration of the demand on the residential sector change the response of the demand to the temperature variation. We want to empathize here that it has become crucial to understand the socioeconomic changes that affect the demand to design improved future energy policies.

4.2. Inferring Socioeconomic Changes from COVID-19 Demand

The decreases in electricity demand reported in many countries results in reductions to overall operation costs and CO 2 emissions during strict social distancing. However, we need to be careful before making inferences about socioeconomic changes without considering the other external factors influencing the demand, such as changes to social structures and temperature variations as well as their interdependencies with the electricity demand. The electricity demand during COVID-19 has previously been used to infer information on socioeconomic and environmental changes. Numerous studies have used the electricity demand as a tool to analyze the changes occurring in other systems (e.g., socioeconomic [50,51] and greenhouse emissions [14,52]). In our study, we show that the impact of the temperature variation on the demand during strict social distancing policies has a profound influence, which complicates the process of extracting social insights based solely on the electricity demand data. To extract useful socioeconomic insights using the electricity demand, we need to consider the interdependence of the electricity demand, temperature, and social factors using multivariate time series analysis (see [41,53] for further reading about exploring the interdependence of multivariate time series).

5. Concluding Remarks and Future Work

Social distancing policies imposed to mitigate the spread of COVID-19 have disturbed normal electricity consumption behavior. Due to inhibited mobility, there has been an increase in the in-home hours of consumers. Resulting changes in the contributions of different sectors are highlighted by an increase in the residential contribution to the electricity demand. In our case study, we showed that the correlation between the temperature and demand increased dramatically during full curfew period in Saudi Arabia. Furthermore, we showed that the dynamic impact of temperature has changed due to social distancing measures. This can be attributed to the increased percentage of cooling loads due to an increase in the temperature and change in the efficiency of the loads in different sectors. Hence, the results indicate that social distancing measures have clearly changed the relationship between the electricity demand and temperature variation. This is especially salient in regions with high cooling/heating usage.
The data show a change in the demand–temperature relationship compared to previous years due to social distancing measures. Although we quantified the changes in the time lag during the full curfew, further analysis is required to understand how changing energy end-use efficiency affects the residential demand. Our future studies will build on this finding to further understand the demand–temperature relationship during large social changes. Furthermore, COVID-19 data provide an important opportunity to validate different building models, as people are heavily concentrated at home. Historical demand data during the imposed policies and curfews provide the opportunity to better understand the electricity demand. Mobility restrictions during the curfews shifted the demand consumption from different sectors to the residential sector, establishing a potentially semi-isolated environment for a natural examination of the loads. Furthermore, the occurrence of the imposed policies coincides with a seasonal transition period. The large temperature variations during the transition season allow us to better understand the relationship between the electricity demand and temperature.
The uncertainty surrounding the pandemic remains a major concern. Restrictions and regulations are continuously being reviewed with the evolution of the pandemic. Even after lifting the social distancing policies, people may remain hesitant about going to their workplaces and many organizations may continue using the WFH concept. We, therefore, do not expect a rapid transition away from the consumer behaviors associated with COVID-19. The industrial and commercial demands will strongly depend on the economic recovery, which may lead to a longer-term change in the total electricity demand.

Author Contributions

Conceptualization, A.A., D.K.M., M.A. (Mohannad Alkhraijah), M.A. (Maad Alowaifeer) and M.A. (Mansour Alsaleh); Methodology, M.A. (Mohannad Alkhraijah) and M.A. (Maad Alowaifeer); Formal analysis, M.A. (Mohannad Alkhraijah) and M.A. (Maad Alowaifeer); Visualization, M.A. (Mohannad Alkhraijah) and M.A. (Maad Alowaifeer); Data curation, M.A. (Mansour Alsaleh); Writing—original draft, M.A. (Mohannad Alkhraijah) and M.A. (Maad Alowaifeer); Writing—review & editing, A.A., D.K.M. and M.A. (Mansour Alsaleh); Supervision, D.K.M. and M.A. (Mansour Alsaleh). All authors have read and agreed to the published version of the manuscript.

Funding

This research was supported in part by King Abdulaziz City for Science and Technology.

Institutional Review Board Statement

Not applicable.

Informed Consent Statement

Not applicable.

Data Availability Statement

Data available on request due to restrictions eg privacy or ethical.

Acknowledgments

The authors would like to thank the anonymous reviewers for their valuable comments which helped us improve the paper to reach its present form. The authors acknowledge and appreciate the cooperation of the Saudi Electricity Company in providing the dataset of this study. Also, the authors thank Abdullah Alhadlaq for collecting and pre-processing the datasets.

Conflicts of Interest

The authors declare no conflict of interest.

Appendix A. Datasets

This section describes the two datasets used in our case study: the electricity demand and ambient temperature of the KSA.
Figure A1. KSA electricity demand and Riyadh city temperature data for 2019.
Energies 14 00473 g0a1
Figure A2. Probability density function of the electricity demand of KSA and the temperature data of Riyadh city for 2019.
Energies 14 00473 g0a2

Appendix A.1. Electricity Demand Data

The electricity demand data used in this study represent the aggregate demand of the KSA measured from the generation side, spanning 4.5 years from 1 January 2016 to 30 June 2020. The data for 2020 encapsulate all the imposed social distancing policies (from school closures on 8 March until end of curfew on 21 June). Figure A2 (left) shows the histogram of the electricity demand for the most recent complete year (2019). We observe two components in the histogram, where the first represents the winter demand and the second represents the summer demand.

Appendix A.2. Ambient Temperature Data

Similar to the electricity demand data, we obtained the ambient temperature data from 1 January 2016 to 30 June 2020. The data were collected from three weather stations located in three major cities, each having the highest population in its operational area. The station coordinates and the cities are: (1) Riyadh [24.75 N, 46.75 E], (2) Jeddah [21.50 N, 39.25 E], and (3) Al-Ahsa [25.23 N, 49.35 E]. The histogram of Riyadh’s ambient temperature in 2019 is shown in Figure A2 (right). Furthermore, Figure A1 shows the scatter plot of the electricity demand (y-axis) and the temperature (x-axis). The figure clearly shows the linear correlation between the electricity demand and temperature.

Appendix B. Linear Correlation Coefficient

We used the linear correlation coefficient to measure the temperature-demand relationship between the electricity demand and temperature as follows:
ρ ( X , Y ) = Cov ( X , Y ) Var ( X ) Var ( Y ) ,
where X and Y are random variables and Var and Cov are the variance and covariance, respectively. Values closer to a linear correlation coefficient of 1 or −1 indicate a strong linear association between X and Y. A value of 1 represents a perfect direct relationship between the variables X and Y, while a value of −1 indicates a perfect inverse relationship between these variables. A value of 0 indicates that no correlation exists between these variables.

References

  1. WHO. Weekly Update on COVID-19 11 January 2021; World Health Organization (WHO): Geneva, Switzerland, 2021. [Google Scholar]
  2. Hale, T.; Petherick, A.; Phillips, T.; Webster, S. Variation in Government Responses to COVID-19; Working Paper; Blavatnik School of Government: Oxford, UK, 2020; Volume 31. [Google Scholar]
  3. Sun, C.; Zhai, Z. The efficacy of social distance and ventilation effectiveness in preventing COVID-19 transmission. Sustain. Cities Soc. 2020, 62, 102390. [Google Scholar] [CrossRef] [PubMed]
  4. Chintalapudi, N.; Battineni, G.; Amenta, F. COVID-19 disease outbreak forecasting of registered and recovered cases after sixty day lockdown in Italy: A data driven model approach. J. Microbiol. Immunol. Infect. 2020, 53, 396–403. [Google Scholar] [CrossRef] [PubMed]
  5. Olivera-La Rosa, A.; Chuquichambi, E.G.; Ingram, G.P. Keep your (social) distance: Pathogen concerns and social perception in the time of (COVID-19). Personal. Individ. Differ. 2020, 166, 110200. [Google Scholar] [CrossRef] [PubMed]
  6. Gerhold, L. COVID-19: Risk Perception and Coping Strategies; Freie Universitat: Berlin, Germany, 2020. [Google Scholar]
  7. Baker, S.R.; Farrokhnia, R.A.; Meyer, S.; Pagel, M.; Yannelis, C. How Does Household Spending Respond to An Epidemic? Consumption during the 2020 COVID-19 Pandemic; Technical Report 26949; National Bureau of Economic Research: Cambridge, MA, USA, 2020. [Google Scholar]
  8. Sheth, J. Impact of COVID-19 on consumer behavior: Will the old habits return or die? J. Bus. Res. 2020, 177, 280–283. [Google Scholar] [CrossRef] [PubMed]
  9. Donthu, N.; Gustafsson, A. Effects of COVID-19 on business and research. J. Bus. Res. 2020, 117, 284. [Google Scholar] [CrossRef] [PubMed]
  10. Chen, C.F.; de Rubens, G.Z.; Xu, X.; Li, J. Coronavirus comes home? Energy use, home energy management, and the social-psychological factors of COVID-19. Energy Res. Soc. Sci. 2020, 68, 101688. [Google Scholar] [CrossRef]
  11. Roggeveen, A.L.; Sethuraman, R. How the COVID pandemic may change the world of retailing. J. Retail. 2020, 96, 169–171. [Google Scholar] [CrossRef]
  12. Klemeš, J.J.; Van Fan, Y.; Tan, R.R.; Jiang, P. Minimising the present and future plastic waste, energy and environmental footprints related to COVID-19. Renew. Sustain. Energy Rev. 2020, 127, 109883. [Google Scholar] [CrossRef]
  13. Ozili, P.K.; Arun, T. Spillover of COVID-19: Impact on the global economy. SSRN 2020, 3562570. [Google Scholar] [CrossRef] [Green Version]
  14. Gillingham, K.T.; Knittel, C.R.; Li, J.; Ovaere, M.; Reguant, M. The short-run and long-run effects of COVID-19 on energy and the environment. Joule 2020, 4, 1337–1341. [Google Scholar] [CrossRef]
  15. del Rio-Chanona, R.M.; Mealy, P.; Pichler, A.; Lafond, F.; Farmer, D. Supply and demand shocks in the COVID-19 pandemic: An industry and occupation perspective. arXiv 2020, arXiv:2004.06759. [Google Scholar] [CrossRef]
  16. Paul, S.K.; Chowdhury, P. A production recovery plan in manufacturing supply chains for a high-demand item during COVID-19. Int. J. Phys. Distrib. Logist. Manag. 2020. [Google Scholar] [CrossRef]
  17. Abu-Rayash, A.; Dincer, I. Analysis of the electricity demand trends amidst the COVID-19 coronavirus pandemic. Energy Res. Soc. Sci. 2020, 68, 101682. [Google Scholar] [CrossRef] [PubMed]
  18. Global Energy Review 2020: The Impact of the COVID-19 Crisis on Global Energy Demand and CO2 Emissions; International Energy Agency: Paris, France, 2020.
  19. Data and Statistics: National Electricity Registry. Technical Report, Saudi Arabia Electricity & Cogeneration Regulatory Authority, Riyadh, Saudi Arabia. 2019. Available online: https://www.ecra.gov.sa/en-us/DataAndStatistics/NationalRecord/HistoricalData/Pages/Home.aspx (accessed on 12 December 2020).
  20. Load Forecasting Model Whitepaper; Technical Report; PJM Interconnection Resource Adequacy Planning Department: Pittsburg, PA, USA, 2016.
  21. Howarth, N.; Odnoletkova, N.; Alshehri, T.; Almadani, A.; Lanza, A.; Patzek, T. Staying cool in a warming climate: Temperature, electricity and air conditioning in Saudi Arabia. Climate 2020, 8, 4. [Google Scholar] [CrossRef] [Green Version]
  22. Narajewski, M.; Ziel, F. Changes in electricity demand pattern in Europe due to COVID-19 shutdowns. arXiv 2020, arXiv:2004.14864. [Google Scholar]
  23. The Future of Cooling: Opportunities for Energy-Efficient Air Conditioning; International Energy Agency: Paris, France, 2018; Available online: https://www.iea.org/reports/the-future-of-cooling (accessed on 12 December 2020).
  24. Waite, M.; Cohen, E.; Torbey, H.; Piccirilli, M.; Tian, Y.; Modi, V. Global trends in urban electricity demands for cooling and heating. Energy 2017, 127, 786–802. [Google Scholar] [CrossRef] [Green Version]
  25. Sivak, M. Potential energy demand for cooling in the 50 largest metropolitan areas of the world: Implications for developing countries. Energy Policy 2009, 37, 1382–1384. [Google Scholar] [CrossRef]
  26. Miller, N.L.; Hayhoe, K.; Jin, J.; Auffhammer, M. Climate, extreme heat, and electricity demand in California. J. Appl. Meteorol. Climatol. 2008, 47, 1834–1844. [Google Scholar] [CrossRef]
  27. Conevska, A.; Urpelainen, J. Weathering electricity demand? Seasonal variation in electricity consumption among off-grid households in rural India. Energy Res. Soc. Sci. 2020, 65, 101444. [Google Scholar] [CrossRef]
  28. Valor, E.; Meneu, V.; Caselles, V. Daily air temperature and electricity load in Spain. J. Appl. Meteorol. 2001, 40, 1413–1421. [Google Scholar] [CrossRef]
  29. Invidiata, A.; Ghisi, E. Impact of climate change on heating and cooling energy demand in houses in Brazil. Energy Build. 2016, 130, 20–32. [Google Scholar] [CrossRef]
  30. Yi-Ling, H.; Hai-Zhen, M.; Guang-Tao, D.; Jun, S. Influences of urban temperature on the electricity consumption of Shanghai. Adv. Clim. Chang. Res. 2014, 5, 74–80. [Google Scholar] [CrossRef]
  31. Alyousef, Y.; Varnham, A. Saudi Arabia’s National Energy Efficiency Programme: Description, achievements and way forward. Int. J. Low Carbon Technol. 2010, 5, 291–297. [Google Scholar] [CrossRef]
  32. Alshahrani, J.; Boait, P. Reducing high energy demand associated with air-conditioning needs in Saudi Arabia. Energies 2019, 12, 87. [Google Scholar] [CrossRef] [Green Version]
  33. Dubey, K.; Howarth, N.; Krarti, M. Evaluating Building Energy Efficiency Investment Options for Saudi Arabia; Technical Report KS-1655-DP049A; King Abdullah Petroleum Studies and Research Center (KAPSARC): Riyadh, Saudi Arabia, 2016. [Google Scholar]
  34. Faruqui, A.; Hledik, R.; Wikler, G.; Ghosh, D.; Prijyanonda, J.; Dayal, N. Bringing Demand-Side Management to the Kingdom of Saudi Arabia; The Brattle Group: Boston, MA, USA, 2011. [Google Scholar]
  35. Energy Production in the First Two Months of 2020. Technical Report, National Bureau of Statistics of China. 2020. Available online: http://www.stats.gov.cn/english/PressRelease/202003/t20200317_1732703.html (accessed on 12 December 2020).
  36. The COVID-19 Crisis and Clean Energy Progress; Technical Report; International Energy Agency: Paris, France, 2020.
  37. Bahmanyar, A.; Estebsari, A.; Ernst, D. The impact of different COVID-19 containment measures on electricity consumption in Europe. Energy Res. Soc. Sci. 2020, 68, 101683. [Google Scholar] [CrossRef]
  38. Lee, A.; DeVilbiss, J. Daily Electricity Demand Impacts from COVID-19 Mitigation Efforts Differ by Region; Technical Report; International Energy Agency: Paris, France, 2020. [Google Scholar]
  39. Meinrenken, C.J.; Modi, V.; Mckeown, K.R.; Culligan, P.J. New Data Suggest COVID-19 Is Shifting the Burden of Energy Costs to Households; Technical Report; Earth Institute Columbia University: New York, NY, USA, 2020. [Google Scholar]
  40. Ruan, G.; Wu, J.; Zhong, H.; Xia, Q.; Xie, L. Quantitative Assessment of US Bulk Power Systems and Market Operations during the COVID-19 Pandemic. EnerarXiv 2020. Available online: http://www.enerarxiv.org/page/thesis.html?id=2196 (accessed on 12 December 2020).
  41. Ruan, G.; Wu, D.; Zheng, X.; Sivaranjani, S.; Zhong, H.; Kang, C.; Dahleh, M.A.; Xie, L. A cross-domain approach to analyzing the short-run impact of COVID-19 on the US electricity sector. Joule 2020, 4, 11. [Google Scholar] [CrossRef]
  42. Aruga, K.; Islam, M.; Jannat, A. Effects of COVID-19 on Indian energy consumption. Sustainability 2020, 12, 5616. [Google Scholar] [CrossRef]
  43. Brynjolfsson, E.; Horton, J.J.; Ozimek, A.; Rock, D.; Sharma, G.; TuYe, H.Y. COVID-19 and Remote Work: An Early Look at US Data; Technical Report; National Bureau of Economic Research: Cambridge, MA, USA, 2020. [Google Scholar]
  44. Cicala, S. Early Economic Impacts of COVID-19 in Europe: A View from the Grid; Technical Report; University of Chicago: Chicago, IL, USA, 2020. [Google Scholar]
  45. Kaushik, M.; Guleria, N. The Impact of Pandemic COVID-19 in Workplace. Eur. J. Bus. Manag. 2020, 12. [Google Scholar] [CrossRef]
  46. William Blair Education Team. Education and Training Market Analysis: Immediate and Systemic Impact of COVID-19; William Blair & Company: Chicago, IL, USA, 2020. [Google Scholar]
  47. Al Zohbi, G.; AlAmri, F.G. Current situation of renewable energy in Saudi Arabia: Opportunities and challenges. J. Sustain. Dev. 2020, 13, 98. [Google Scholar] [CrossRef]
  48. Shourav, M.S.A.; Shahid, S.; Singh, B.; Mohsenipour, M.; Chung, E.S.; Wang, X.J. Potential impact of climate change on residential energy consumption in Dhaka City. Environ. Model. Assess. 2018, 23, 131–140. [Google Scholar] [CrossRef]
  49. Hartmann, D.L.; Tank, A.M.K.; Rusticucci, M.; Alexander, L.V.; Brönnimann, S.; Charabi, Y.A.R.; Dentener, F.J.; Dlugokencky, E.J.; Easterling, D.R.; Kaplan, A.; et al. Observations: Atmosphere and surface. In Climate Change 2013: The Physical Science Basis; Cambridge University Press: Cambridge, UK, 2013; pp. 159–254. [Google Scholar]
  50. Das, A.; Mishra, S. India Growth Forecast for 2020–21. arXiv 2020, arXiv:2005.06461. [Google Scholar]
  51. Chen, S.; Igan, D.; Pierri, N.; Presbitero, A.F. Tracking the Economic Impact of COVID-19 and Mitigation Policies in Europe and the United States; Technical Report; International Monetary Fund: Washington, DC, USA, 2020. [Google Scholar]
  52. Yusup, Y.; Kayode, J.S.; Ahmad, M.I.; Yin, C.S.; Hisham, M.S.M.N.; Isa, H.M. Atmospheric CO2 and total electricity production before and during the nation-wide restriction of activities as a consequence of the COVID-19 pandemic. arXiv 2020, arXiv:2006.04407. [Google Scholar]
  53. Miranian, A.; Abdollahzade, M.; Hassani, H. Day-ahead electricity price analysis and forecasting by singular spectrum analysis. IET Gener. Transm. Distrib. 2013, 7, 337–346. [Google Scholar] [CrossRef]
Figure 1. Social distancing policies imposed by the KSA.
Energies 14 00473 g001
Figure 2. Hourly demand from 1 January 2020, to 21 June 2020, during different levels of social distancing measures.
Energies 14 00473 g002
Figure 3. Daily electricity demand and ambient temperature from 1 January 2020, to 1 July 2020, before and during the imposed social distancing policies, and a zoom-in from 6–26 April 2020, during full curfew.
Energies 14 00473 g003
Figure 4. The correlation between the electricity demand and temperature from 2016 to 2020.
Energies 14 00473 g004
Figure 5. Electricity demands and temperatures from 13–15 April 2019.
Energies 14 00473 g005
Figure 6. Electricity demands and temperatures from 12–14 April 2020, during full curfew.
Energies 14 00473 g006
Figure 7. The correlation between the electricity demand and temperature lags in the month of April from 2016 to 2020.
Energies 14 00473 g007
Table 1. Demand and temperature of month of April in the KSA from 2016–2020.
Year20162017201820192020
Peak Demand (GW)45.7044.1445.0946.8845.76
Total Energy (TWh)23.5922.8723.5824.8422.24
Max. Temp. ( C)40.038.038.038.039.4
Ave. Temp. ( C)27.924.926.228.326.0
Min. Temp. ( C)17.513.017.016.18.8
Max. Daily
Temp. Variation ( C)
22.525.021.023.323.2
Publisher’s Note: MDPI stays neutral with regard to jurisdictional claims in published maps and institutional affiliations.

