Comparison of Factorial and Latin Hypercube Sampling Designs for Meta-Models of Building Heating and Cooling Loads
Abstract
:1. Introduction
2. Methods
2.1. Baseline Model Selection and Main Assumptions
2.2. Design of Experiments
3. Results and Discussion
3.1. Development of the Meta-Models
3.2. Comparison of the Accuracy of FFD and LHS
3.2.1. Comparison of the Meta-Model Accuracy for FFD Validation Set
3.2.2. Comparison of the Meta-Model Accuracy for LHS Validation Set
3.3. Analysis of Factor Influences
4. Conclusions
Author Contributions
Funding
Institutional Review Board Statement
Informed Consent Statement
Data Availability Statement
Conflicts of Interest
Nomenclature
| ACR | air leakage (ACH) |
| AR | aspect ratio |
| BHCL | building heating and cooling load |
| CCD | central composite design |
| CH | ceiling height (m) |
| coefficient | |
| FA | floor area (m2) |
| FFD | fractional factorial design |
| total number of data | |
| LHS | Latin hypercube sampling |
| degree of freedom, number of validation points | |
| OR | orientation (degrees) |
| PH | plenum height (m) |
| RMSE | root mean square errors |
| SHGC | solar heat gain coefficients (%) |
| WDI | window insulation (W/m2 K) |
| WI | wall insulation (W/m2 K) |
| WWR | window-to-wall ratio (%) |
| design variables | |
| TRNSYS estimated loads (k Wh/m2 yr) | |
| response variable | |
| predicted loads (k Wh/m2 yr) | |
| residual of the regression | |
| Subscripts | |
| integer counter |
Appendix A
| Fractional Factorial Sampling (Meta-Model a-1, Sampling Number: 512) | Latin Hypercube Sampling (Meta-Model b-2, Sampling Number: 512) | ||||||
|---|---|---|---|---|---|---|---|
| Factor | Coefficient | Factor | Coefficient | Factor | Coefficient | Factor | Coefficient |
| (Intercept) | −19.74 | FA:SHGC | 5.09E−05 | (Intercept) | −26.5 | FA:WDI | −0.00316 |
| AR | −0.4107 | FA:WWR | −5.8E−05 | AR | −1.009 | FA:SHGC | 0.000189 |
| FA | 0.004394 | FA:WI | −0.00482 | FA | 0.004271 | FA:WWR | −7.8E−05 |
| CH | 4.888 | FA:ACR | −0.00116 | CH | 6.91 | FA:WI | −0.00312 |
| PH | 2.921 | CH:WDI | 1.54 | PH | −1.152 | FA:OR | −5.8E−06 |
| WDI | −2.606 | CH:SHGC | −0.05731 | WDI | −0.215 | FA:I(SHGC^2) | −1.9E−06 |
| SHGC | 0.1946 | CH:WWR | 0.03245 | SHGC | 1.254 | FA:I(WDI^2) | 0.000439 |
| WWR | 0.0607 | CH:WI | 2.985 | WWR | 0.1274 | CH:WDI | 3.798 |
| WI | 11.65 | CH:ACR | 21.2 | WI | 1.113 | CH:SHGC | −0.1626 |
| ACR | −9.729 | PH:WDI | 1.462 | ACR | −18.79 | CH:WWR | 0.03005 |
| OR | −0.0115 | PH:SHGC | −0.0389 | OR | −0.05114 | CH:WI | 6.2 |
| AR:FA | −0.00023 | PH:WWR | 0.04828 | I(SHGC^2) | −0.01724 | CH:ACR | 20.66 |
| AR:CH | 0.2574 | PH:WI | 4.248 | I(WDI^2) | −1.113 | CH:OR | 0.01076 |
| AR:WDI | 0.3186 | PH:ACR | 7.721 | AR:PH | 1.001 | CH:I(SHGC^2) | 0.001321 |
| AR:SHGC | −0.0069 | WDI:SHGC | −0.02956 | AR:WDI | 1.258 | CH:I(WDI^2) | −0.4713 |
| AR:WWR | 0.01086 | WDI:WWR | 0.1064 | AR:SHGC | −0.05625 | PH:WDI | 0.9934 |
| AR:OR | 0.002964 | WDI:WI | 0.6382 | AR:OR | 0.007653 | PH:SHGC | −0.102 |
| FA:CH | −0.00068 | WDI:ACR | 1.479 | AR:I(SHGC^2) | 0.000671 | PH:WWR | 0.04976 |
| FA:PH | −0.00124 | WDI:OR | 0.001436 | AR:I(WDI^2) | −0.2225 | PH:WI | 7.536 |
| FA:WDI | −0.00171 | SHGC:WWR | −0.00271 | FA:CH | −0.00129 | PH:ACR | 10.43 |
| Fractional Factorial Sampling (Meta-Model a-1, Sampling Number: 512) | Latin Hypercube Sampling (Meta-Model b-2, Sampling Number: 512) | ||||||
|---|---|---|---|---|---|---|---|
| Factor | Coefficient | Factor | Coefficient | Factor | Coefficient | Factor | Coefficient |
| (Intercept) | 64.26 | FA:WI | 0.002763 | (Intercept) | 56.58 | FA:WDI | 0.00051 |
| AR | −1.47 | FA:ACR | −0.00197 | AR | −2.57 | FA:SHGC | −0.00017 |
| FA | 0.007343 | CH:SHGC | 0.07293 | FA | 0.009083 | FA:WWR | −7.7E−05 |
| CH | −2.811 | CH:WWR | 0.07476 | CH | −1.513 | FA:I(SHGC^2) | 6.71E−07 |
| PH | −2.543 | PH:WDI | −0.5328 | PH | −1.738 | CH:SHGC | 0.06898 |
| WDI | −3.046 | PH:SHGC | 0.08419 | WDI | −0.2447 | CH:WWR | 0.07604 |
| SHGC | −0.1781 | PH:WWR | 0.05117 | SHGC | −0.01485 | PH:SHGC | 0.07062 |
| WWR | −0.2029 | WDI:SHGC | 0.05068 | WWR | −0.313 | PH:WWR | 0.04219 |
| WI | −11.52 | WDI:WWR | −0.03779 | WI | −9.937 | PH:OR | 0.01052 |
| ACR | −13.18 | WDI:ACR | 2.941 | ACR | −16.71 | WDI:SHGC | 0.2018 |
| OR | −0.02924 | SHGC:WWR | 0.008425 | OR | −0.04141 | WDI:WWR | −0.1112 |
| AR:FA | −0.0002 | SHGC:WI | −0.02208 | I(SHGC^2) | 0.000367 | WDI:ACR | 6.495 |
| AR:WDI | −0.1019 | SHGC:ACR | −0.09084 | I(WDI^2) | 0.1003 | WDI:I(SHGC^2) | −0.00488 |
| AR:SHGC | 0.02076 | SHGC:OR | −0.00013 | AR:PH | −0.7593 | SHGC:WWR | 0.01565 |
| AR:WWR | 0.01458 | WWR:WI | 0.06953 | AR:SHGC | 0.07467 | SHGC:ACR | −0.3382 |
| AR:OR | 0.02109 | WI:ACR | 5.886 | AR:WWR | 0.03442 | SHGC:I(WDI^2) | −0.09947 |
| FA:CH | −0.00092 | AR:OR | 0.02044 | WWR:WI | 0.1422 | ||
| FA:WDI | 0.000441 | AR:I(SHGC^2) | −0.00061 | WWR:ACR | 0.05938 | ||
| FA:SHGC | −0.00011 | AR:I(WDI^2) | −0.05166 | WWR:I(SHGC^2) | −9E−05 | ||
| FA:WWR | −8.7E−05 | FA:CH | −0.0015 | WWR:I(WDI^2) | 0.01679 | ||
References
- Allouhi, A.; El Fouih, Y.; Kousksou, T.; Jamil, A.; Zeraouli, Y.; Mourad, Y. Energy consumption and efficiency in buildings: Current status and future trends. J. Clean. Prod. 2015, 109, 118–130. [Google Scholar] [CrossRef]
- Large Building Energy Consumption Rankings Revealed | Seoul Information & Communication Plaza (Public Information). 2018. Available online: https://opengov.seoul.go.kr/press/18994915 (accessed on 1 February 2020).
- Gratia, E.; De Herde, A. A simple design tool for the thermal study of an office building. Energy Build. 2002, 34, 279–289. [Google Scholar] [CrossRef]
- Chlela, F.; Husaunndee, A.; Inard, C.; Riederer, P. A new methodology for the design of low energy buildings. Energy Build. 2009, 41, 982–990. [Google Scholar] [CrossRef]
- Jaffal, I.; Inard, C.; Ghiaus, C. Fast method to predict building heating demand based on the design of experiments. Energy Build. 2009, 41, 669–677. [Google Scholar] [CrossRef]
- Hygh, J.S.; DeCarolis, J.F.; Hill, D.B.; Ranji Ranjithan, S. Multivariate regression as an energy assessment tool in early building design. Build. Environ. 2012, 57, 165–175. [Google Scholar] [CrossRef]
- Gong, X.; Akashi, Y.; Sumiyoshi, D. Optimization of passive design measures for residential buildings in different Chinese areas. Build. Environ. 2012, 58, 46–57. [Google Scholar] [CrossRef]
- Catalina, T.; Iordache, V.; Caracaleanu, B. Multiple regression model for fast prediction of the heating energy demand. Energy Build. 2013, 57, 302–312. [Google Scholar] [CrossRef]
- Xu, J.; Kim, J.-H.; Hong, H.; Koo, J. A systematic approach for energy efficient building design factors optimization. Energy Build. 2015, 89, 87–96. [Google Scholar] [CrossRef]
- Jaffal, I.; Inard, C. A metamodel for building energy performance. Energy Build. 2017, 151, 501–510. [Google Scholar] [CrossRef]
- Delgarm, N.; Sajadi, B.; Kowsary, F.; Delgarm, S. Multi-Objective optimization of the building energy performance: A simulation-based approach by means of particle swarm optimization (PSO). Appl. Energy 2016, 170, 293–303. [Google Scholar] [CrossRef]
- Yong, S.-G.; Kim, J.; Cho, J.; Koo, J. Meta-Models for building energy loads at an arbitrary location. J. Build. Eng. 2019, 25, 100823. [Google Scholar] [CrossRef]
- Li, A.; Xiao, F.; Fan, C.; Hu, M. Development of an ANN-based building energy model for information-poor buildings using transfer learning. Build. Simul. 2021, 14, 89–101. [Google Scholar] [CrossRef]
- Lee, S.; Cho, S.; Kim, S.-H.; Kim, J.; Chae, S.; Jeong, H.; Kim, T. Deep neural network approach for prediction of heating energy consumption in old houses. Energies 2020, 14, 1. [Google Scholar] [CrossRef]
- Vakharia, V.; Vaishnani, S.; Thakker, H. Appliances Energy Prediction Using Random Forest Classifier; Springer: Singapore, 2021; pp. 405–410. [Google Scholar]
- Thrampoulidis, E.; Mavromatidis, G.; Lucchi, A.; Orehounig, K. A machine learning-based surrogate model to approximate optimal building retrofit solutions. Appl. Energy 2021, 281, 116024. [Google Scholar] [CrossRef]
- Aghaei Pour, P.; Rodemann, T.; Hakanen, J.; Miettinen, K. Surrogate assisted interactive multiobjective optimization in energy system design of buildings. Optim. Eng. 2021, 1–25. [Google Scholar] [CrossRef]
- Heckert, N.A.; Filliben, J.J.; Croarkin, C.M.; Hembree, B.; Guthrie, W.F.; Tobias, P.; Prinz, J. Handbook 151: NIST/SEMATECH e-Handbook of Statistical Methods; NIST: Gaithersburg, MD, USA, 2002. [Google Scholar]
- Yong, S.G.; Kim, J.H.; Gim, Y.; Kim, J.; Cho, J.; Hong, H.; Baik, Y.J.; Koo, J. Impacts of building envelope design factors upon energy loads and their optimization in US standard climate zones using experimental design. Energy Build. 2017, 141, 1–15. [Google Scholar] [CrossRef]
- Antoy, J. Design of Experiments for Engineers and Scientists: Second Edition, 2nd ed.; Elsevier Ltd: Amsterdam, The Netherlands, 2014; ISBN 9780080994178. [Google Scholar]
- Güngör, S.; Ceyhan, U.; Karadeniz, Z.H. Optimization of heat transfer in a grooved pipe model by Stochastic Algorithms and DOE based RSM. Int. J. Therm. Sci. 2021, 159, 106634. [Google Scholar] [CrossRef]
- Jaffal, I.; Inard, C.; Bozonnet, E. Toward integrated building design: A parametric method for evaluating heating demand. Appl. Therm. Eng. 2012, 40, 267–274. [Google Scholar] [CrossRef]
- Delgarm, N.; Sajadi, B.; Azarbad, K.; Delgarm, S. Sensitivity analysis of building energy performance: A simulation-based approach using OFAT and variance-based sensitivity analysis methods. J. Build. Eng. 2018, 15, 181–193. [Google Scholar] [CrossRef]
- Gramacy, R.B. Surrogates: Gaussian Process Modeling, Design, and Optimization for the Applied Sciences; CRC Press: Boca Raton, FL, USA, 2020. [Google Scholar]
- Tian, W.; Choudhary, R. A probabilistic energy model for non-domestic building sectors applied to analysis of school buildings in greater London. Energy Build. 2012, 54, 1–11. [Google Scholar] [CrossRef] [Green Version]
- Hopfe, C.J.; Hensen, J.L.M. Uncertainty analysis in building performance simulation for design support. Energy Build. 2011, 43, 2798–2805. [Google Scholar] [CrossRef] [Green Version]
- Yildiz, Y.; Korkmaz, K.; Göksal Özbalta, T.; Arsan, Z.D. An approach for developing sensitive design parameter guidelines to reduce the energy requirements of low-rise apartment buildings. Appl. Energy 2012, 93, 337–347. [Google Scholar] [CrossRef] [Green Version]
- Struck, C.; Jan, H.; Kotek, P. On the application of uncertainty and sensitivity analysis with abstract building performance simulation tools. J. Build. Phys. 2009, 33, 5–27. [Google Scholar] [CrossRef] [Green Version]
- Ballarini, I.; Corrado, V. Analysis of the building energy balance to investigate the effect of thermal insulation in summer conditions. Energy Build. 2012, 52, 168–180. [Google Scholar] [CrossRef]
- De Wilde, P.; Tian, W. Predicting the performance of an office under climate change: A study of metrics, sensitivity and zonal resolution. Energy Build. 2010, 42, 1674–1684. [Google Scholar] [CrossRef]
- Tian, W. A review of sensitivity analysis methods in building energy analysis. Renew. Sustain. Energy Rev. 2013, 20, 411–419. [Google Scholar] [CrossRef]
- De Wit, S.; Augenbroe, G. Analysis of uncertainty in building design evaluations and its implications. Energy Build. 2002, 34, 951–958. [Google Scholar] [CrossRef]
- Pourreza, F.; Mousazadeh, M.; Basim, M.C. An efficient method for incorporating modeling uncertainties into collapse fragility of steel structures. Struct. Saf. 2021, 88, 102009. [Google Scholar] [CrossRef]
- Kang, S.; Yong, S.-G.; Kim, J.; Jeon, H.; Cho, H.; Koo, J. Automated processes of estimating the heating and cooling load for building envelope design optimization. Build. Simul. 2018, 11, 219–233. [Google Scholar] [CrossRef]
- Korea Energy Management Corporation. Explanation of Energy Saving Design Standard in Buildings in Innovation City; Korea Energy Management Corporation: Yongin, Korea, 2011. [Google Scholar]
- Deru, M.; Field, K.; Studer, D.; Benne, K.; Griffith, B.; Torcellini, P.; Liu, B.; Halverson, M.; Winiarski, D.; Rosenberg, M.; et al. U.S. Department of Energy Commercial Reference Building Models of the National Building Stock; NREL: Golden, CO, USA, 2011. [Google Scholar]
- ASHRAE. Standard 90.1-2004. Energy Standard for Building Except Low-Rise Residential Buildings; ASHRAE: Atlanta, GA, USA, 2004; p. 176. [Google Scholar]
- Gowri, K.; Winiarski, D.W.; Jarnagin, R.E. Infiltration Modeling Guidelines for Commercial Building Energy Analysis; Pacific Northwest National Lab.: Richland, WA, USA; p. 2.
- pyDOE: The experimental design package for python—pyDOE 0.3.6 documentation, (n.d.). Available online: https://pythonhosted.org/pyDOE/#credits (accessed on 1 February 2020).
- R.C. Team. R: A language and Environment for Statistical Computing; R.C. Team: Vienna, Austria, 2017. [Google Scholar]

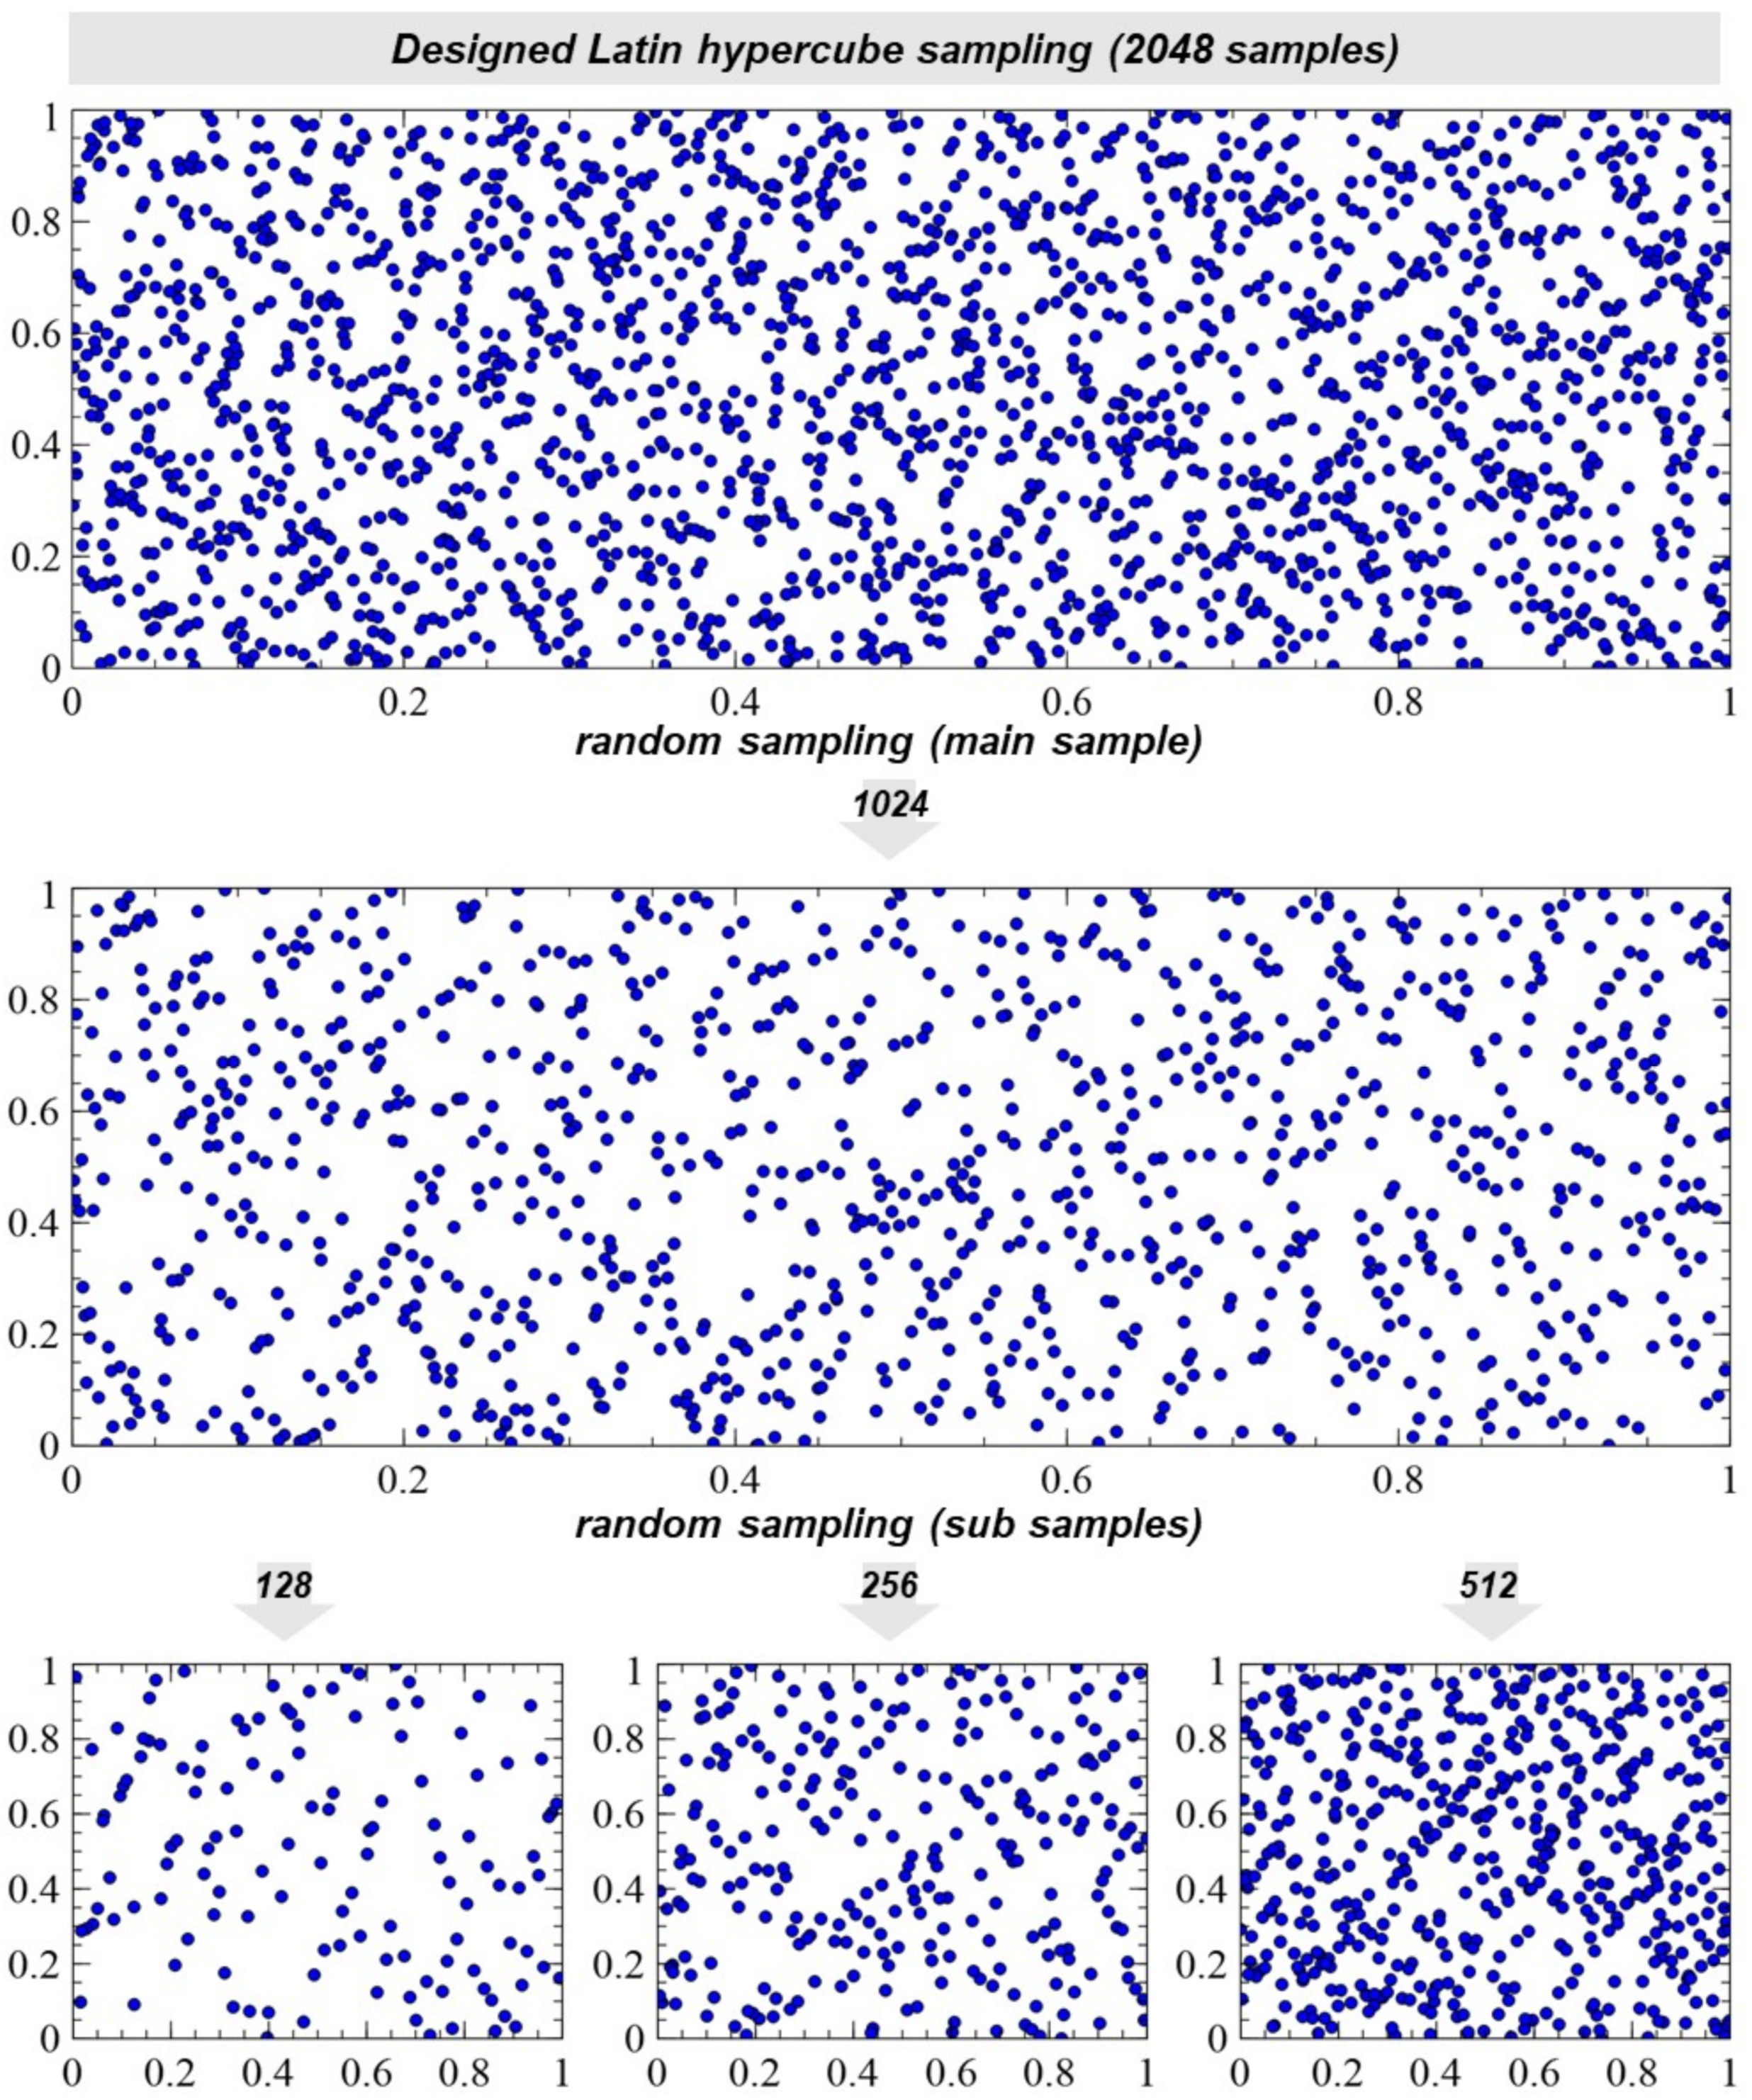
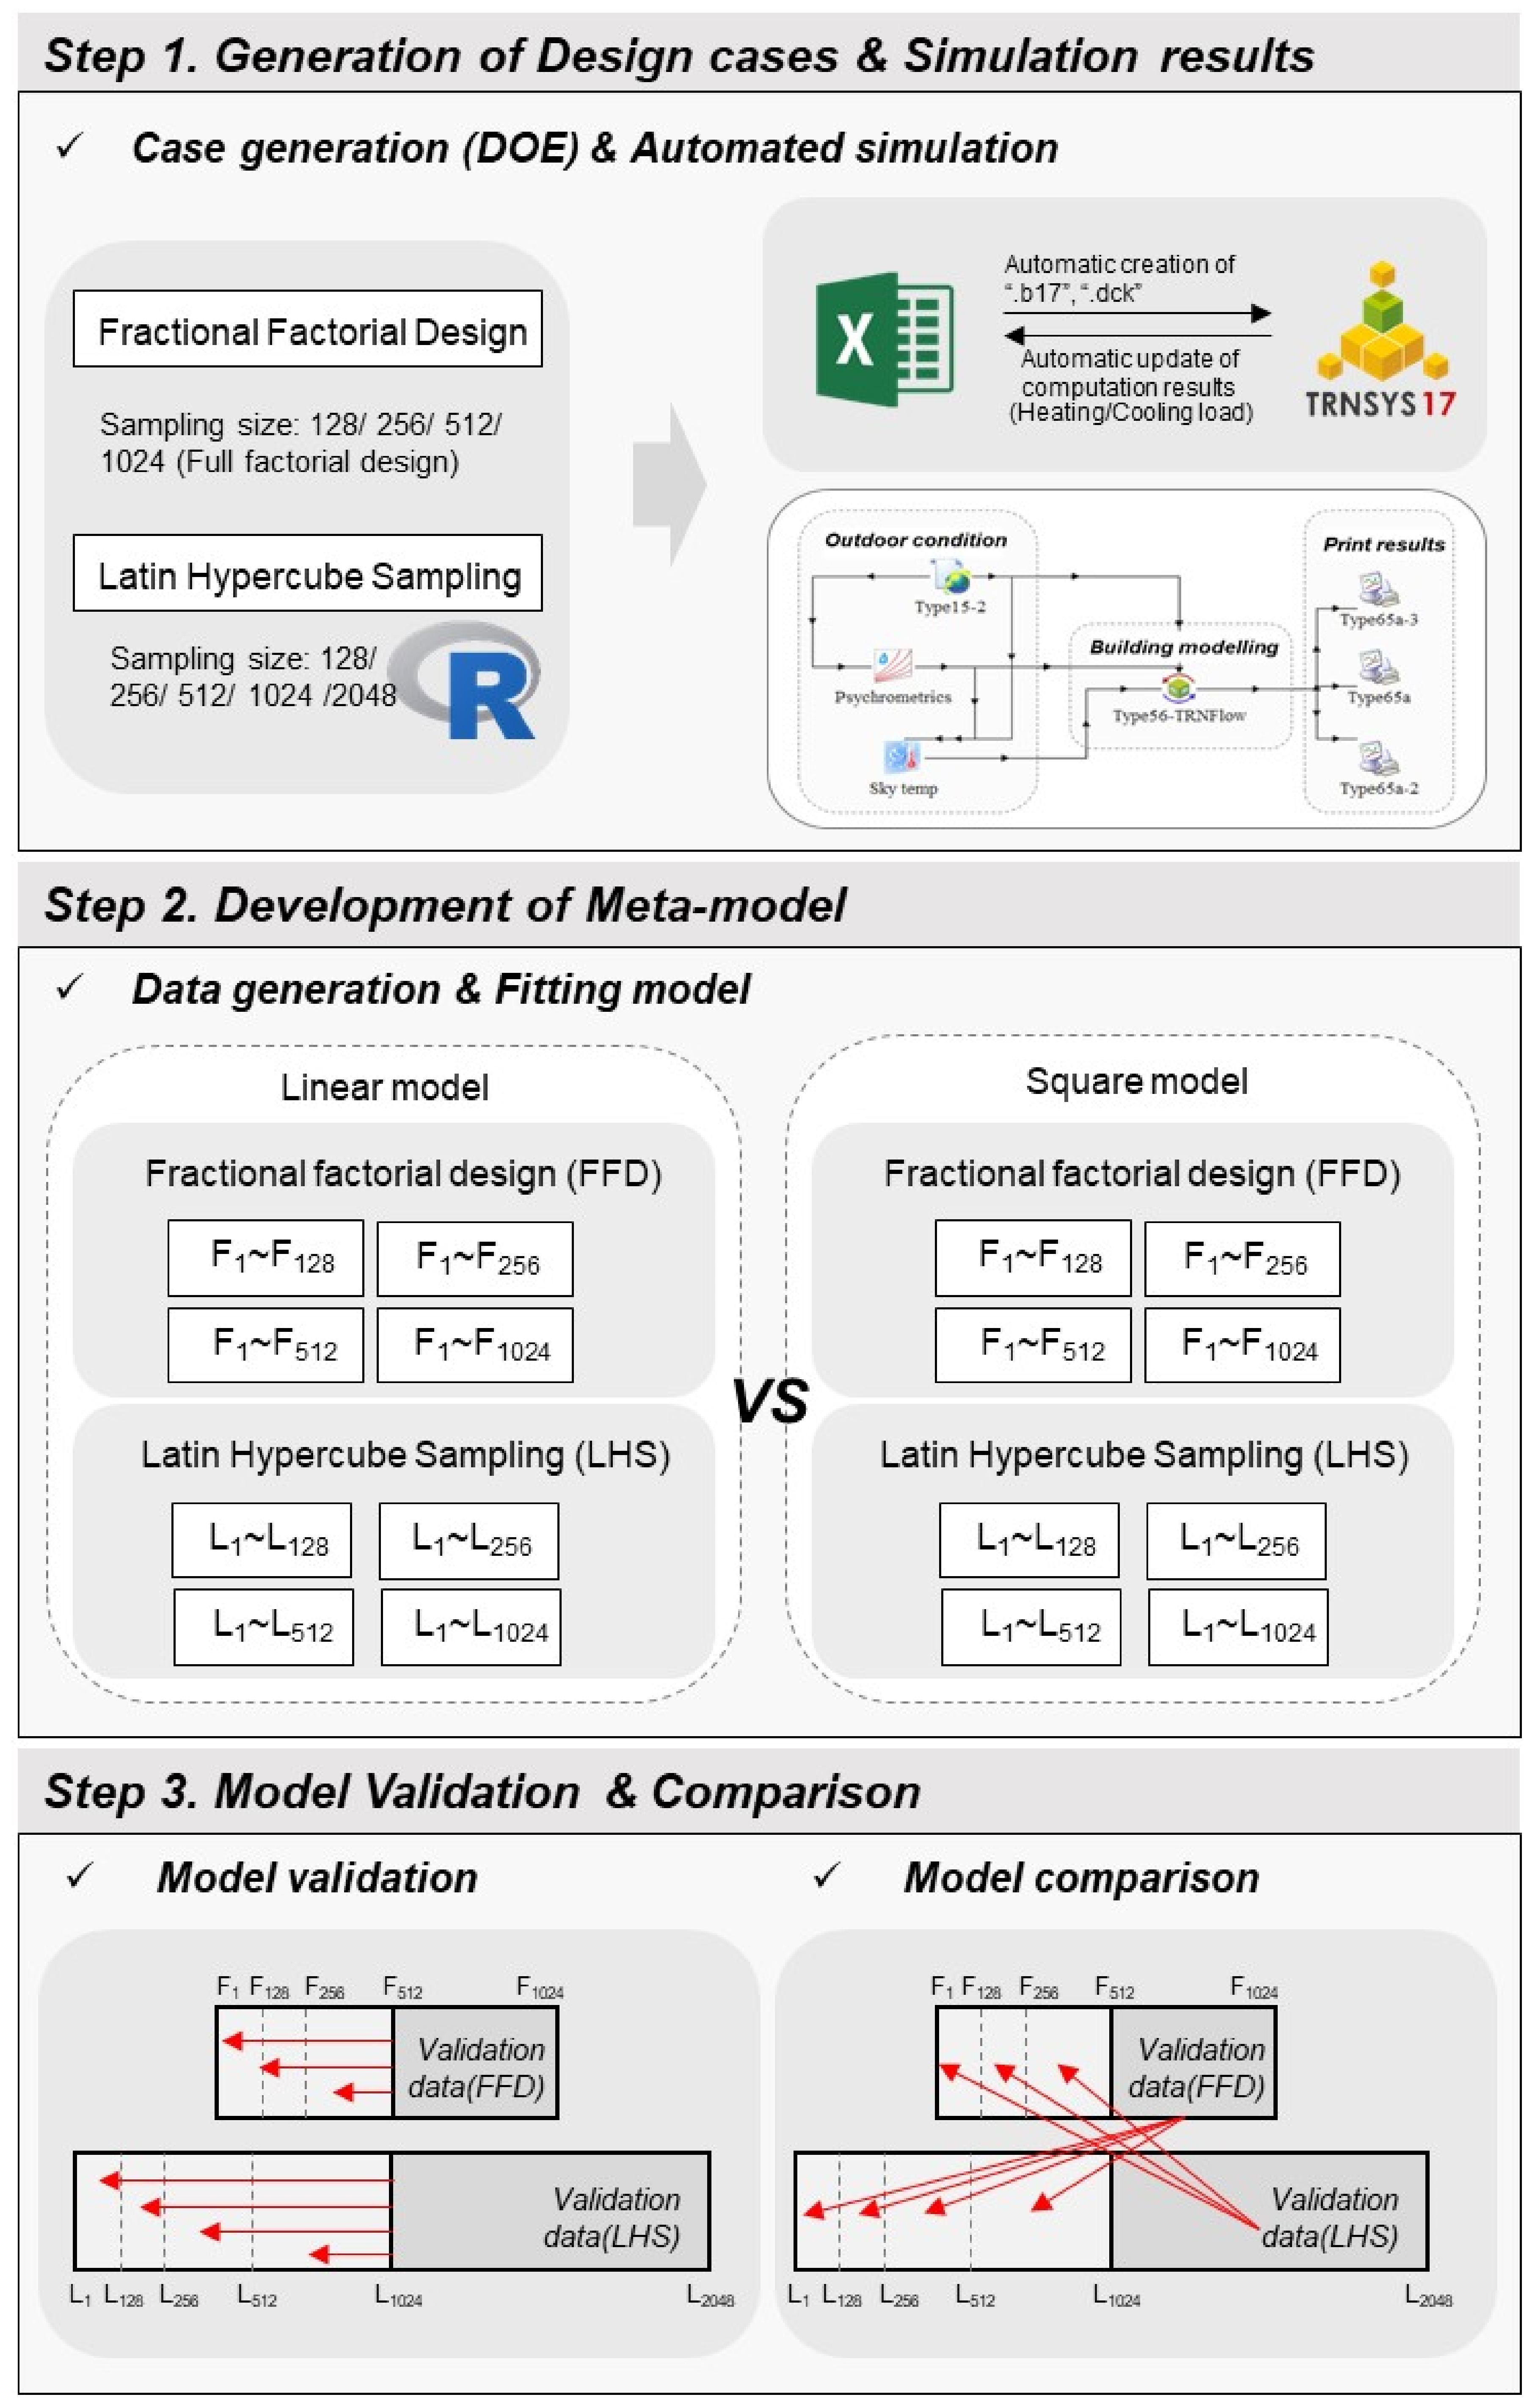
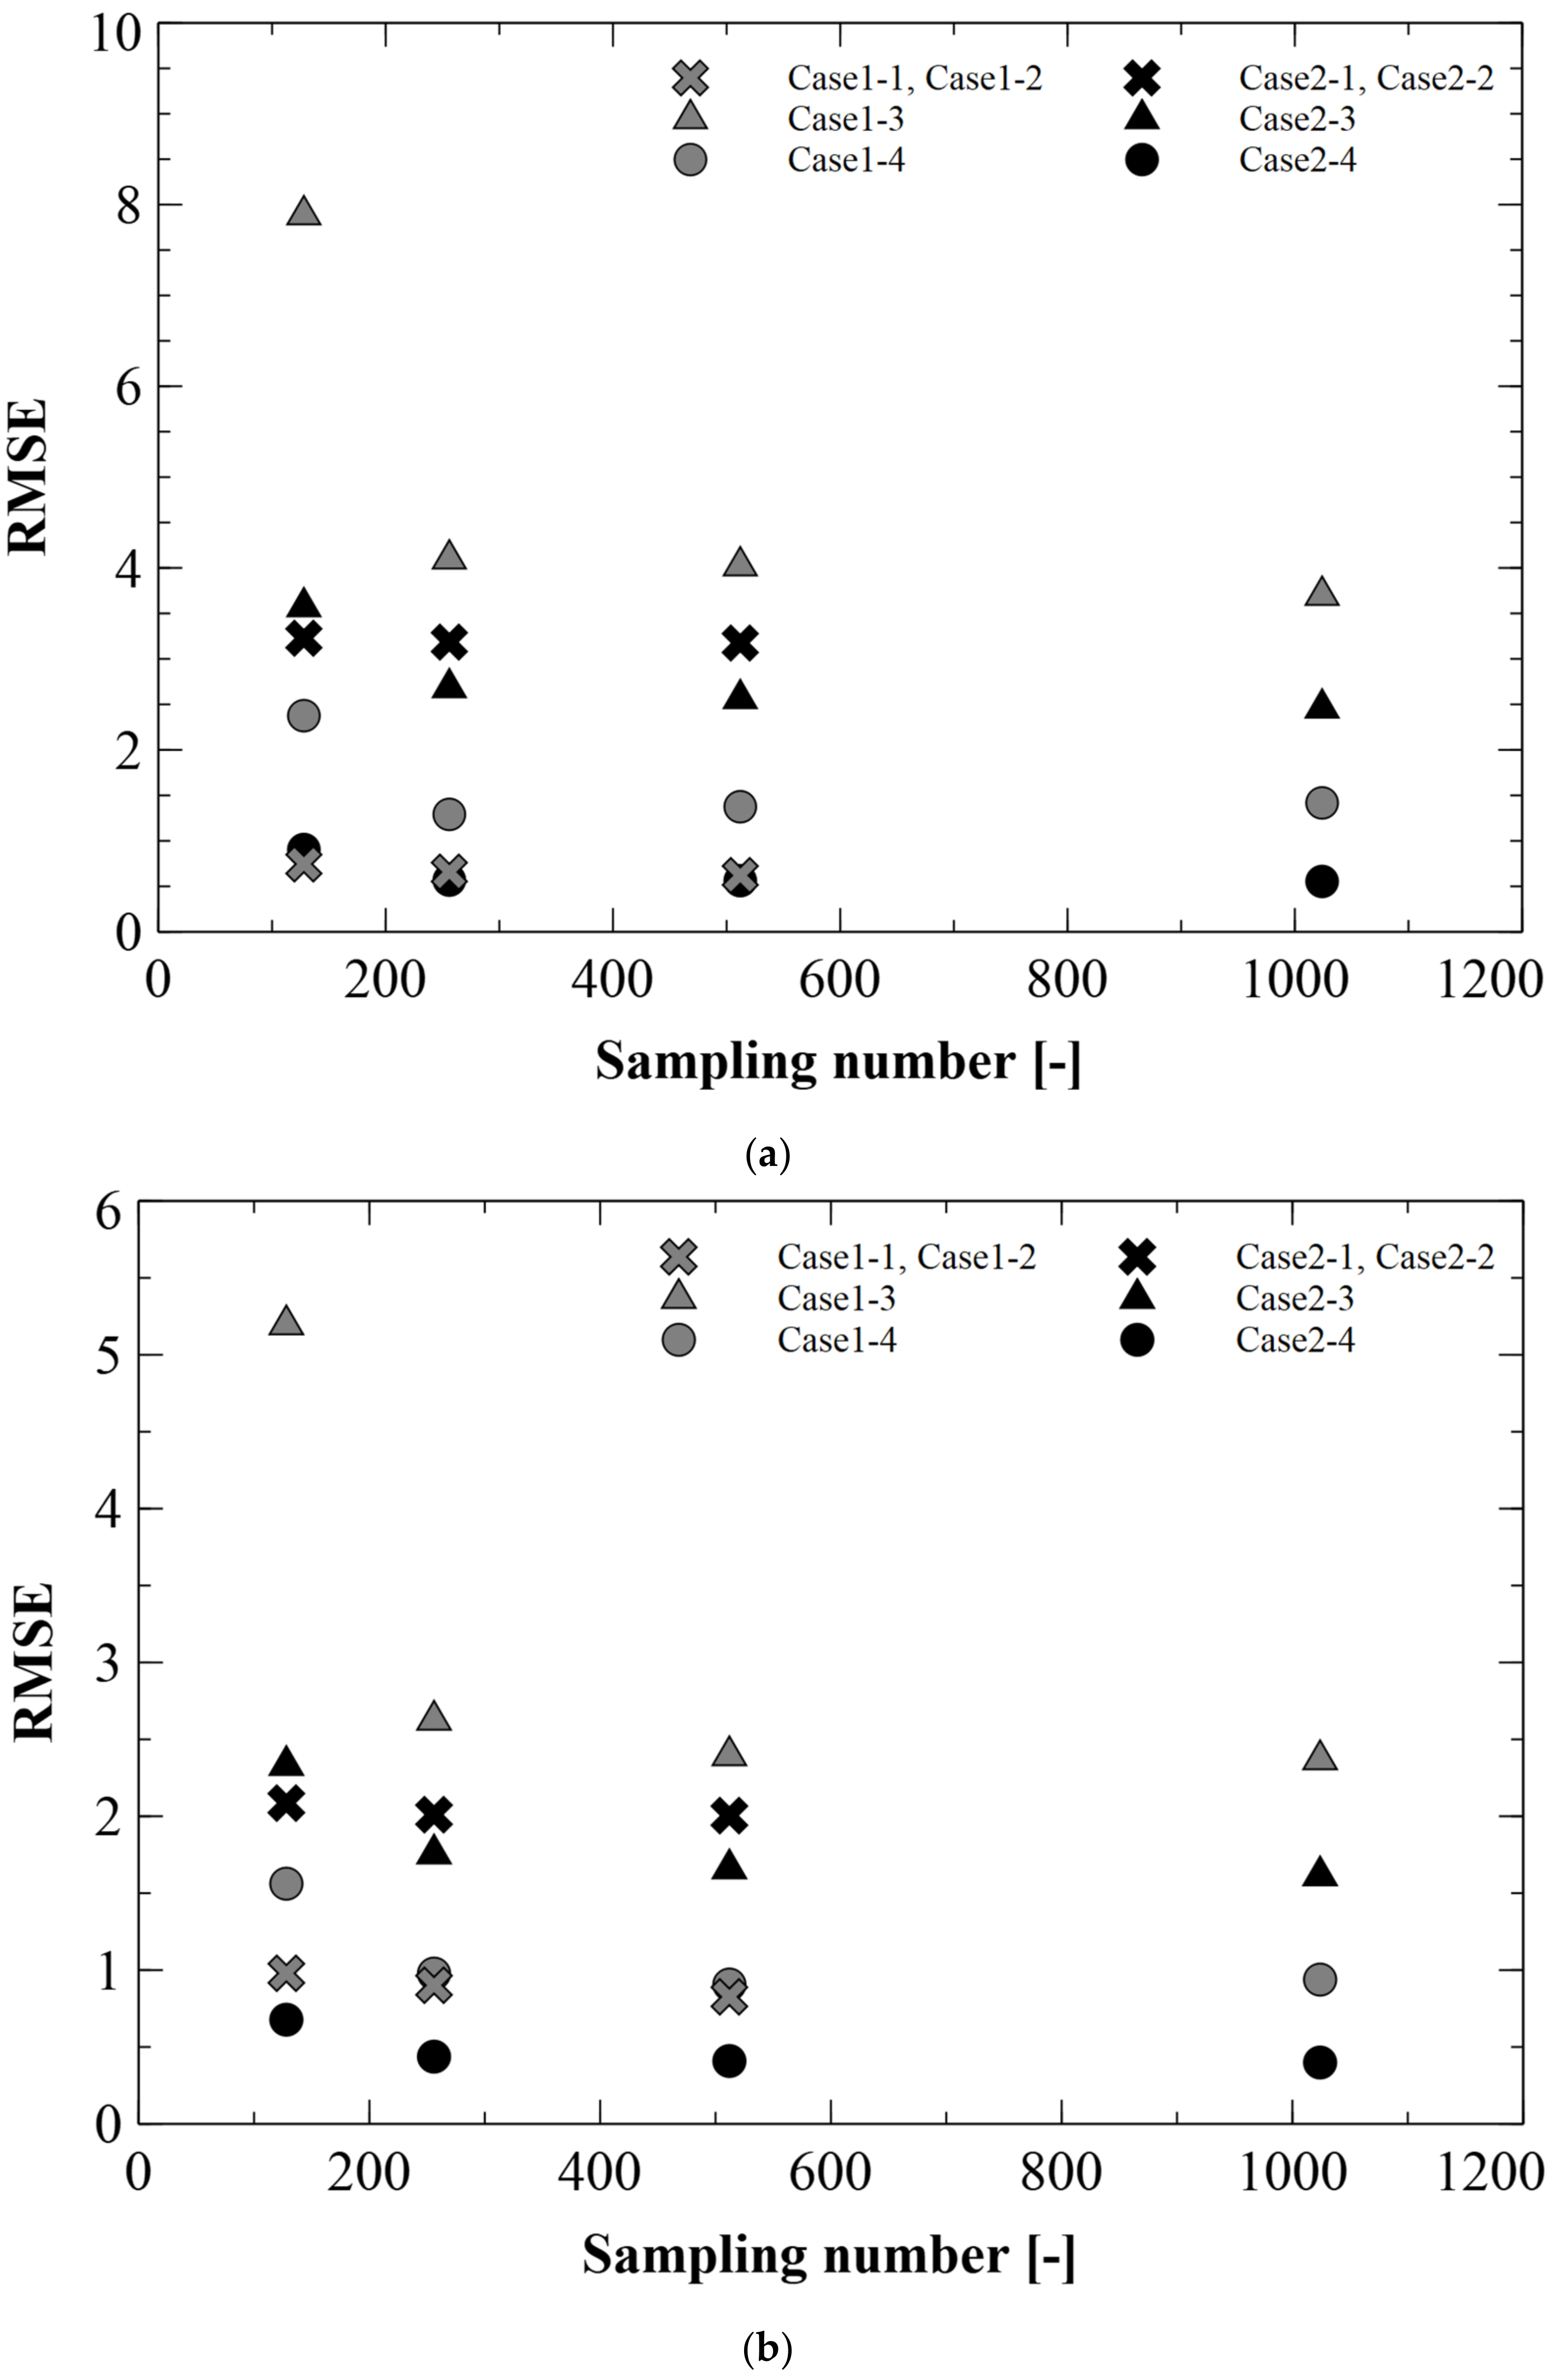
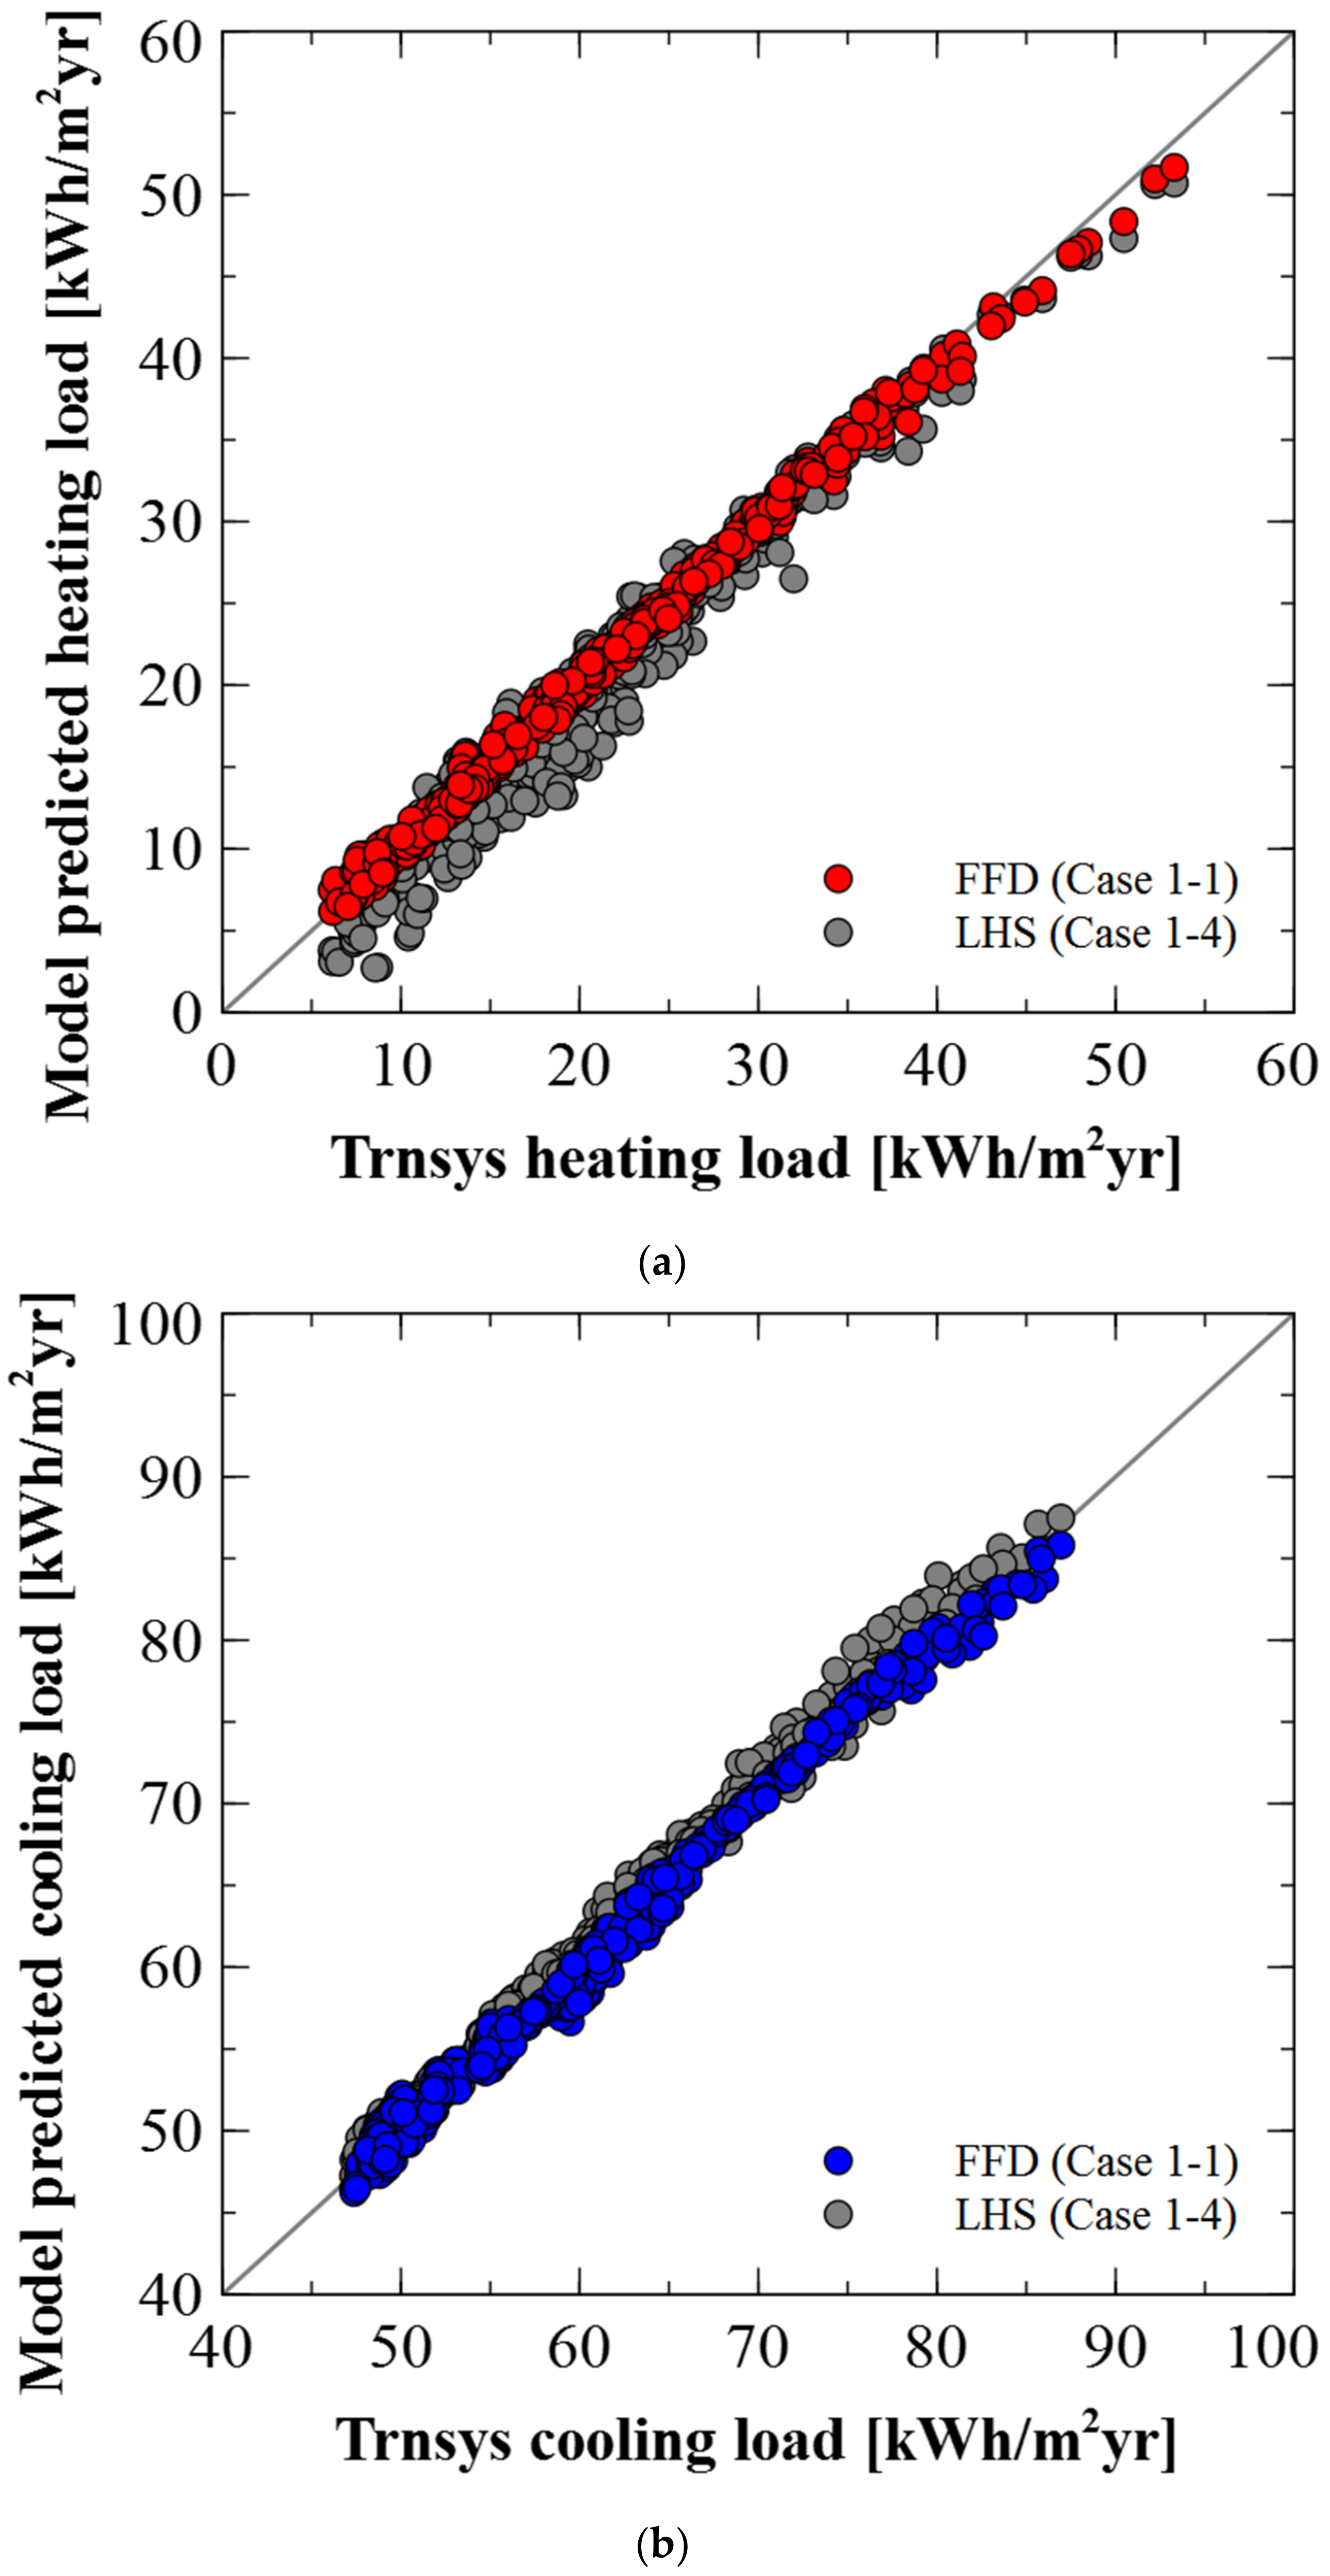
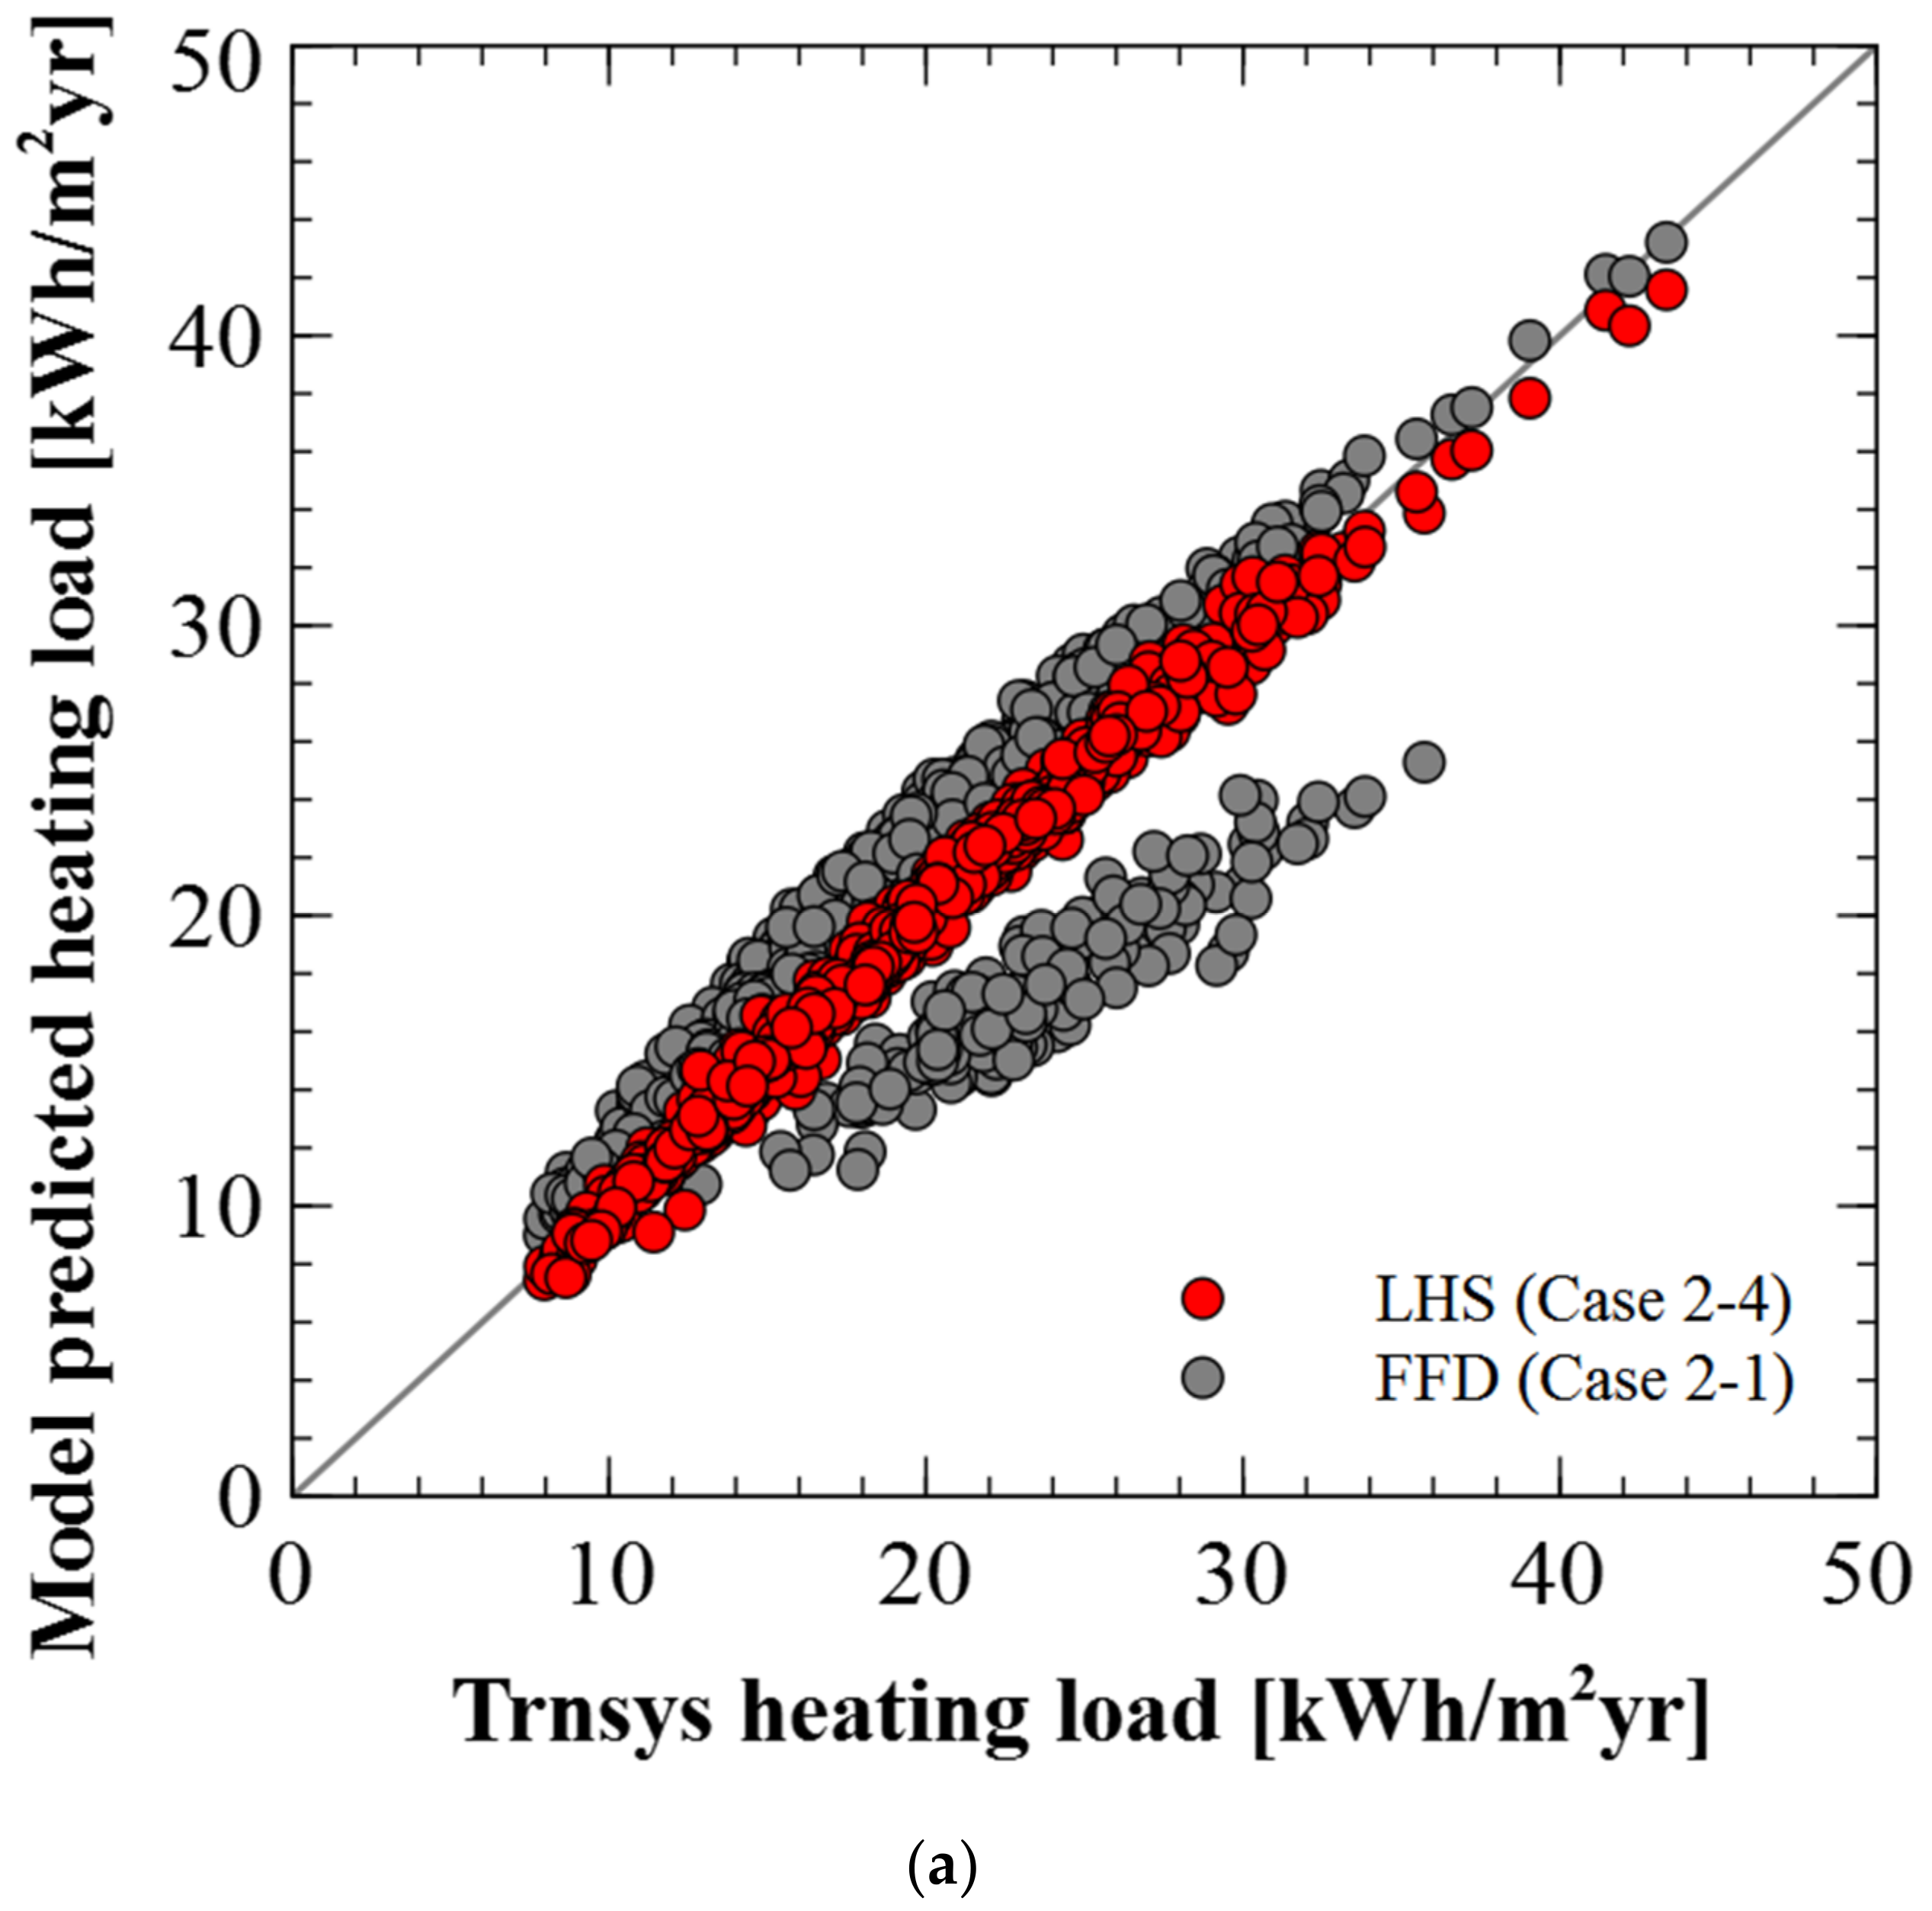
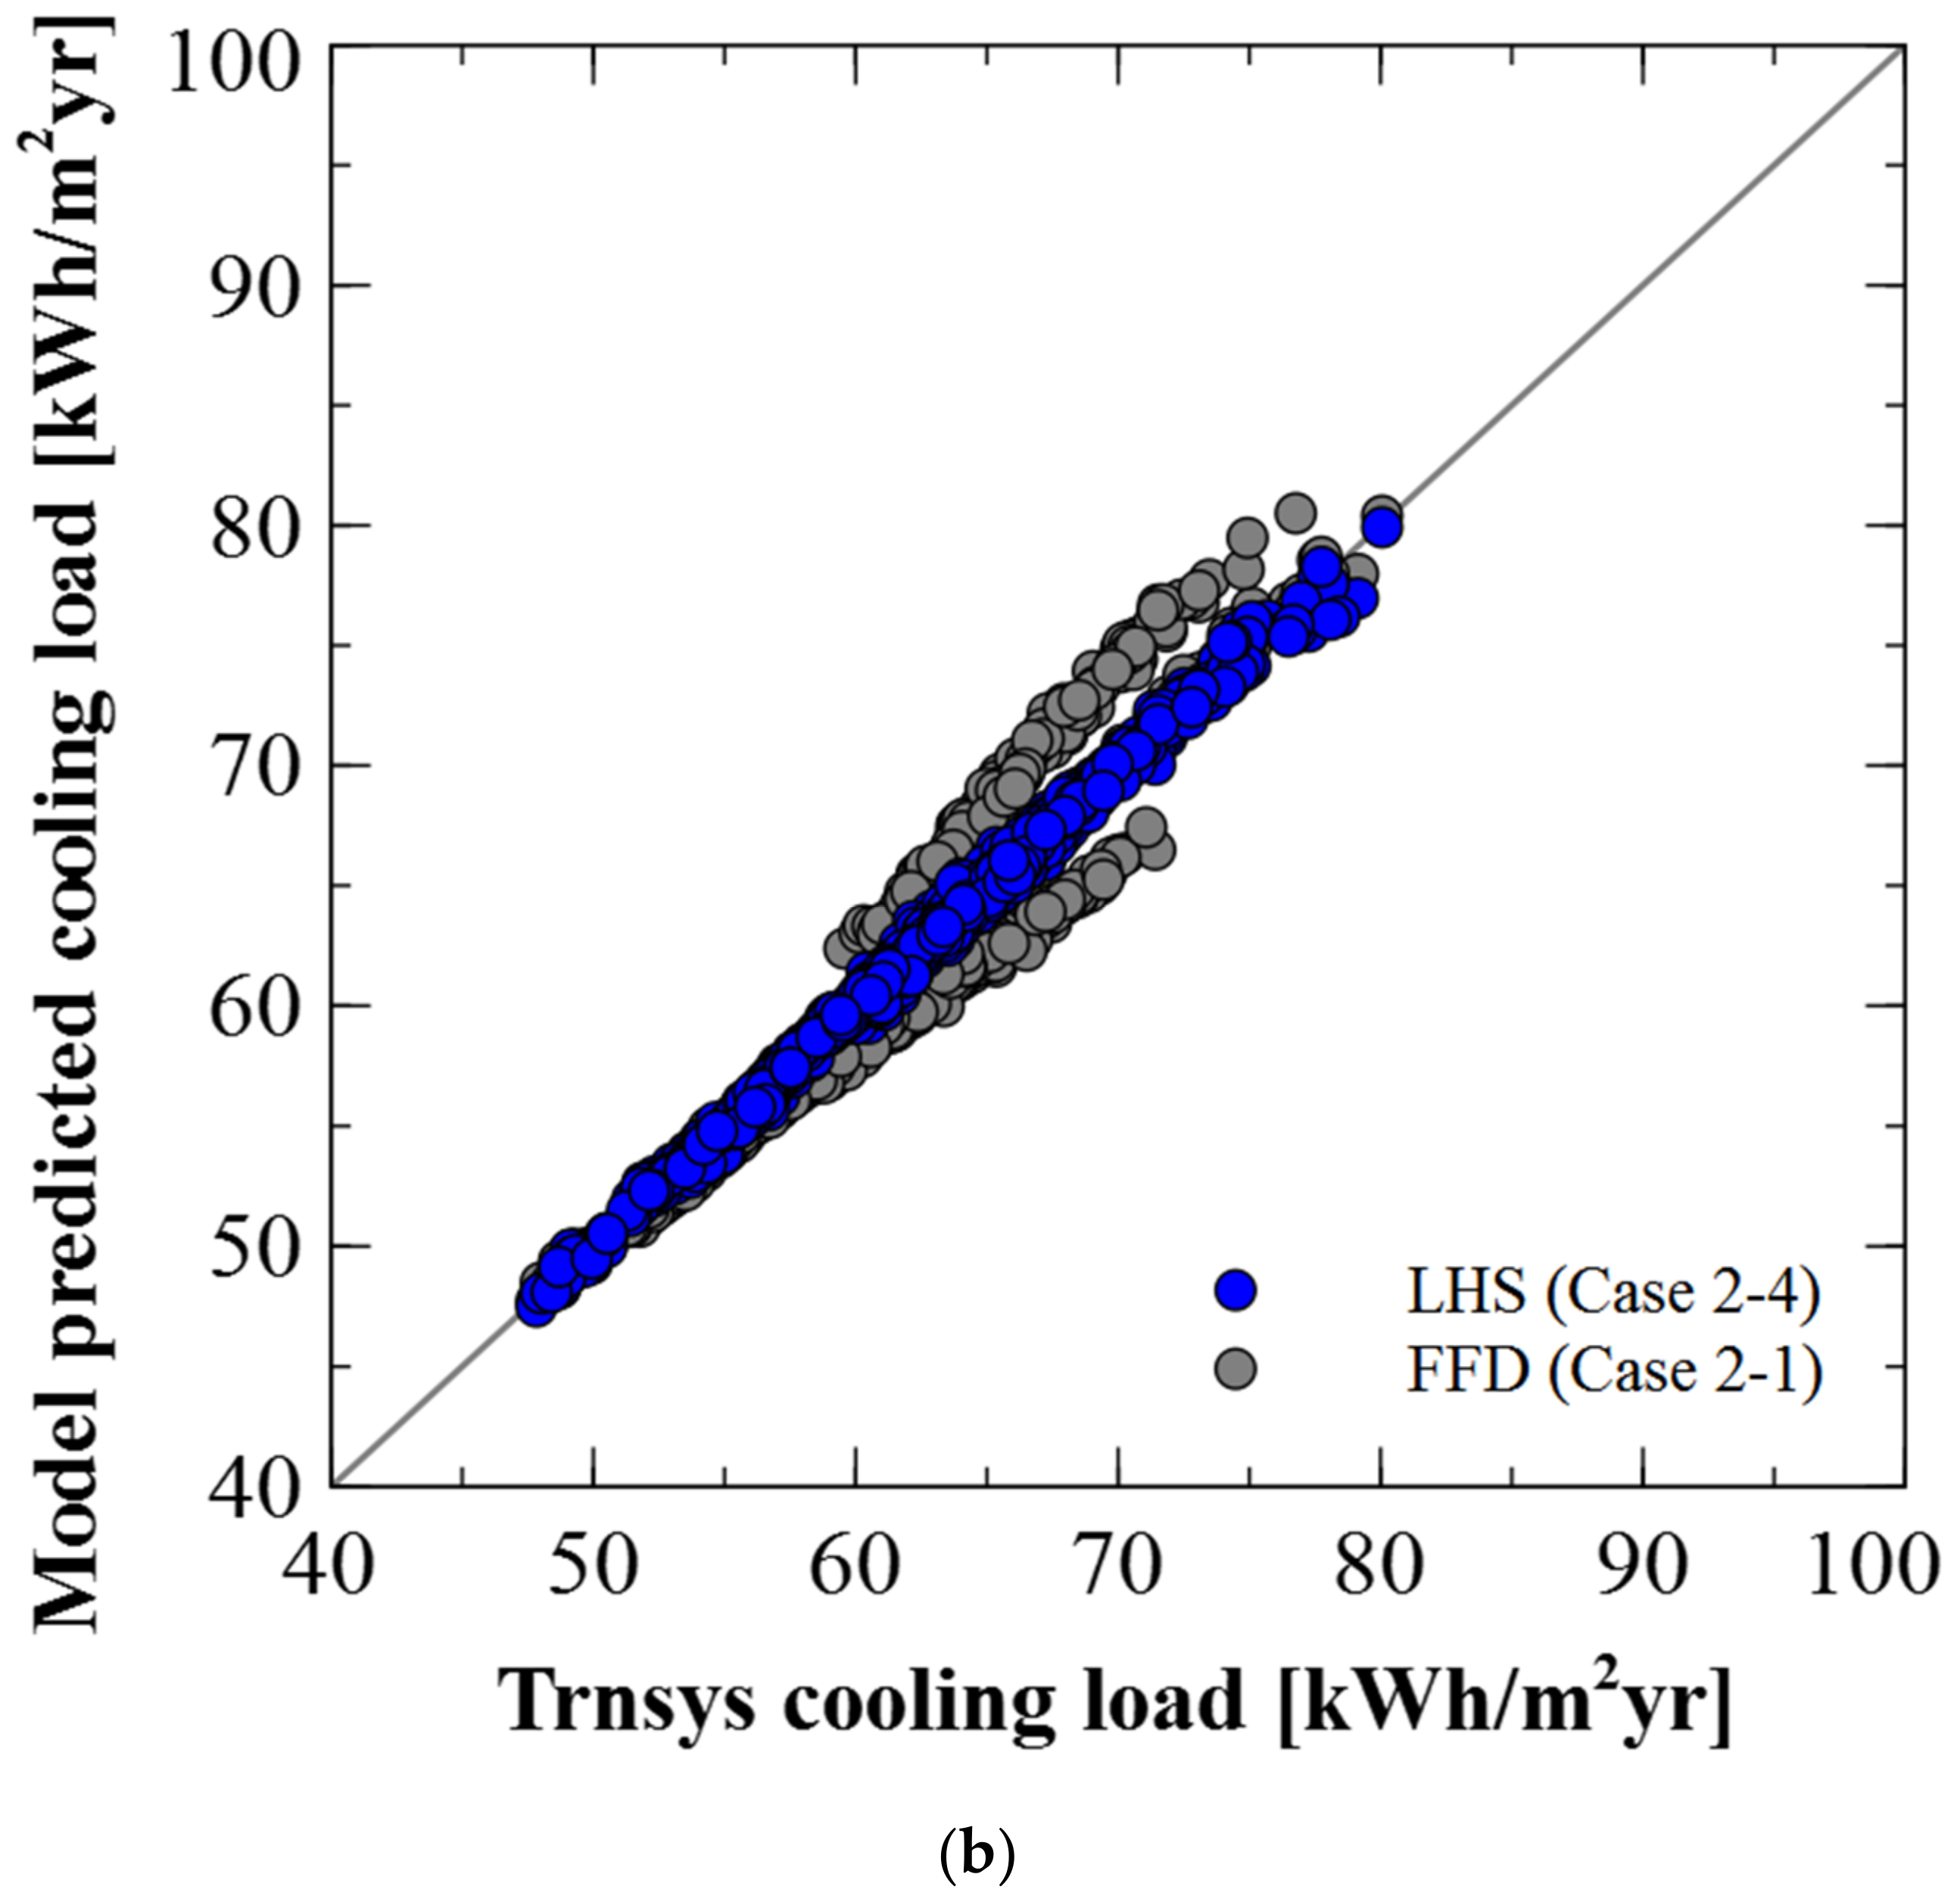
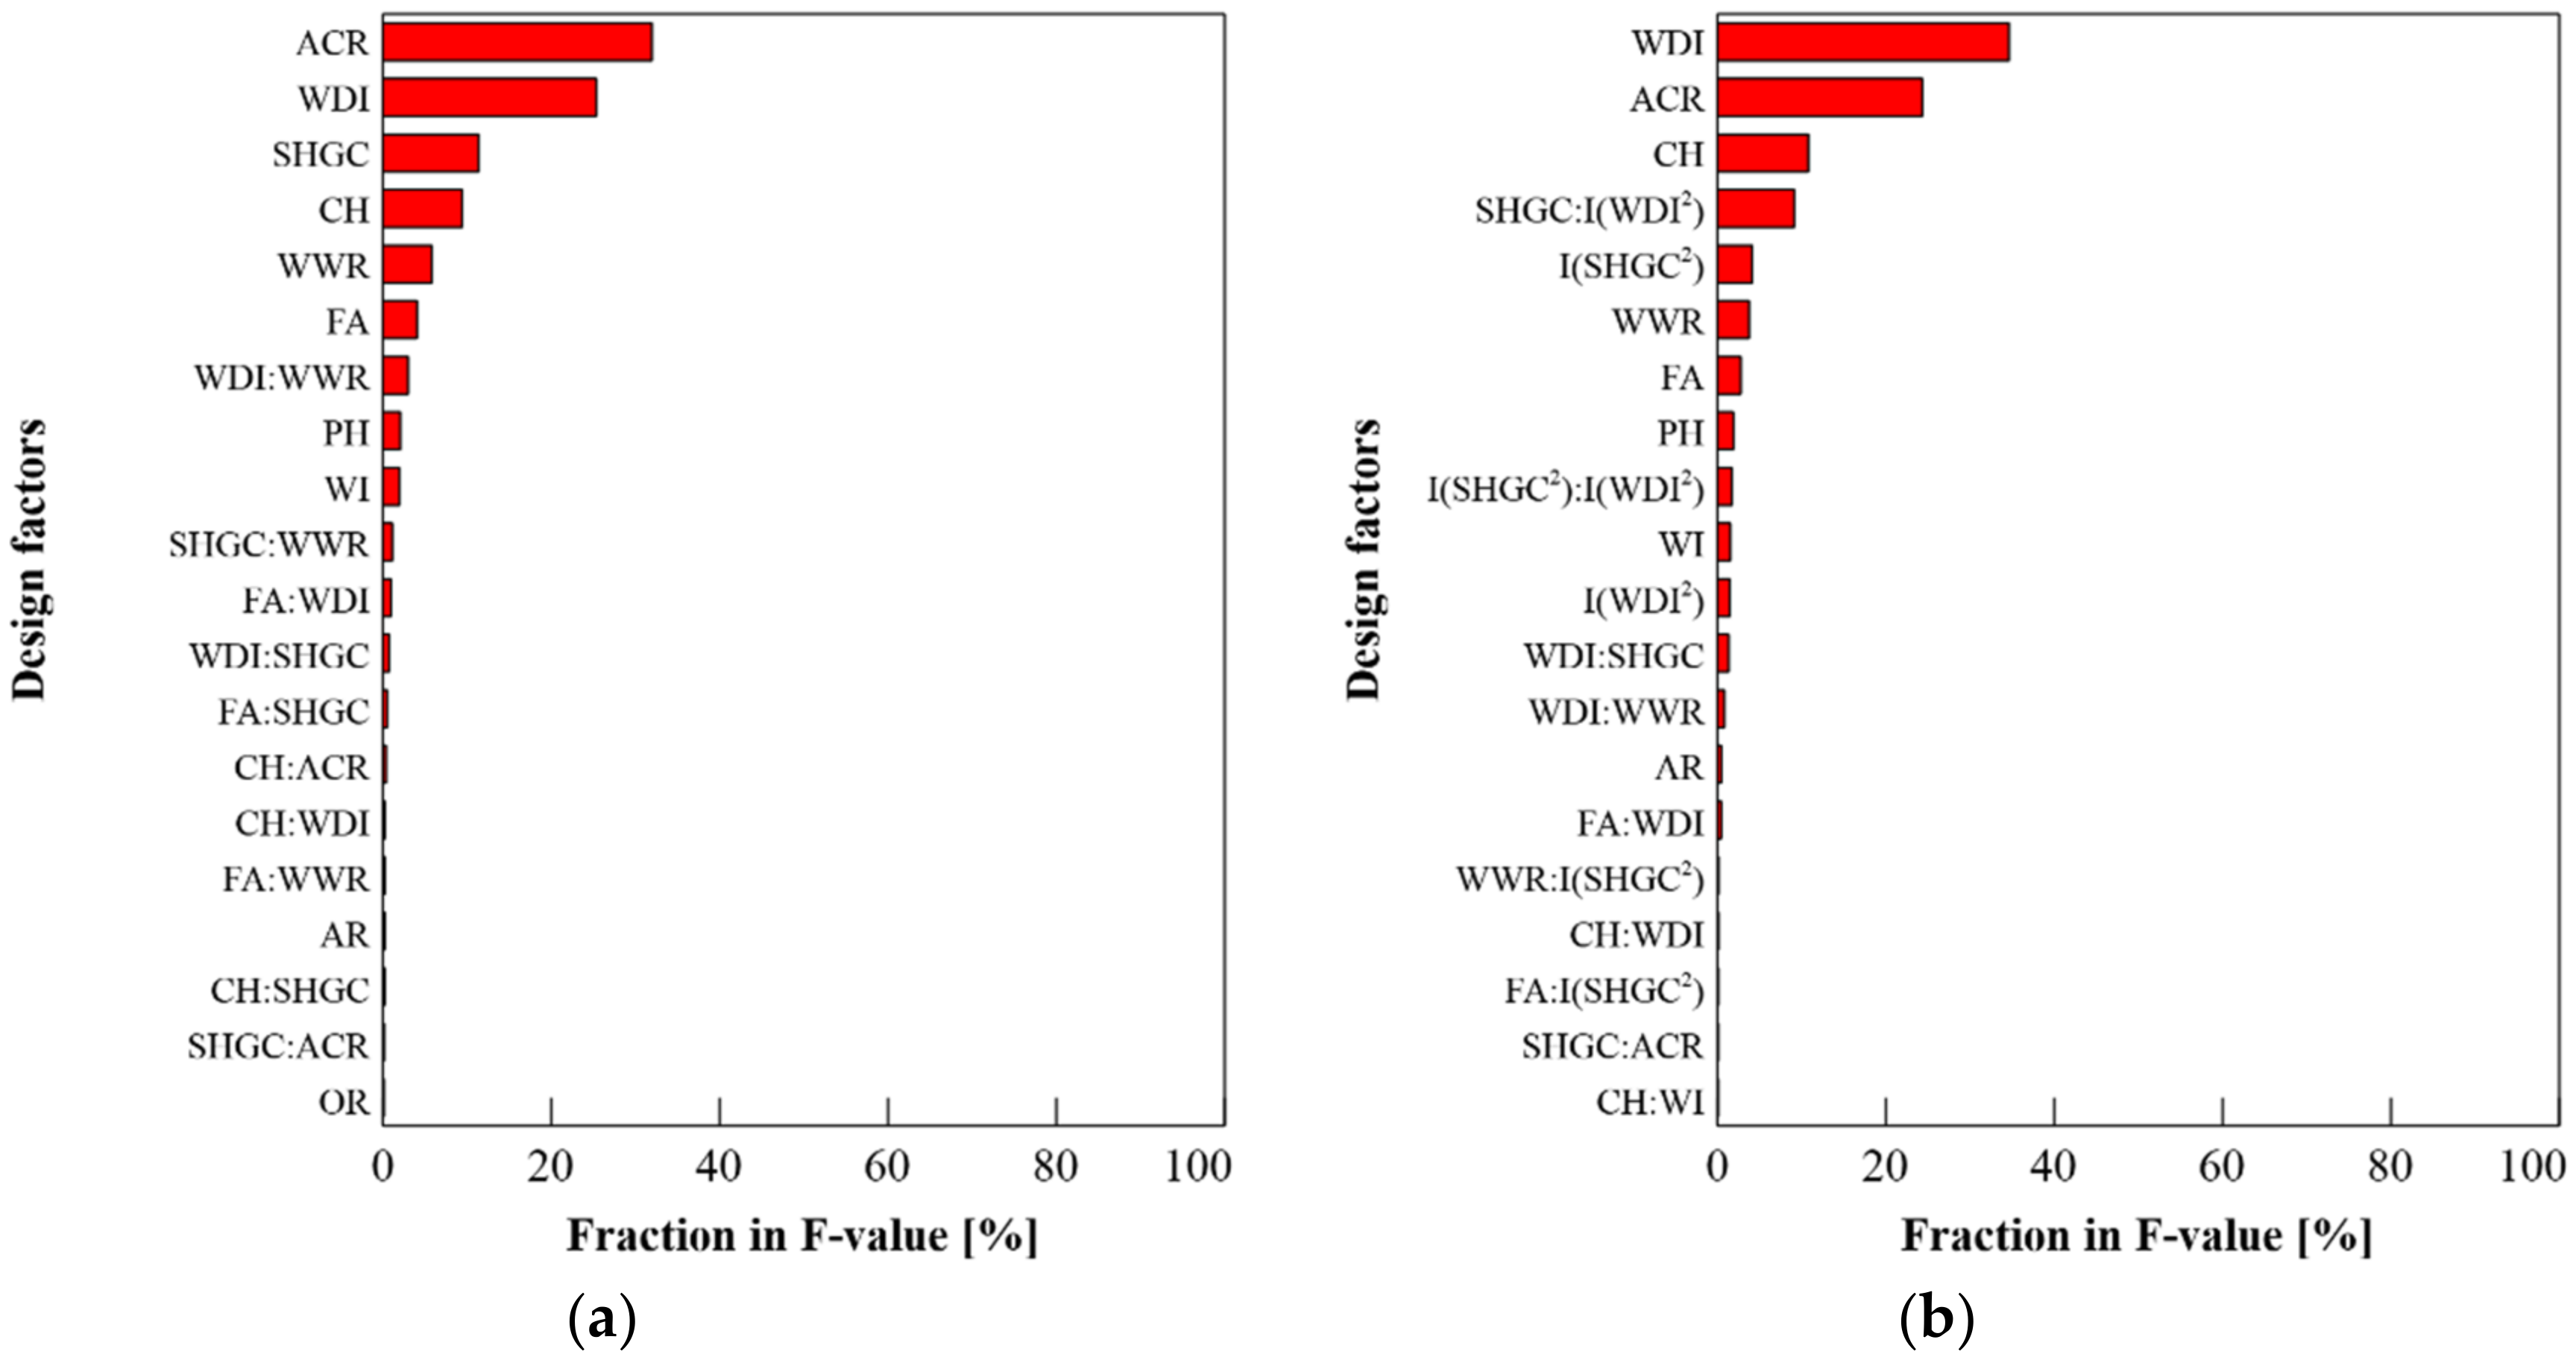

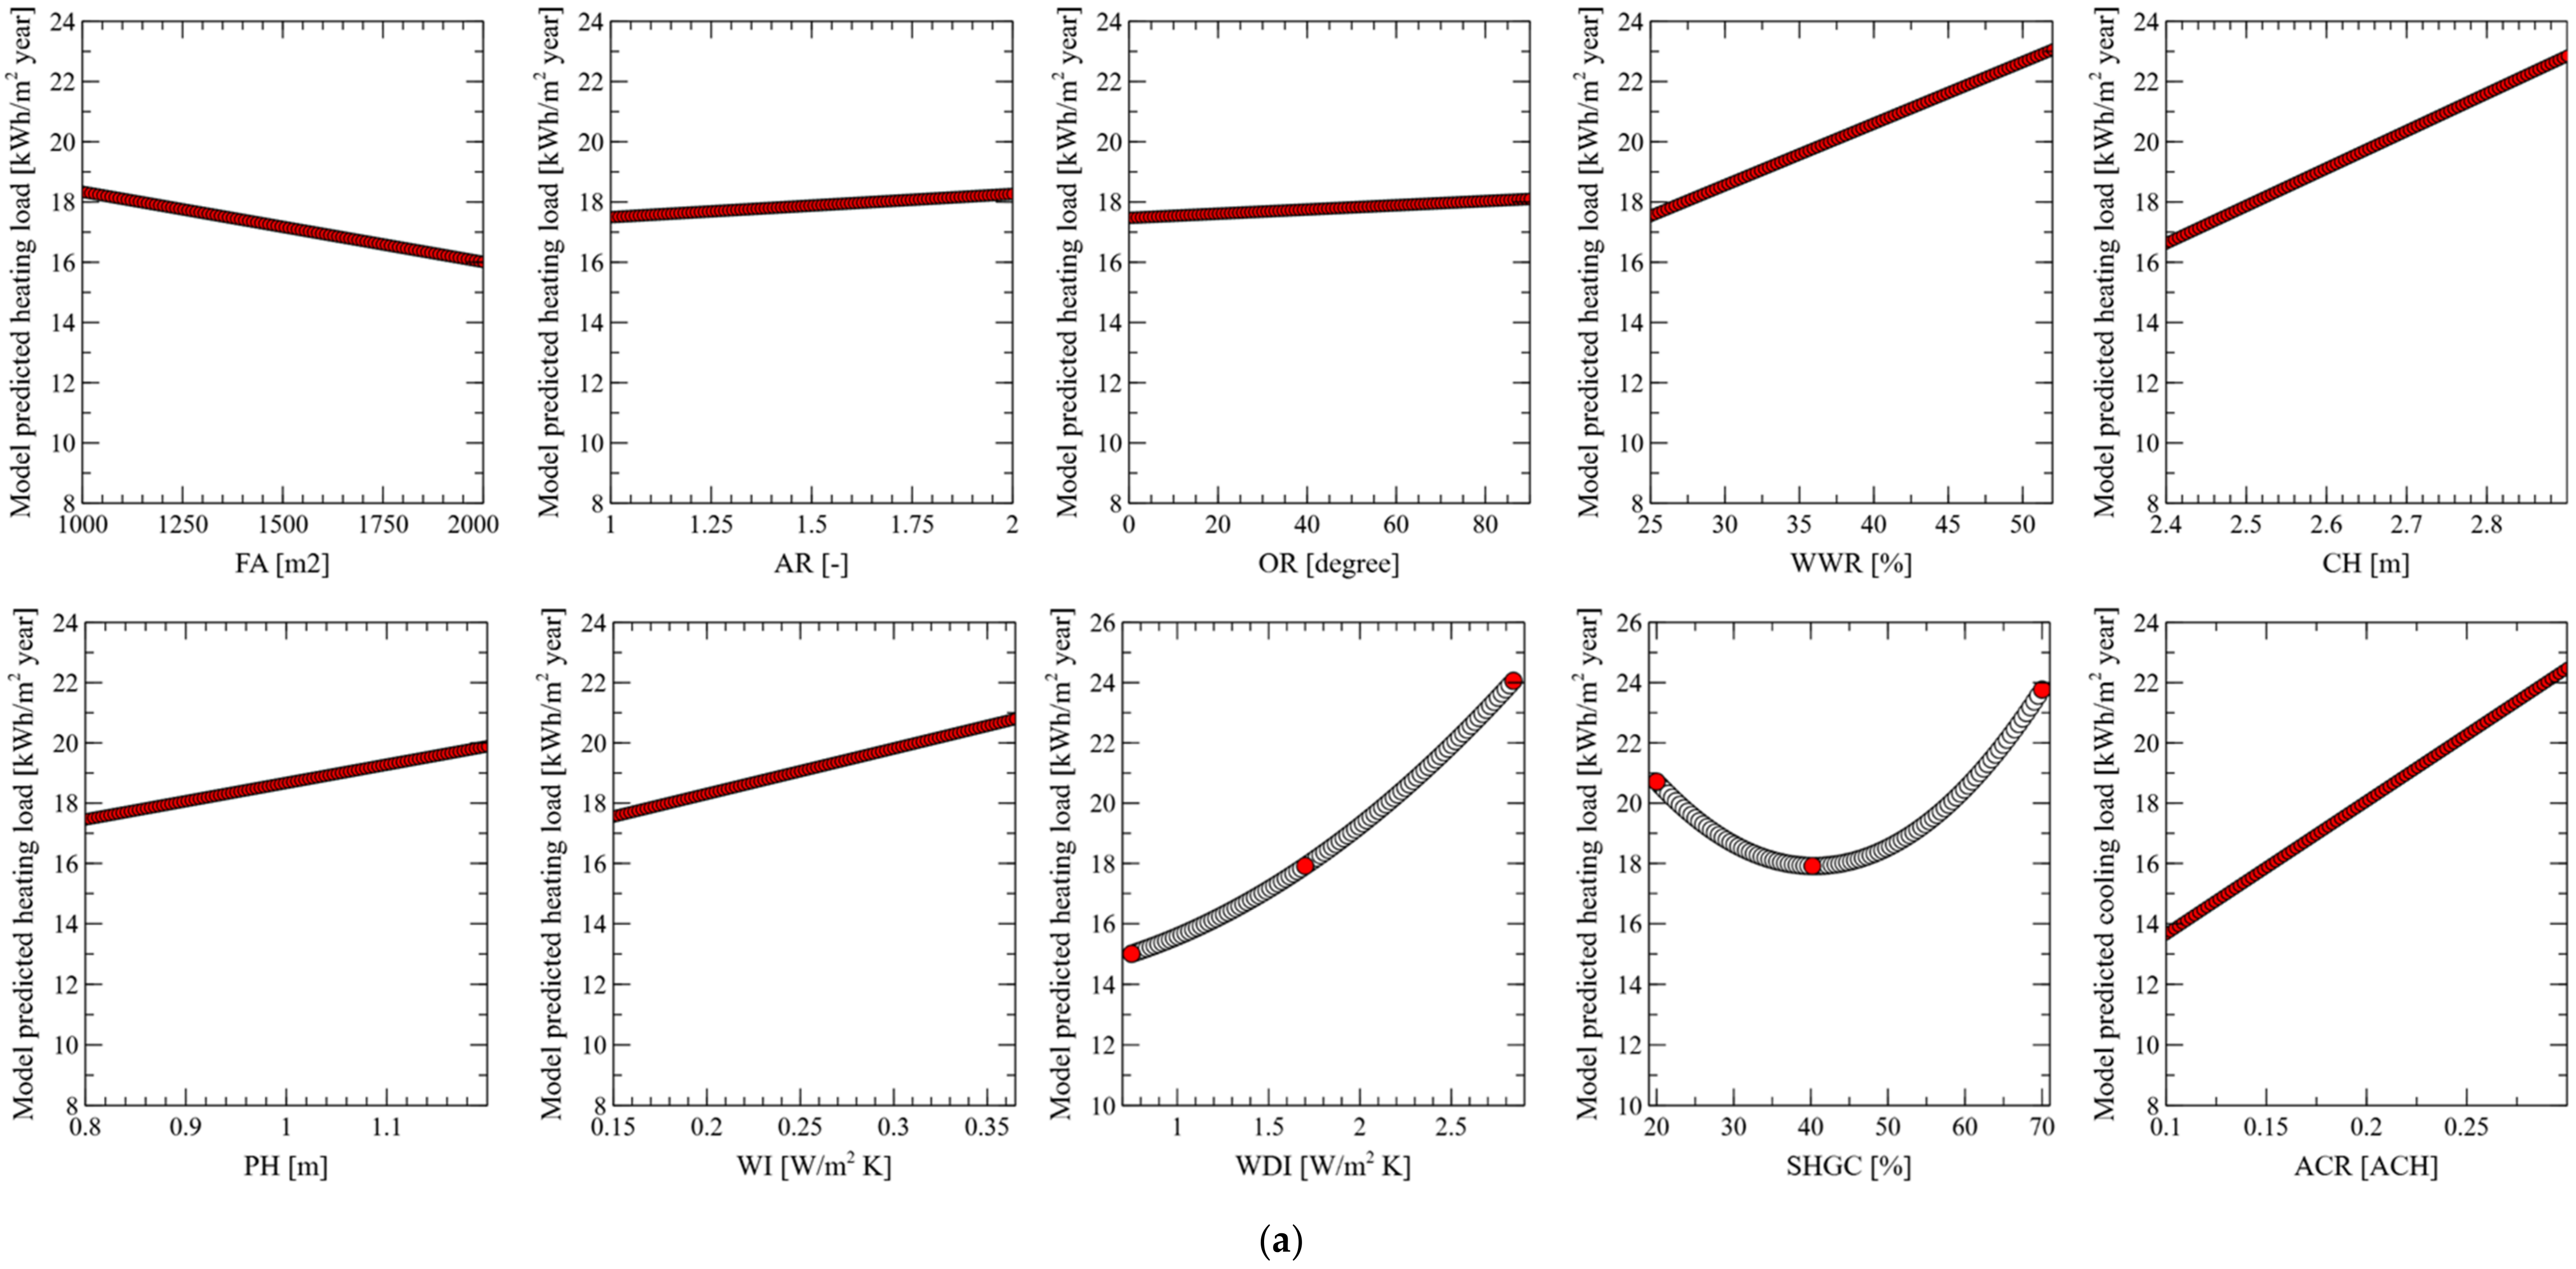

| Weather data | Seoul.TMY2 (Climate zone 4) |
| Set temperature | 26 °C in Cooling season and 20 °C in Heating season [35] |
| Internal heat gain [36,37] | People: 0.1 people/m2 Lighting: 12 W/m2 Equipment: 16 W/m2 Schedule: Taken from [35,36] |
| Building load [36,37] | U-value of exterior wall: 0.365 W/m2 K U-value of window: 2.84 W/m2 K SHGC of window: 0.4 |
| Infiltration [38] | 0.3 ACH |
| Thickness (m) | Conductivity (W/m K) | Capacity (J/kg K) | Density (kg/m3) | |
|---|---|---|---|---|
| Inside gypsum plastering | 0.025 | 0.209 | 840 | 800 |
| Insulation material | 0.07 | 0.047 | 1190 | 30 |
| Outside wall panel | 0.024–0.151 * | 0.039 | 840 | 110 |
| Factor | Abbreviation | Level | |
|---|---|---|---|
| Low (0) | High (1) | ||
| Floor area (m2) | FA | 1000 | 2000 |
| Aspect ratio | AR | 1 | 2 |
| Orientation (degrees) | OR | South (0) | West (90) |
| Window-to-wall ratio (%) | WWR | 25 | 52 |
| Ceiling height (m) | CH | 2.4 | 2.9 |
| Plenum height (m) | PH | 0.8 | 1.2 |
| Wall insulation (W/m2 K) | WI | 0.15 | 0.36 |
| Window insulation (W/m2 K) | WDI | 0.75 | 2.84 |
| Solar heat gain coefficient (%) | SHGC | 20 | 70 |
| Air leakage (ACH) | ACR | 0.1 | 0.3 |
| Case | Meta-Model | Validation Data | |||
|---|---|---|---|---|---|
| Meta-Model | Sampling Method | Regression Method | Sampling Number | ||
| Case 1-1 | Meta-model a-1 | FFD | Linear | 128/256/512 | FFD |
| Case 1-2 | Meta-model a-2 | Square | |||
| Case 1-3 | Meta-model b-1 | LHS | Linear | 128/256/512/1024 | |
| Case 1-4 | Meta-model b-2 | Square | |||
| Case 2-1 | Meta-model a-1 | FFD | Linear | 128/256/512 | LHS |
| Case 2-2 | Meta-model a-2 | Square | |||
| Case 2-3 | Meta-model b-1 | LHS | Linear | 128/256/512/1024 | |
| Case 2-4 | Meta-model b-2 | Square | |||
| Sampling Number | Fitting Accuracy | Prediction Accuracy | ||||
|---|---|---|---|---|---|---|
| Meta-Model a-1 (HL,CL) | Meta-Model b-1 (HL,CL) | Meta-Model b-2 (HL,CL) | Case 1-1 (HL,CL) | Case 1-3 (HL,CL) | Case 1-4 (HL,CL) | |
| 128 | 0.9966, 0.9959 | 0.8585, 0.9517 | 0.9951, 0.9968 | 0.9940, 0.9935 | 0.6731, 0.8918 | 0.9806, 0.9909 |
| 256 | 0.9971, 0.9963 | 0.8023, 0.9423 | 0.9929, 0.9966 | 0.9956, 0.9943 | 0.7943, 0.9382 | 0.9917, 0.9960 |
| 512 | 0.9968, 0.9960 | 0.8126, 0.9398 | 0.9926, 0.9966 | 0.9964, 0.9950 | 0.8224, 0.9443 | 0.9929, 0.9966 |
| 1024 | 0.8263, 0.9446 | 0.9926, 0.9968 | 0.8312, 0.9469 | 0.9935, 0.9970 | ||
| Sampling Number | Prediction Accuracy | ||
|---|---|---|---|
| Case 2-1 (HL,CL) | Case 2-3 (HL,CL) | Case 2-4 HL,CL) | |
| 128 | 0.6917, 0.9220 | 0.6497, 0.8733 | 0.9752, 0.9889 |
| 256 | 0.6959, 0.9235 | 0.7753, 0.9266 | 0.9911, 0.9955 |
| 512 | 0.6967, 0.9233 | 0.7940, 0.9340 | 0.9910, 0.9960 |
| 1024 | 0.8089, 0.9379 | 0.9911, 0.9964 | |
Publisher’s Note: MDPI stays neutral with regard to jurisdictional claims in published maps and institutional affiliations. |
© 2021 by the authors. Licensee MDPI, Basel, Switzerland. This article is an open access article distributed under the terms and conditions of the Creative Commons Attribution (CC BY) license (http://creativecommons.org/licenses/by/4.0/).
Share and Cite
Choi, Y.; Song, D.; Yoon, S.; Koo, J. Comparison of Factorial and Latin Hypercube Sampling Designs for Meta-Models of Building Heating and Cooling Loads. Energies 2021, 14, 512. https://doi.org/10.3390/en14020512
Choi Y, Song D, Yoon S, Koo J. Comparison of Factorial and Latin Hypercube Sampling Designs for Meta-Models of Building Heating and Cooling Loads. Energies. 2021; 14(2):512. https://doi.org/10.3390/en14020512
Chicago/Turabian StyleChoi, Younhee, Doosam Song, Sungmin Yoon, and Junemo Koo. 2021. "Comparison of Factorial and Latin Hypercube Sampling Designs for Meta-Models of Building Heating and Cooling Loads" Energies 14, no. 2: 512. https://doi.org/10.3390/en14020512
APA StyleChoi, Y., Song, D., Yoon, S., & Koo, J. (2021). Comparison of Factorial and Latin Hypercube Sampling Designs for Meta-Models of Building Heating and Cooling Loads. Energies, 14(2), 512. https://doi.org/10.3390/en14020512


