Abstract
In the Hungarian as well as the international literature, debates regarding the methodology used for measuring energy poverty are ongoing. Our contribution sought to develop a methodology that would be relatively easy to measure via survey and have the potential to identify households’ energy vulnerability status beyond the energy poor/non energy poor divide. Based on a representative survey that was carried out in Hungary in 2018, we identified three groups of households: energy poor, non energy poor households, and a so-called transitional group, potentially at risk of energy poverty. In addition to socioeconomic differences, we analysed differences in the mindsets of respondents belonging to these three household groups concerning different aspects of heating energy generation (macrolevel aspects, such as environmental sustainability and energy supply system issues, and microlevel aspects, such as economic and technical issues). By this, the article aims to provide input for further research on factors, beyond the social and economic background, related to energy vulnerability.
1. Introduction
Society is increasingly dependent on energy: more and more activities that constitute individuals’ membership in contemporary society require energy [1,2]. As a result, access to energy is becoming a major factor in social inclusion and exclusion.
Energy poverty is a phenomenon that affects an estimated 54 million people in the European Union (EU) [3] and almost one million in Hungary [4]. The conceptualization of the phenomenon as households’ inability to secure a socially and materially necessitated level of energy services in the home [5], emphasizes the interaction between access to energy and social exclusion.
Inequalities in access to energy [6] may have a significant impact on social structure by contributing to increased social inequalities. Social status is one of the most important factors influencing energy consumption [7,8].
The social and environmental aspects of energy use are interlinked. Energy poor households can be especially exposed to the effects of climate change, such as extreme cold or hot conditions [9,10]. Wealthier population groups have better means to tackle such changes, while some forms of individual adaptation (e.g., air conditioning) may exacerbate the problem. The energy use of energy poor households may also have specific local effects on factors that increase climate change (e.g., the use of solid fuels leads to high black carbon emissions) [11], while the energy solutions used by wealthier social groups (including ’smart’ techniques) may lead to the establishment of ’pollution havens’ in the developing world. [12]. As a result, inequalities in access to energy and specific energy solutions, as well as their societal impact, have significant environmental effects. Meanwhile, changing energy schemes, the spread of smart energy solutions in a variety of activities (e.g., transport, city management and governance, housing) are believed by many to solve the ever-present conflict between economic competitiveness, social justice, and environmental quality. However, some scholars dispute their potential in this respect, [13,14] and the effects of such solutions have not been widely researched [15].
Residential energy consumption is contingent on the interplay of various factors, including socio-demographic factors (such as gender, socio-economic status, income, dwelling characteristics, and location), psychological and sociopsychological factors (such as knowledge, awareness, values, beliefs, attitudes, motives, goals, and internalised norms) and contextual and structural factors (such as laws, regulations and policies, available technology as well as information) [9,16,17,18,19].
Development of indicators to define energy poor households and analysis of their characteristics is in the forefront of energy poverty research. Energy poverty indicators can be categorized in various ways; in this study, based on the international literature, we use the following three categories [20,21]: (1) the consensual approach or subjective indicators, which rely on the comfort or affordability experienced by the household; (2) the expenditure-based approach, which focuses on the share of energy expenditure within the total household income; and (3) complex indicators, which aim to capture the complexity of energy poverty by combining several indicators. This approach recommends finding the most adaptable indicators, taking into account the specific features of the given country [20]. All types of indicators have certain advantages and disadvantages, such as in terms of comprehensiveness, data accessibility, and comparability [21]. Expenditure-based indicators are easily comparable but may not identify households that use specific strategies to manage their energy costs, such as non-market solutions to acquire energy (e.g., collected wood) or under-consumption; moreover, such indicators need reliable data on energy expenditures and incomes, which are difficult to obtain via surveys. By contrast, complex indicators may better grasp the region- and country-specific aspects of energy poverty but demand more information. Finally, subjective indicators may be less comparable, but energy poverty-related experiences of households may be more easily measured via survey methods.
An emerging literature conceptualises the issue of energy vulnerability, which, distinctively from energy poverty as a condition in a given timeframe, is a probabilistic concept highlighting “the factors that affect the likelihood of becoming [energy] poor” Factors considered include the built environment, including its adequacy for actual household needs and flexibility to adapt to household needs—also a condition of the tenancy structure and the relevant regulatory framework—as well as energy-related social practices. The energy vulnerability approach also emphasizes that households’ status in terms of energy poverty may change over time, upon changes in such factors [22] that are relatively easy-to-measure via the survey method, and it is also suitable to define households’ actual position in terms of energy vulnerability beyond the energy poor/non energy poor divide. Based on such considerations, this article draws attention to a group at risk of energy poverty.
Our study is committed:
- o
- To use an indicator that can be more reliably measured via survey method compared with commonly used indicators and is suitable for a more differentiated distinction in terms of households’ energy vulnerability, beyond the energy poor/non energy poor dichotomy;
- o
- To present the characteristics of the group at risk of energy poverty in addition to the description of the energy poor group in order to drive more attention of the latter;
- o
- To examine the differences in the mindsets of respondents belonging to different groups concerning specific aspects of heating energy generation (environmental sustainability, energy supply system-related, economic, and technical aspects), to grasp some of the psychological and sociopsychological factors related to energy consumption [8].
In our analysis, we used an indicator constructed with the use of our survey data to capture households’ actual energy vulnerability status (see Section 2.1.). We described the typical characteristics of these groups, such as urban–rural differences and household typology. Furthermore, we examined the mindsets of different groups of users concerning heating energy generation, in order to gain a better understanding of differences between the established groups.
1.1. Energy Poverty in Central and Eastern Europe
Energy poverty shows a distinct geographical pattern within the EU [23,24]. Data show a gap in terms of energy poverty between the Western and Northern countries, the Eastern and South-Eastern countries, and the Baltic states). Residents of new EU member states as well as old member states, where the GDP per capita is below the EU average, are more likely to be unable to meet their basic energy needs [23]. An expert analysis for the European Climate Foundation calculates an Energy Poverty Index for EU member states and ranks them based on their progress in alleviating domestic energy poverty. According to the classification (Definition A1), there is a clear divide between the North-Western countries on the one hand and the Southern and Eastern countries on the other [25]. Hungary ranked 27th out of the 28 EU member states in 2015 (European Climate Foundation, 2019).
In CEE, the higher rate of energy poverty stems from similar trajectories in terms of past political and economic development and transformations in the post-socialist period [26]. An ongoing study [20] examining five CEE countries (Hungary, Lithuania, Bulgaria, North Macedonia, and Ukraine), with a focus on energy poverty rates, definitions of energy poor households, and funding programmes to reduce energy poverty, points out similarities between the examined countries, such as a worse performing building stock, low incomes, the dominance of private ownership in the housing sector, inadequate housing benefits to ease affordability problems, and the widespread use of solid fuel for energy generation.
1.2. Energy Poverty in Hungary
In Hungary, as well as elsewhere, energy poverty is strongly path-dependent [27]. The high rate of energy poverty in international comparison is embedded in both its past political, economic, and technical developments, and its post-socialist transformation since 1990. The context of its relatively high rate of energy poverty is set by a poorly performing building stock, with a large number of energy-inefficient detached housing in addition to a high rate of housing estate apartments, an absence of comprehensive measures to increase energy efficiency, low incomes, a strong government control over tariffs, as well as the lack of effective social safety nets to improve housing affordability [27].
Energy poverty is concentrated in rural areas and family houses, but specific problems also arise in multi-family apartment buildings [20,28].
There is no officially accepted indicator for measuring energy poverty in Hungary. Several studies have focused on the methodology for measuring energy poverty, the range of possible indicators and their applicability [18,29], including the indicators used in the EU [30]. The indicators considered include: the 2M indicator, which deems a household energy poor if its energy expenditures exceed the double of the national median; the Low Income High Costs (LIHC) indicator, according to which a household is energy poor if after paying its energy bills it falls into income poverty; and the M/2 indicator, which draws attention to under-consuming households by designating those with energy expenditures less than half of the national median as energy poor.
Kőszeghy and Feldmár [31] estimated that in 2015, the proportion of energy poor households was approximately 10.5% based on the 2M indicator and 14.4% based on the LIHC indicator (in the case of the latter, having deducted households’ energy expenditures from household income, the calculation used per capita residual income to determine income poverty). The researchers also calculated the M/2 indicator and found that 10.4% of Hungarian households consume too little energy.
Bajomi et al. [32] reviewed 2018 EU-SILC data on further statistical indicators for measuring energy poverty, such as dwelling inadequacy, arrears on utility bills and inability to keep one’s home adequately warm. We did the same for 2020 and witnessed a slight decrease in every indicator:
- -
- 20.4% of the population was living in a dwelling with a leaking roof, damp walls, floors, or foundation, or rot in window frames or floor (23% in 2018) [33];
- -
- 10.4% of the population had arrears on utility bills (11% in 2018) [34];
- -
- 4.2% of the population was unable to keep the home adequately warm (6% in 2018) [35].
Accordingly, EU-SILC data show that households below the poverty line are more affected by energy poverty: in 2020, 38.4% of income-poor households were living in a dwelling with the above housing inadequacy problems, 25% had arrears on their utility bills, and 14.9% were unable to keep their home adequately warm [32].
In recent years, the overall share of energy costs in households’ expenditures has decreased, linked to the government’s utility fee reduction programme, introduced in 2013 (Figure A1). As part of the utility fee reduction programme, the government decreed a reduction of certain utility fees, including the prices of electric energy and natural gas for household consumers in a uniform ratio, regardless of social status [3]. The average share of annual household maintenance and household energy expenditure per capita decreased from 25.2% in 2010 to 18.5% in 2019.
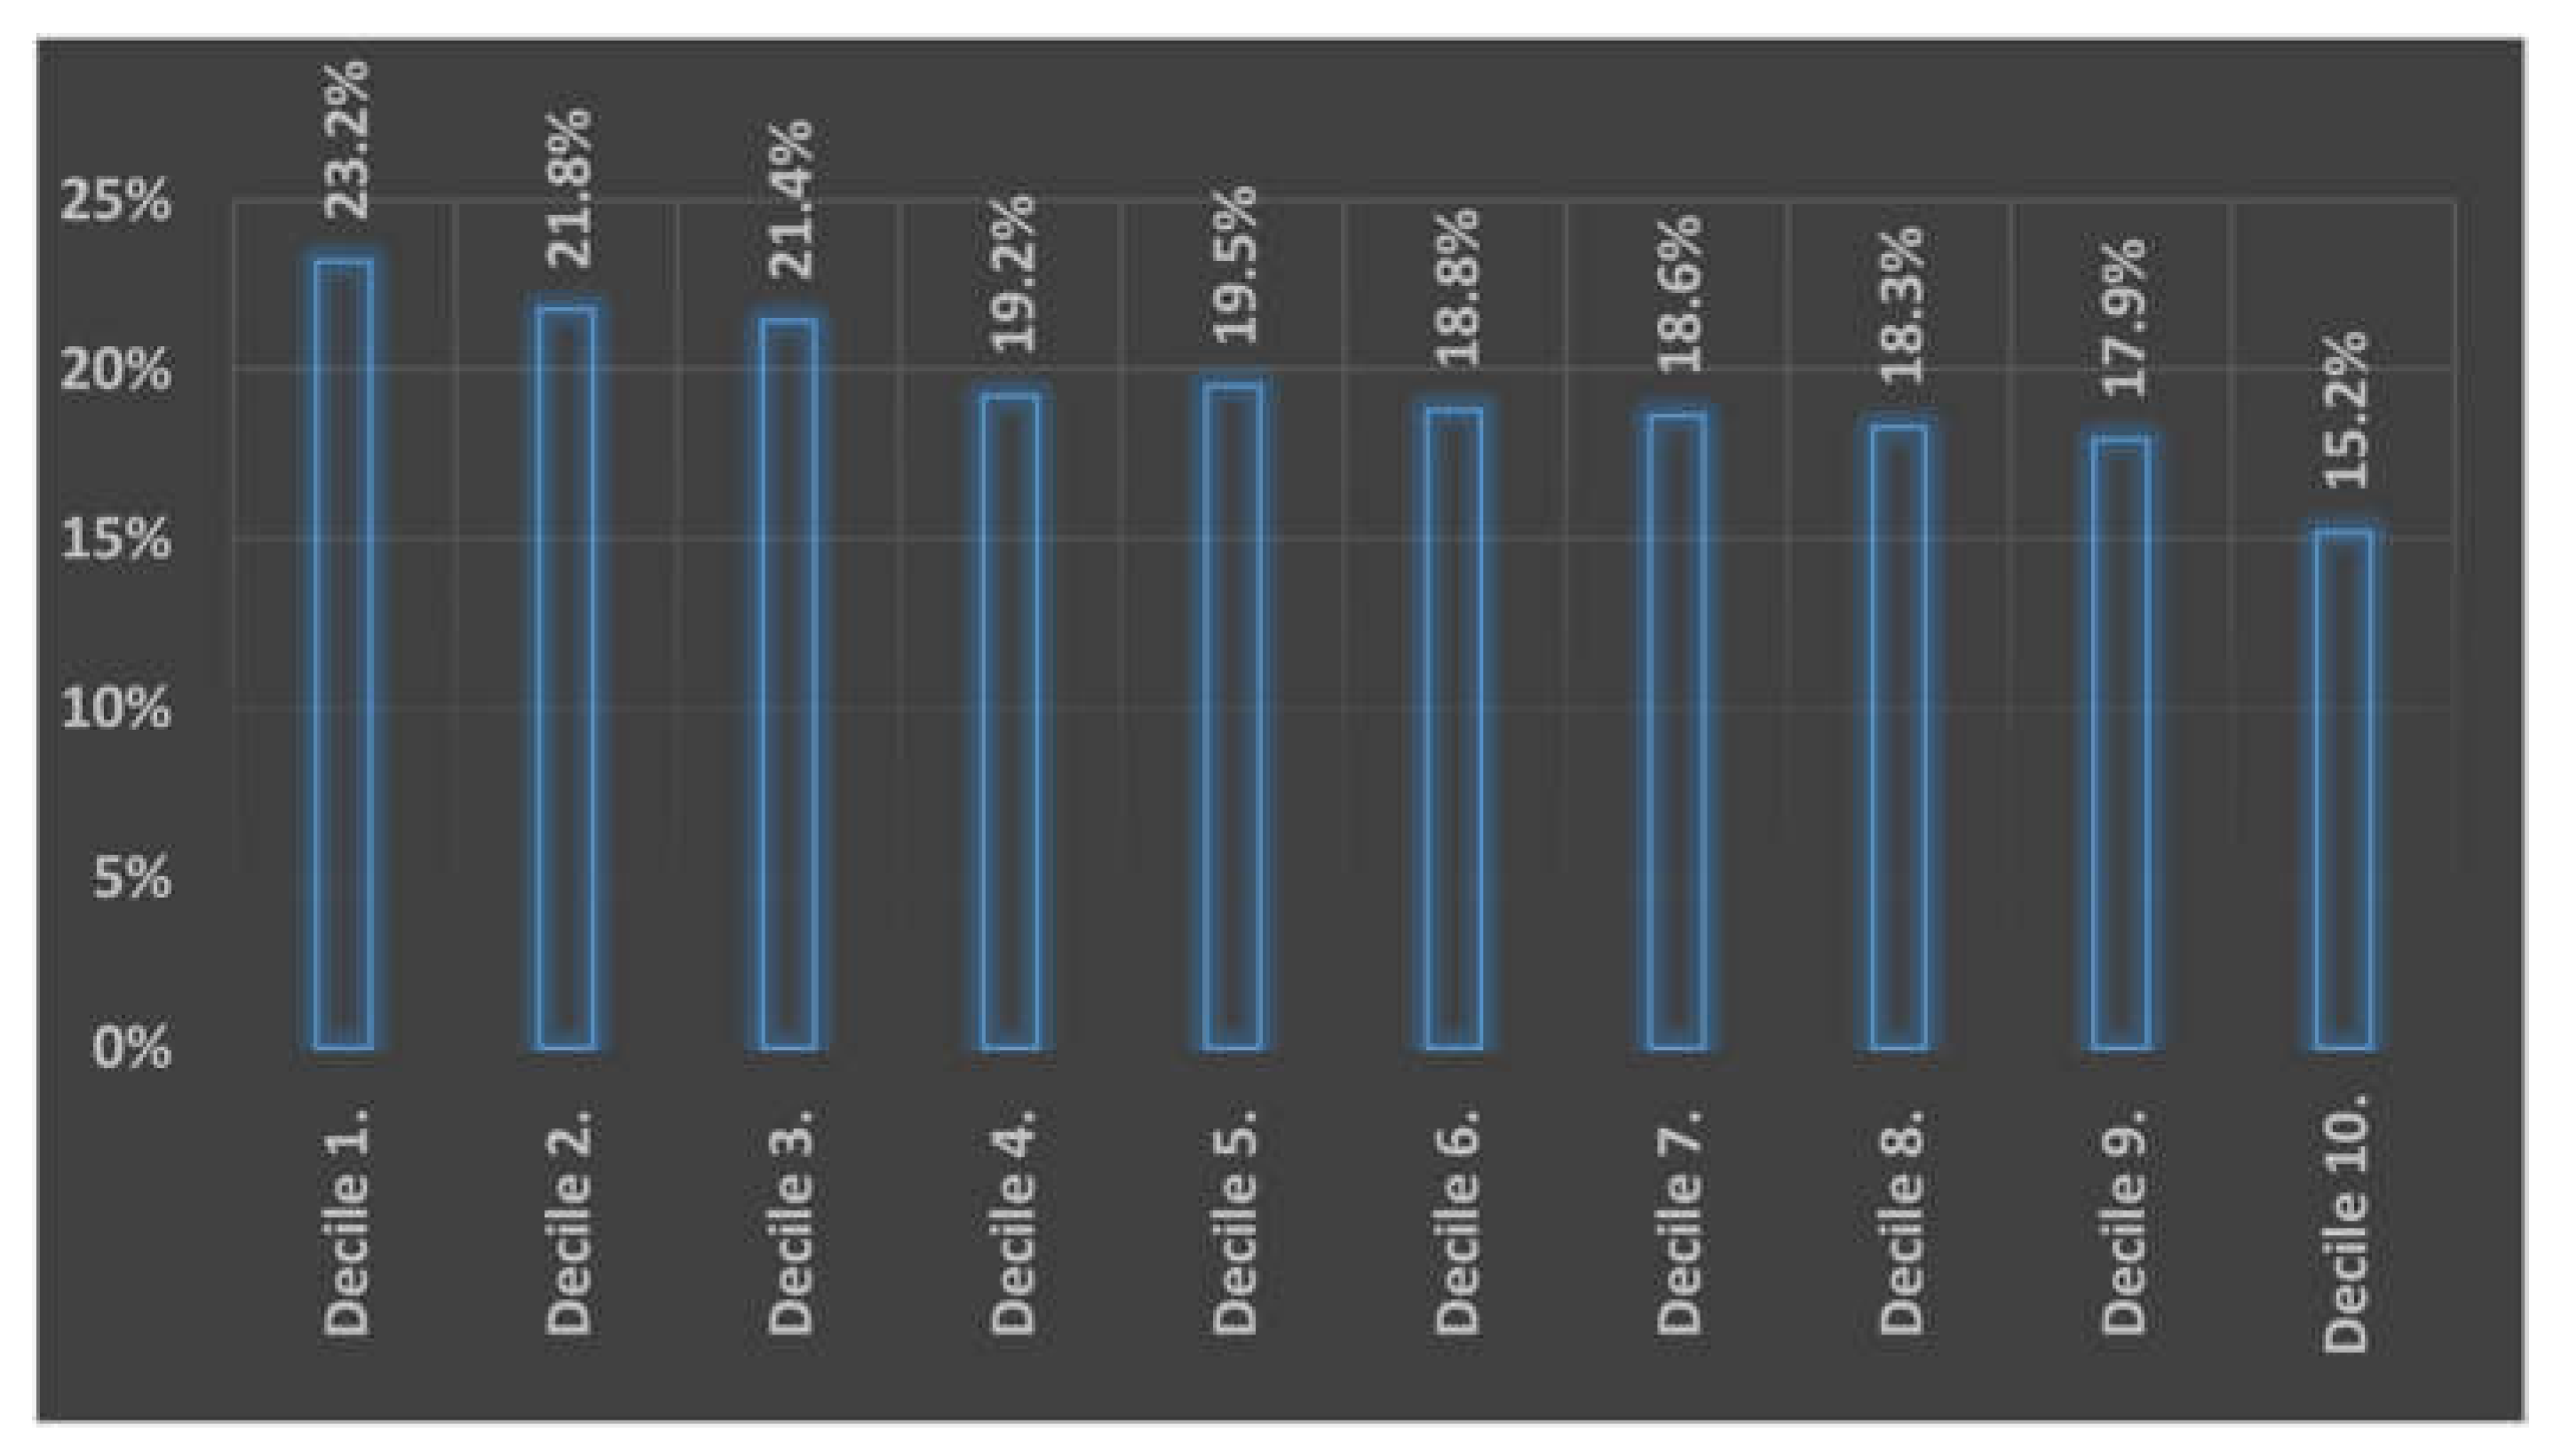
The programme has had a socially uneven effect. Due to the consumption-related nature of the scheme, it has resulted in relatively less savings for lower consuming (including under-consuming) households. Furthermore, it does not refer to certain energy sources that are frequently used by low-status households, such as firewood. Therefore, even though it has reduced the share of energy expenditures for many households, it has exacerbated pre-existing social disparities in terms of the energy cost burden. The decrease in the share of energy expenditures between 2010 and 2019 was 5% in the 1st income decile and 6.2% in the 10th decile. In 2019, 23.2% of the expenditure of the 1st income decile and 15.2% of the expenditure of the 10th decile was spent on household maintenance and household energy (Figure 1).
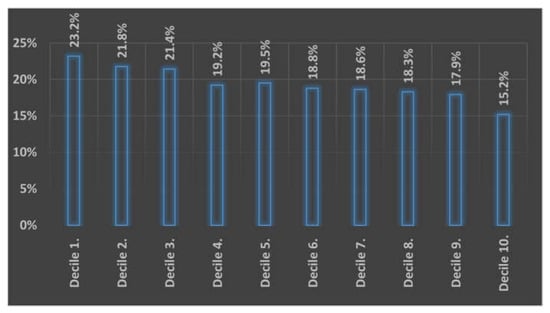
Figure 1.
Share of annual household maintenance and household energy expenditure per capita in income deciles, in 2019 (%). Source: Compiled by authors based on CSO data [36].
The aim of our study was to further analyse households’ energy vulnerability in Hungary. Our study contributed to this by interpreting households’ energy poverty status as not as a dichotomous but as a continuous variable. We argue that there is no clear dividing line between energy poor and non energy poor households. In the Hungarian context, data suggest that there is a distinctive group of households, which at present does not classify as energy poor but may easily slip into the energy poverty without measures addressing its affordability problems and the energy efficiency problems of its housing. However, their relatively more resources compared with energy poor households, and higher awareness towards climate issues could make them an important target group of energy efficiency policies and measures. On the other hand, this article focuses on mindsets concerning different aspects of heating energy generation methods, as, in Hungary, while heating constitutes a dominant part of domestic energy use, similarly to other CEE countries, the prevalence and operation of different energy generation modes significantly differ from that in Western Europe: solid fuel is used to a much higher extent than in other regions in Europe, and inefficient and sometimes still non-adjustable district heating is still prevalent in the housing stock. The issue of heating also receives specific significance due to the high rate of energy inefficient residential buildings in the country [37].
1.3. Social Disparities in Energy Efficiency and Energy Use in Hungary
In Hungary, heating constitutes a definitive part of domestic energy use. Therefore, in the following, we focus on practices and considerations concerning heating modes.
In the Hungarian housing stock, a large proportion of energy-inefficient housing—including a vast stock of rural housing—and low-income levels set the scene for energy poverty. The use of solid fuels is widespread, with households in lower income categories relying especially frequently on this heating method, while according to the international literature (and as presented later, in the case of Hungary), households that use solid fuels are most likely to fall into energy poverty [30]. Furthermore, inefficient heating devices are common. Similarly to other CEE countries, under-heating is widespread to keep energy costs at a manageable rate. Nevertheless, due to payment arrears, many consumers are excluded from the gas and electricity network. [38].
The most common heating method in Hungary is gas; 91.2% of the country’s settlements are connected to the gas network, although the smallest settlements (especially in rural areas) tend not to be connected. In such settlements, where low-status households are overrepresented, residents typically consume solid fuel. Moreover, it is common for households in the countryside to use solid fuels (including wood, briquettes, pellets, and coal) in addition to natural gas as an energy source. Furthermore, given that the installation or replacement of technical equipment for gas consumption requires a large financial investment, many poor households switch to solid fuels [32].
According to income quantiles (Table 1), the higher the income, the higher the proportion of natural gas or district heating users. Among the poorest households, in the first income quantile, the proportion of users who only use solid fuels is 4.4 times higher than in the fifth. Some such low-status households, being unable to obtain enough firewood to cover their energy needs—especially given that the price of wood has risen significantly in recent years—burn other cheaply available materials, sometimes including rubbish, creating large amounts of harmful emissions as a result [3,32]. However, with the help of EU funds and non-governmental organizations (NGOs), a very small proportion of households can install the most modern and environmentally friendly technologies, while the lack of resources to obtain enough fuel remains a problem.

Table 1.
Share of households by source of heating by income quintiles percentage (2019).
2. Materials and Methods
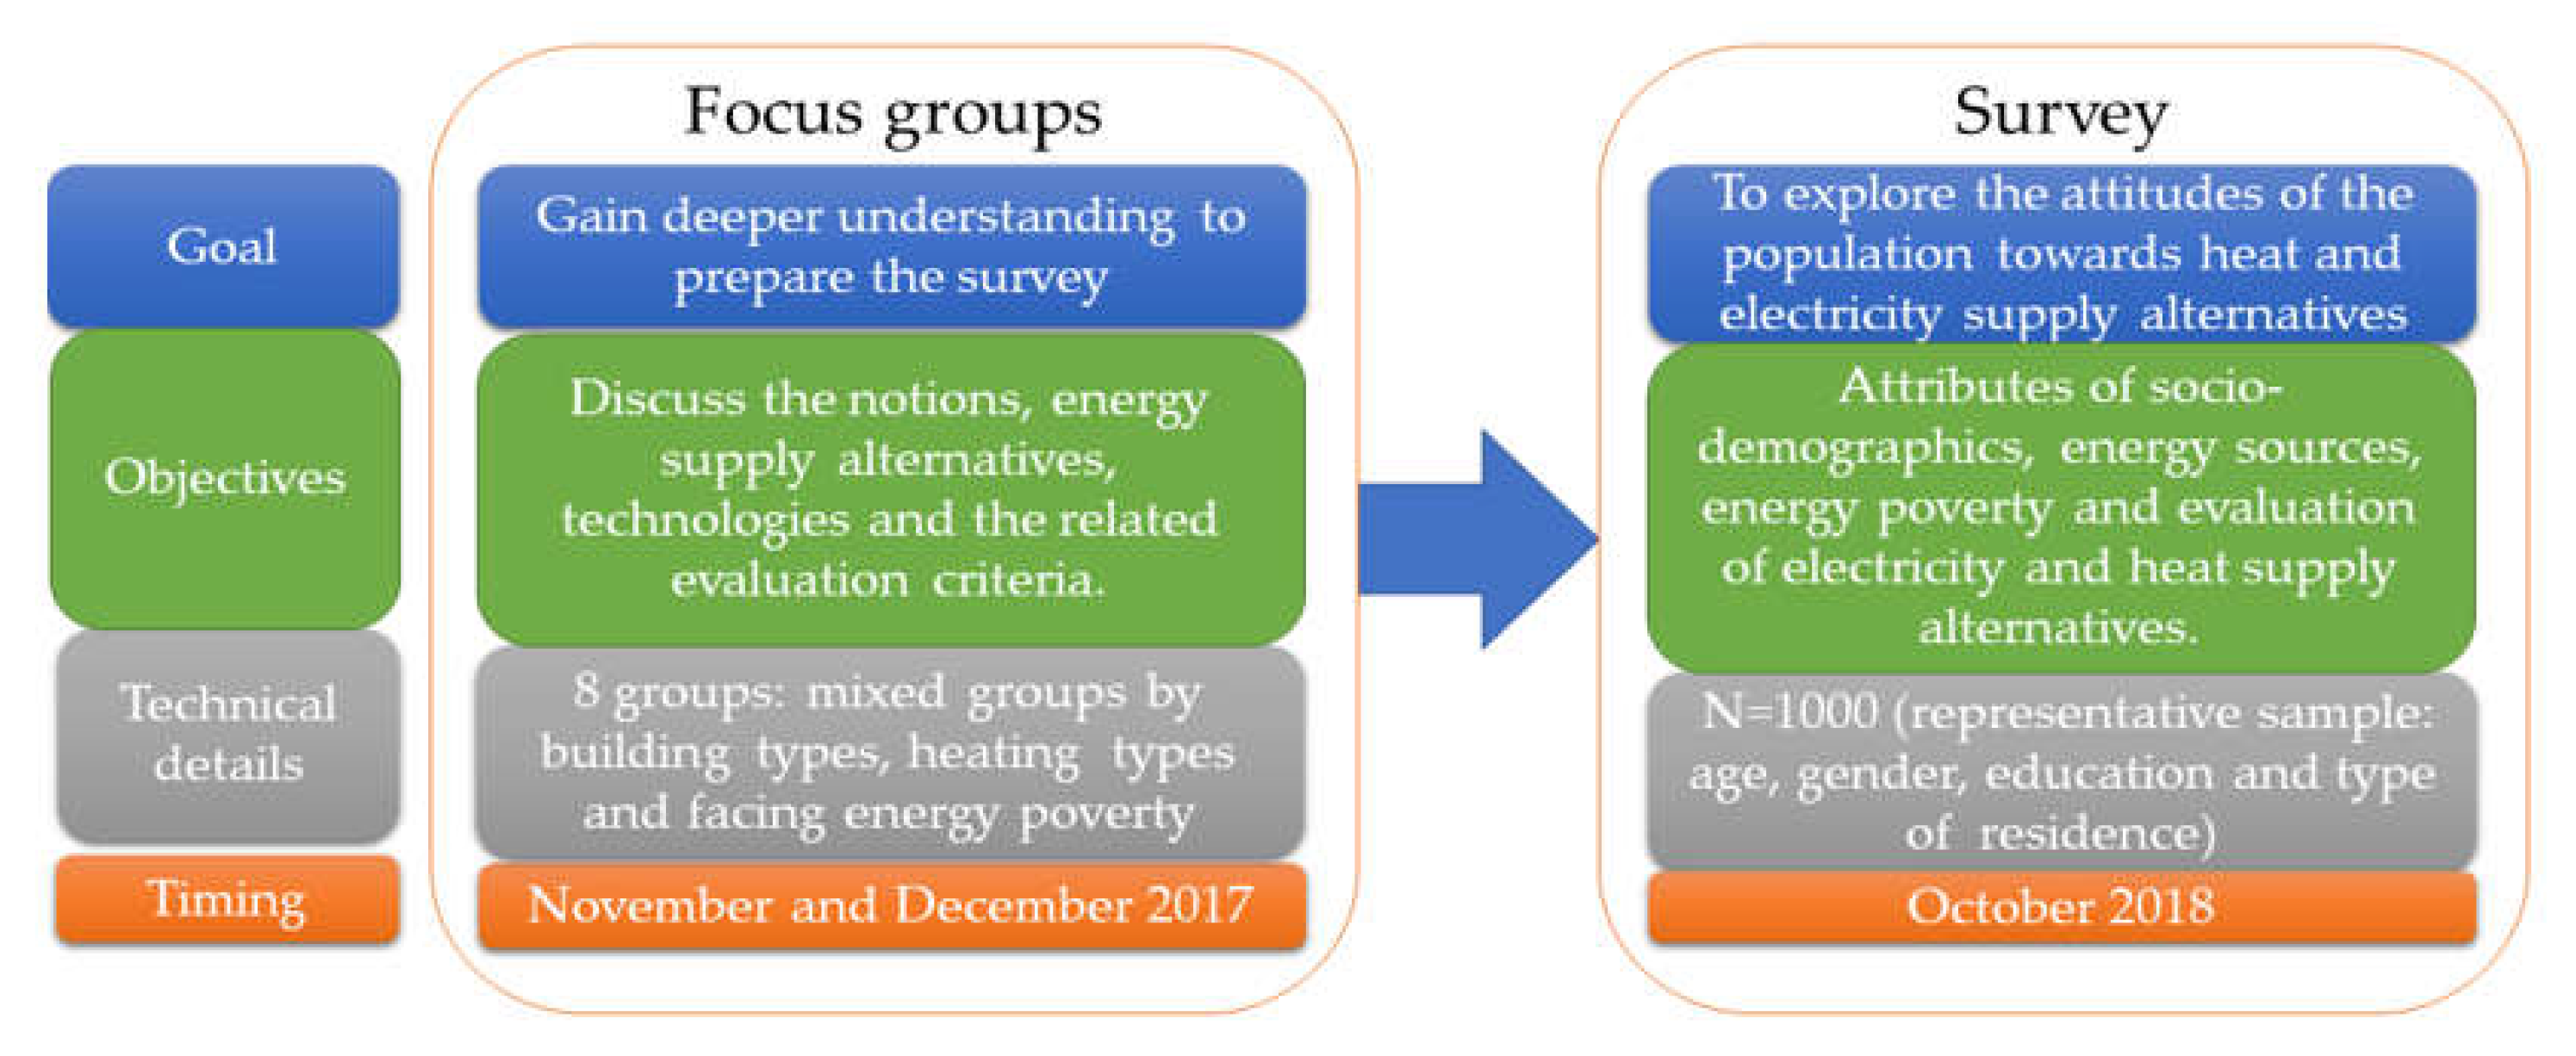
From empirical research, only survey data were used in this study. However, to facilitate interpretation, the entire research methodology is briefly described (Figure 2)

Figure 2.
Overview of the research process.
In the first step, based on focus group discussions, a qualitative analysis revealed the general interpretation of the most important scientific terms (or the lack of any interpretation) through the opinions of different social groups.
The qualitative part of the research was conducted in November and December 2017. Discussions were led in eight focus groups. We sought respondents living in different building types, using distinct heating types, and facing energy poverty. The discussions took place both in cities and in the countryside. The aim of the focus group discussions was to gain a deeper understanding of people’s knowledge and beliefs concerning the problems addressed in our study, so that we could prepare survey questions that would be suitable for a population sample with no specific background. The participants discussed the energy supply alternatives, technologies, and their related evaluation criteria. In the second step, we applied the results of the qualitative analysis to define the system of evaluation criteria of the survey and to specify the heating and electricity generation alternatives.
The quantitative part—the basis of our analysis—was a survey conducted in October 2018. The sample comprised 1000 people and was representative of the Hungarian adult population regarding age, gender, education, and type of residence. The list of the settlements in each county taking part in the sampling and the quota to be applied were selected based on the population census data of the Hungarian Central Statistical Office [40]. The survey interviews were conducted in different n zones of the settlements to ensure that we covered varied housing conditions and heating systems. The questionnaire included questions on socio-demographics, energy sources used, energy poverty and an evaluation of different aspects of heating-energy generation methods.
The final questions addressed the heat supply technologies used by the households and their willingness to pay. The evaluation of heat and electricity supply alternatives was explored using both a 1–5 scale rating and a line-by-line rating by each criterion. A pairwise comparison enabled us to determine the importance of some of the criteria emphasized.
Post-stratification weights were used to correct for deviations from population ratios to address non-response rates.
Some results from the database have already been introduced in another paper [41].
2.1. Methods
In order to assess households’ energy poverty status, we used a two-step cluster analysis [42,43], which was validated by a latent class analysis (LCA) [44,45].
We chose questions that eliminated frequent measurement difficulties. Questions about income and expenditures—used in expenditure-based indicators— are often either unanswered or differ significantly from reality. Discrepancies could be due to a lack of information, inaccurate knowledge, or intentional misrepresentation. We ultimately opted to use two questions, which helped to avoid such problems: one referring to respondents’ own accounts regarding insufficient residual income to afford other materially and socially necessitated needs after energy costs; the other to the use of external assistance (either financial or other means of support) to obtain enough energy.
We used the following two questions with 12 sub-questions:
- In the past 12 months, did it occur to your household that after paying your energy costs, there was not enough money left for any of the following? (Multiple choice)
- To pay other utility bills;
- For clothes, shoes;
- For food or medicine;
- For transport (public transport ticket, car fuel);
- Children’s school and kindergarten costs;
- For activities with friends, family.
- In the past 12 months, did you seek assistance to obtain enough energy from any of the following? (Multiple choice)
- Municipal support in the form of a ‘social fuel subsidy’;
- Municipal support for housing maintenance or debt management;
- Municipal support in any other form;
- Support from charities (church, NGO);
- Support from family or friends;
- Support from other sources.
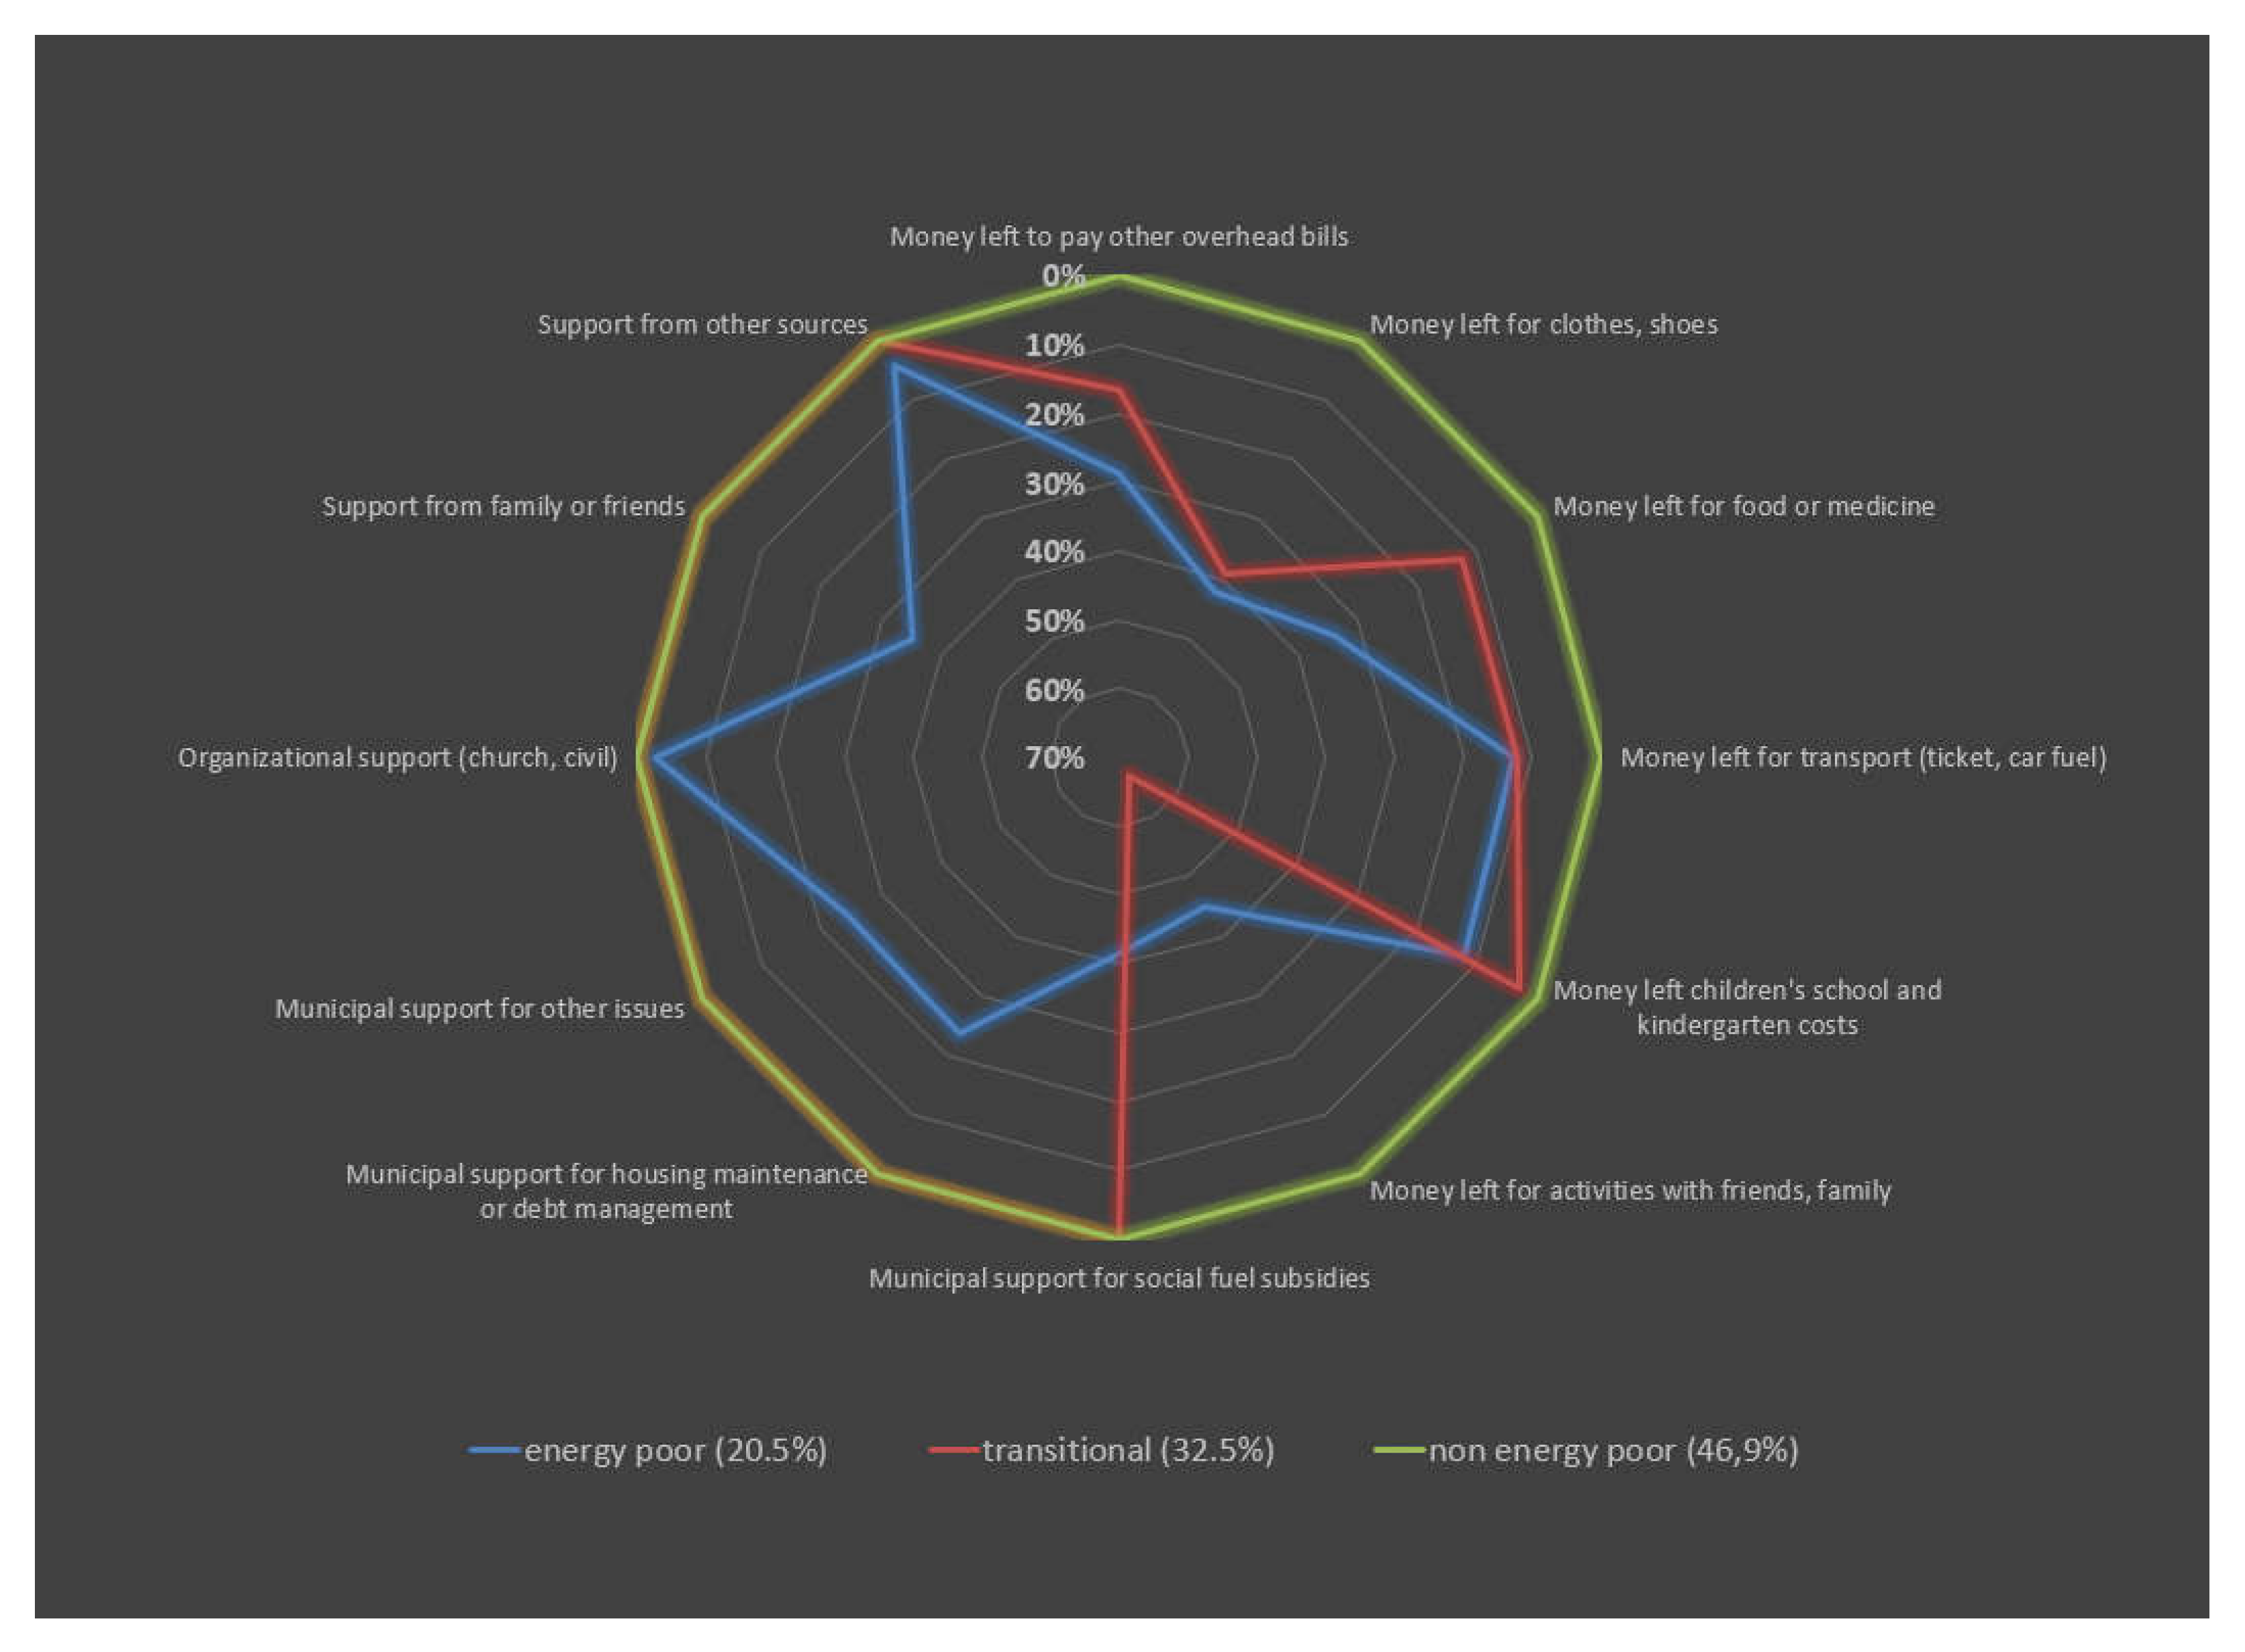
Our results support that the differences between groups can be perceived in such simple questions (Figure 3). In terms of the classification of energy poverty indicators, the first question related more to the consensual approach or subjective indicators, while the second related more to the expenditure -based approach. The method used to compile the various responses to an indicator classifies it among complex indicators [20].

Figure 3.
Cluster profiles: weighted proportion of respondents Compiled by the authors.
Our method has its limits. The financial possibilities of an empirical study in social sciences do not allow us to collect objective temperature measurements, energy consumption, and income data for a large sample. Such an investigation on even a smaller sample is not possible for reasons of data protection law. There is no way to link income data from tax authorities to families in which the measurements were taken. In addition, the income of many of the poorest does not even really show up at the tax office. For this reason, we were able to obtain information on room temperature, consumption, and income only on the basis of subjective information given by respondents during the survey.
The method requires further validation; on the one hand, using another Hungarian database or empirical research, on the other hand, based on similar surveys in other CEE countries. In addition, qualitative information should be obtained, such as semi-structured interviews for an in-depth discussion of psychological and sociopsychological factors.
The analysis defined three groups, which, based on their cluster profiles, could be defined as an energy poor, non energy poor, and ‘transitional’ group.
In order to test the stability of the model, we also performed the LCA model. This gave 100% identical results for the identification of the two clearly defined groups (energy poor and non energy poor), whereas in the case of the low-energy group, a small group of respondents (<3%) could not be clearly classified with the LCA.
Given that the two approaches yielded approximately the same results, we ultimately worked with the result of the easier-to-interpret two-step procedure (Figure 3).
To determine the importance of different psychological and sociopsychological factors concerning heating energy generation methods, we used the Elo rating system, which was originally a method for calculating the relative skill levels of players in zero-sum games, such as chess [46]. However, the procedure can be used for other pairwise comparison tasks, such as image comparison, or to evaluate the relative acceptability of a food or beverage based on a specific choice between two dishes [47,48,49,50].
In this case, the basis of the comparison was a survey question block, where the respondents could weigh the importance of different aspects of heating generation methods against each other. Items offered for consideration were partly macrolevel, such as the aspect of environmental sustainability and energy supply system-related issues, partly microlevel, such as economic and technical aspects of energy generation, as summarised in Table 2.
Table 2.
Mindsets on heating energy generation methods—items used in the pairwise comparison.
Thus, the Elo rating method was used to evaluate the importance of each aspect for each individual. However, as the comparison was not complete (i.e., not all aspects were evaluated in all respects, or there were respondents who omitted some comparisons, resulting in individual-level evaluations), a degree of uncertainty necessarily emerged. Furthermore, the Elo rating system is time-dependent, so the order of the individual comparisons has an effect on the final scores.
To address this set of problems, we used two procedures.
- On the one hand, the scoring was repeated 100 times for each individual in a random order. In the case of each run, the initial values of each aspect were in each case the final results of the previous run, except for the first run, where each aspect was uniformly given a value of 10,000. Using this procedure, we were able to handle the time dependence of the evaluations given for each aspect. The expected value fluctuated around 10,000.
- However, given that we performed different numbers of comparisons for different individuals, depending on how many cases were evaluated and how highly they were evaluated, the range of the Elo points differed from individual to individual. In order to deal with this issue and for the results to be sufficiently robust, the Elo points that could be assigned to each aspect for each individual were arranged into three categories based on the individual mean and the standard deviation of the Elo points.
- Average: an interval of one standard deviation around the mean;
- Low: values at least one half of the standard deviation in the negative direction from the mean;
- High: values at least one half of the standard deviation in the positive direction from the mean.
With the applied standard deviation-based procedure, 38.2% belonged to the average category in the case of the normal distribution of scores, while 30.9% to 30.9% belonged to the two extreme groups.
To examine the differences between energy groups, cross-table analyses were performed, where the values corrected by the subsequent stratification weights were evaluated. For each table, the chi-square statistic and the corresponding significance level were determined. In each case, we made a statistical decision at 95% confidence level. The IBM-SPSS, version 26.0, was used for cross-table analyses [51].
3. Results and Discussion
3.1. Characteristics of the Three Groups
Our model defined three groups: in addition to the energy poor and non energy poor group, there is a ‘transition’ group of households, which significantly differs from the other two household groups in terms of its social characteristics and evaluation of different aspects of heating energy generation methods. (Table 3.)
Table 3.
Specific characteristics of each group.
The energy poor group exhibited all the characteristics that have already been listed in the international literature: low level of education, low income due to unfavourable and/or unstable labour market position, overrepresentation of vulnerable household members, and housing deprivation. Among them, people with primary education are overrepresented. The proportion of people who are unemployed, receive childcare support, and are inactive and dependent is significant in this category. In these households, we found children and people with long-term health problems at above the average rate. A remarkably larger than average proportion of households that can be considered energy poor on the basis of our cluster structure were found to live in villages in economically deprived Northern Hungary.
Exploring the circumstances of the families living in energy poor households, we found that they mostly live in detached houses and in apartments smaller than 50 square metres. These dwellings are small, and of low comfort: they typically have one or two rooms and often lack a bath and lavatory or are only equipped with the latter. A large proportion of them use a liquefied petroleum gas (LPG) bottle, electricity, or wood for heating. In the survey, many such households claimed that they can heat up no more than 40 square meters and that the temperature reached by heating in their dwellings tends to stay below 19 degrees Celsius.
The dwellings of those living in energy poverty exhibit serious housing deprivation problems: water damage on the walls and the floor, moulding, improperly closing doors and windows, and poor or lacking thermal insulation are very common problems.
Households living in energy poverty mostly comprise at least four people, with three or more dependent household members. The income level of these households is typically below HUF 140,000 (approximately EUR 390) per month. Energy costs pose a major burden to them. In the past year, most of these households were unable to pay their electricity or gas bill on time or could not buy enough fuel. A large proportion of them used energy-saving strategies, such as not using as much heat as desired, not heating every room, reducing electricity consumption, or using less hot water. A considerable proportion claimed to collect wood and use waste for heating (Table A2).
Households belonging to the energy poor category expressed that they are extremely afraid of energy becoming too expensive for Hungarian households and, unsurprisingly, given their price sensitivity, were unwilling to pay more for using renewable energy.
Members of the non energy poor group typically live in the most developed regions of the country, generally in apartments in housing estates, single-family homes in big cities or in multi-apartment buildings (both housing estates and other types of buildings) in the capital city, Budapest, in surrounding central Hungary, and in Southern and Western Transdanubia. Their higher education level and mostly stable labour market position ensures a higher income compared with the other groups and allows them to live in large apartments with full amenities and to heat their homes according to their perceived needs (i.e., even warmer than recommended).
A significant proportion of non energy poor households live in housing with a floor area of at least 100 square metres, with three rooms or more and all modern conveniences. These are mostly detached houses, but multi-family building apartments (both housing estates and other types of buildings) are also highly represented.
The heated floor area of the apartments usually exceeds 80 square metres, and the typical temperature is 23 to 24 degrees Celsius, (i.e., even warmer, than recommended by experts). The typical heating modes are district heating and gas. Their residents are only moderately concerned about a rise in energy prices.
These households are mostly composed of two people living with one dependent. Their income level exceeds HUF 275,000 (approximately EUR 770). Energy costs are not challenging for them. They are also willing to spend more on renewable energy.
The transitional group lies between the two groups in terms of education, financial situation, place of residence and energy-related consciousness. Members of this group tend to belong to the lower middle class, not among the most disadvantaged in terms of housing, education, and income. These households are overrepresented in small cities in the middle-income areas of the country, such as in the Northern Great Plain and the Southern Great Plain regions. A significant proportion of their residents hold a high school diploma.
Regarding living conditions, the main characteristic found for these households is that they live in a floor area of between 60 and 100 square metres, heated up to a somewhat higher degree than energy poor households, 20 to 22 degrees Celsius. Their most typical heating method is piped natural gas. A large proportion of these households struggle with energy efficiency problems due to their housing’s technological faults (such as improperly closing windows and doors). Their monthly income level is typically between HUF 161,000 and HUF 200,000 (approximately EUR 450–560). Energy costs pose a burden for them, especially in winter, or intermittently. A large proportion of them claimed to be unable to pay their gas bill on time within the past year. Relatedly, a significant proportion limited their energy consumption by not using as much heat as desired during the day or reducing their heating when nobody was at home (Table A2).
3.2. Mindsets on Different Aspects of Heating Energy Generation
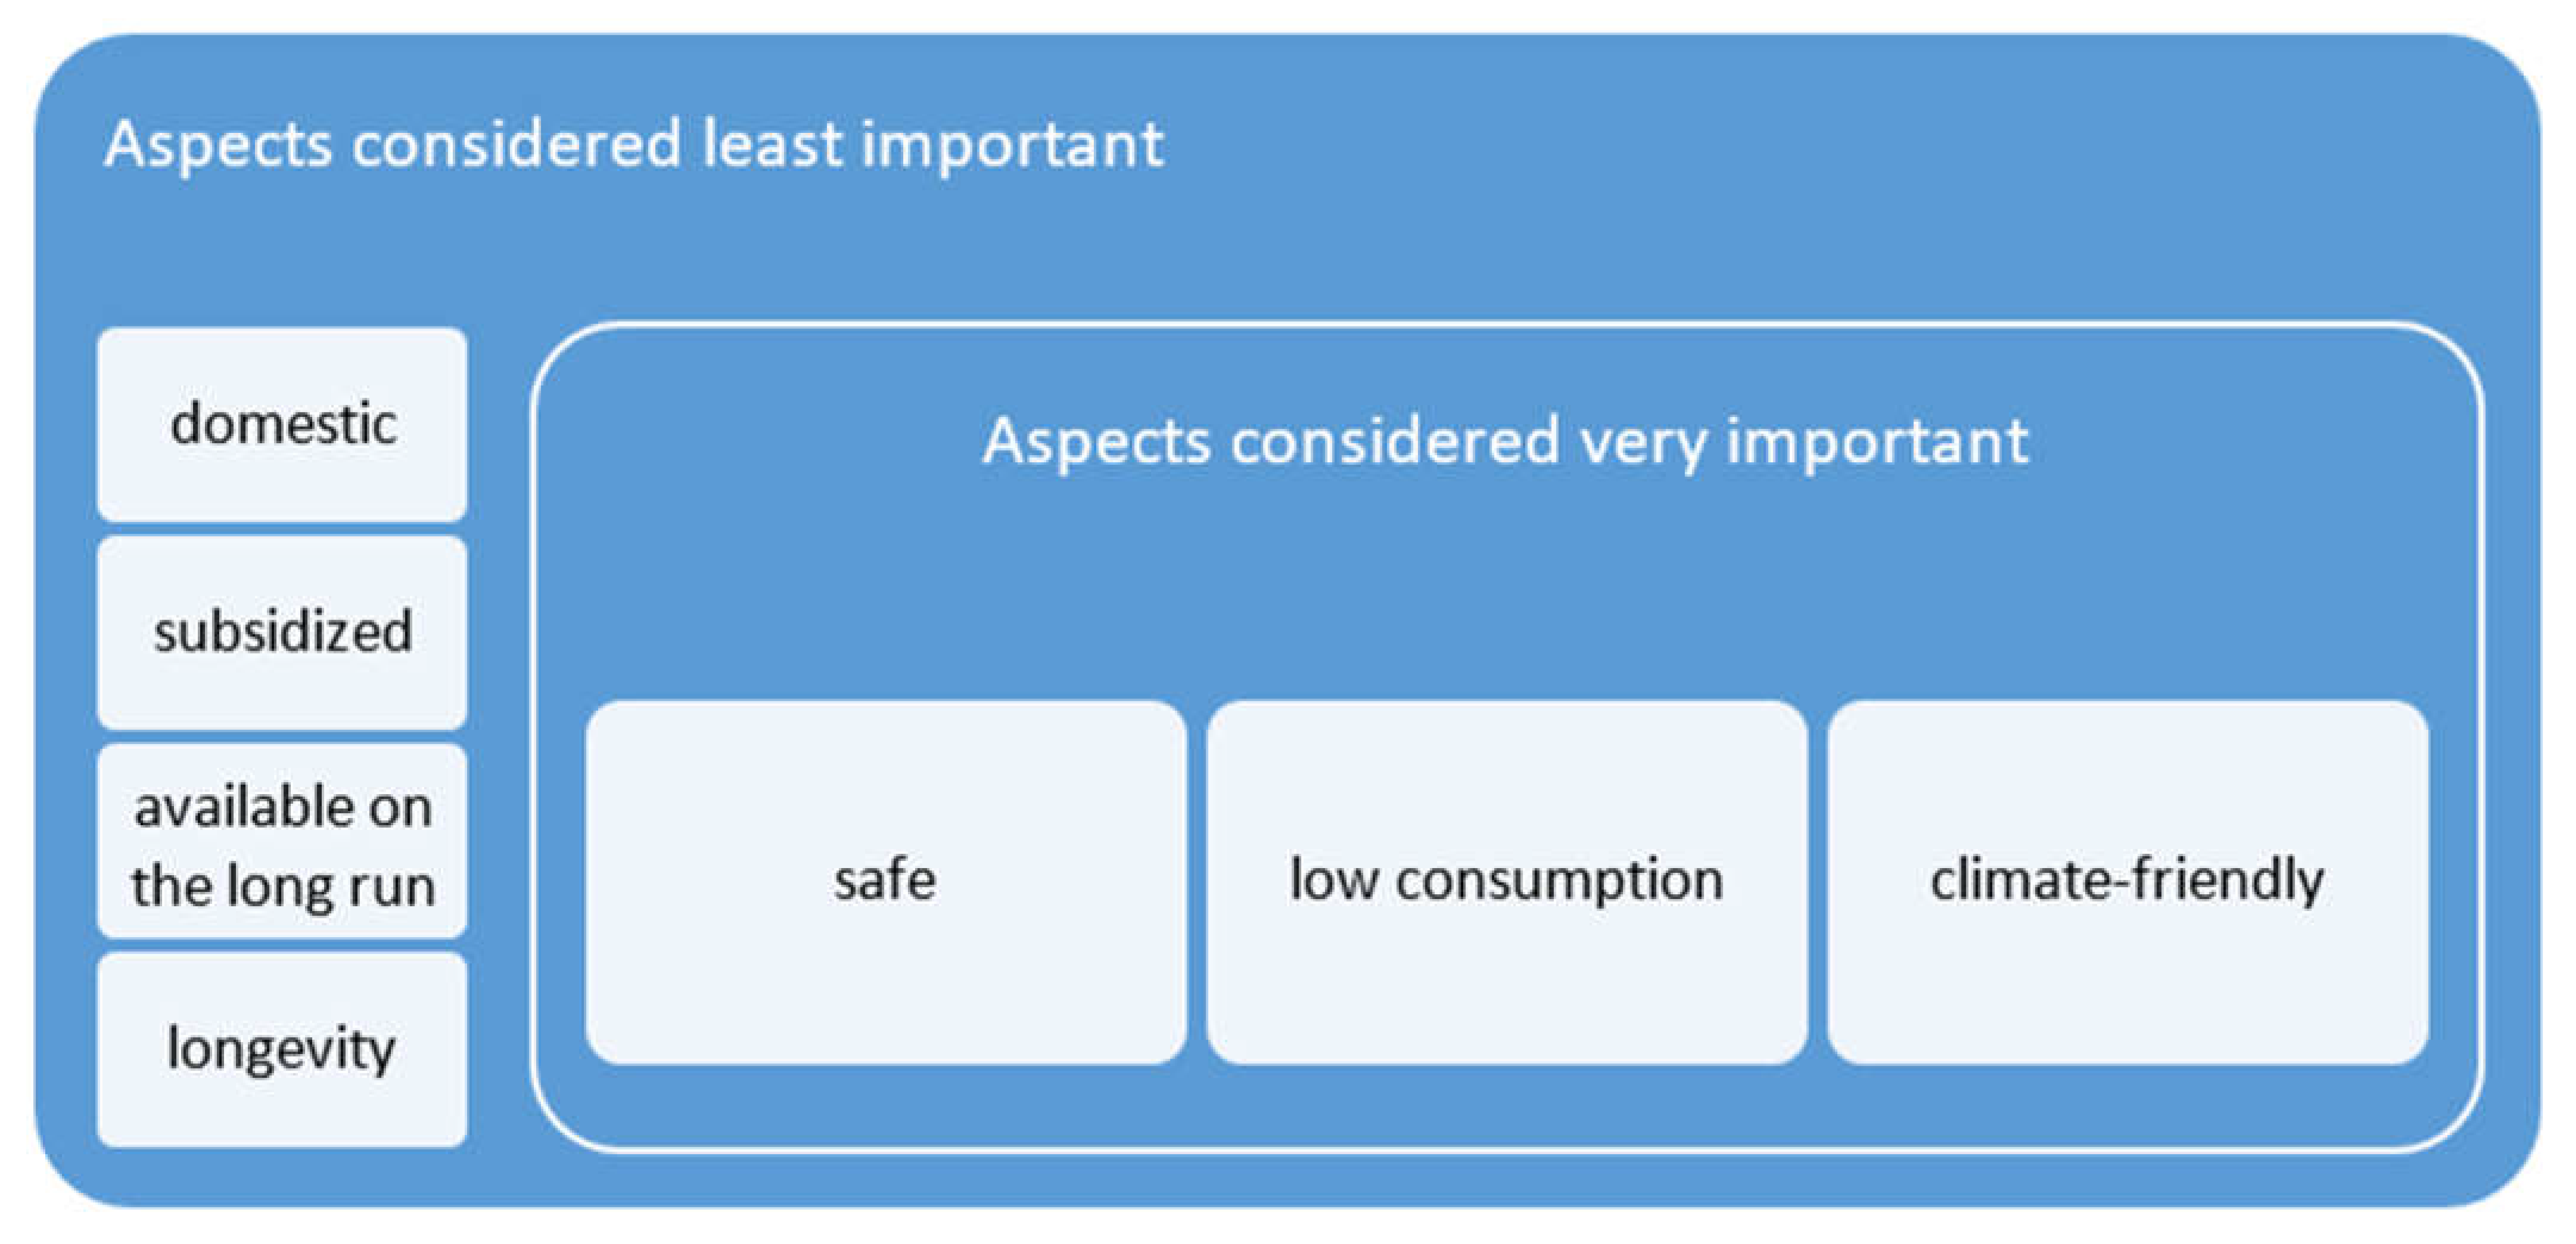
We found that the highest rated aspects of heating energy generation methods pertained to microlevel, technical aspects of heating energy generation methods’ operation, but a macrolevel item, environment-friendliness, also appeared as a relatively important item (Figure 4 and Figure A2).

Figure 4.
Some aspects of minor and major importance in connection with heating energy generation modes. Compiled by the authors.
The presence of climate-friendliness among the relatively more important aspects of heating energy generation is somewhat surprising, as in Hungary, climate awareness is low compared with in other countries. [52]. Municipalities in larger cities have recently initiated climate awareness programmes with EU co-financing, but with no significant results to date. However, the importance of such an aspect may be also linked to the fact that a significant proportion of this group lives on housing estates, where district heating, which is regarded as a relatively environmentally friendly heating method, is a basic characteristic of the dwelling type rather than being a flexible choice of the household.
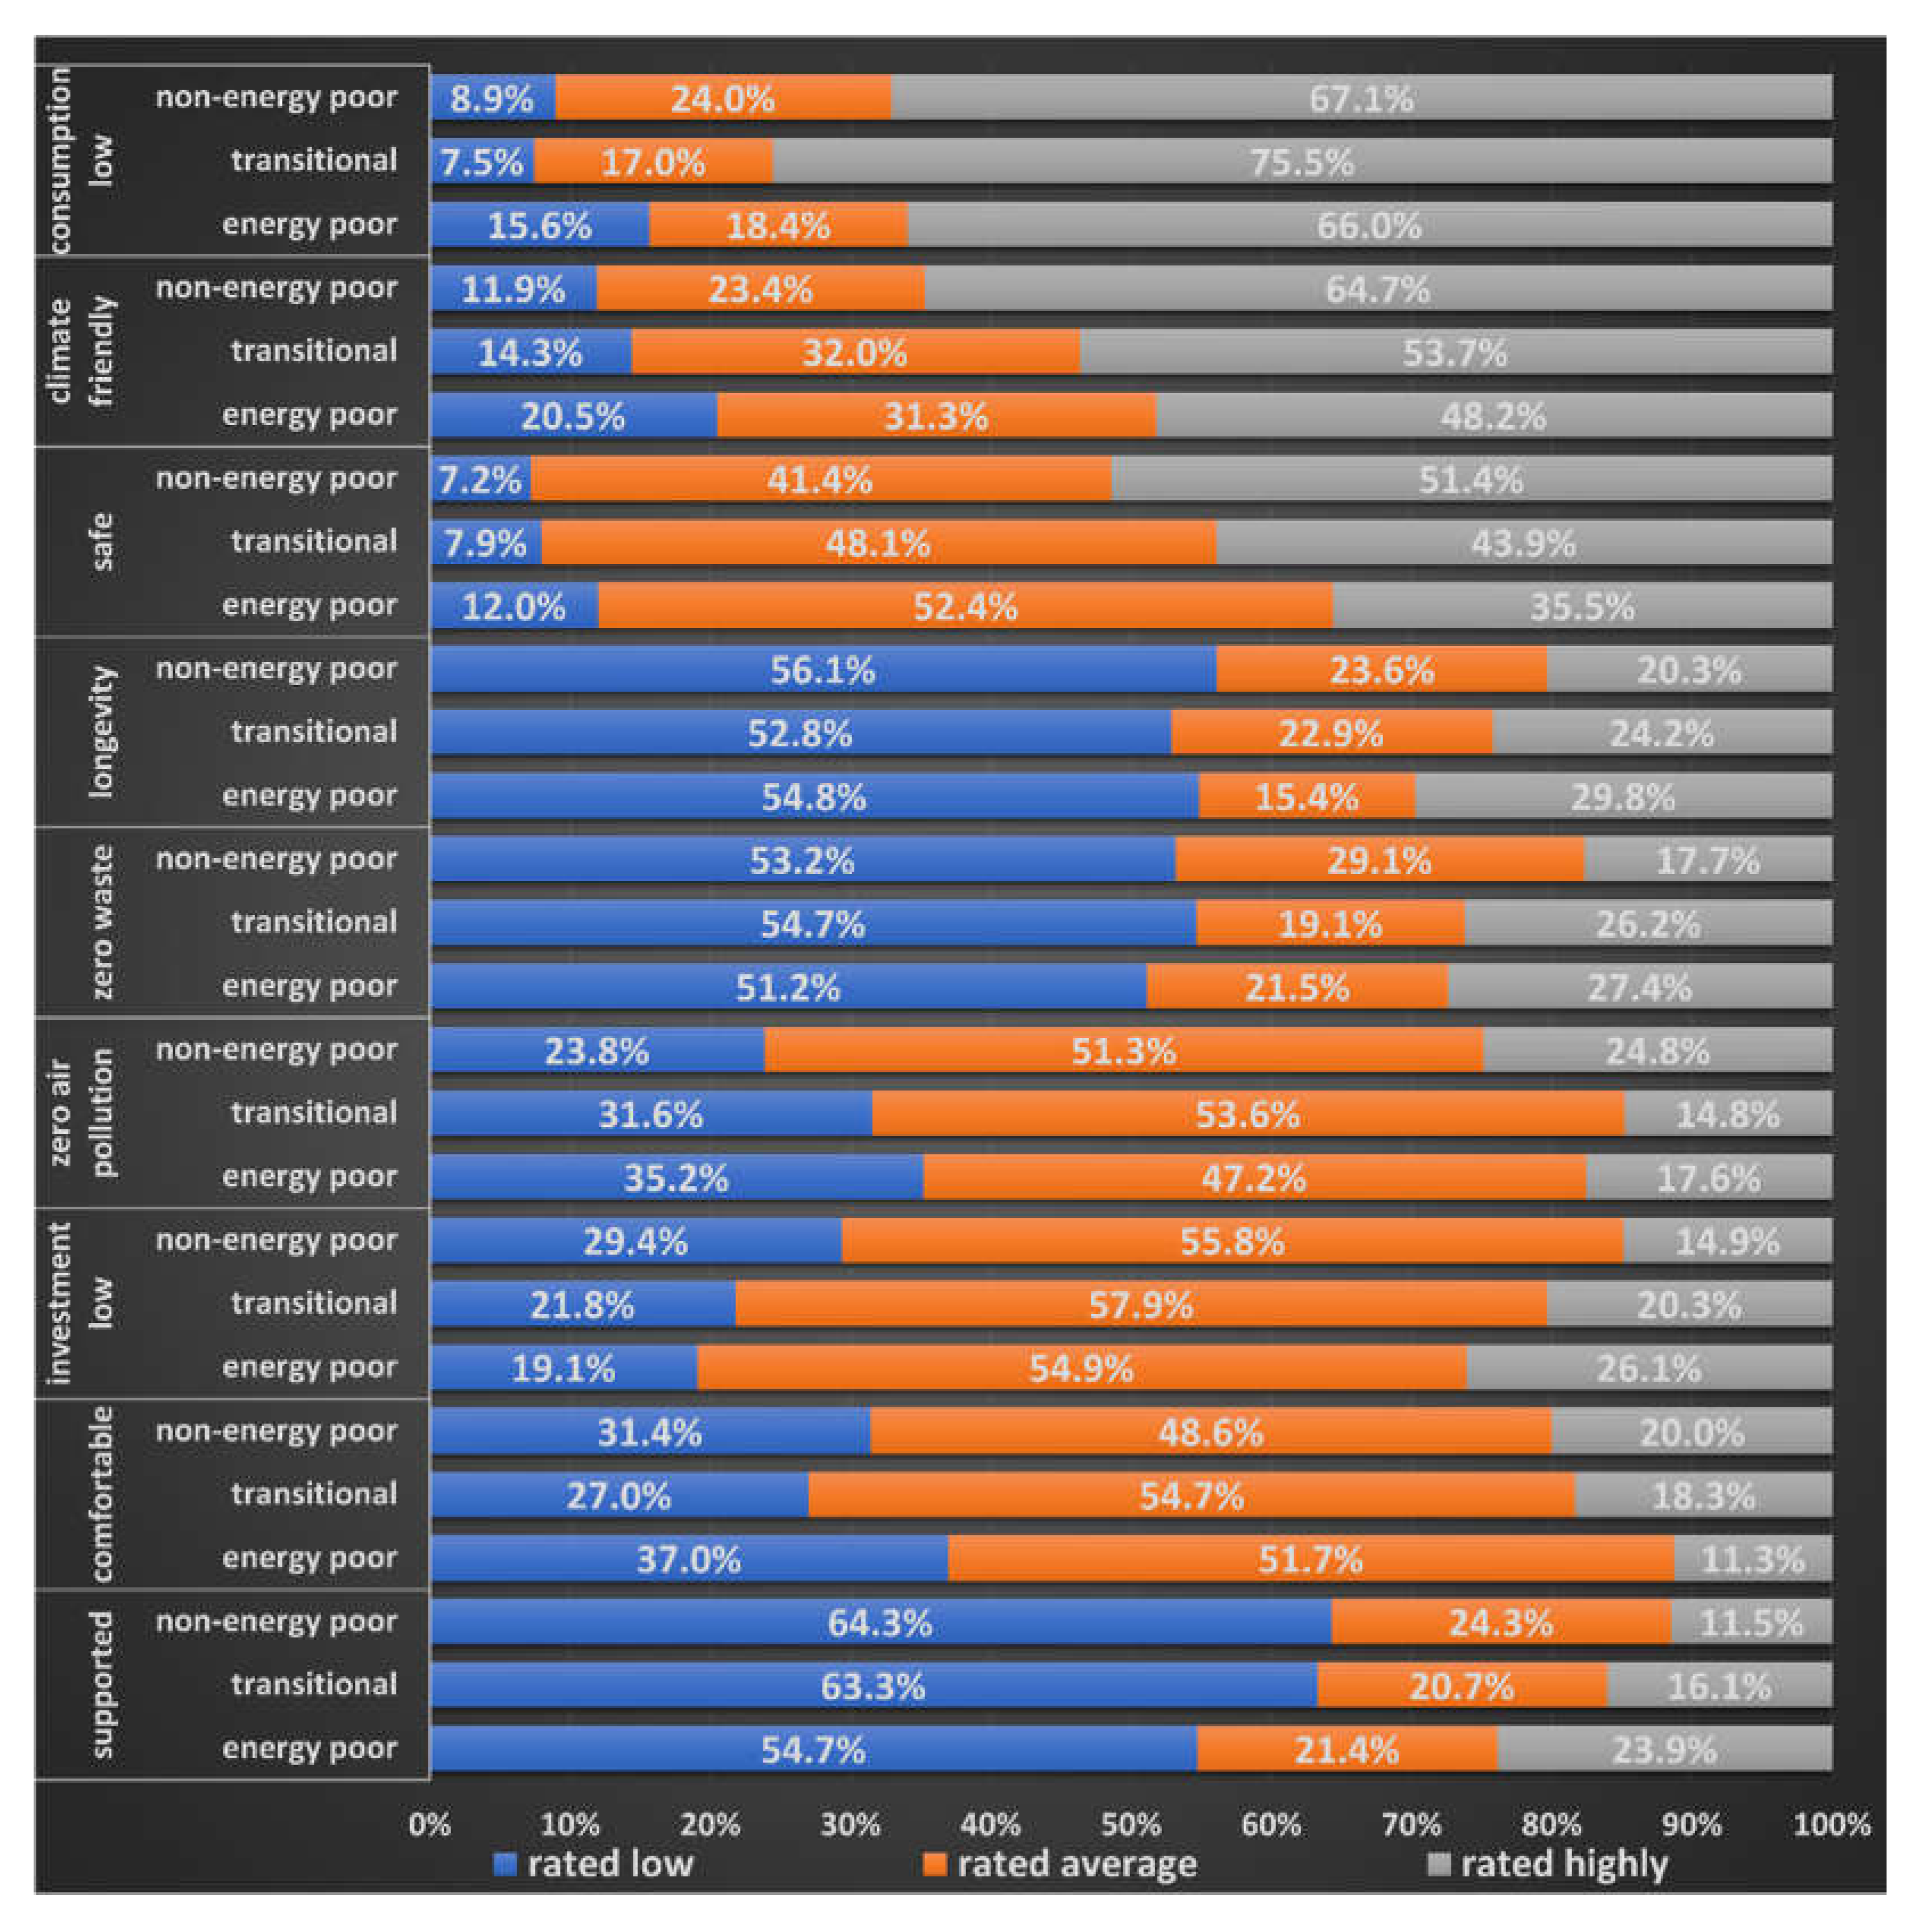
Respondents belonging to the energy poor, non energy poor and transitional group provided significantly different ratings in less than half of the nine items examined (Figure 5.) Concerning the other items, no significant differences were found between the three groups (Figure A2).
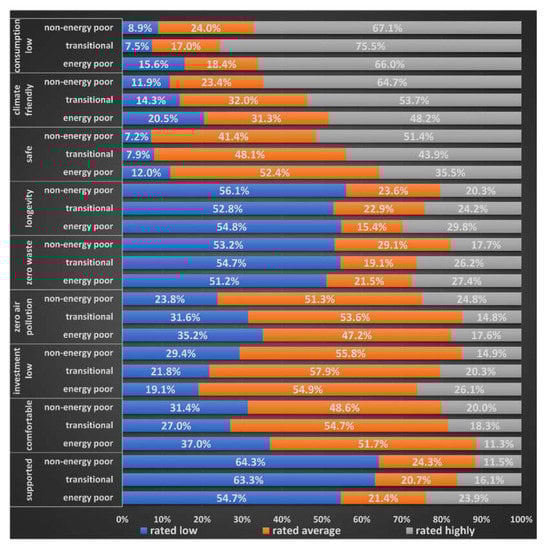
Figure 5.
Rating of aspects of heating energy generation by energy vulnerability groups (only significant differences). Compiled by the authors.
The importance of comfort was rated relatively low by respondents; however, respondents in energy poor households rated it significantly even lower. Other practical aspects, such as low investment costs, long life, and available subsidies for the specific energy carrier, were also rated low in the total population, while for respondents in energy poor households, they were of higher importance. Environmental aspects, such as heating energy generation modes’ contribution to climate change and lack of air pollution, seemed to be of medium, or high importance when the total population was considered; however, respondents in energy poor households evaluated this aspect as of much lower importance. Non energy poor households found heating energy generation mode’s security and (low) contribution to climate change significantly even more important than others. Comfortability and lack of air pollution, otherwise relatively lower-evaluated aspects in the total population, were also seen as more important in this group. Meanwhile, respondents in this group found low investment costs of lower importance than others. The ratings of households categorized as being in the transitional group were in between the other two groups in most factors showing significant differences between the two groups, with one spectacular difference: low consumption, which was considered very important for two thirds of the sample, proved to be especially crucial to this group. Members of this group demonstrated a mixture of environmentally conscious and economical behaviour, as low consumption, and zero waste were both among items evaluated higher than by other groups. (Figure 6).
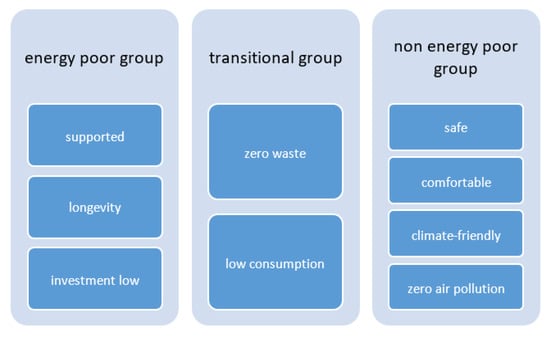
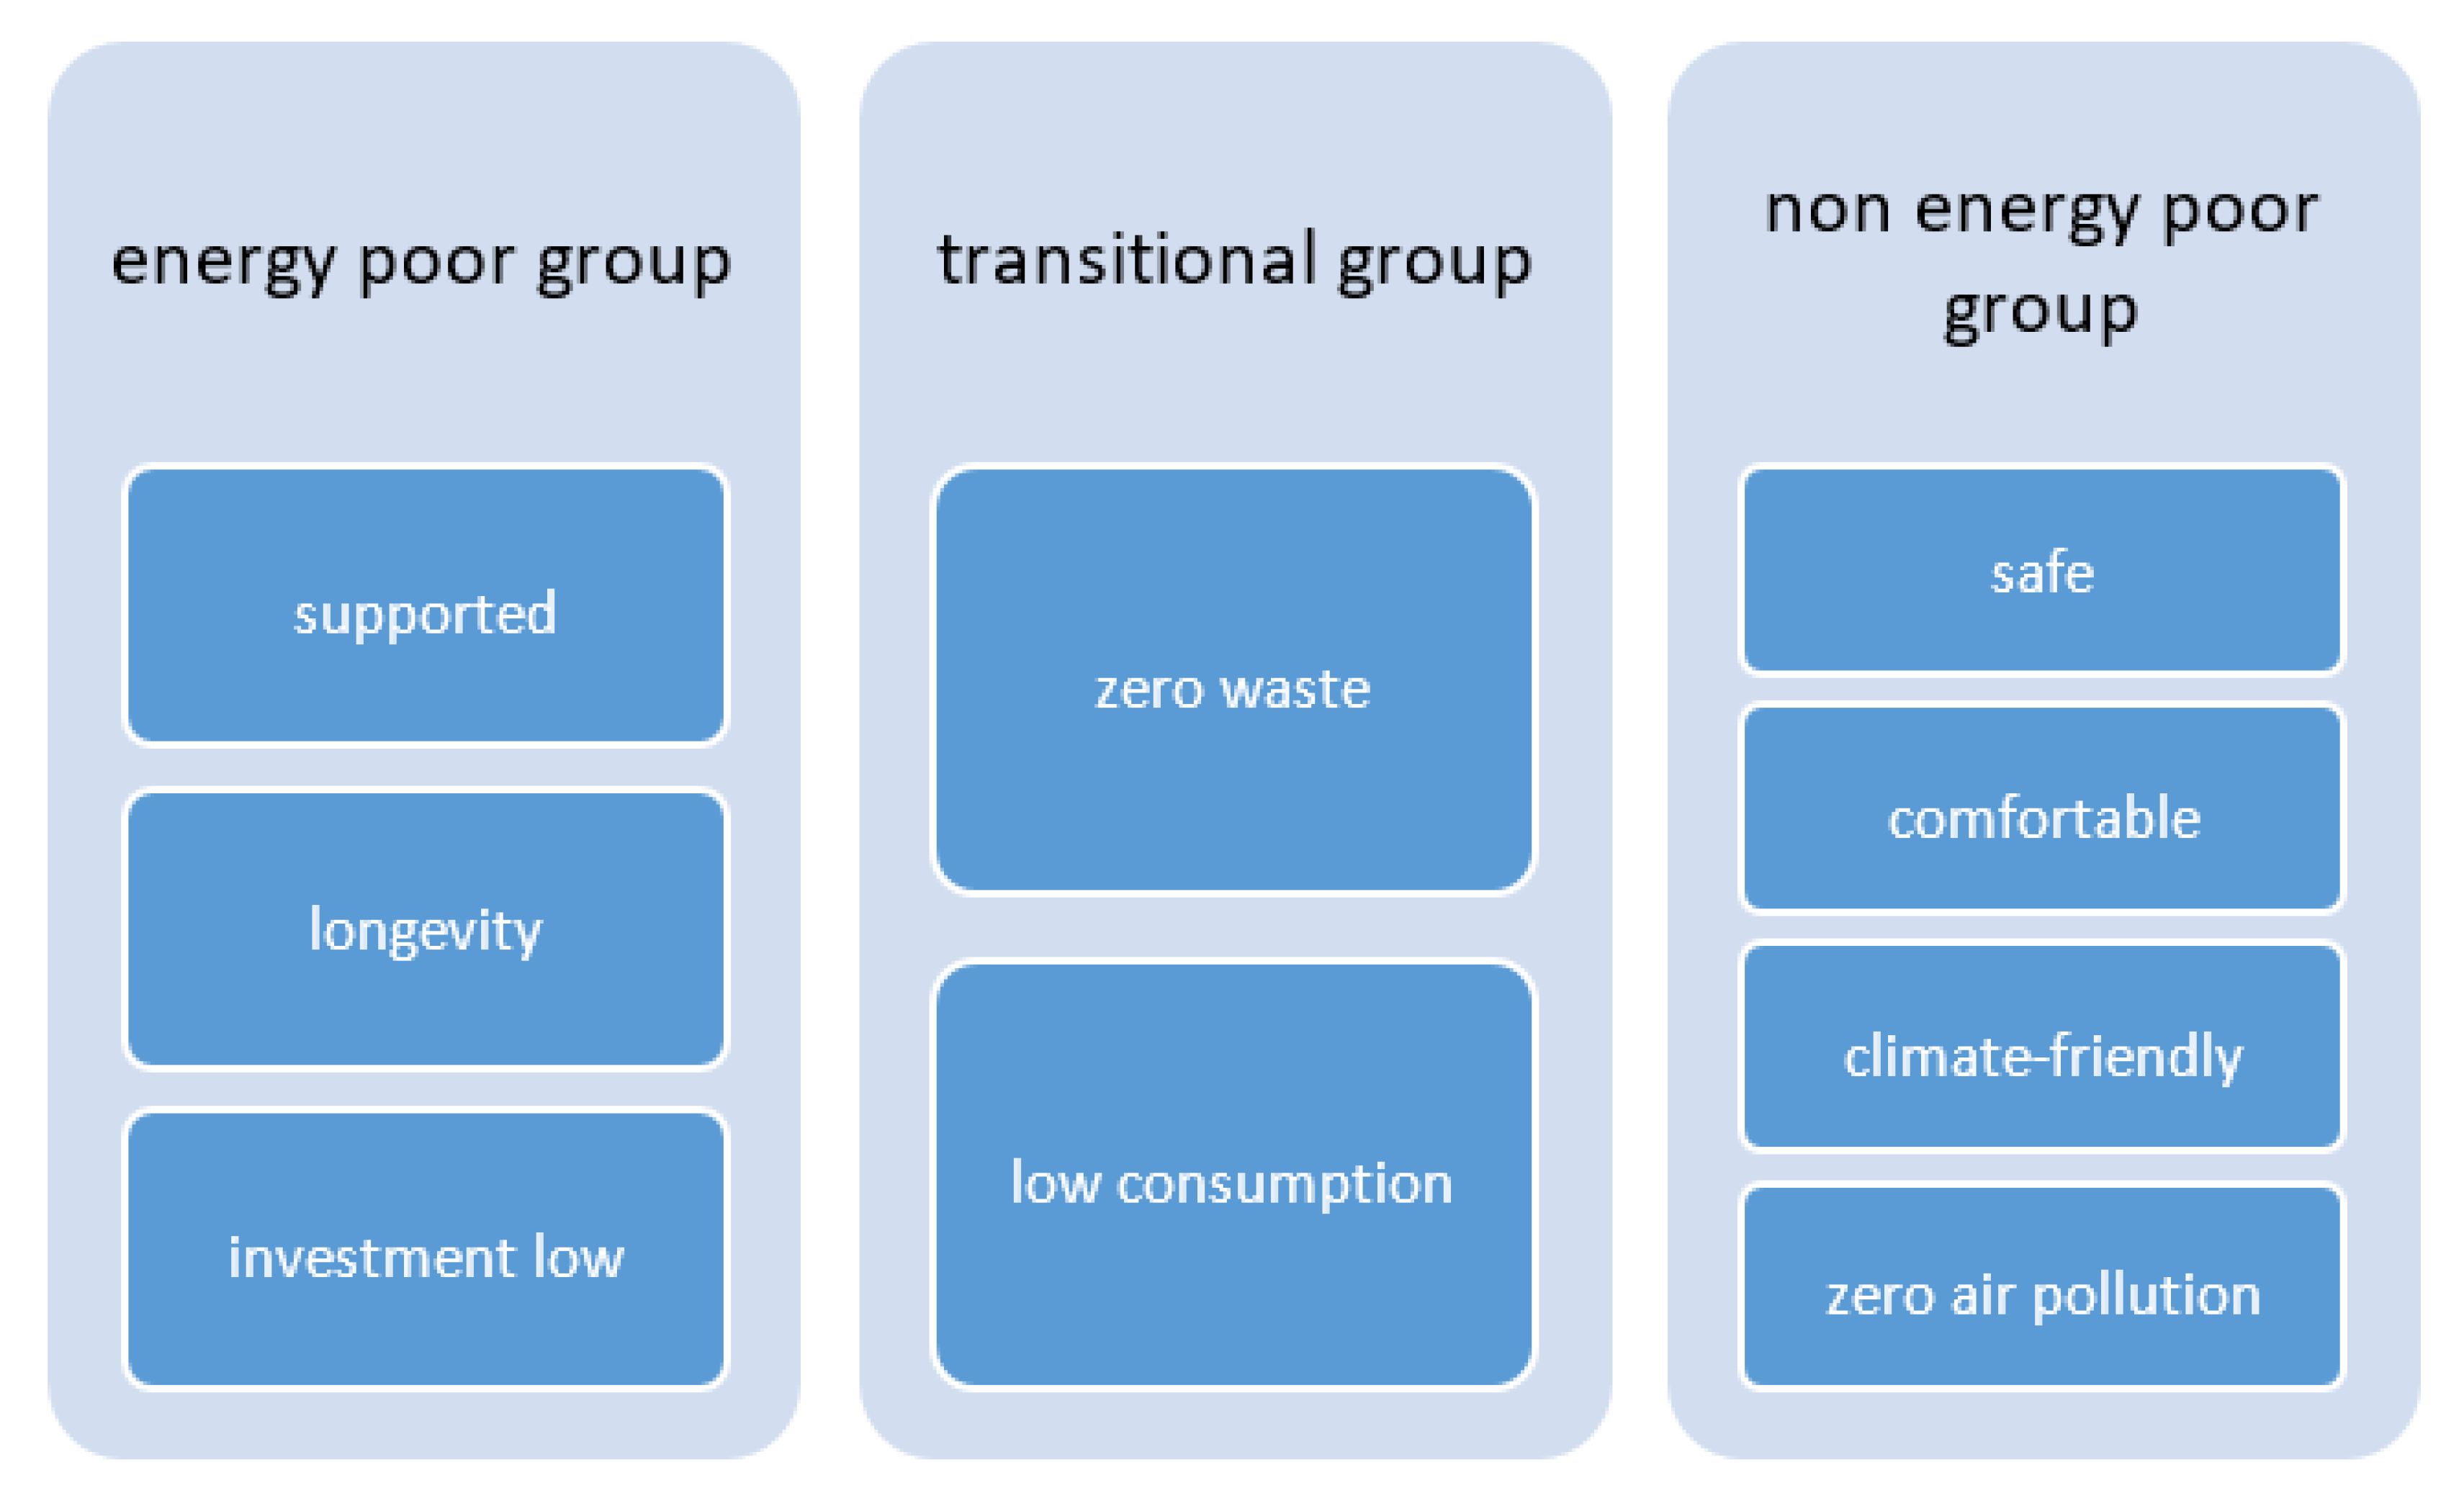
Figure 6.
Aspects of great importance in connection with heating methods, according to the groups. Compiled by the authors.
4. Conclusions
The classification we have used effectively distinguishes and describes three groups in Hungarian society based on energy vulnerability factors: energy poor, non energy poor households, and a ‘transitional’ group of households. The latter does not necessarily qualify as energy poor on the basis of expenditure-based indicators but is in an intermediate position between energy poor and non energy poor households, while it may be at risk of energy poverty. This supports the notion that it is important to move beyond the energy poor/non energy poor categorisation of households and seek a more detailed differentiation in terms of households’ energy vulnerability.
In addition to differences in their socio-economic characteristics, our analysis found significant differences between the three groups in terms of the perceived importance of some aspects of heating energy generation. Respondents in energy poor households rated micro-level economic aspects, such as low investment costs and the availability of subsidies, higher than others, while environmental aspects somewhat lower. On the contrary, respondents in non energy poor households put a higher emphasis on macrolevel environmental aspects, while they gave a lower rating to a microlevel financial aspect, low investment costs. Members of the transitional group evaluated both low pollution and low consumption higher than others, thereby showing a mixed mindset, with both macro- and microlevel, environmental and economic aspects rated higher than others. Notwithstanding the differences between the three groups and the presence of items related to environmental sustainability rated relatively high by many respondents, microlevel economic and technical aspects were generally highly regarded.
Such a more differentiated view on the categories of households regarding their energy vulnerability and analysis of psychological and sociopsychological factors may provide input for policies and measures tailored to different target groups’ problems and needs to tackle the environmental and social problems linked to domestic energy use, which is key to the achievement of climate and social goals set in EU and corresponding national strategic documents. In addition to energy poor households as a key target group of such policies and measures, the ‘transitional’ group of households—with their, albeit, limited, resources, relatively higher sensitivity to environmental and economic aspects, and the potential for significant GHG emission reduction in the energy efficiency renovations of their housing—is an important target group of policies and measures to move towards environmental and social sustainability.
This article aimed to contribute to methodological as well as conceptual debates concerning energy poverty. The methods and results offer a potential for further research, both qualitative and quantitative, to validate and develop our results.
Author Contributions
Conceptualization, A.C., Z.F., and L.K.; methodology, Z.F., L.K., and G.T.; software, G.T.; validation, G.T.; formal analysis, A.C., Z.F., L.K., and G.T.; writing—original draft preparation, A.C., Z.F., and G.T.; writing—review and editing, A.C., Z.F., and L.K.; visualization, Z.F., and G.T.; project administration, Z.F. All authors have read and agreed to the published version of the manuscript.
Funding
The research has been conducted in cooperation of the Centre for Energy Research with the Centre for Social Sciences Institute for Sociology, Hungarian Academy of Sciences Centre of Excellence. This project has received funding from the European Union’s Horizon 2020 research and innovation programme under the Marie Skłodowska-Curie grant agreement no. 956082, https://www.re-dwell.eu/ (accessed on 15 June 2021). The empirical work was supported by the European Structural and Investment Funds, jointly financed by the European Commission and the Hungarian Government under grant no. VEKOP-2.3.2-16-2016-00011.
Data Availability Statement
The survey data presented in this study are stored at the Digital Repository Centre of the Centre for Social Sciences (Hungarian Academy of Sciences Centre of Excellence, Eötvös Loránd Research Network), which archives the data of research projects conducted at the Centre (http://openarchive.tk.mta.hu/389/ (accessed on 15 June 2021)).
Acknowledgments
We are grateful to the two anonymous reviewers for their constructive comments and suggestions, which helped to shape the paper.
Conflicts of Interest
The authors declare no conflict of interest.
Appendix A
Definition A1.
European Domestic Energy Poverty Index (EDEPI)—the EDEPI score is computed as a geometric mean of the metrics assessing causes and symptoms of domestic energy poverty, including the share of energy expenditures out of total expenditures, the share of the population unable to keep their homes warm in winter and/or cool in summer, as well as the share of the population living in dwellings with leaking roofs, damp walls, and rot in window frames [25].
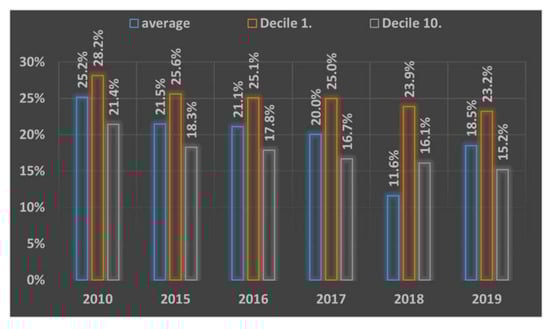
Figure A1.
Share of annual household maintenance and household energy expenditure per capita in lower- and upper-income deciles in 2010 and 2015–2019 (%) Source: Compiled by authors based on CSO data [36].
Figure A1.
Share of annual household maintenance and household energy expenditure per capita in lower- and upper-income deciles in 2010 and 2015–2019 (%) Source: Compiled by authors based on CSO data [36].
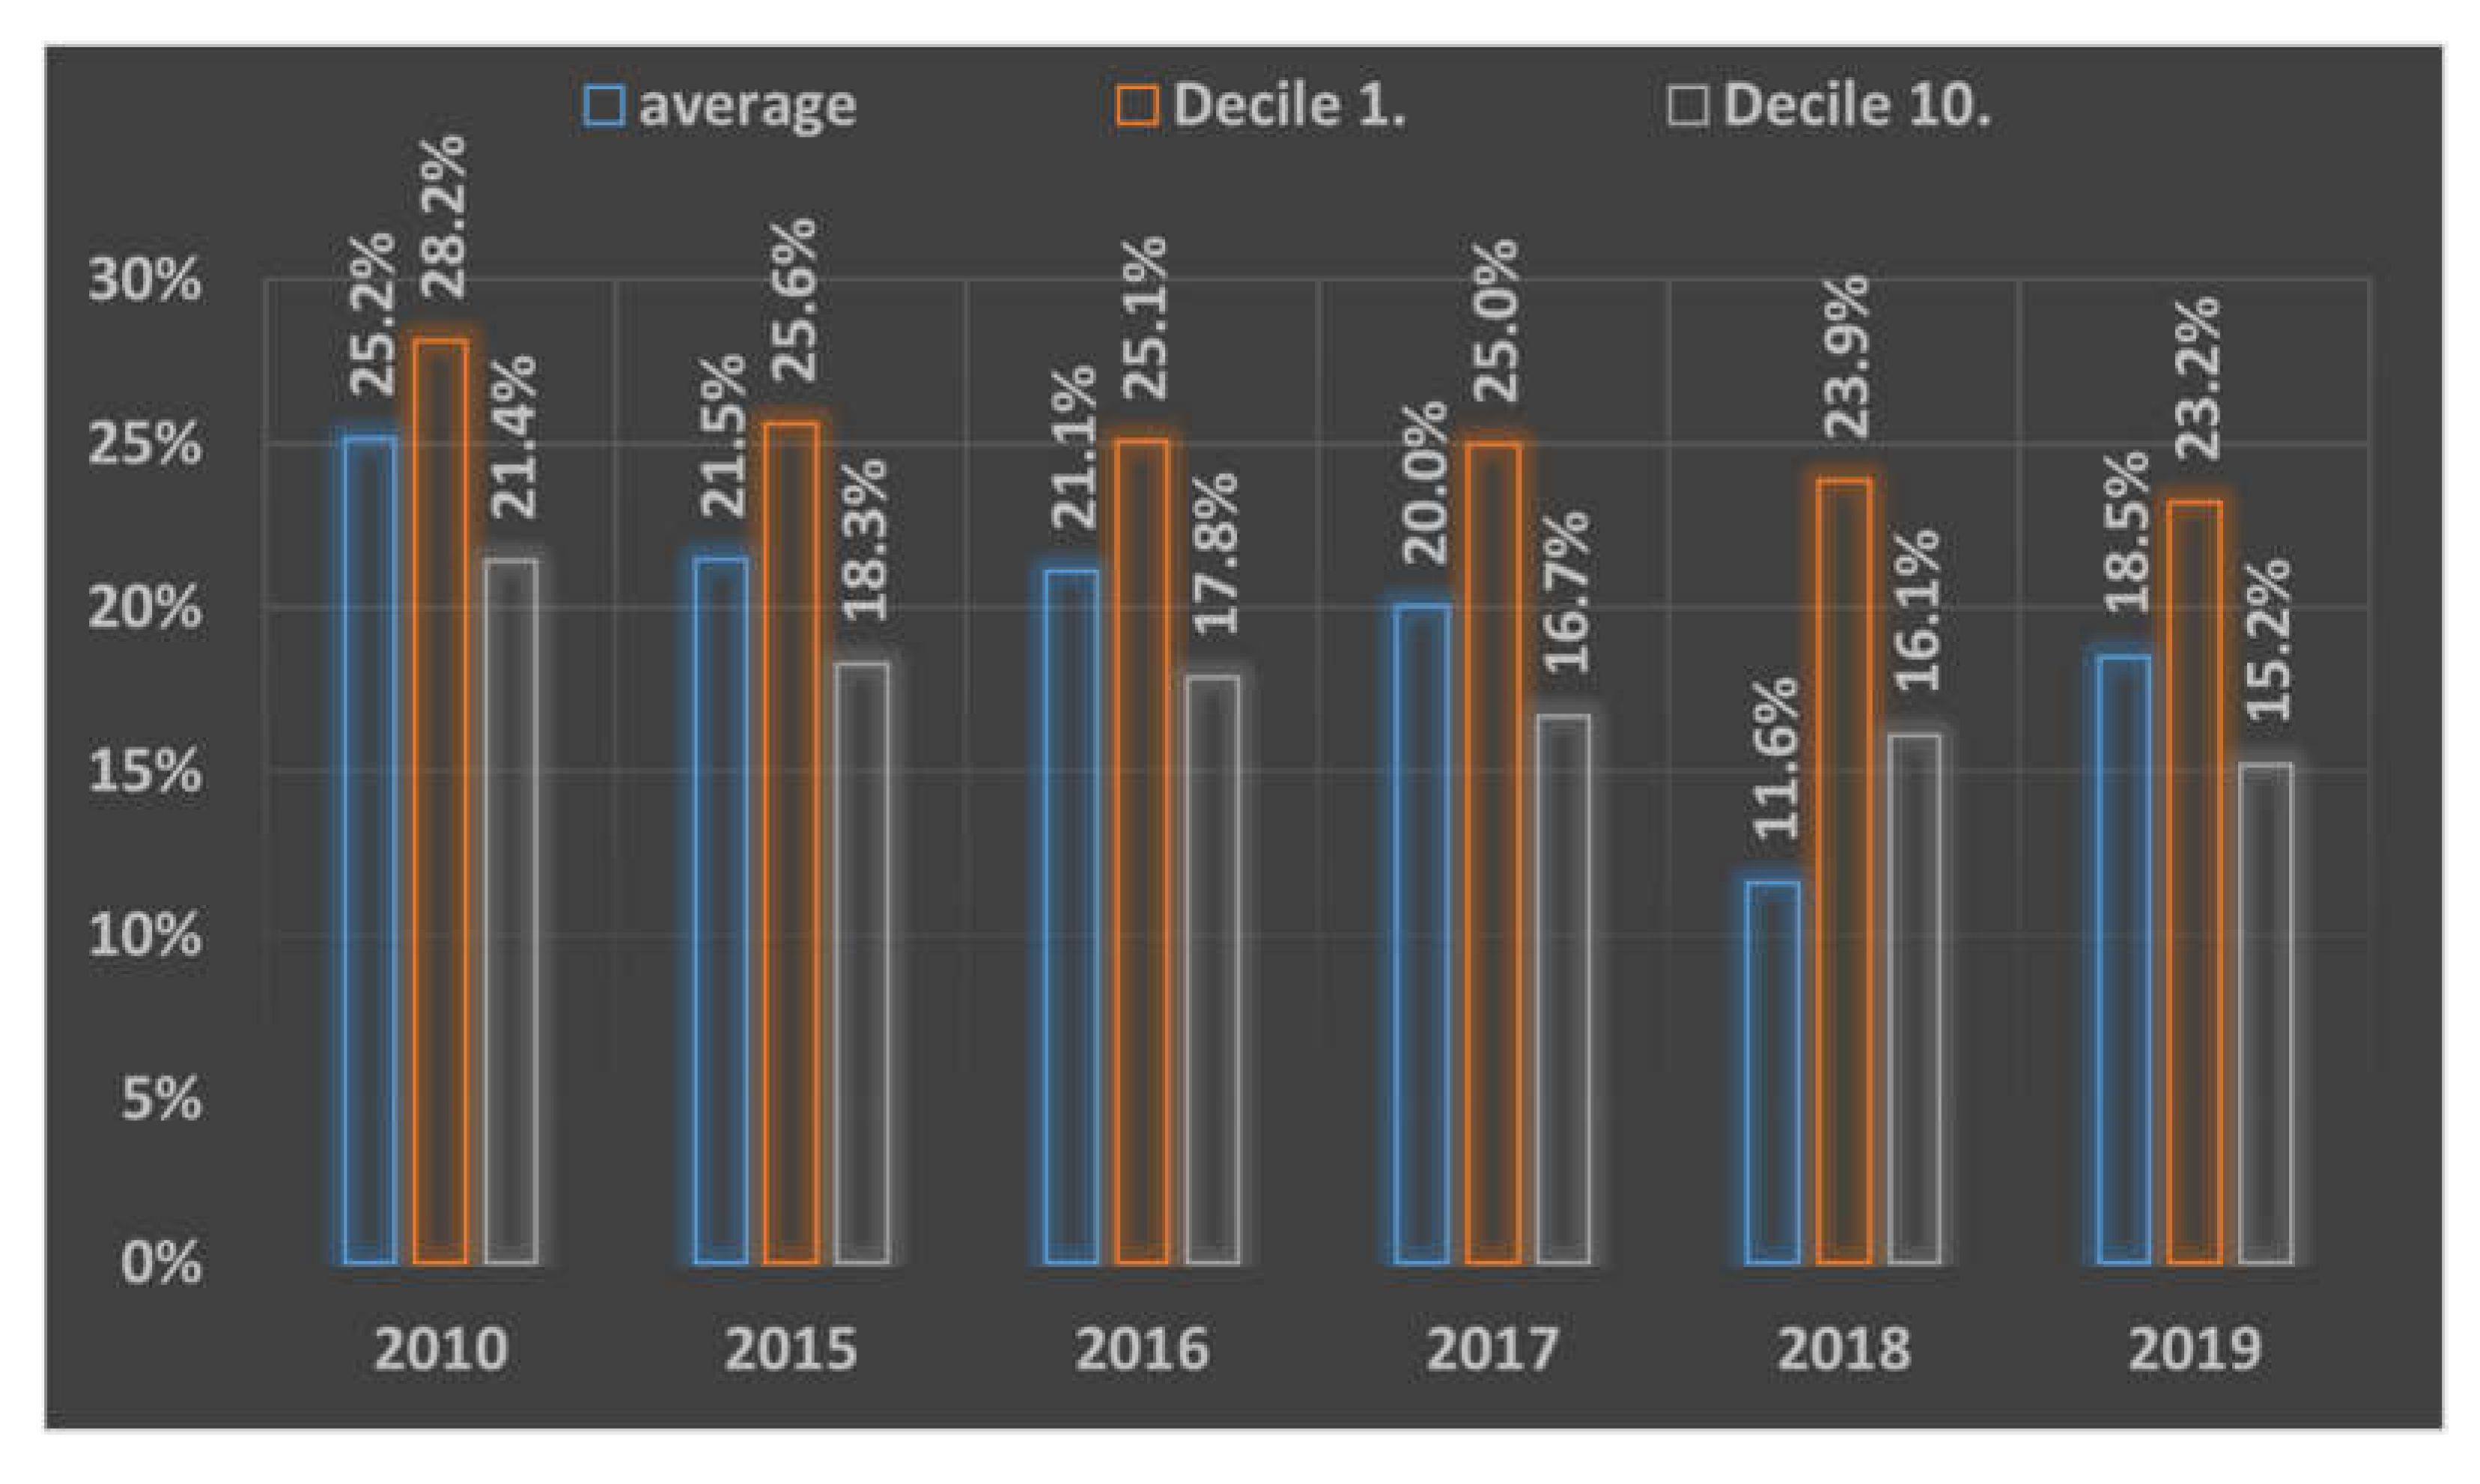
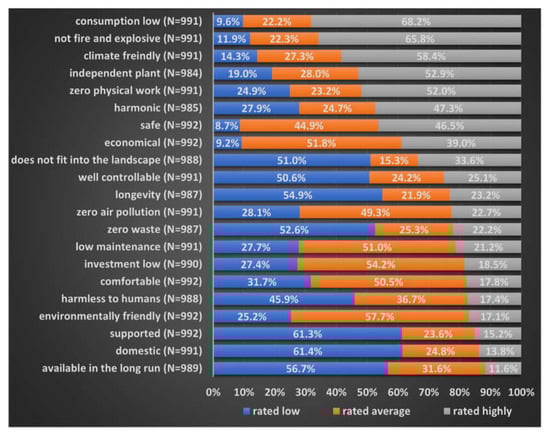
Figure A2.
Rating of aspects concerning heating energy generation. Compiled by the energy generation. Compiled by the authors.
Figure A2.
Rating of aspects concerning heating energy generation. Compiled by the energy generation. Compiled by the authors.


Figure A3.
Aspects of the use of different heating methods by clusters. Not significant aspects. Compiled by the authors.
Figure A3.
Aspects of the use of different heating methods by clusters. Not significant aspects. Compiled by the authors.
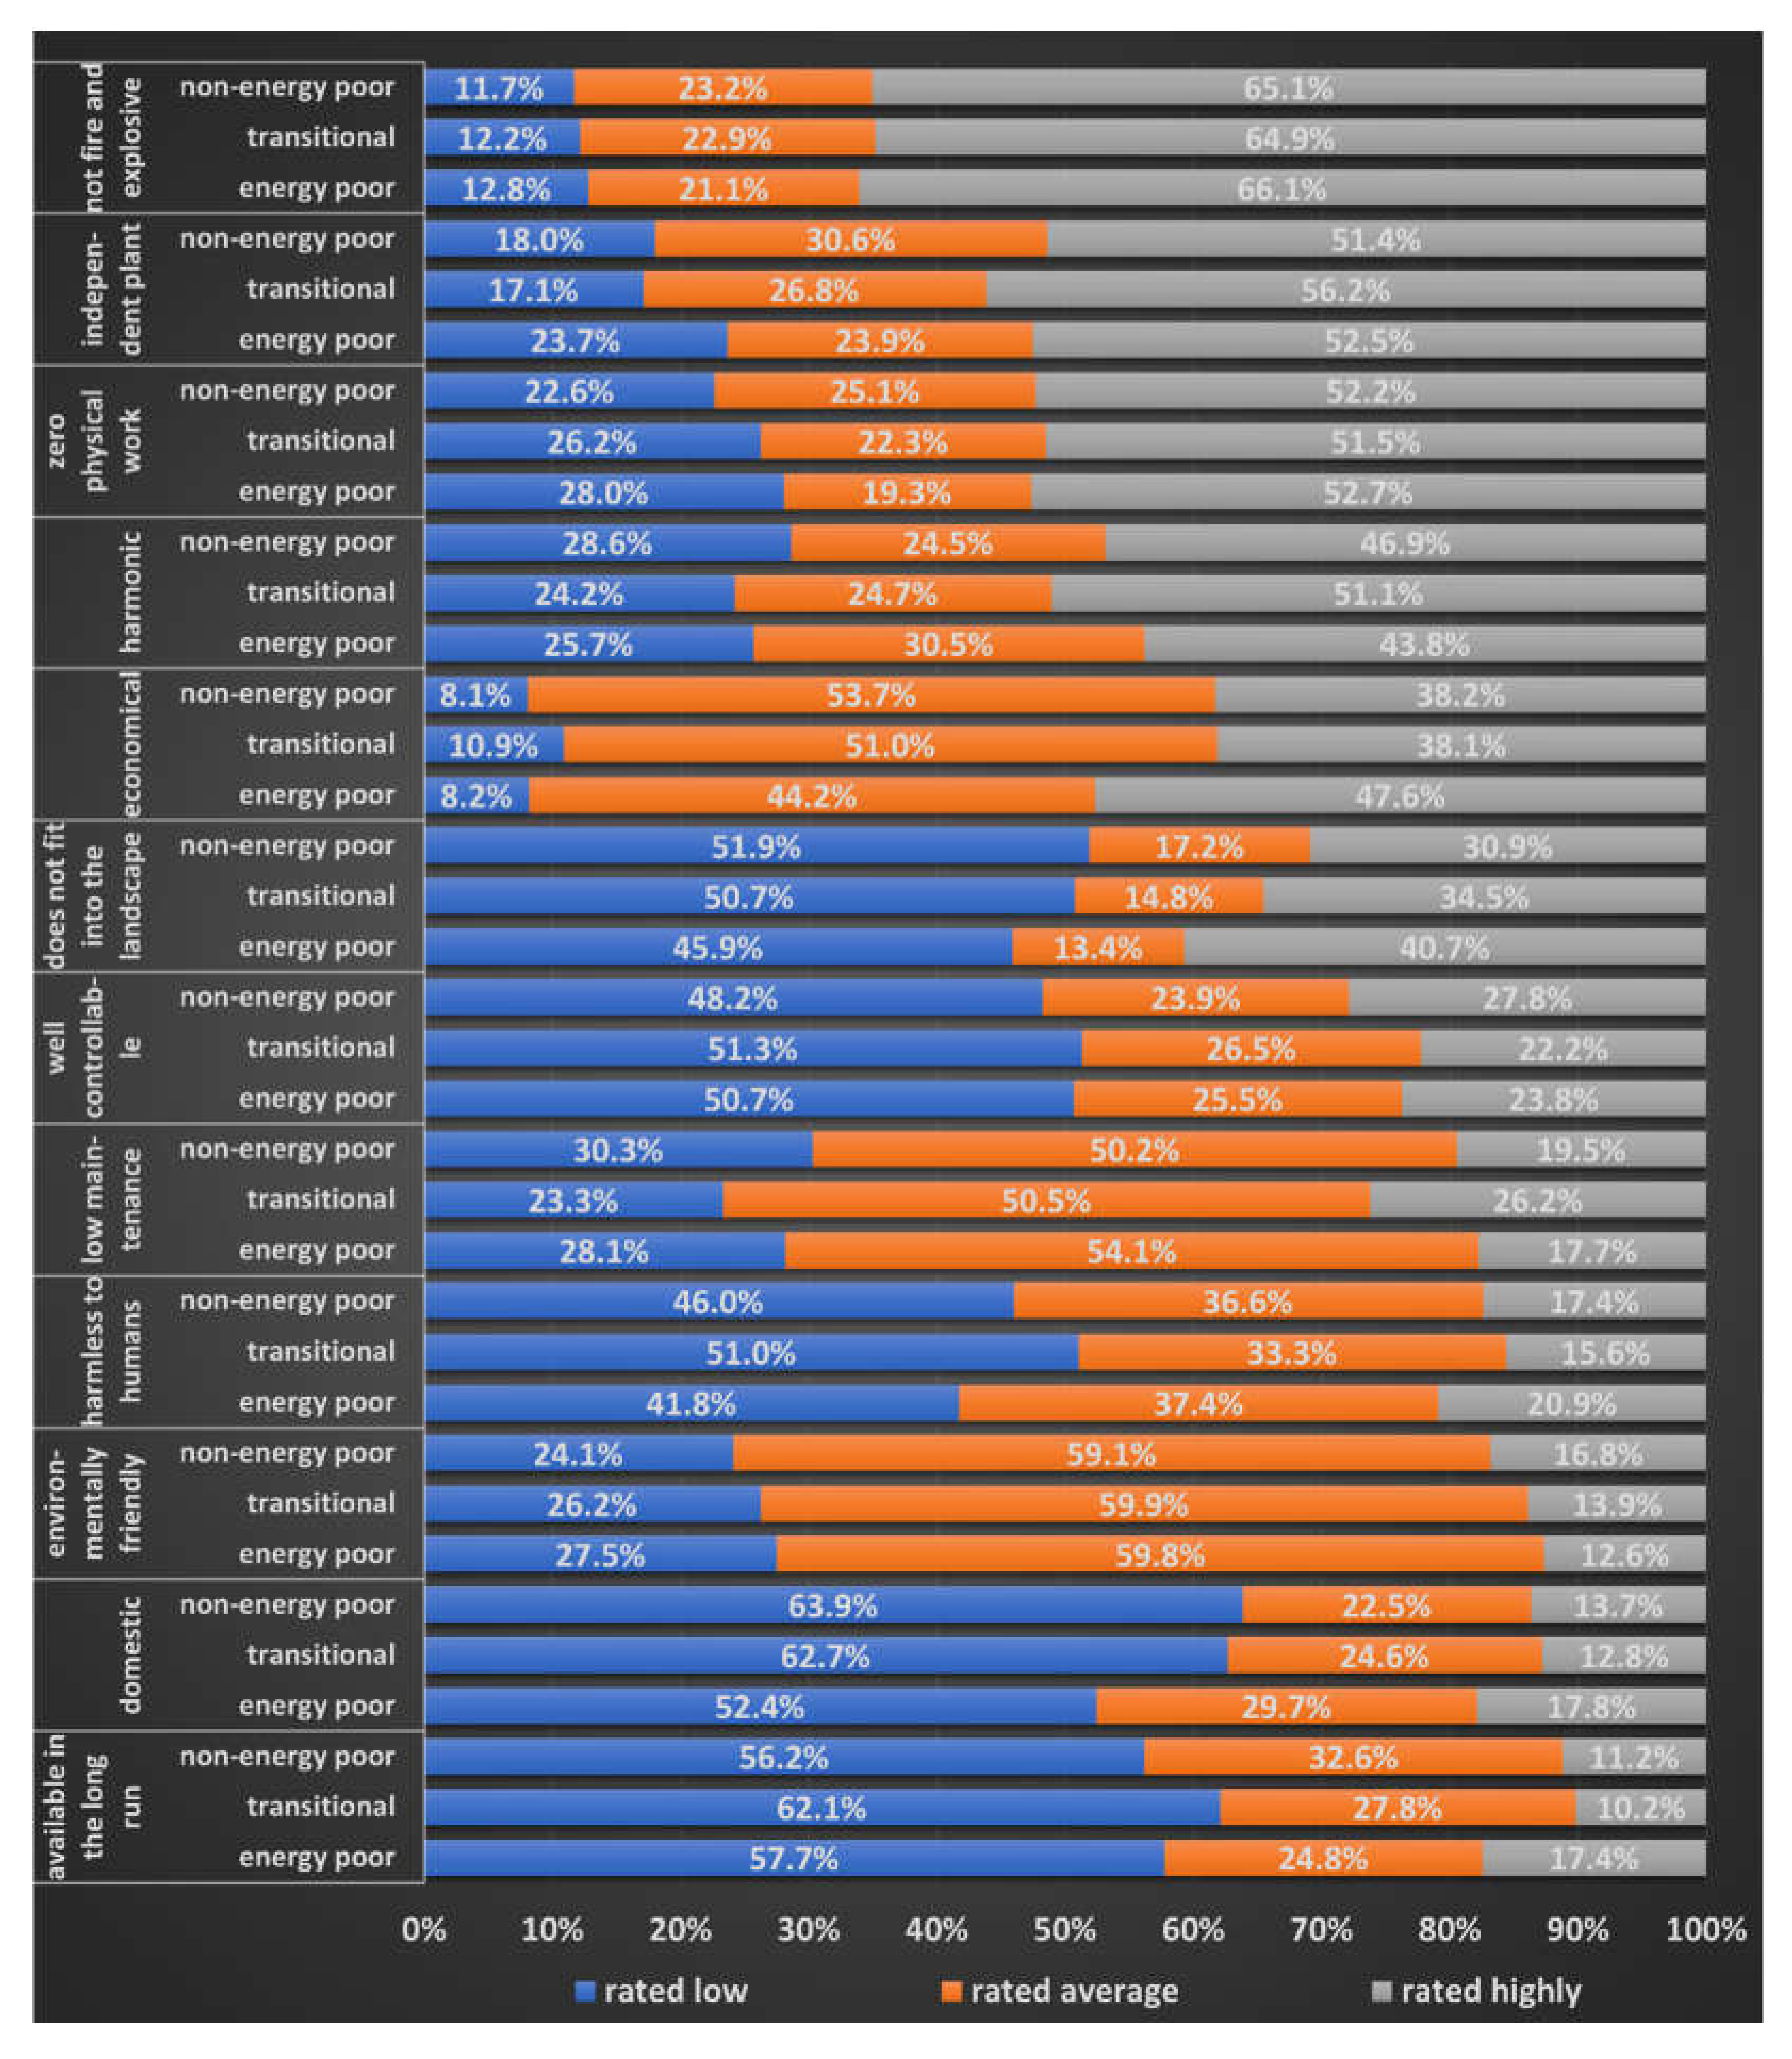
Table A1.
Chi-squares test statistics for the aspects of the use of different heating methods by energy vulnerability groups. Compiled by the authors.
Table A1.
Chi-squares test statistics for the aspects of the use of different heating methods by energy vulnerability groups. Compiled by the authors.
| Attribute | N | Person Chi-Squre Value | Asymptotic Significance (2-Sided) |
|---|---|---|---|
| Available in the Long Run | 907 | 9438 | 0.051 |
| Climate Friendly | 907 | 19,766 | 0.001 |
| Comfortable | 909 | 10,319 | 0.035 |
| Consumption Low | 907 | 15,494 | 0.004 |
| Does not Fit into the Landscape | 905 | 5837 | 0.212 |
| Domestic | 908 | 7859 | 0.097 |
| Economical | 908 | 7091 | 0.131 |
| Environmentally Friendly | 907 | 2715 | 0.607 |
| Harmless to Humans | 907 | 4499 | 0.343 |
| Harmonic | 902 | 463 | 0.327 |
| Independent Plant | 901 | 5611 | 0.230 |
| Investment Low | 907 | 16,339 | 0.003 |
| Longevity | 905 | 9876 | 0.043 |
| Low Maintenance | 908 | 8474 | 0.076 |
| Not Fire and Explosive | 908 | 0.47 | 0.976 |
| Safe | 907 | 14,827 | 0.005 |
| Supported | 907 | 15,953 | 0.003 |
| Well Controllable | 908 | 3203 | 0.524 |
| Zero Air Pollution | 908 | 17,019 | 0.002 |
| Zero Physical Work | 909 | 3792 | 0.435 |
| Zero Waste | 904 | 16,416 | 0.003 |
Table A2.
Aspects of the use by clusters. Compiled by the authors.
Table A2.
Aspects of the use by clusters. Compiled by the authors.
| Energy Poor | Transitional | Non Energy poor | Total | |
|---|---|---|---|---|
| Did not Heat Apartment as Warm as they Wanted, during Daytime | 46.8% | 32.6% | 10.0% | 24.9% |
| Did not Heat Apartment as Warm as they Wanted, at Night | 43.6% | 23.2% | 7.0% | 19.8% |
| Turned Down Heating when Nobody was at Home | 51.6% | 68.1% | 46.2% | 54.4% |
| Did not Heat in All Rooms Fitted with Heating Equipment | 36.7% | 22.6% | 10.7% | 19.9% |
| Used Less Lighting or Limited the Use of Other Electric Equipment | 20.2% | 12.8% | 5.6% | 10.9% |
| Used Less Warm Water | 11.2% | 7.0% | 0.9% | 5.0% |
| Cooked Less | 2.1% | 2.3% | 0.2% | 1.3% |
| Used Collected Wood, Waste Material for Energy Generation | 21.3% | 6.7% | 2.1% | 7.5% |
References
- Day, R.; Walker, G.; Simcock, N. Conceptualising Energy Use and Energy Poverty Using a Capabilities Framework. Energy Policy 2016, 93, 255–264. [Google Scholar] [CrossRef]
- Cabeza, L.F.; Urge-Vorsatz, D.; McNeil, M.A.; Barreneche, C.; Serrano, S. Investigating Greenhouse Challenge from Growing Trends of Electricity Consumption through Home Appliances in Buildings. Renew. Sustain. Energy Rev. 2014, 36, 188–193. [Google Scholar] [CrossRef]
- Pye, S.; Dobbins, A. Energy Poverty and Vulnerable Consumers in the Energy Sector across the EU: Analysis of Policies and Measures; INSIGHT_E: Ipswich, UK, 2015; p. 91. [Google Scholar]
- Feldmár, N. Energiaszegénység Energy Poverty; Éves Jelentés a Lakhatási Szegénységről Annual Report on Housing Poverty; Habitat for Humanity Hungary: Budapest, Hungary, 2020. [Google Scholar]
- Bouzarovski, S.; Petrova, S. A Global Perspective on Domestic Energy Deprivation: Overcoming the Energy Poverty—Fuel Poverty Binary. Energy Res. Soc. Sci. 2015, 10, 31–40. [Google Scholar] [CrossRef]
- Yao, X.; Yasmeen, R.; Padda, I.U.H.; Shah, W.U.H.; Kamal, M.A. Inequalities by Energy Sources: An Assessment of Environmental Quality. PLoS ONE 2020, 15, e0230503. [Google Scholar] [CrossRef] [PubMed] [Green Version]
- Powers, M. An Inclusive Energy Transition: Expanding Low-Income Access to Clean Energy Programs. North. Carol. J. Law Technol. 2017, 18, 540–564. [Google Scholar]
- Frederiks, E.; Stenner, K.; Hobman, E. The Socio-Demographic and Psychological Predictors of Residential Energy Consumption: A Comprehensive Review. Energies 2015, 8, 573–609. [Google Scholar] [CrossRef] [Green Version]
- Sumiya, B. Energy Poverty in Context of Climate Change: What Are the Possible Impacts of Improved Modern Energy Access on Adaptation Capacity of Communities? IJESD 2016, 7, 73–79. [Google Scholar] [CrossRef] [Green Version]
- Kolokotsa, D.; Santamouris, M. Review of the Indoor Environmental Quality and Energy Consumption Studies for Low Income Households in Europe. Sci. Total Environ. 2015, 536, 316–330. [Google Scholar] [CrossRef]
- IEA. Energy and Air Pollution; World Energy Outlook Special Report; OECD/IEA: Paris, France, 2016; Available online: https://iea.blob.core.windows.net/assets/6b75c4ae-e633-4fa0-9569-b28e226e6103/WorldEnergyOutlookSpecialReport2016EnergyandAirPollution.pdf (accessed on 3 June 2021).
- Neumayer, E. Pollution Havens: An Analysis of Policy Options for Dealing with an Elusive Phenomenon. J. Environ. Dev. 2001, 10, 147–177. [Google Scholar] [CrossRef]
- Taylor Buck, N.; While, A. Competitive Urbanism and the Limits to Smart City Innovation: The UK Future Cities Initiative. Urban. Stud. 2017, 54, 501–519. [Google Scholar] [CrossRef] [Green Version]
- Viitanen, J.; Kingston, R. Smart Cities and Green Growth: Outsourcing Democratic and Environmental Resilience to the Global Technology Sector. Environ. Plan. A 2014, 46, 803–819. [Google Scholar] [CrossRef] [Green Version]
- Galperin, H.; Fernanda Viecens, M. Connected for Development? Theory and Evidence about the Impact of Internet Technologies on Poverty Alleviation. Dev. Policy Rev. 2017, 35, 315–336. [Google Scholar] [CrossRef]
- Bouzarovski, S.; Herrero, S.T. Energy poverty in Central and Eastern Europe: Understanding the European Union’s core-periphery divide. In Post-Socialist Urban Infrastructures; Routledge: London, UK, 2019; ISBN 978-1-351-19035-0. [Google Scholar]
- Bouzarovski, S.; Petrova, S.; Sarlamanov, R. Energy Poverty Policies in the EU: A Critical Perspective. Energy Policy 2012, 49, 76–82. [Google Scholar] [CrossRef]
- Boardman, B. Fixing Fuel Poverty: Challenges and Solutions; Earthscan: London, UK, 2010; ISBN 978-1-84407-743-4. [Google Scholar]
- Bouzarovski, S.; Tirado Herrero, S. The Energy Divide: Integrating Energy Transitions, Regional Inequalities and Poverty Trends in the European Union. Eur. Urban. Reg. Stud. 2017, 24, 69–86. [Google Scholar] [CrossRef] [PubMed] [Green Version]
- National Energy Action (NEA). Developing a Social Energy Target in Europe Proposals for Bridging the “Energy Divide” and Putting Low-Income Households at the Heart of Europe’s Energy Future; National Energy Action, Newcastle upon Tyne: London, UK, 2014; Available online: https://www.energypoverty.eu/publication/developing-social-energy-target-europe-proposals-bridging-energy-divide-and-putting-low (accessed on 2 March 2021).
- Turai, E.; Schmatzberger, S.; Broer, R. Overview Report on the Energy Poverty Concept. Energy Poverty in the Privately-Owned, Multi-Family Environment; Metropolitan Research Institute: Budapest, Hungary, 2021; Available online: https://www.oneplanetnetwork.org/sites/default/files/comact_d1.1_overview_report_on_the_energy_poverty_concept_final_version_updated.pdf (accessed on 12 March 2021).
- European Energy Poverty Index (EEPI). 2019. Available online: https://www.openexp.eu/sites/default/files/publication/files/european_energy_poverty_index-eepi_en.pdf (accessed on 13 March 2021).
- Thomson, H.; Bouzarovski, S.; Snell, C. Rethinking the Measurement of Energy Poverty in Europe: A Critical Analysis of Indicators and Data. Indoor Built Environ. 2017, 26, 879–901. [Google Scholar] [CrossRef]
- Herrero, S.T. Energy Poverty Indicators: A Critical Review of Methods. Indoor Built Environ. 2017, 26, 1018–1031. [Google Scholar] [CrossRef]
- Endrődi-Kovács, V.; Hegedüs, K. Energy Poverty in Hungary. RETP 2019, 14, 190–201. [Google Scholar] [CrossRef]
- Kőszeghy, L.; Feldmár, N. Energiaszegénység Magyarországi Kontextusban Energy Poverty in Hungarian Context. 2019. Available online: https://www.elosztoprojekt.hu/wp-content/uploads/2019/12/LeaN%C3%B3ra.pdf (accessed on 8 April 2021).
- Bajomi, Z.; Feldmár, N.; Kőszeghy, L. Trapped in politics. Energy poverty in Hungary. In Perspectives on Energy Poverty in Post-Communist Europe; Routledge: London, UK, 2020; ISBN 978-0-367-43052-8. [Google Scholar]
- Total Population Living in a Dwelling with a Leaking Roof, Damp Walls, Floors or Foundation, or Rot in Window Frames or Floor—EU-SILC Survey. 2020. Available online: https://appsso.eurostat.ec.europa.eu/nui/show.do?dataset=ilc_mdho01&lang=en (accessed on 18 April 2021).
- Arrears on Utility Bills—EU-SILC Survey. 2020. Available online: https://appsso.eurostat.ec.europa.eu/nui/show.do?dataset=ilc_mdes07&lang=en (accessed on 18 April 2021).
- Inability to Keep Home Adequately Warm—EU-SILC Survey. 2020. Available online: https://appsso.eurostat.ec.europa.eu/nui/submitViewTableAction.do (accessed on 18 April 2021).
- Annual Per Capita Expenditure According to COICOP Main Groups and Income Deciles (HUF). Available online: http://www.ksh.hu/thm/2/indi2_6_2.html?lang=hu (accessed on 18 April 2021).
- Bajomi, Z.; Feldmár, N. Lakásminőség És Energiaszegénység Housing Quality and Energy Poverty; Jelentés a Lakhatási Szegénységről 2018—Report on Housing Poverty 2018; Habitat for Humanity Hungary: Budapest, Hungary, 2018. [Google Scholar]
- CSO Household Budget and Living Conditions Data Collection (HKÉF). Available online: http://www.ksh.hu/stadat_eves_2_2 (accessed on 24 June 2021).
- Börcsök, E.; Ferencz, Z.; Groma, V.; Gerse, Á.; Fülöp, J.; Bozóki, S.; Osán, J.; Török, S.; Horváth, Á. Energy Supply Preferences as Multicriteria Decision Problems: Developing a System of Criteria from Survey Data. Energies 2020, 13, 3767. [Google Scholar] [CrossRef]
- Bacher, J.; Wenzig, K.; Vogler, M. SPSS TwoStep Cluster—A First Evaluation. 2004. Available online: https://www.ssoar.info/ssoar/handle/document/32715 (accessed on 2 March 2021).
- Benassi, M.; Garofalo, S.; Ambrosini, F.; Sant’Angelo, R.P.; Raggini, R.; De Paoli, G.; Ravani, C.; Giovagnoli, S.; Orsoni, M.; Piraccini, G. Using Two-Step Cluster Analysis and Latent Class Cluster Analysis to Classify the Cognitive Heterogeneity of Cross-Diagnostic Psychiatric Inpatients. Front. Psychol. 2020, 11, 1085. [Google Scholar] [CrossRef]
- Linzer, D.A.; Lewis, J.B. PoLCA: An R Package for Polytomous Variable Latent Class Analysis. J. Stat. Soft. 2011, 42, 1–29. [Google Scholar] [CrossRef] [Green Version]
- Balku, E.; Tóth, G.; Nárai, E.; Zsiros, E.; Varsányi, P.; Vitrai, J. Methodology for Identification of Healthstyles for Developing Effective Behavior Change Interventions. J. Public Health 2017, 25, 387–400. [Google Scholar] [CrossRef]
- Elo, A.E. The Rating of Chessplayers: Past and Present; Ishi Press International: Bronx, NY, USA, 2008; ISBN 978-0-923891-27-5. [Google Scholar]
- Clark, A.P.; Howard, K.L.; Woods, A.T.; Penton-Voak, I.S.; Neumann, C. Why Rate When You Could Compare? Using the “EloChoice” Package to Assess Pairwise Comparisons of Perceived Physical Strength. PLoS ONE 2018, 13, e0190393. [Google Scholar] [CrossRef] [PubMed] [Green Version]
- Luckett, C.R.; Burns, S.L.; Jenkinson, L. Estimates of Relative Acceptability from Paired Preference Tests. J. Sens. Stud. 2020, 35, e12593. [Google Scholar] [CrossRef]
- Neumann, C.; Duboscq, J.; Dubuc, C.; Ginting, A.; Irwan, A.M.; Agil, M.; Widdig, A.; Engelhardt, A. Assessing Dominance Hierarchies: Validation and Advantages of Progressive Evaluation with Elo-Rating. Anim. Behav. 2011, 82, 911–921. [Google Scholar] [CrossRef]
- Neumann, C.; Kulik, L. R Package ‘EloRating—Animal Dominance Hierarchies by Elo Rating. 2014. Available online: https://rdrr.io/cran/EloRating (accessed on 2 March 2021).
- Climate Change. Special Eurobarometer 513. 2021. Available online: https://ec.europa.eu/clima/sites/default/files/support/docs/hu_climate_2021_en.pdf (accessed on 2 March 2021).
- Uzzoli, A.; Szilágyi, D.; Bán, A. Az Éghajlatváltozás Egészségkockázatai És Népegészségügyi Következményei—A Hőhullámokkal Szembeni Sérülékenység Területi Különbségei Magyarországon. Health Risks and Public Health Consequences of Climate Change—Climate Vulnerability Regarding Heat Waves and Its Regional Differences in Hungary. Ter. Stat. 2019, 59, 400–425. [Google Scholar] [CrossRef]
- Bouzarovski, S. Understanding Energy Poverty, Vulnerability and Justice. In Energy Poverty; Palgrave Macmillan: Cham, Switzerland, 2018. [Google Scholar] [CrossRef] [Green Version]
- Bouzarovski, S.; Herrero, S.T. Geographies of injustice: The socio-spatial determinants of energy poverty in Poland, the Czech Republic and Hungary. Post-Communist Econ. 2017, 29, 27–50. [Google Scholar] [CrossRef] [Green Version]
- Bouzarovski, S.; Herrero, S.T.; Petrova, S.; Ürge-Vorsatz, D. Unpacking the spaces and politics of energy poverty: Path-dependencies, deprivation and fuel switching in post-communist Hungary. Local Environ. 2016, 21, 1151–1170. [Google Scholar] [CrossRef] [Green Version]
- Bouzarovski, S.; Thomson, H. Energy Vulnerability in the Grain of the City: Toward Neighborhood Typologies of Material Deprivation. Ann. Am. Assoc. Geogr. 2018, 108, 695–717. [Google Scholar] [CrossRef] [Green Version]
- Bajomi, A.Z.; Cirfusz, M.; Jelinek, C.; Sebály, B. Éves Jelentés a Lakhatási Szegénységről; Annual Report on Housing Poverty; Habitat for Humanity Hungary: Budapest, Hungary, 2021; Available online: https://habitat.hu/sites/lakhatasi-jelentes-2021/wp-content/uploads/sites/10/2021/09/Habitat_EvesJelentes_2021_20210909.pdf (accessed on 13 September 2021).
- KSH. 2011. Available online: http://www.ksh.hu/nepszamlalas (accessed on 13 September 2021).
- IBM Corp. IBM SPSS Statistics for Windows, Version 26.0; IBM Corp.: Armonk, NY, USA, 2019. [Google Scholar]
Publisher’s Note: MDPI stays neutral with regard to jurisdictional claims in published maps and institutional affiliations. |
© 2021 by the authors. Licensee MDPI, Basel, Switzerland. This article is an open access article distributed under the terms and conditions of the Creative Commons Attribution (CC BY) license (https://creativecommons.org/licenses/by/4.0/).