Article

Analysis of Interrelationships between Markets of Fuels in the Visegrad Group Countries from 2016 to 2020

Department of Econometrics and Statistics, Institute of Economics and Finance, Warsaw University of Life Sciences-SGGW, Nowoursynowska 166, 02-787 Warsaw, Poland
*
Author to whom correspondence should be addressed.
Energies 2021, 14(20), 6536; https://doi.org/10.3390/en14206536
Submission received: 25 August 2021 / Revised: 30 September 2021 / Accepted: 5 October 2021 / Published: 12 October 2021
(This article belongs to the Special Issue Energy Supplies in the Countries from the Visegrad Group)

Abstract

:
A fuel market is an important sector of the economy and fuel prices influence the prices of numerous products and services. This paper focuses on the analysis of the interrelationships between markets of fuels in the Visegrad Group (V4) countries. The research is based on weekly prices of Pb95 gasoline and diesel in the Czech Republic, Hungary, Poland, and Slovakia observed from January 2016 through December 2020. After performing the preliminary statistical analysis, the long-term relationships between the prices of fuels are investigated through application of the cointegrated regression Durbin–Watson (CRDW) test. Next, Granger causality is tested to answer the question of whether changes in prices of fuels in separate V4 countries Granger-cause changes in prices of fuels in other V4 countries. The cointegration research uses logarithmic prices, whereas causality investigation is based on their first differences. The results reveal long-term relationships between the prices of Pb95 gasoline in the Czech Republic and prices in other V4 countries as well as Granger causality flowing from diesel price changes in Poland to diesel price changes in other V4 countries and bilateral causation between changes in the prices of Pb95 gasoline in Poland, Hungary and Slovakia.

1. Introduction

The Visegrad Group, initially named the Visegrad Triangle, was established in 1991 by three Central European countries: Czechoslovakia, Hungary and Poland. In 1993, as a result of the breakup of Czechoslovakia into the Czech Republic and Slovakia, the Visegrad Triangle was transformed into the Visegrad V4 Group. At present, these four countries collaborate closely for the purposes of developing cultural, economic, energy and military cooperation. The current number of people living in the Visegrad Group accounts for 14.3% of the EU-27’s population, making it the third-largest consumer market in the European Union. In 2019, the V4 countries’ GDP reached EUR 996 billion (in current prices), which made them the sixth largest economic force in the EU. Poland is the country that makes the biggest contribution to V4′s GDP (53.4%), then the Czech Republic with 22.5%, Hungary with 14.7% and Slovakia with 9.4%. In the period 1991–2019, an over 19-fold increase was observed in the value of V4 countries’ exports and an over 16-fold increase in the value of V4 countries’ imports of goods [1]. Although the main partner of the V4 in trade in goods is Germany, the trade among the V4 is also vital. For each of the V4 countries, the other three countries are among their top five trading partners [2,3].
A broadly understood cooperation in science, education, culture, regional development, and trade influences the economies of V4 countries. One of the most important sectors of each economy (also of V4 countries) is a fuel market. Fuels are major internationally traded products and, for many countries, especially crude oil exporters, they are significant items in terms of current accounts and budget revenues. The prices of fuels that influence the prices of numerous products and services are determined by market principles and depend on many economic and political factors, such as the price of crude oil in world markets or the exchange rate of the domestic currency to the US dollar. Other factors include, for example, the producer’s margin, the amount of excise duty, VAT and the fuel surcharge.
Crude oil is a natural industrial and energy resource which, apart from natural gas and coal, is one of the primary commodities exploited in the world. It is mainly used to produce liquid fuels that are utilised in transport, such as gasoline and diesel oil. There are many studies and analyses focusing on the relationships between the prices of crude oil (spot or futures) and the prices of various products (refined products, fuels, agricultural commodities, precious metals), the exchange rates, stock market indexes, and inflation rates (see Section 2). However, a certain research gap can be found in the investigation of relationships and dependencies between fuel prices in international terms, especially in Central European countries, where petroleum products (gasoline Pb95 and diesel oil) are traded (taking the commodity structure of Visegrad Group foreign trade into account, the share of product group “Mineral fuels, lubricants and related materials” is close to 10% in each of V4 countries [2]). The purpose of this paper is to fill this gap after thoroughly reviewing the existing studies.
Our research contributes to the extant literature by examining the interrelationships between markets of fuels in the Visegrad Group (V4) countries: the Czech Republic, Hungary, Poland and Slovakia. After performing a preliminary statistical analysis, we investigate the long-term relationships between the fuel prices through application of the cointegrated regression Durbin–Watson (CRDW) test. Next, we tested Granger causality to answer the question of whether changes in prices of fuels in separate V4 countries Granger-cause changes in fuel prices in other V4 countries. The development of fuel trade and the integration of the countries may result, among others, in price transmission between countries, cointegration and causal relationships. To the best of our knowledge, this is probably the first study of the cointegrating and causal relationships between the Visegrad Group fuel markets. Our results provided new insight revealing long-term relationships between the prices of Pb95 gasoline in the Czech Republic and prices in other V4 countries, as well as Granger causality flowing from diesel price changes in Poland to diesel price changes in other V4 countries and bilateral causation between changes in the prices of Pb95 gasoline in Poland, Hungary and Slovakia.
The paper is organised as follows. Section 2 offers a literature review, Section 3 describes the data and methodology, Section 4 presents the detailed results, and Section 5 provides concluding remarks.

2. Literature Review

The analyses presented in numerous papers usually concern the relationships between crude oil prices and different variables, for example, refined products and other fuels prices (Asche et al. [4], Papież and Śmiech [5], Kristoufek et al. [6] or Waściński et al. [7]. Asche et al. [4] investigated the relationships between crude oil (Brent) and four major refined products prices from the Rotterdam market, i.e., prices of gas oil, heavy fuel oil, naphtha and kerosene in the period from January 1992 to November 2000 and showed a long-term relationship between the crude oil price and the gas oil, kerosene and naphtha prices. These findings implied market integration for these products. Papież and Śmiech [5] studied the mutual relationship between the prices of the major important primary fuels (crude oil, natural gas and steam coal) on the European market in the period October 2001–May 2011 and revealed a long-term price equilibrium. Moreover, oil prices appeared to be a major factor in changes in the prices of non-renewable energy resources. Kristoufek et al. [6] analysed the link between the weekly and monthly prices of crude oil (Brent), biodiesel, ethanol and related fuels (German diesel and gasoline, the US diesel and gasoline) in the period from 24 November 2003 to 28 February 2011. Their analysis showed a very weak connection between the prices of biofuels and ethanol. However, in the medium-term, prices of biodiesel were connected with fuel prices. Waściński et al. [7] demonstrated a strong impact of the wholesale fuel prices of the Polish oil-processing companies (Orlen and Lotos) on retail prices in Poland from 2004 to 2008.
Another group of papers refer to the relationships between crude oil and precious metal prices (Zhang and Wei [8], Jain and Ghosh [9]) or between crude oil and agricultural items prices (Kristoufek et al. [6], Eissa and Al Refai [10], Sarwar et al. [11]). Zhang and Wei [8] analysed cointegration and causality among the gold market and the crude oil market and observed consistent trends with a significant positive correlation between the price of crude oil and the gold price from January 2000 to March 2008. Moreover, there was a long-term equilibrium between these markets, and the price of oil Granger-caused the volatility in the price of gold. Jain and Ghosh [9] examined the long-term equilibrium relationship, cointegration and Granger causality between prices of oil, precious metals (gold, platinum, silver) and Indian Rupee–US Dollar exchange rate. They used daily data from 2009 to 2011 and discovered that fluctuations in international oil and precious metal prices were transmitted to the Indian economy, which was visible in the changes in the exchange rates. Kristoufek et al. [6] analysed the relationships between the weekly and monthly prices of crude oil (Brent), biodiesel, ethanol and prices of agricultural items (corn, soybeans, sugar beets, sugar cane, wheat) in the period from 24 November 2003 to 28 February 2011. In the medium-term, they showed that ethanol prices were connected to the food prices. Eissa and Al Refai [10] investigated the dynamic linkage among crude oil (WTI, Brent, Dubai Fateh) prices and agricultural products (corn, barley, rapeseed oil) prices from January 1990 to December 2018. Their findings, based on results from linear models, showed that the prices of these agricultural items did not co-move with oil prices in the long term. However, the nonlinear ARDL model provided the opposite conclusion, that barley, corn and rapeseed oil co-moved with oil prices in the long-term. Sarwar et al. [11] examined the pass-through effect of crude oil prices on food and non-food prices in Pakistan in the period 1990–2019. The results revealed that oil prices affected food and also non-food inflation, but the impact was more pronounced in the case of non-food inflation.
There are also papers related to the linkages between crude oil and stock markets (Singhal et al. [12], Çatık et al. [13], Zaighum et al. [14]). Singhal et al. [12] studied the dynamic relationship between international oil prices (WTI), gold prices, Mexican stock market index (BMV IPC) and Mexican peso–US Dollar exchange rate in the period from January 2006 to April 2018. Their findings discovered that the gold prices positively affected index of Mexican Stock Exchange and negatively affected oil prices. Çatık et al. [13] analysed the influence of oil price changes on the sectoral Turkey stock market returns in the period 3 January 1997–9 August 2018. They used daily returns data for 12 sectors. The results showed that the impact of oil price returns differed clearly over time and often had a smaller effect on sectoral returns compared with Turkish lira—US Dollar exchange rate returns. Zaighum et al. [14] analysed nonlinear relationship between the Dow Jones Islamic Market Index (DJIMI) and the prices of WTI crude oil, gasoline, natural gas, and heating oil. In the long- and short-term, they observed a strong positive reaction of crude oil and gasoline to the DJIMI, whereas heating oil prices responded inversely to the DJIMI. Furthermore, they discovered the asymmetric and non-linear transmission of energy prices to the Islamic stock market, and a feedback effect between energy sources and DJIMI. Their findings also recognised crude oil and gasoline as two principal economic drivers explaining the short- and long-term Islamic stock market dynamics.
Examples of studies examining the relationships between crude oil prices and different macroeconomic factors are papers by Kırca et al. [15], Aye and Odhiambo [16] or Zakaria et al. [17]. Kırca et al. [15] investigated the relationship between the oil–gas prices index and economic growth in Turkey in the period 1998–2019. The results, based on Granger and the Frequency Domain Causality tests, demonstrated an insignificant causality relationship between the variables, whereas the Toda–Yamamoto causality test with a structural break exhibited a causal relation running from oil–gas to economic growth. Aye and Odhiambo [16] used quarterly data from 1980 to 2020 and showed that, beyond the identified threshold values, the WTI and Brent crude oil prices would have significant negative effects on agricultural growth in South Africa. Zakaria et al. [17] tried to estimate the impact of oil prices on inflation rates in South Asian countries (Bangladesh, India, Pakistan, Sri Lanka) in the period from 1980 to 2018. They identified a cointegration of oil prices and inflation, and also noticed that the oil price caused inflation. Moreover, the global oil price shock had a positive impact on inflation, and this positive effect was permanent.
Wang et al. [18] examined the relationships between the Singapore fuel oil spot market and China fuel oil markets (Shanghai oil future price, Huangpu oil spot price) over the 25 August 2004–30 June 2006 period. The analysis revealed a very strong correlation between these oil prices, the long-term relation and cointegration among oil prices in Singapore, Shanghai and Huangpu.
The aim of our paper is to investigate the interrelationships between markets of fuels in the Visegrad Group (V4) countries: the Czech Republic, Hungary, Poland and Slovakia.

3. Materials and Methods

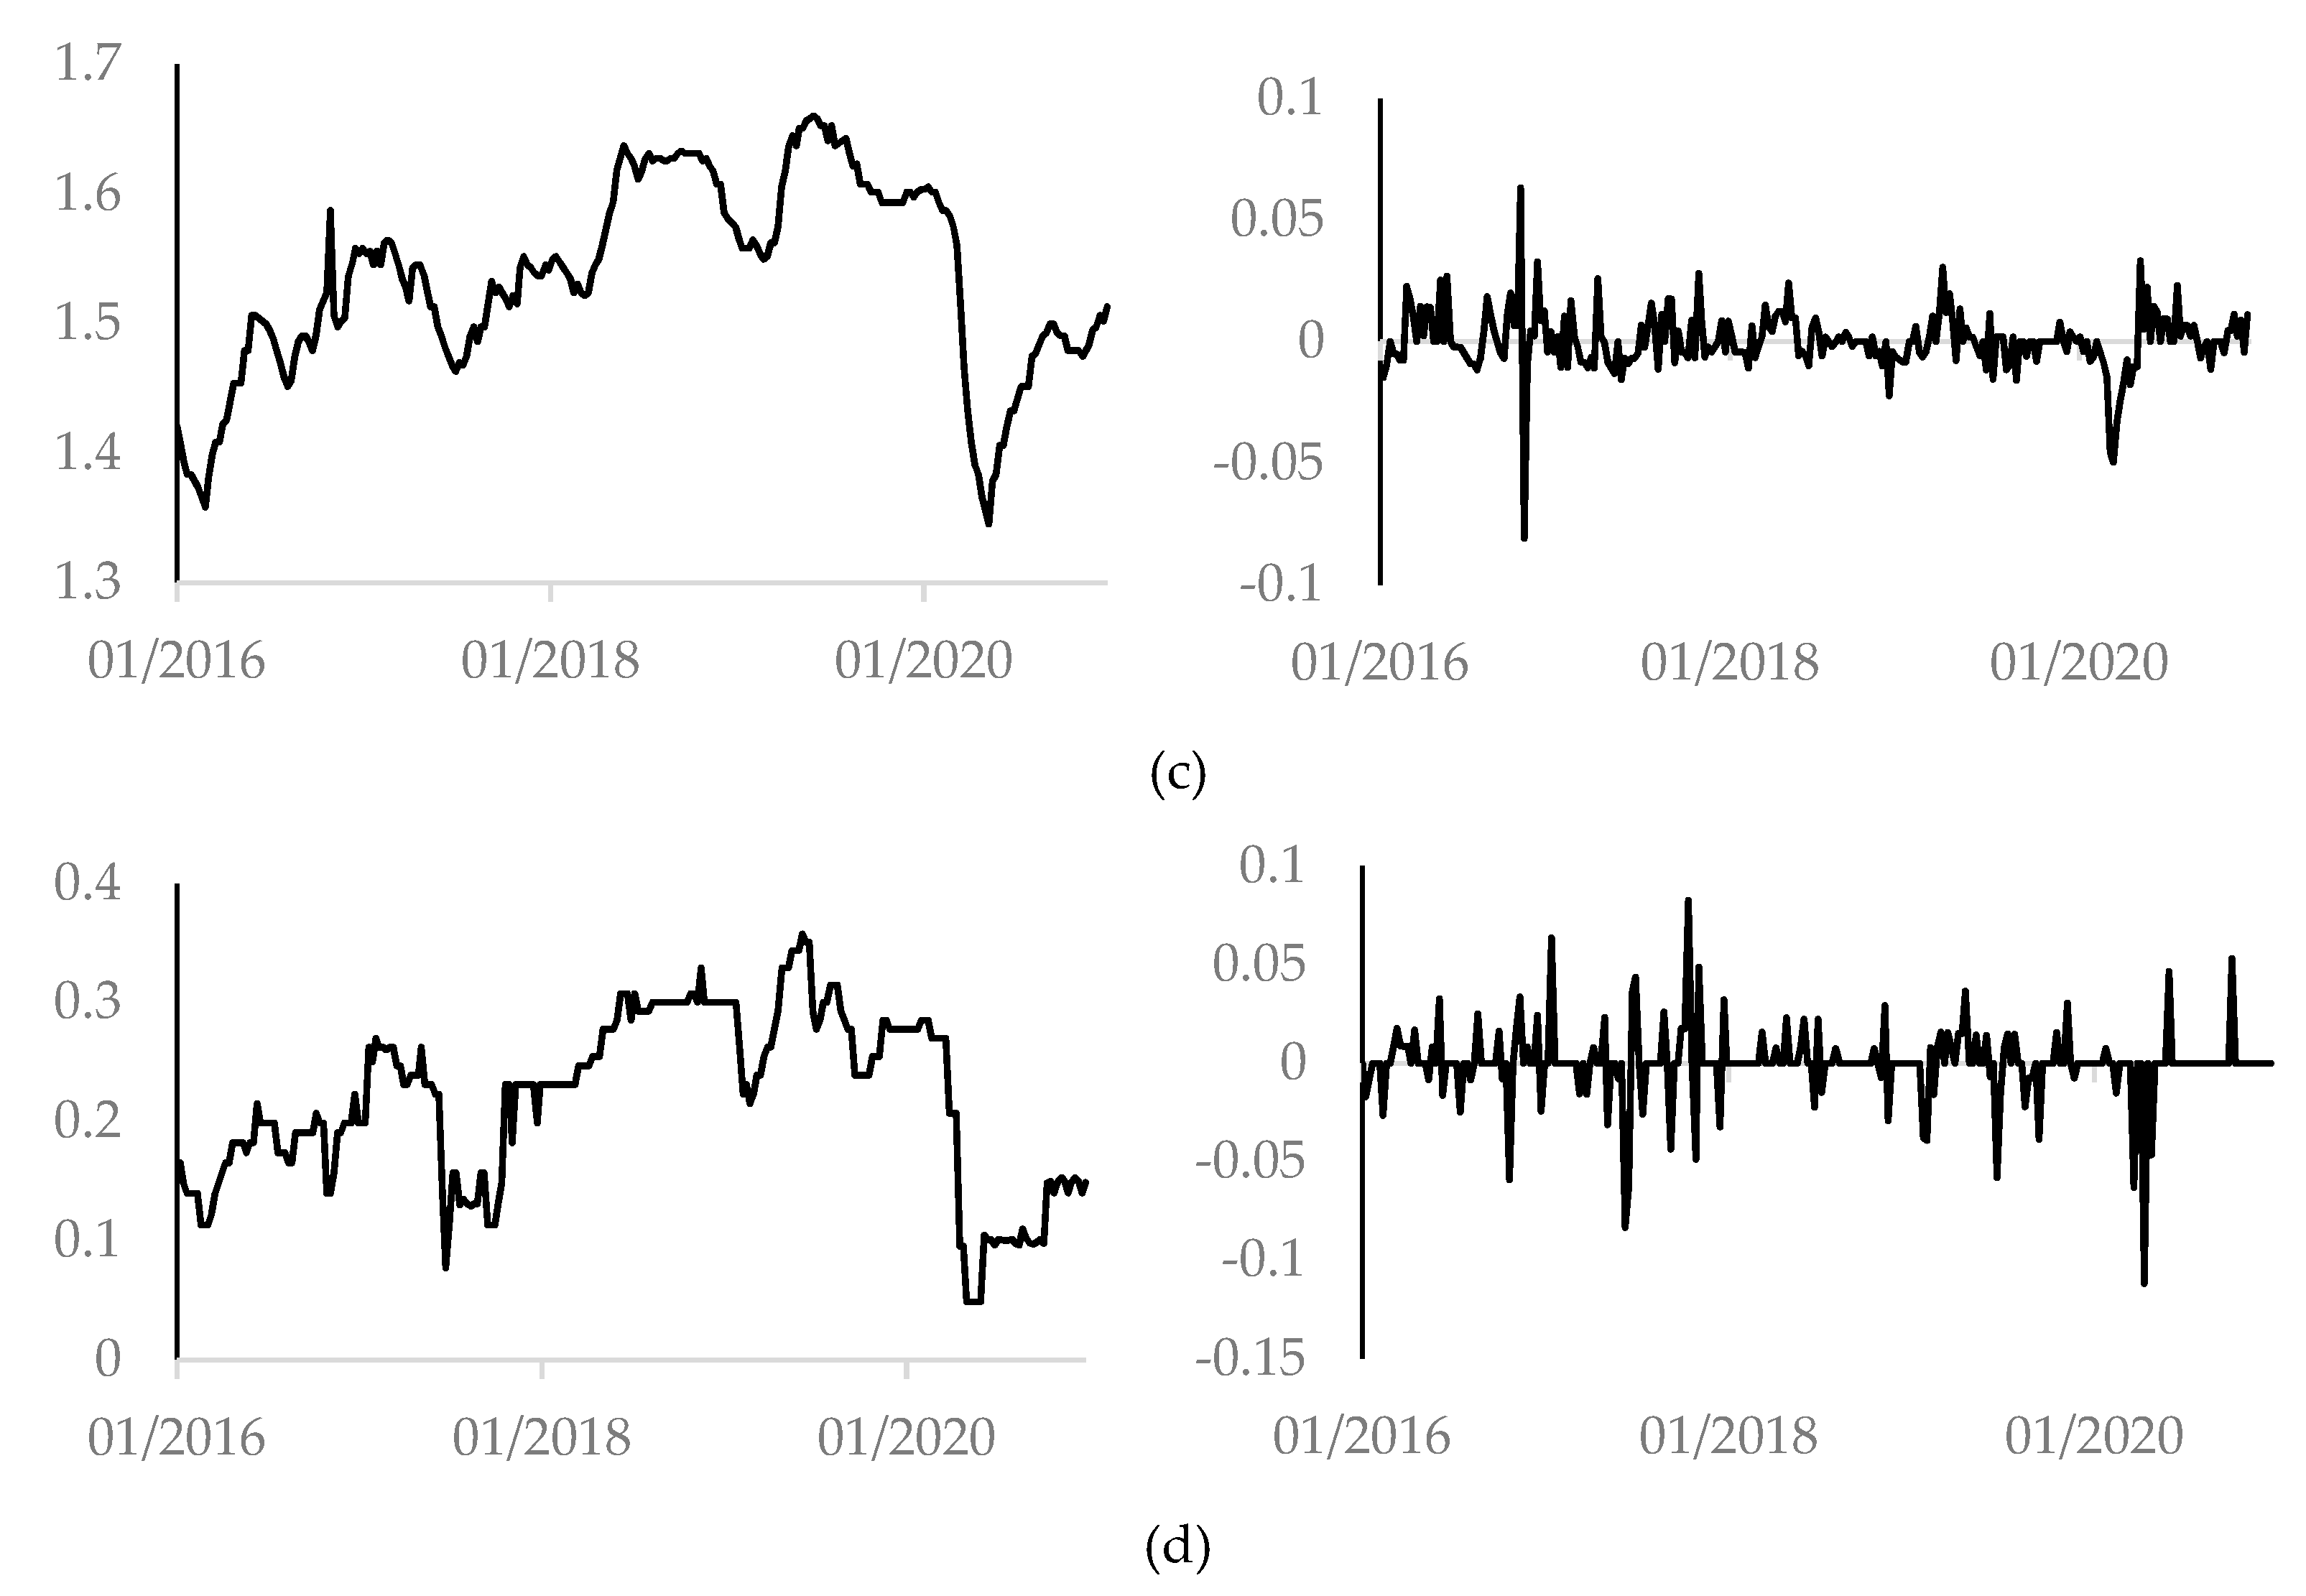
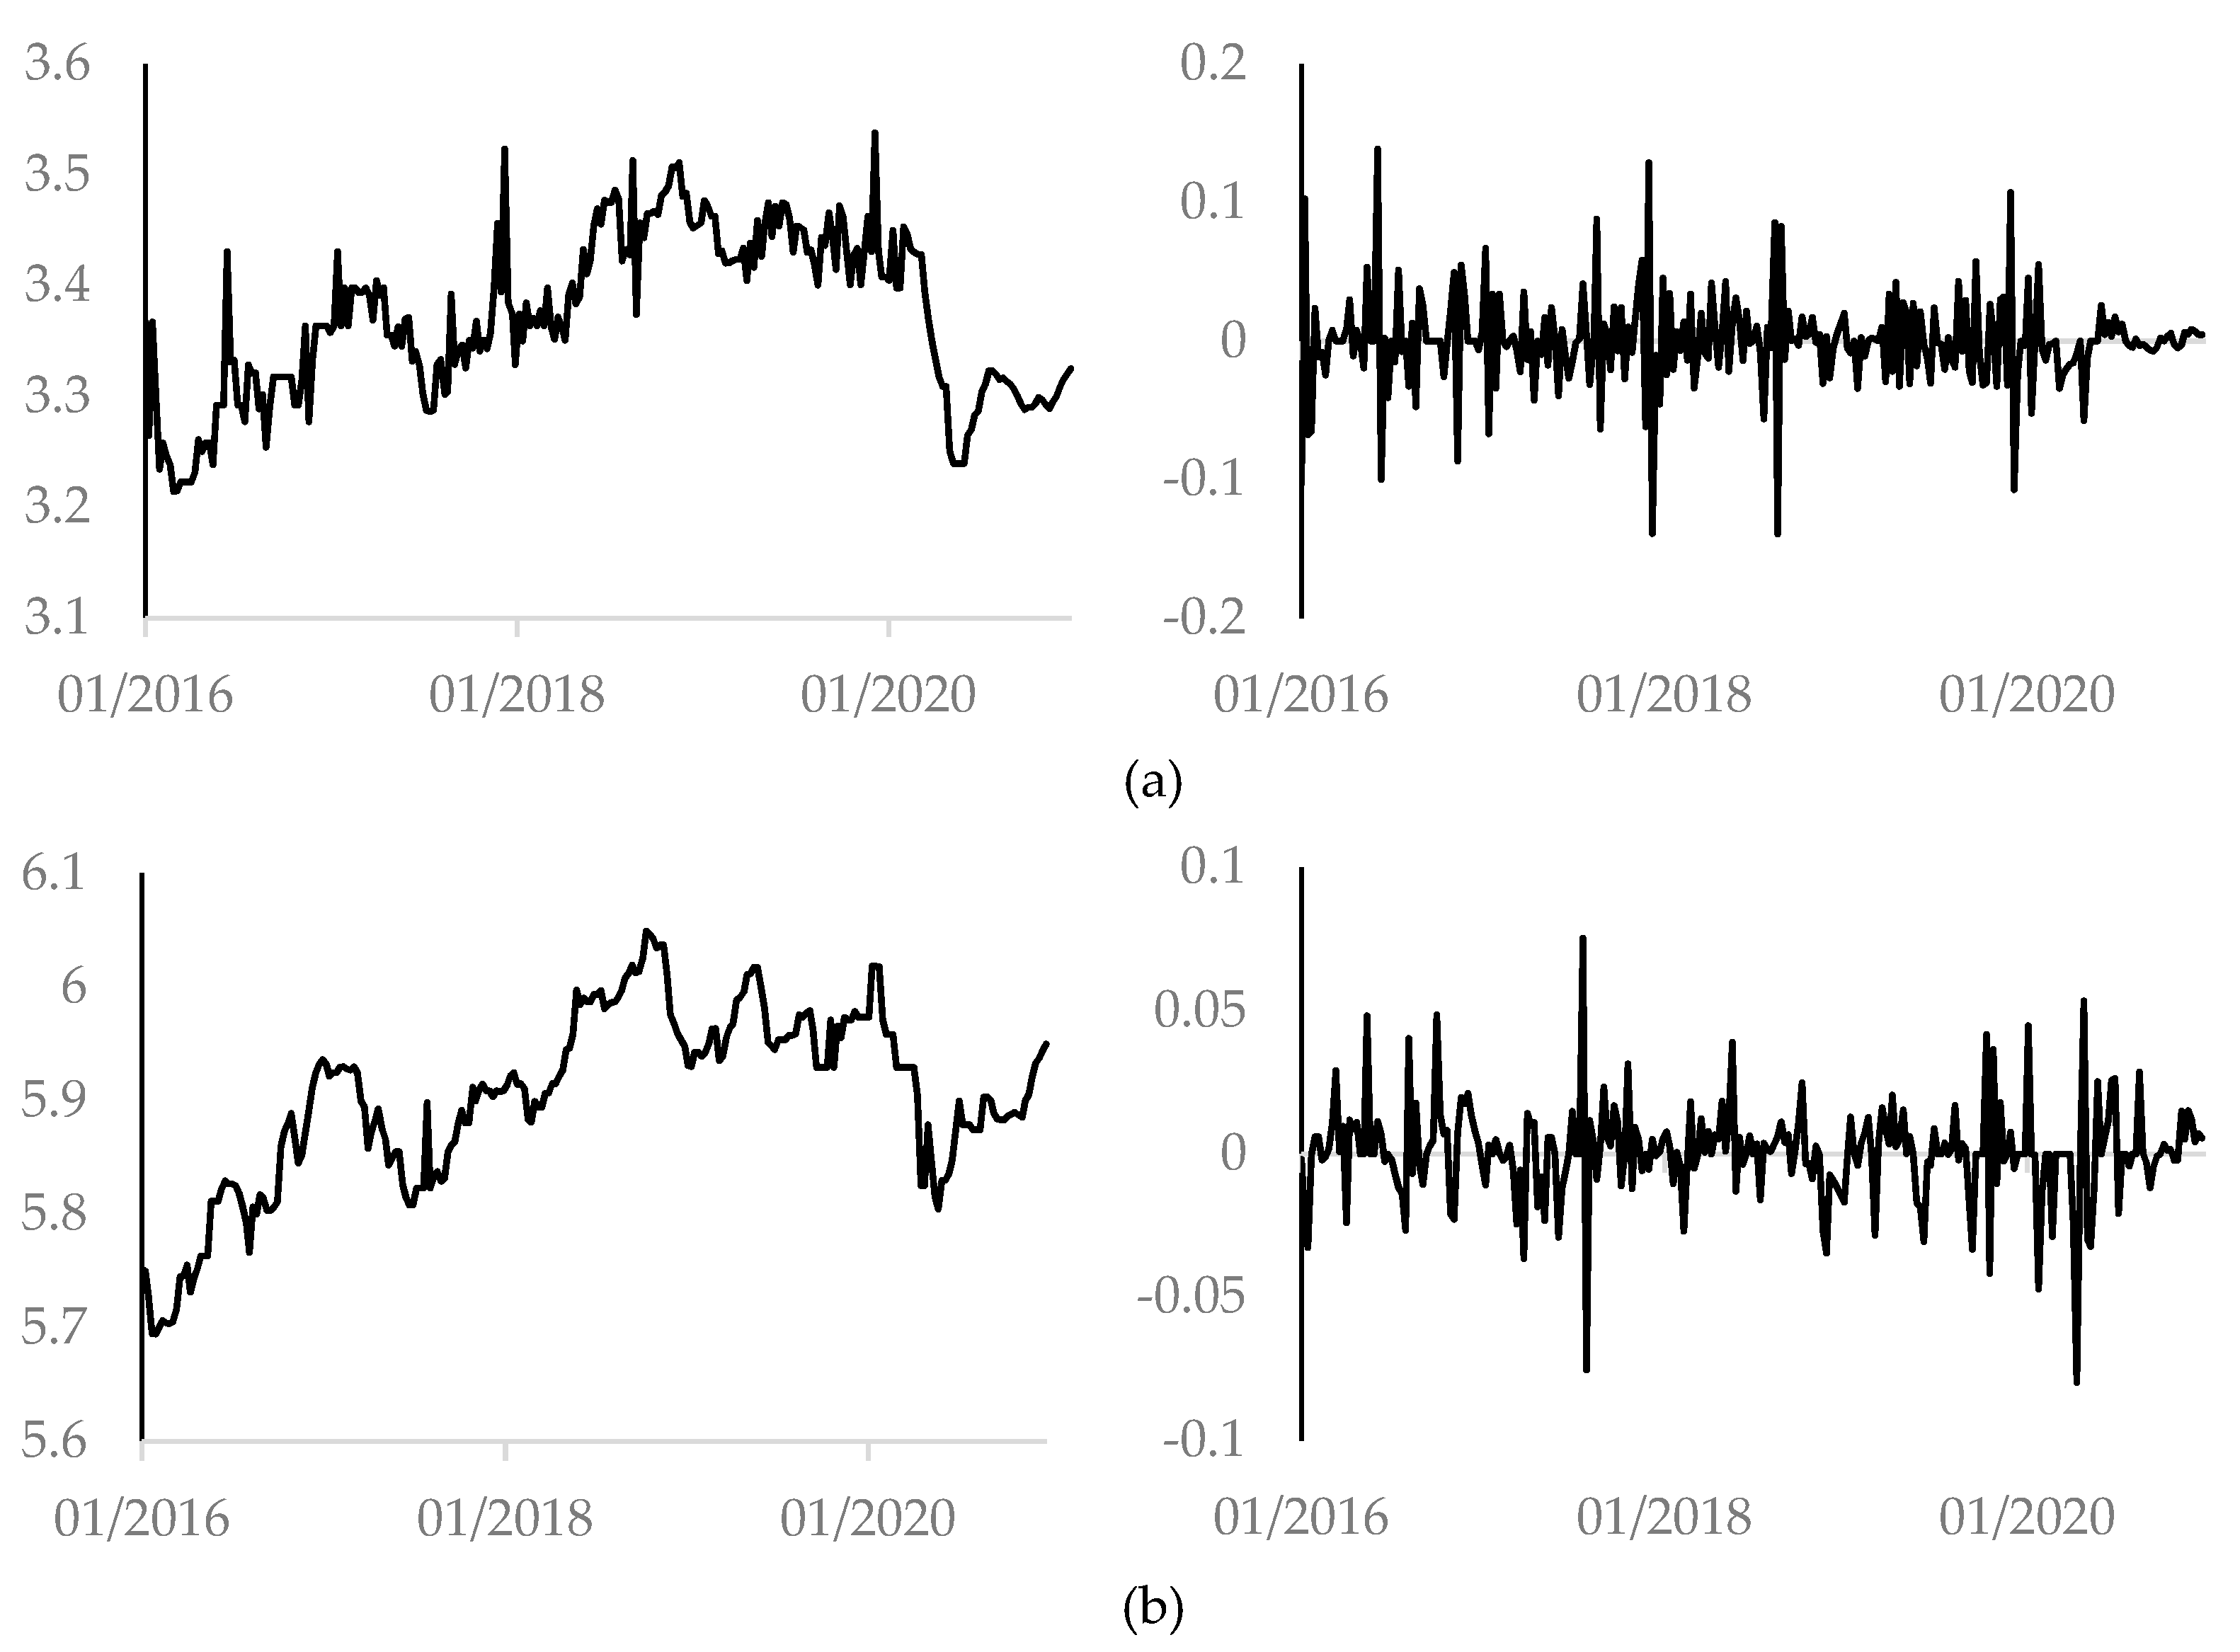
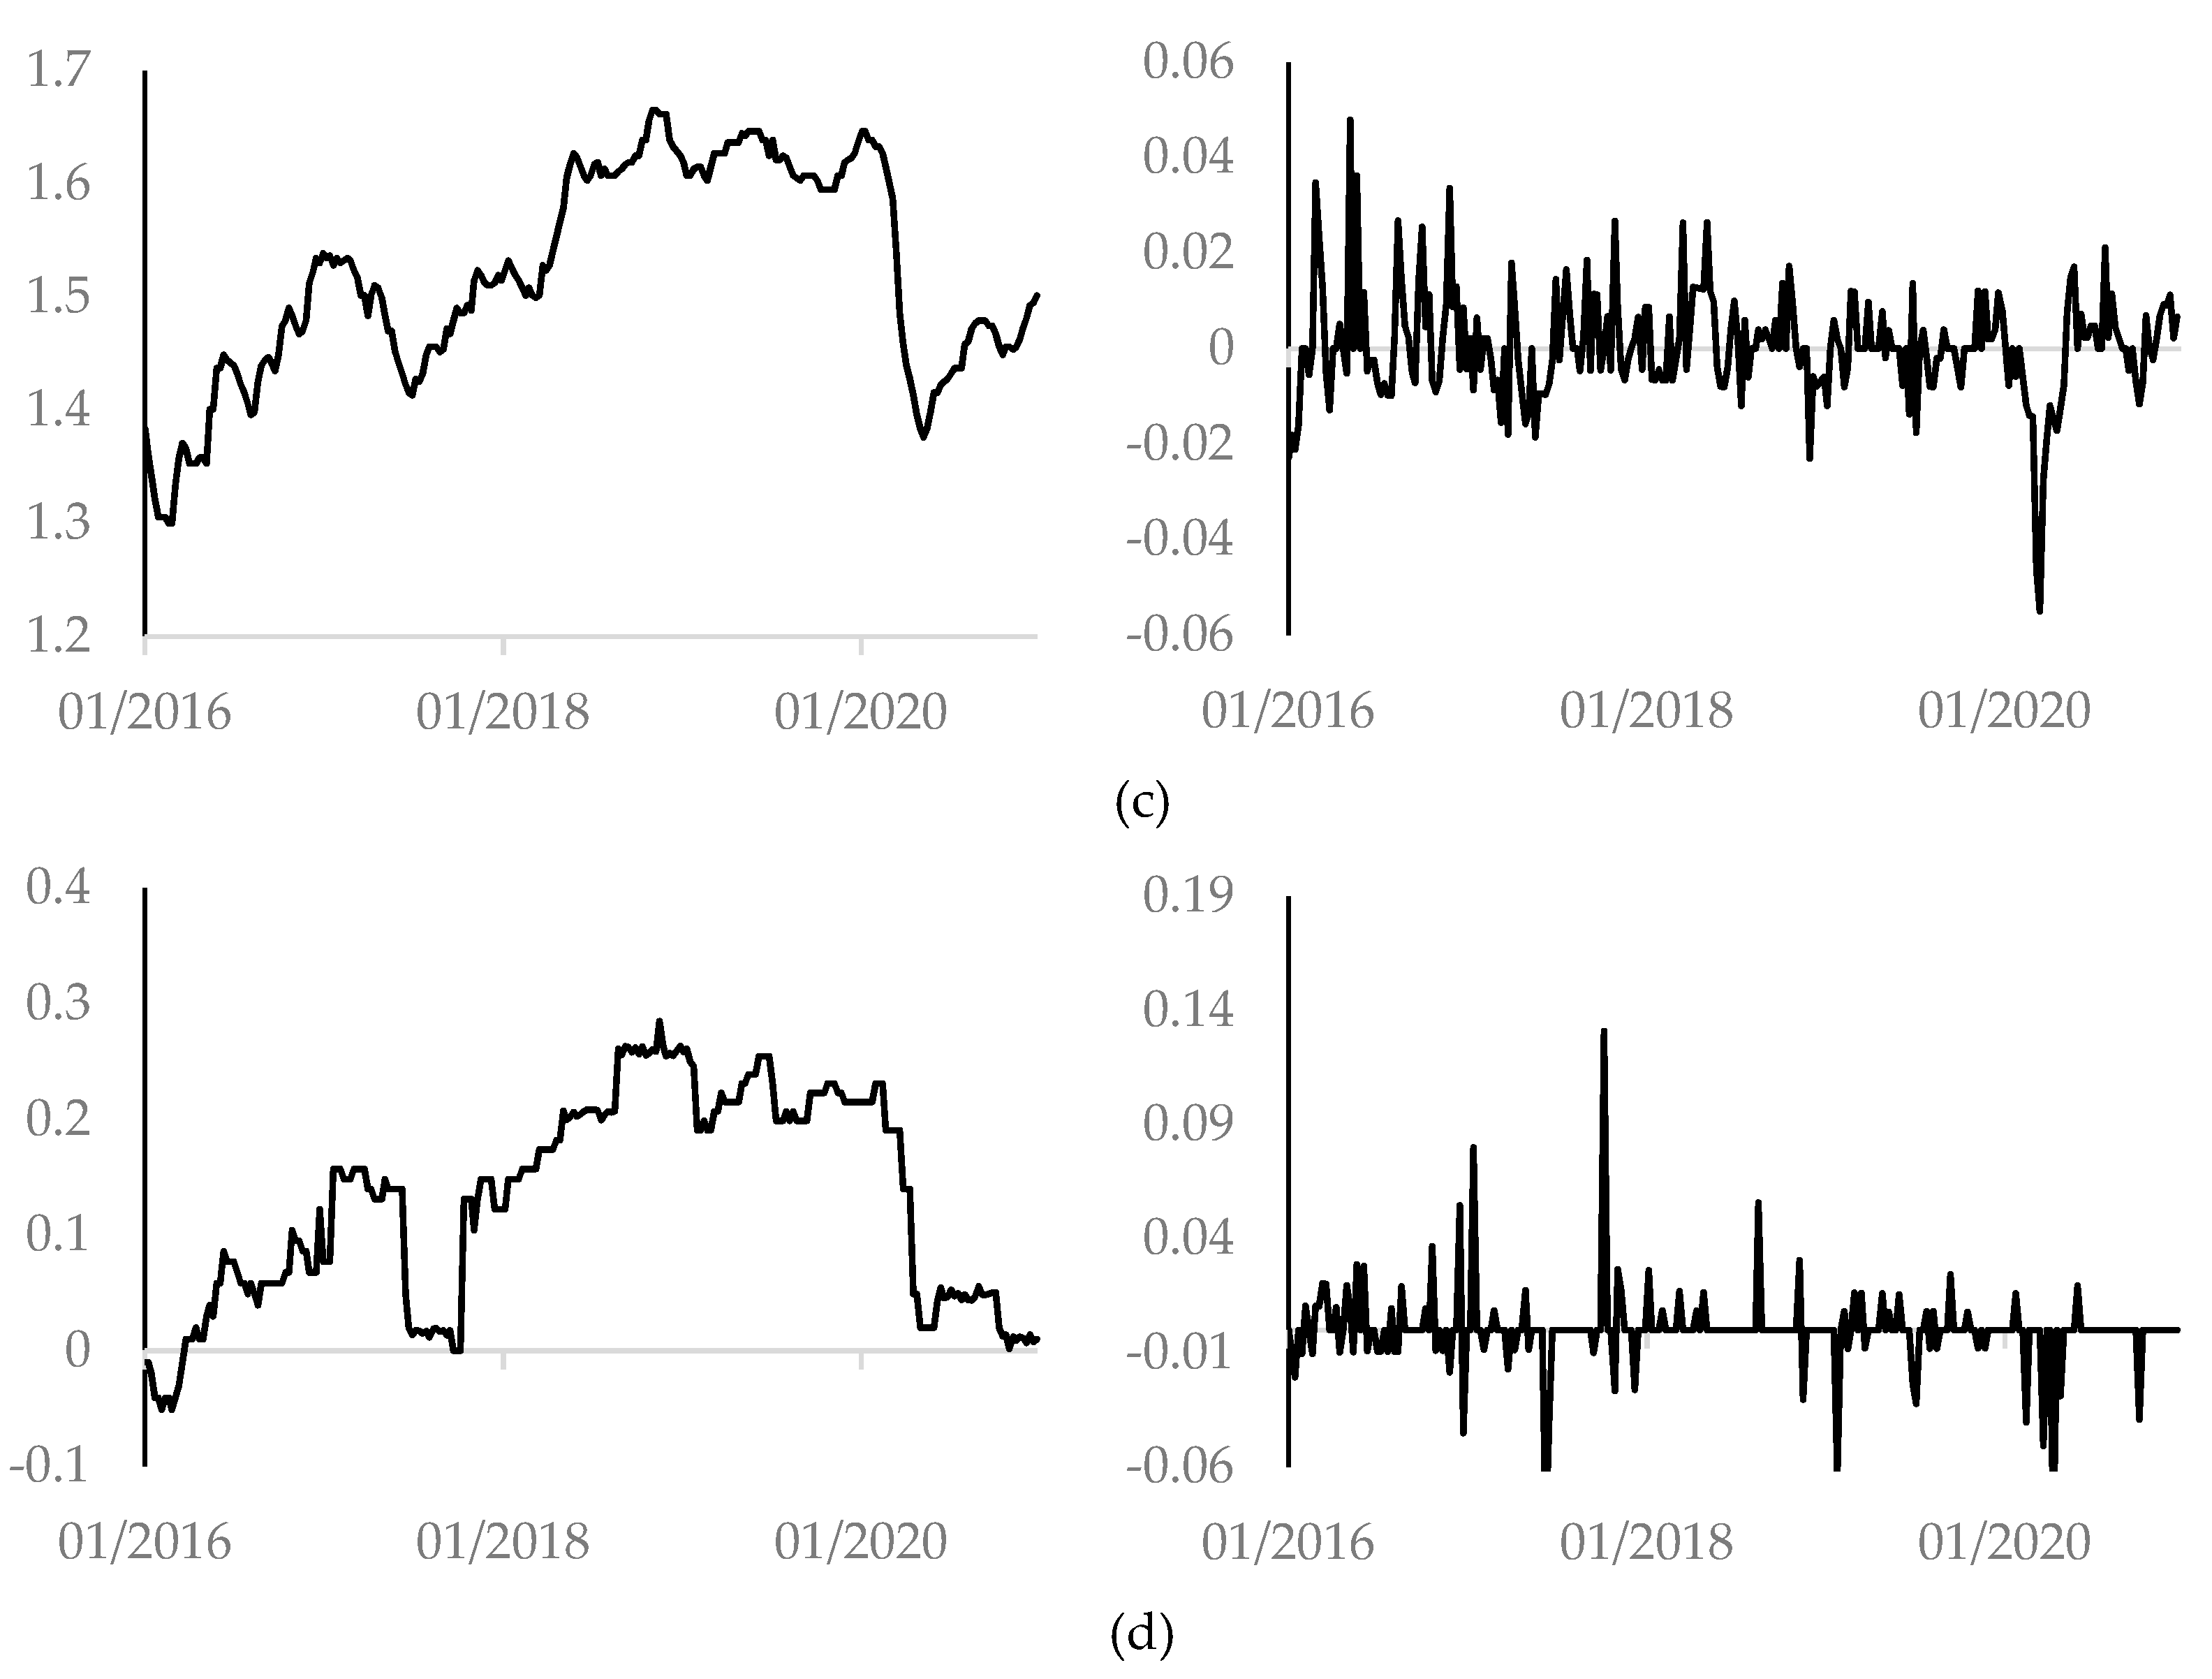
The dataset used for the purpose of the research covers weekly prices (260 observations) of basic fuels: gasoline Pb95 and diesel in the Czech Republic, Hungary, Poland and Slovakia from January 2016 through December 2020. The prices are expressed in domestic currencies per 1 litre. The data are provided by e-petrol.pl (www.e-petrol.pl (accessed on 21 June 2021)) and published every Wednesday at 3 pm. The quantitative analysis is based on logarithmic transformations of prices (log-prices) and their first differences (log-returns). They are displayed in Figure 1 and Figure 2.

3.1. Testing for Stationarity

According to the theory, the stationary properties of time series should be examined before testing the cointegration. Additionally, the verification of causality should be preceded by an analysis of variables stationarity. A stochastic process (a random or stochastic process can be defined as a collection of random variables ordered in time) is called stationary if its mean and variance are constant and independent of time, and the covariance between a number of equally spaced elements depends only on the distance of these elements—not on a point on the timeline. In the econometric literature, such a process is called weakly stationary, or covariance stationary. Time series that are stationary tend to return to the mean (mean reversion) and fluctuations around this mean (measured by its variance) will have a broadly constant amplitude. However, a nonstationary process or unit root process has a time-varying mean or a time-varying variance or both and belongs to a more general class of stochastic processes known as integrated processes. Order of integration of a series is the minimum number of times the series need to be first differenced to yield a stationary series [9]. There are several stationarity tests. One of the most popular methods of examining stationarity is the augmented Dickey–Fuller test (the ADF-test). The first step of the procedure is to estimate one of the following equations:
Y t = α 1 Y t 1 + i = 1 p c i Y t 1 + ε t ,
Y t = α 0 + α 1 Y t 1 + i = 1 p c i Y t i + ε t ,
Y t = α 0 + λ 1 t + α 1 Y t 1 + i = 1 p c i Y t i + ε t .
The null hypothesis is
H0: α 1 = 0 ,
that is, there is a unit root—the time series is nonstationary.
The test statistic (τ) is given by:
τ = α ^ 1 S ( α ^ 1 ) .
where: α ^ 1 OLS estimate of α 1 in any of Equations (1)–(3), S ( α ^ 1 ) —standard error of α 1 estimate.
When the value of τ is lower than the critical value, we should reject the null hypothesis. Dickey and Fuller [19] computed the critical values on the basis of Monte Carlo simulations. Later, MacKinnon [20] presented more extensive tables [21].

3.2. Testing for Cointegration

The idea of cointegration was proposed by Granger and Engle [22,23]. Cointegration is defined as systemic co-movement among variables over the long term. If there is a long-term relationship between two (or more) nonstationary variables, then the deviations from the long-term path are stationary. This means that a long-term equilibrium path between two economic processes that is independent of time can be determined, and the values located elsewhere are short-term deviations from the equilibrium, which depend on time. Thus, cointegrated processes are characterised by a common long-term growth path and the difference between them has an almost constant level over time. On the other hand, non-cointegrated processes diverge in the long term, and the difference between them changes over time. In brief, two variables are cointegrated if there is a long-term, or equilibrium, relationship between them.
One of the methods for finding cointegration is the cointegrated regression Durbin–Watson (CRDW) test. The procedure for this is first to estimate the following equation, called the cointegrating regression:
Y t = α 0 + α 1 X t + ε t .
The Durbin–Watson statistic is given by:
  d = t = 2 T ( e t e t 1 ) 2 t = 1 T e t 2 ,
where e t —residuals obtained from Equation (5).
One way of testing for a lack of cointegration is to see if d is close to zero, so the null hypothesis is
H0: d = 0 .
This is because one would generally expect ε to be I(1) if X and Y are I(1). If this were so, the d statistic would be about zero, and the two series would not be cointegrated. If d is significantly positive, then we would suspect that the two series are cointegrated. The standard tables for the Durbin–Watson test are not applicable here because there the null hypothesis is that d = 2 for an AR(1) process, rather than that d = 0 . However, Engle and Granger carried out a simulation study and obtained the critical values [24].

3.3. Testing for Granger Causality

Granger causality test is a useful approach to detect a causal relationship between variables (two or more). According to Greene [25], causality, in the sense proposed by Granger [26], is inferred when the lagged values of one variable (X) have explanatory power in a regression of another variable (Y) on lagged values of Y and X. Alternatively, when one identifies one variable as the dependent variable (Y) and another as the independent variable (X), one makes an implicit assumption that changes in the independent variable induce changes in the dependent variable. Consequently, including past or lagged values of X in a regression of Y on other variables (including its own past values) significantly improves the prediction. An analogous definition applies if Y Granger-causes X. Finally, if X Granger-causes Y and Y Granger-causes X, the two variables are jointly determined and there is a bilateral causation.
Granger devised some tests of causality, which proceed as follows. If there are two time series, Yt and Xt, the time series Xt fails to Granger-cause Yt in an unrestricted regression of Yt on lagged Ys and lagged Xs:
Y t = i = 1 p α i Y t i + j = 1 q β j X t j + u t ,
the coefficients of the latter are zero ( β j = 0 for j = 1 , 2 , , q ).
Next, we consider the restricted model:
Y t = i = 1 p α i Y t 1 + v t .
The test statistic is:
F = ( E S S R E S S U ) / q E S S S U / ( n p q ) ,
where n denotes the number of observations used in Equation (7), ESSU is the error sum of squares for Equation (7), and ESSR is the error sum of squares for the restricted model (8). Under the null hypothesis of X not Granger-causing Y, F follows the F-distribution with q degrees of freedom for the numerator and n p q degrees of freedom for the denominator. Lag lengths p and q are, to some extent, arbitrary [27].

4. Results and Discussion

4.1. Preliminary Statistical Analysis

In the first stage of the research, we performed a preliminary statistical analysis. In Table 1 and Table 2, we provide the estimates of basic distributional characteristics (mean, standard deviation, coefficient of variation, asymmetry, kurtosis) and the results of the Jarque–Bera normality test for Pb95 gasoline and diesel log-returns. In Table 3, we report the values of Pearson correlation coefficients between these log-returns series.
The results displayed in Table 1, Table 2 and Table 3 report important findings. First, Pb95 gasoline and diesel exhibit positive mean returns (except for Pb95 returns in the Czech Republic and Slovakia, and diesel returns in the Czech Republic). The volatilities observed for the Czech Republic and Slovakia differ remarkably from those obtained for Hungary and Poland (which are much higher). The returns are also described by negative skewness (except for diesel in Slovakia) and a kurtosis greater than 3 (except for Pb95 in the Czech Republic and diesel in Slovakia). The Jarque–Bera (JB) statistics of normality suggest a rejection of the null hypothesis for all returns series at the 0.05 significance level, so they do not follow normal distribution. They are also characterised by a positive linear correlation. The strongest relationship is observed for Pb95 gasoline and diesel in Poland (0.724). When considering intercountry relationships, the strongest positive correlation is between Pb95 gasoline in Hungary and diesel in Poland (0.358).

4.2. The ADF Test Results

In the second stage of the research, we examined the stationarity of the time series under consideration. In Table 4 and Table 5, the results of the ADF test performed on the natural logarithms of price levels (log-prices) and the first differences (log-returns), respectively, are reported.
The results presented in Table 4 and Table 5 show that, in the case of logarithmic prices, we cannot reject the null hypothesis of the presence of a unit root at a 0.05 level of significance. For the first differences (log-returns), we reject the null hypothesis. Therefore, the results of the ADF test indicate that all series are I(1) in nature. This means that the log-prices of Pb95 gasoline and diesel are not stationary, but their first differences (log-returns) are stationary.

4.3. The CRDW Test Results

In the third stage of the research, we examined the cointegration between prices of Pb95 gasoline and between prices of diesel in V4 countries (inter-country relationships). The test was performed on the logarithmic transformations of the prices. The results (values of d statistics) are reported in Table 6.
The results given in Table 6 reveal a significant cointegration between prices of Pb95 gasoline in the Czech Republic and prices in other V4 countries (if the computed d value is smaller than 0.386, we reject the null hypothesis of cointegration at the 0.05 level), and also between diesel prices in the Czech Republic and prices in other V4 countries, so there are significant long-term relationships between them.

4.4. Granger Causality Test Results

In the last stage of the research, to answer the question of whether changes in prices of fuels in separate V4 countries Granger-cause changes in the price of fuels in other V4 countries, a Granger causality test was run. The results (F-statistic values) are reported in Table 7 and Table 8, where arrows point to the direction of causality.
The results presented in Table 7 and Table 8 show that, in most cases, the number of lags does not influence the test results. Thus, regardless of lag length, there is a causality running from Pb95 gasoline prices in Poland to Pb95 gasoline prices in the Czech Republic. There are also bilateral causalities between Pb95 gasoline prices in Poland and in Hungary, as well as between Pb95 gasoline prices in Poland and in Slovakia. At a lag length equal to 2 and 3, Granger causality flows from Pb95 prices in the Czech Republic to Pb95 gasoline prices in Slovakia, and from Pb95 gasoline prices in Hungary to Pb95 gasoline prices in the Czech Republic and in Slovakia. Regardless of the number of lags, there is a causality running from diesel prices in Poland to diesel prices in the Czech Republic, Hungary and Slovakia. At a lag length equal to 2 and 3, there is a Granger causality flowing from diesel prices in Hungary to diesel prices in Slovakia and from diesel prices in Slovakia to diesel prices in the Czech Republic. Finally, at lag lengths 1 and 3, there is causality running from diesel prices in Hungary to diesel prices in the Czech Republic.

5. Concluding Remarks and Future Work

This paper aimed to investigate the interrelationships between fuel markets in the Visegrad Group countries. The research was based on weekly prices of Pb95 gasoline and diesel in the Czech Republic, Hungary, Poland and Slovakia, observed from January 2016 through December 2020. The preliminary statistical analysis discovered positive linear correlation between them. Next, results of the cointegration test detected long-term relationships between prices of Pb95 gasoline and diesel in the Czech Republic and the prices in Hungary, Poland and Slovakia. As cointegration does not indicate the direction of the relationships, the Granger causality test was used to examine this. Regardless of lag length the results revealed that changes in the prices of Pb95 gasoline in Poland Granger-caused changes in prices of this fuel in other V4 countries. At the same time, changes in the prices of Pb95 gasoline in Hungary and in Slovakia Granger-caused changes in the prices of this fuel in Poland, so there is bilateral causation between these markets. Regardless of the number of lags, changes in the prices of diesel in Poland Granger-caused changes in the prices of diesel in other V4 countries. It seems that the dominant direction of information flow is price transmission from Poland to the rest of the Visegrad Group. Consequently, we can better predict the prices of fuels in separate V4 countries by considering the lagged values of prices observed in Poland.
The results are closely related to the structure of the Visegrad Group fuel market, in which Poland plays an important role. PKN Orlen, the leading Polish oil-processing company, competes with Hungarian MOL and tries to dominate the Czech and Slovak markets, for example through the acquisition of Unipetrol, the biggest oil-processing enterprise in the Czech Republic, or through increasing its share in the Slovak retail market under the ‘Orlen Unipetrol Slovakia’ label. However, Slovakia and the Czech Republic are among the three main countries from which Poland imports petrol (the third one is Germany). In 2020, the import of gasoline from Slovakia to Poland reached 34% of total imports, and imports from the Czech Republic formed 9% of total imports. Furthermore, Slovakia, the Czech Republic and Hungary are among the eight main countries from which Poland imports diesel. In 2020, imports of this fuel from Slovakia accounted for 4.7% of the total imports, while imports from the Czech Republic account for 1.2% and imports from Hungary accounted for only 0.5% of total imports to Poland. On the other hand, the V4 countries are not the main destinations for Polish exports of liquid fuels. In 2020, exports to the Czech Republic were the only significant amounts, as 39% of diesel and 15% of JET fuel from Poland were delivered to this country [28].
This paper provides new insight regarding the interrelationships between fuel markets in the Visegrad Group countries from 2016 to 2020. The results of the analysis revealed that, in this period, the prices of Pb95 gasoline and diesel in the Czech Republic and their prices in Hungary, Poland and Slovakia were in a long-term equilibrium. Market mechanisms and fundamental factors such as changing economic situation made the prices move (increase and decrease) together in the long-term. This prevents arbitrage opportunities. Moreover, bidirectional causal linkages between the prices of Pb95 gasoline in Poland, Hungary and Slovakia imply that these markets react to new information simultaneously, and there are feedback relationships between them, which may lead to reduced price competition.
As fuels are important energy sources for development in emerging economies (including V4 countries), our findings may be important to the main actors in the Visegrad Group fuel market, such as policymakers, producers, retail traders and consumers. However, when accounting for the complexity of the relationships between fuel markets in the V4 countries, in future work, the nonlinear Granger causality approach could be employed to investigate their nonlinear interactions. This concept, proposed by Baek and Brock [29] and Hiemstra and Jones [30], is based on the residuals obtained from linear VAR models such as Equation (7). A detailed description of the methodology can be found in Zhang and Wei [8].

Author Contributions

Conceptualization, M.K.; methodology, M.K.; software, A.G.; validation, A.G. and M.K.; formal analysis, A.G. and M.K.; investigation, A.G. and M.K.; resources, A.G. and M.K.; data curation, M.K.; writing—original draft preparation, A.G. and M.K.; writing—review and editing, A.G. and M.K.; visualisation, A.G.; supervision, M.K.; project administration, A.G.; funding acquisition, A.G. and M.K. All authors have read and agreed to the published version of the manuscript.

Funding

This research received no external funding.

Conflicts of Interest

The authors declare no conflict of interest.

References

  1. Ambroziak, Ł.; Chojna, J.; Gniadek, J.; Juszczak, A.; Miniszewski, M.; Strzelecki, J.; Szpor, A.; Śliwowski, P.; Święcicki, I.; Wąsiński, M. The Visegrad Group—30 Years of Transformation, Integration and Development; Polish Economic Institute: Warsaw, Poland, 2020. [Google Scholar]
  2. Šimáková, J. Cointegration Approach to the Estimation of the Long-Run Relations between Exchange Rates and Trade Balances in Visegrad Countries. Financ. Assets Invest. 2016, 7, 37–57. [Google Scholar] [CrossRef]
  3. Grodzicki, T. Selected Economic Conditions of the Visegrad Countries. Education Excellence and Innovation Management: A 2025 Vision to Sustain Economic Development during Global Challenges. In Proceedings of the 35th IBIMA Conference, Seville, Spain, 1–2 April 2020; pp. 1453–1460. [Google Scholar]
  4. Asche, F.; Gjølberg, O.; Völker, T. Price relationships in the petroleum market: An analysis of crude oil and refined product prices. Energy Econ. 2003, 25, 289–301. [Google Scholar] [CrossRef] [Green Version]
  5. Papież, M.; Śmiech, S. The analysis of relation between primary fuel prices on the European market in the period 2001–2011. Energy Market J. 2011, 5, 139–144. [Google Scholar]
  6. Kristoufek, L.; Janda, K.; Zilberman, D. Relationship between Prices of Food, Fuel and Biofuel. In Proceedings of the 131st EAAE Seminar “Innovation for Agricultural Competitiveness and Sustainability of Rural Areas”, Prague, Czech Republic, 18–19 September 2012. [Google Scholar]
  7. Waściński, T.H.; Przekota, G.; Sobczak, L.M. Reaction of retail fuels prices to changes in PKN Orlen and Lotos wholesale prices. Quant. Methods Econ. 2010, XI, 273–280. [Google Scholar]
  8. Zhang, Y.-J.; Wei, Y.-M. The crude oil market and the gold market: Evidence for cointegration, causality and price discovery. Resour. Policy 2010, 35, 168–177. [Google Scholar] [CrossRef]
  9. Jain, A.; Ghosh, S. Dynamics of global oil prices, exchange rate and precious metal prices in India. Resour. Policy 2013, 38, 88–93. [Google Scholar] [CrossRef]
  10. Eissa, M.A.; Al Refai, H. Modelling the symmetric and asymmetric relationships between oil prices and those of corn, barley, and rapeseed oil. Resour. Policy 2019, 64, 101511. [Google Scholar] [CrossRef]
  11. Sarwar, M.N.; Hussain, H.; Maqbool, M.B. Pass through effects of oil price on food and non-food prices in Pakistan: A nonlinear ARDL approach. Resour. Policy 2020, 69, 101876. [Google Scholar] [CrossRef]
  12. Singhal, S.; Choudhary, S.; Biswal, P.C. Return and volatility linkages among International crude oil price, gold price, exchange rate and stock markets: Evidence from Mexico. Resour. Policy 2019, 60, 255–261. [Google Scholar] [CrossRef]
  13. Çatık, A.N.; Kışla, G.H.; Akdeniz, C. Time-varying impact of oil prices on sectoral stock returns: Evidence from Turkey. Resour. Policy 2020, 69, 101845. [Google Scholar] [CrossRef]
  14. Zaighum, I.; Aman, A.; Sharif, A.; Suleman, M.T. Do energy prices interact with global Islamic stocks? Fresh insights from quantile ARDL approach. Resour. Policy 2021, 72, 102068. [Google Scholar] [CrossRef]
  15. Kırca, M.; Canbay, Ş.; Pirali, K. Is the relationship between oil-gas prices index and economic growth in Turkey permanent? Resour. Policy 2020, 69, 101838. [Google Scholar] [CrossRef] [PubMed]
  16. Aye, G.C.; Odhiambo, N.M. Oil prices and agricultural growth in South Africa: A threshold analysis. Resour. Policy 2021, 73, 102196. [Google Scholar] [CrossRef]
  17. Zakaria, M.; Khiam, S.; Mahmood, H. Influence of oil prices on inflation in South Asia: Some new evidence. Resour. Policy 2021, 71, 102014. [Google Scholar] [CrossRef]
  18. Wang, Z.; Chen, C.; Liu, Z. The Linkage Between the Fuel Oil Markets of Singapore and China. Chin. Econ. 2008, 41, 76–83. [Google Scholar] [CrossRef]
  19. Dickey, D.A.; Fuller, W.A. Distribution of the estimators for autoregressive time series with a unit root. J. Am. Stat. Assoc. 1979, 74, 427–431. [Google Scholar]
  20. MacKinnon, J.G. Critical values of cointegration tests. In Long-Run Economic Relationships: Readings in Cointegration, 1st ed.; Engle, R.E., Granger, C.W.J., Eds.; Oxford University Press: New York, NY, USA, 1991; pp. 267–276. [Google Scholar]
  21. Gujarati, D.N. Basic Econometrics, 4th ed.; McGraw-Hill: New York, NY, USA, 2008. [Google Scholar]
  22. Granger, C.W.J. Some properties of time series data and their use in econometrics. J. Econom. 1981, 16, 121–130. [Google Scholar] [CrossRef]
  23. Engle, R.F.; Granger, C.W.J. Co-integration and error correction models. J. Time Ser. Anal. 1987, 23, 509–522. [Google Scholar]
  24. Ramanathan, R. Introductory Econometrics with Applications, 5th ed.; South-Western Thomson Learning: Mason, OH, USA, 2002. [Google Scholar]
  25. Greene, W.H. Econometric Analysis, 6th ed.; Pearson Prentice Hall: Upper Saddle River, NJ, USA, 2008. [Google Scholar]
  26. Granger, C.W.J. Investigating Causal Relations by Econometric Models and Cross-spectral Methods. Econometrica 1969, 37, 424. [Google Scholar] [CrossRef]
  27. Maddala, G.S. Introduction to Econometrics, 3rd ed.; John Wiley & Sons: Chichester, England, 2001. [Google Scholar]
  28. The Polish Organisation of Oil Industry and Trade. Oil Industry and Trade. Annual Report 2020; The Polish Organisation of Oil Industry and Trade: Warsaw, Poland, 2021. [Google Scholar]
  29. Baek, E.; Brock, W. A General Test for Nonlinear Granger Causality: Bivariate Model. Working Paper; Iowa State University and University of Wisconsin-Madison: Madison, WI, USA, 1992. [Google Scholar]
  30. Hiemstra, C.; Jones, J. Testing for linear and nonlinear Granger causality in the stock price-volume relation. J. Financ. 1994, 49, 1639–1664. [Google Scholar]
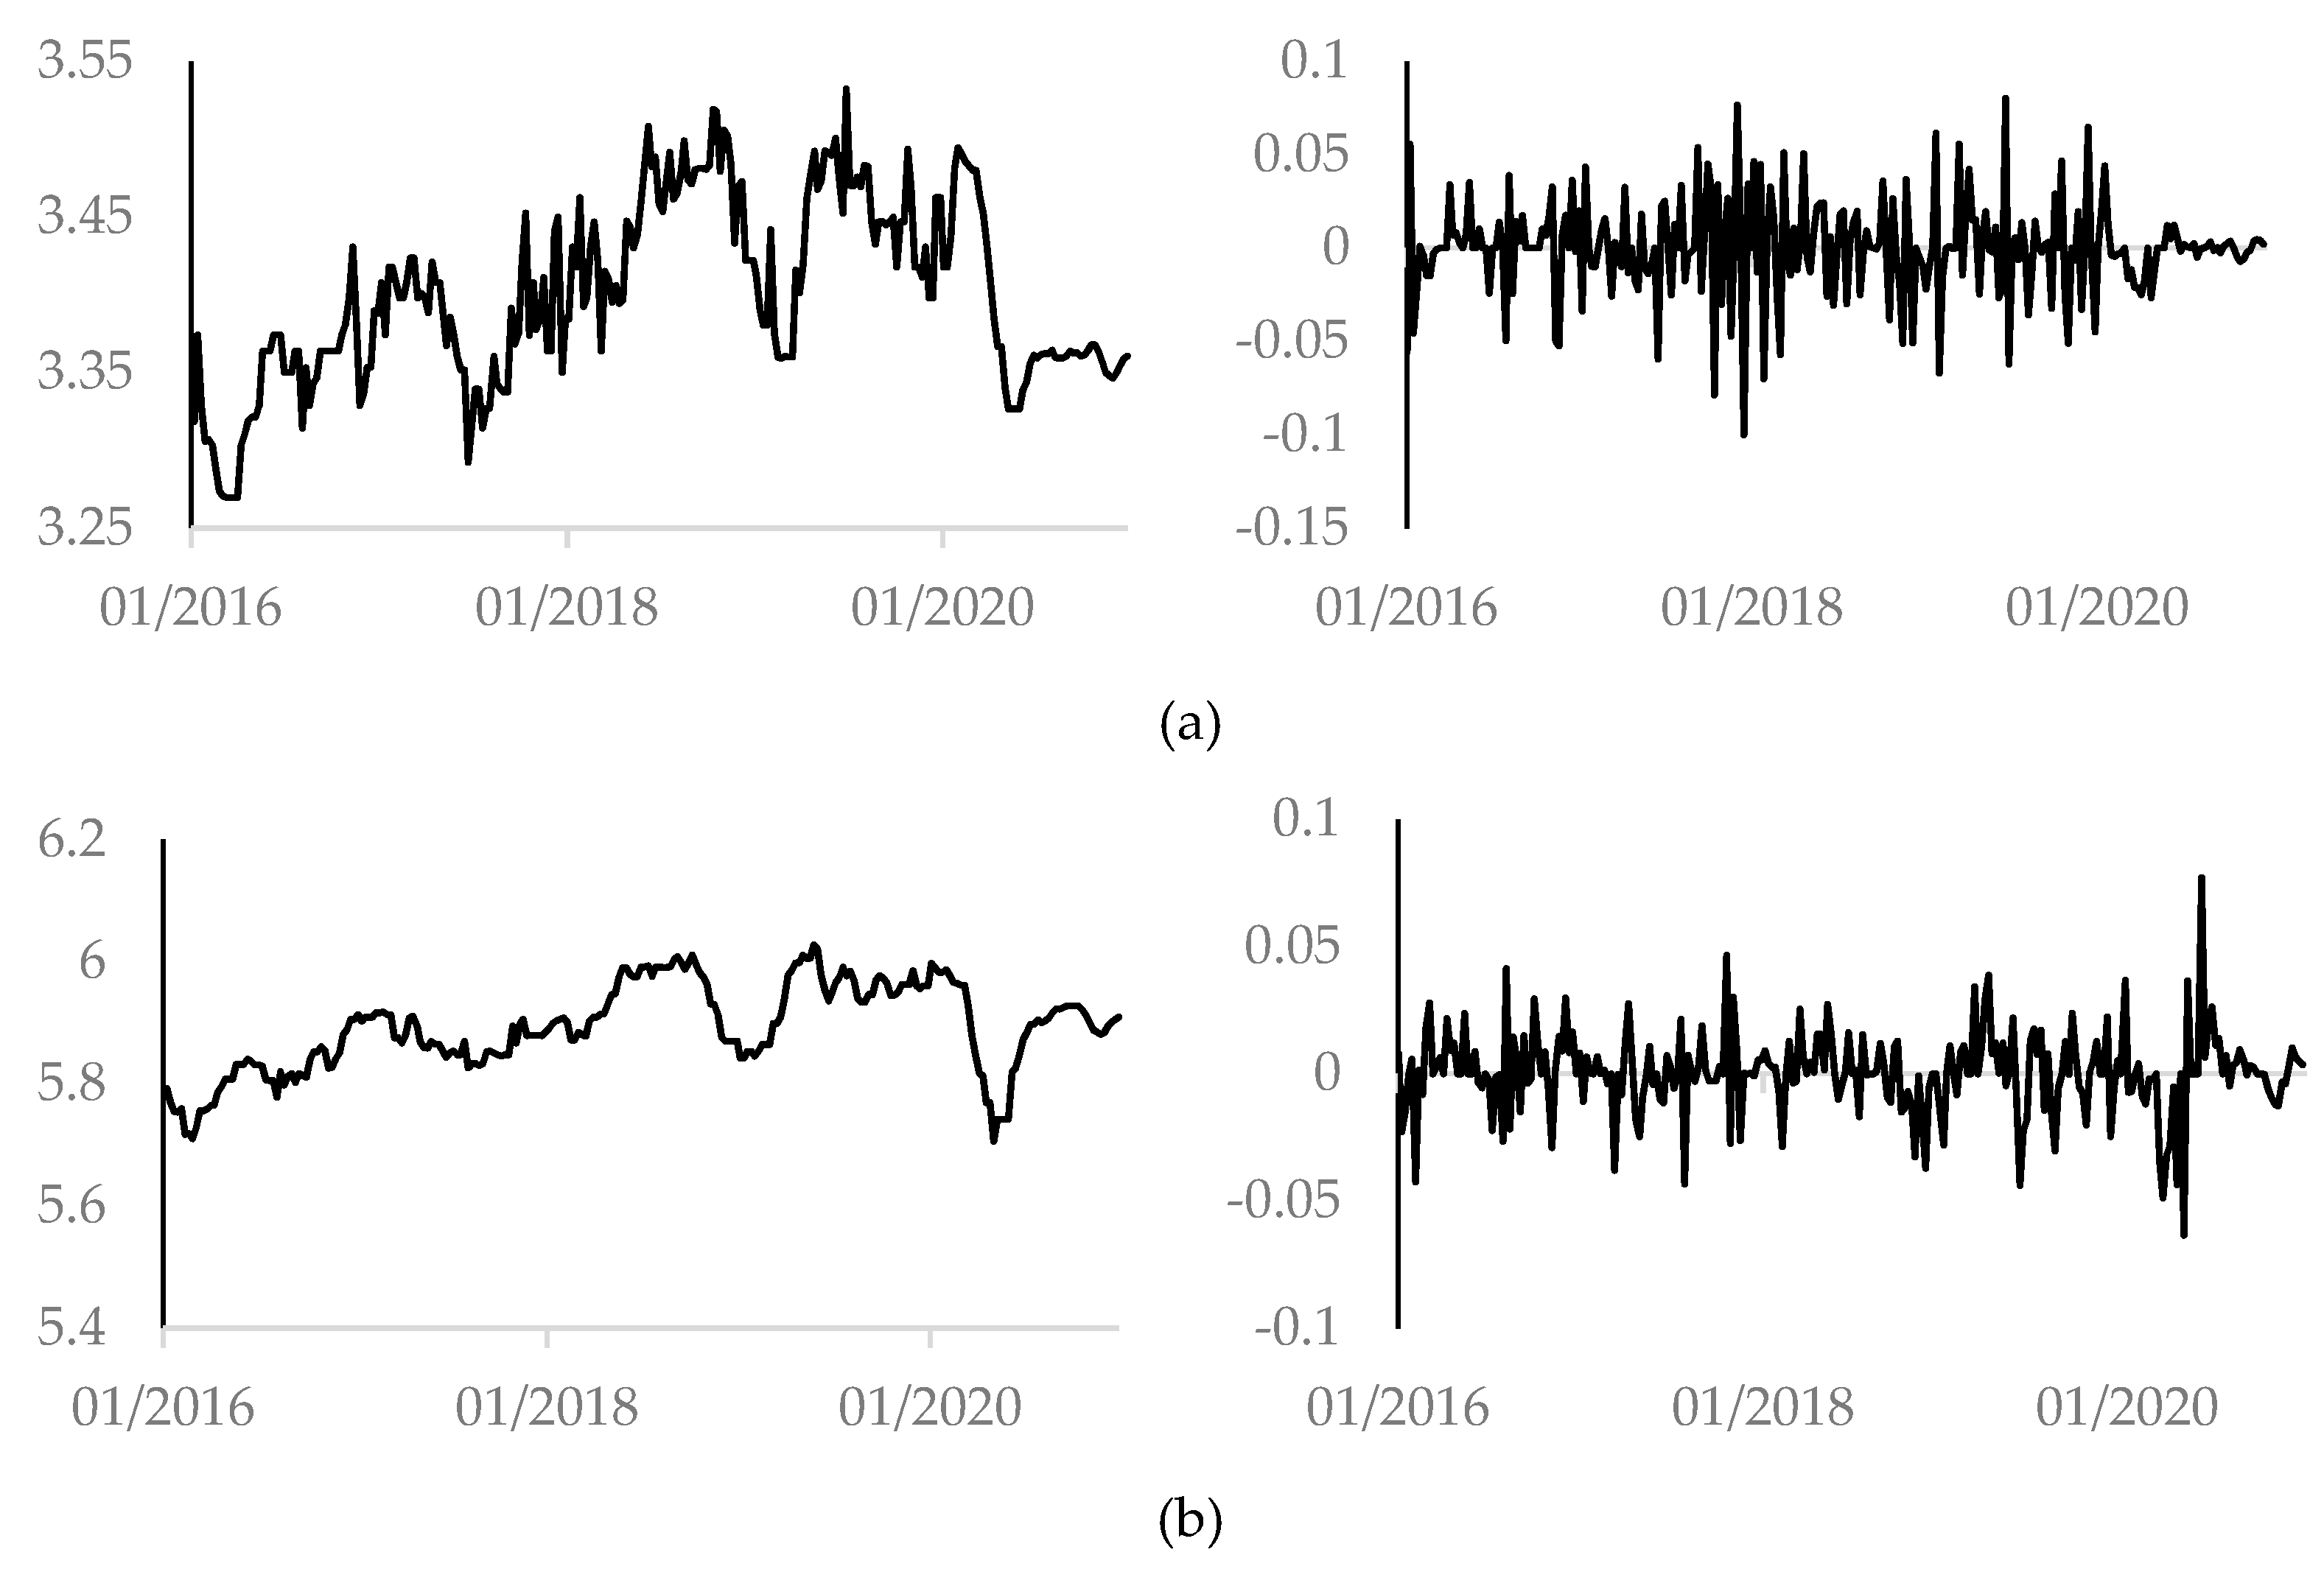
Figure 1. Pb95 gasoline logarithmic weekly prices (left panel) and returns (right panel) in the Czech Republic (a), Hungary (b), Poland (c) and Slovakia (d) from January 2016 through December 2020. Source: own elaboration.
Energies 14 06536 g001aEnergies 14 06536 g001b
Figure 2. Diesel logarithmic weekly prices (left panel) and returns (right panel) in the Czech Republic (a), Hungary (b), Poland (c) and Slovakia (d) from January 2016 through December 2020. Source: own elaboration.
Energies 14 06536 g002aEnergies 14 06536 g002b
Table 1. Summary statistics for Pb95 gasoline weekly log-returns.
CountryMeasure
MeanStd. Dev.Coeff. of Var.AssymetryKurtosisJB
Czech Rep.−0.0005190.025200485.400−0.234991.857239.607 *
Hungary0.0004790.01632834.063−0.114613.0632101.827 *
Poland0.0003510.01243234.912−0.6745310.04501108.560 *
Slovakia−0.0000660.018784284.600−1.079208.9212909.171 *
* rejection of the null hypothesis of normality at 0.05 level. Source: own calculation and elaboration.
Table 2. Summary statistics for diesel weekly log-returns.
CountryMeasure
MeanStd. Dev.Coeff. of Var.AssymetryKurtosisJB
Czech Rep.−0.0001630.033940208.010−0.048774.302499.859 *
Hungary0.0007630.01687422.117−0.308175.0614280.562 *
Poland0.0004560.01129824.785−0.035374.2141191.700 *
Slovakia0.0000390.017487450.6400.727641.36704070.42 *
* rejection of the null hypothesis of normality at 0.05 level. Source: own calculation and elaboration.
Table 3. Matrix of correlation coefficients between fuel log-returns.
VariablePb95Diesel
Czech Rep.HungaryPolandSlovakiaCzech Rep.HungaryPolandSlovakia
Pb95Czech Rep.1
Hungary0.159 *1
Poland0.0210.354 *1
Slovakia0.134 *0.256 *0.0661
DieselCzech Rep.0.137 *0.0600.0690.0071
Hungary0.0740.358 *0.262 *0.189 *0.0061
Poland0.0520.358 *0.724 *0.168 *0.135 *0.281 *1
Slovakia0.159 *0.216 *0.112 *0.506 *0.0340.109 *0.125 *1
* statistical significance at 0.05 level. Source: own calculation and elaboration.
Table 4. The ADF test results for fuel log-prices.
Country and Fuel TypeTau
(p-Value)
without Constantwith Constantwith Constant and Trend
Czech Rep.
Pb95
0.058
(0.701)
−2.284
(0.172)
−2.260
(0.455)
Hungary
Pb95
0.4213
(0.804)
−3.177
(0.021)
−3.309
(0.064)
Poland
Pb95
0.319
(0.778)
−3.152
(0.023)
−3.000
(0.321)
Slovakia
Pb95
−0.697
(0.414)
−2.036
(0.271)
−1.989
(0.604)
Czech Rep.
diesel
0.032
(0.693)
−2.295
(0.173)
−2.195
(0.491)
Hungary
diesel
0.698
(0.865)
−2.226
(0.198)
−2.246
(0.461)
Poland
diesel
0.414
(0.802)
−2.617
(0.089)
−2.366
(0.397)
Slovakia
diesel
−0.902
(0.324)
−1.602
(0.479)
−1.155
(0.916)
Source: own calculation and elaboration.
Table 5. The ADF test results for fuel log-returns.
Country and Fuel TypeTau
(p-Value)
without Constantwith Constantwith Constant and Trend
Czech Rep.
Pb95
−12.116
(3.874 × 10⁻²⁵)
−12.092
(5.23 × 10⁻²⁶)
−12.105
(6.762 × 10⁻²⁹)
Hungary
Pb95
−7.161
(6.935 × 10⁻¹²)
−7.163
(1.189 × 10⁻¹⁰)
−7.179
(7.413 × 10⁻¹⁰)
Poland
Pb95
−6.502
(2.975 × 10⁻¹⁰)
−6.506
(6.621 × 10⁻⁹)
−7.950
(2.849 × 10⁻¹²)
Slovakia
Pb95
−15.478
(4.952 × 10⁻³¹)
−15.447
(3.11 × 10⁻²⁷)
−15.445
(3.7 × 10⁻²⁸)
Czech Rep.
diesel
−27.324
(6.879 × 10⁻³⁴)
−27.270
(1.259 × 10⁻¹⁸)
−27.245
(2.85 × 10⁻²³)
Hungary
diesel
−16.180
(2.847 × 10⁻³²)
−16.182
(4.684 × 10⁻²⁸)
−16.179
(2.921 × 10⁻²⁹)
Poland
diesel
−6.907
(3.021 × 10⁻¹¹)
−6.917
(5.515 × 10⁻¹⁰)
−7.002
(2.445 × 10⁻⁹)
Slovakia
diesel
−16.080
(4.21 × 10⁻³²)
−16.045
(6.419 × 10⁻²⁸)
−16.185
(2.864 × 10⁻²⁹)
Source: own calculation and elaboration.
Table 6. The CRDW test results for Pb95 gasoline and diesel prices.
Independent VariableDependent VariabledIndependent VariableDependent Variabled
Czech Rep.
Pb95
Hungary Pb950.457 *Czech Rep.
diesel
Hungary diesel0.608 *
Poland Pb950.523 *Poland diesel0.930 *
Slovakia Pb950.455 *Slovakia diesel0.919 *
Hungary
Pb95
Czech Rep. Pb950.591 *Hungary
diesel
Czech Rep. diesel0.770 *
Poland Pb950.207Poland diesel0.325
Slovakia Pb950.140Slovakia diesel0.197
Poland
Pb95
Czech Rep. Pb950.681 *Poland
diesel
Czech Rep. diesel1.125 *
Hungary Pb950.231Hungary diesel0.357
Slovakia Pb 950.315Slovakia diesel0.259
Slovakia
Pb95
Czech Rep. Pb95 0.576 *Slovakia
diesel
Czech Rep. diesel1.092 *
Hungary Pb950.126Hungary diesel0.207
Poland Pb950.277Poland diesel0.237
* cointegration significant at 0.05 level. Source: own calculation and elaboration.
Table 7. Granger causality test results for Pb95 gasoline.
RelationshipLag LengthRelationshipLag Length
123123
Czech Rep.→Hungary0.4282.8511.697Poland→Czech Rep.13.076 *21.379 *20.857 *
Czech Rep.→Poland5.233 *1.5711.249Poland→Hungary60.774 *26.253 *16.528 *
Czech Rep.→Slovakia0.1923.810 *2.994 *Poland→Slovakia8.512 *6.068 *6.578 *
Hungary→Czech Rep.2.68210.513 *11.522 *Slovakia→Czech Rep.2.9622.0631.746
Hungary→Poland29.507 *9.418 *5.963 *Slovakia→Hungary0.6100.2790.207
Hungary→Slovakia0.4877.301 *5.338 *Slovakia→Poland10.706 *4.522 *3.355 *
* rejection of the null hypothesis at 0.05 level. Source: own calculation and elaboration.
Table 8. Granger causality test results for diesel.
RelationshipLag LengthRelationshipLag Length
123123
Czech Rep.→Hungary0.0451.4021.468Poland→Czech Rep.12.752 *11.487 *8.298 *
Czech Rep.→Poland0.1160.5240.220Poland→Hungary22.814 *13.692 *9797 *
Czech Rep.→Slovakia1.1063.258 *2.624Poland→Slovakia12.220 *10.638 *10.070 *
Hungary→Czech Rep.4.063 *3.0224.834 *Slovakia→Czech Rep.2.2434.264 *3.743 *
Hungary→Poland2.6961.3221.216Slovakia→Hungary0.5180.2730.477
Hungary→Slovakia3.0423.420 *4.056 *Slovakia→Poland1.6500.4770.970
* rejection of the null hypothesis at 0.05 level. Source: own calculation and elaboration.
Publisher’s Note: MDPI stays neutral with regard to jurisdictional claims in published maps and institutional affiliations.