1. Introduction
Electricity in the modern market economy is one of the basic factors guaranteeing the socio-economic development and quality of life of the society. It facilitates production, transport, trade, communication and is present in practically all spheres of human life. For the modern consumer, it is an essential element of life, facilitating its functioning in the economy and society, and creates appropriate conditions for work and rest.
Electricity itself is subject to market exchange, demanded by all consumers. In a free market economy, the consumer is an independent entity on the electricity market. On the Polish retail energy market, electricity consumers can be divided into two main groups:
Households, i.e., all customers buying energy for communal and living purposes.
Other consumers, who are not households, buy energy for the needs of their economic activity, i.e., National Railway, industrial plants, offices, hotels, shopping centres, institutions, etc. [
1].
Based on the data from the Energy Regulatory Office [
2],
Table 1 presents the structure of end users (in million units) of the retail energy market in Poland for 2015–2019. The presented data for various tariff groups show that the number of energy consumers has been systematically growing by an average of about 1% from year to year.
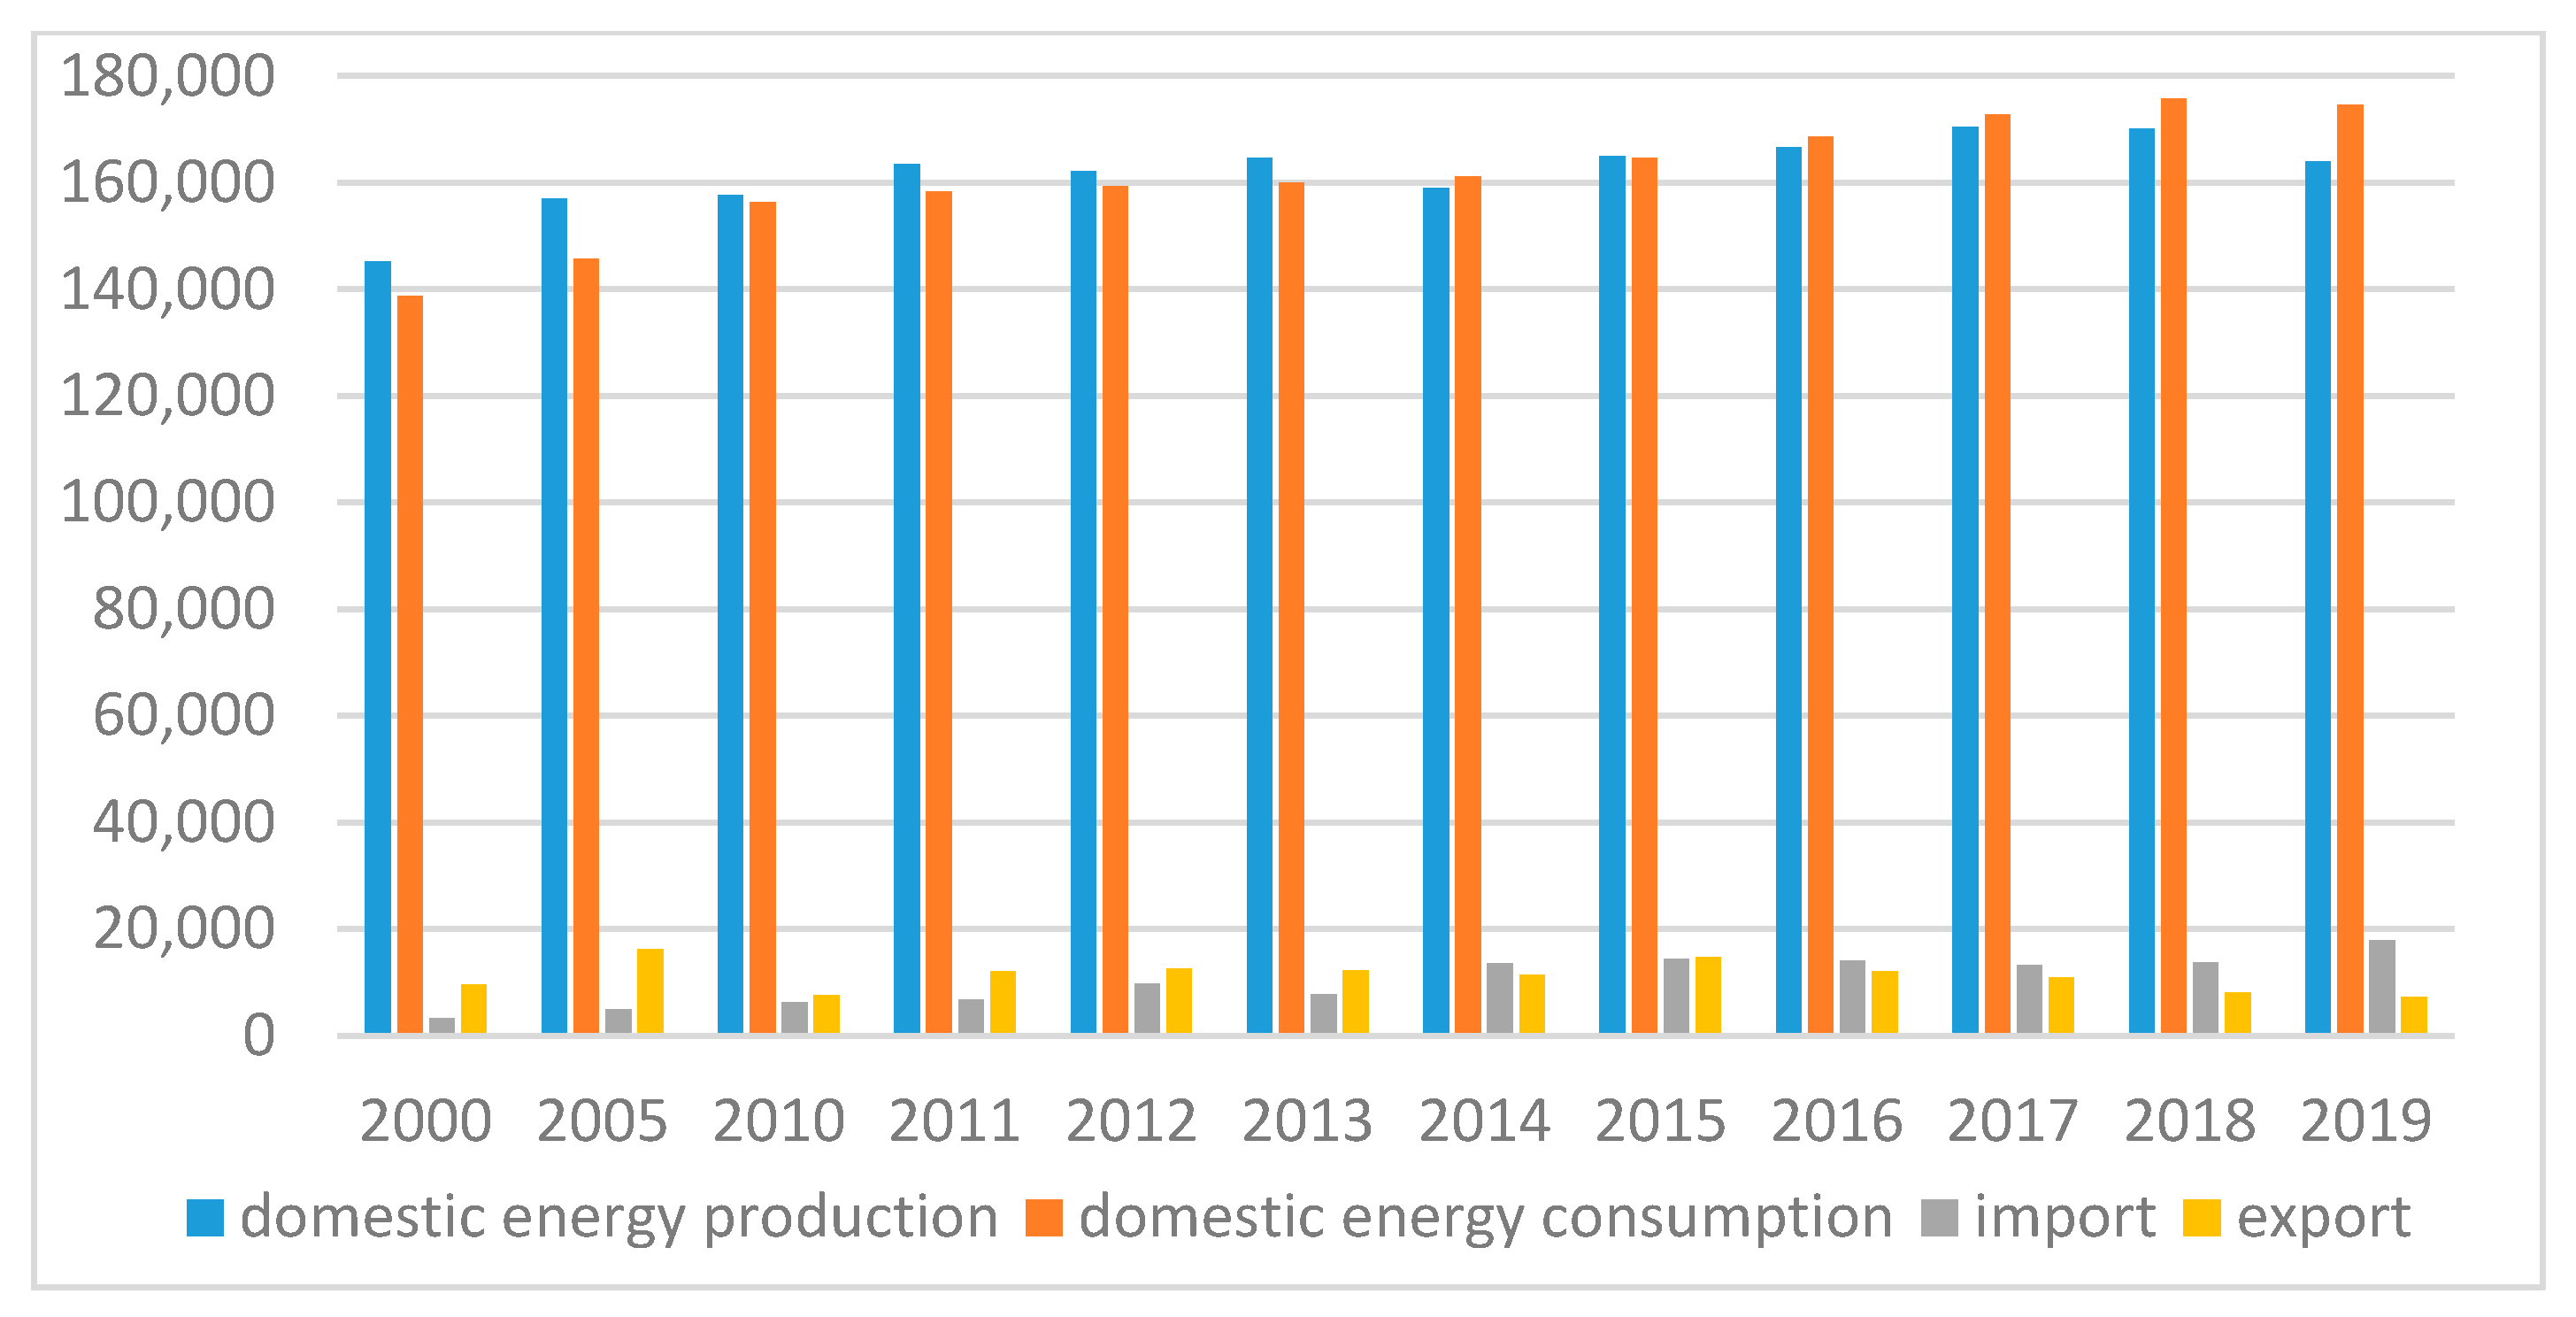
Since 2000, domestic electricity consumption has increased. Between 2000 and 2019, the increase in electricity supplies to end users was 34.5% (i.e., by approx. 34.65 TWh), but for the period 2015–2019 the increase in supplies was only 6.8% (i.e., approx. 8.64 TWh). Electricity supplies to households and small farms remained fairly stable in 2000–2019. However, their share in total deliveries systematically decreased from 25.66% in 2000 to 22.65% in 2019 (
Figure 1).
When analysing the data of Poland’s energy balance for the years 2000–2019 [
3], it can be seen that the peak of the volume of domestic electricity production was achieved in 2017 (approx. 165.9 TWh). In 2018–2019, there was a slow decline in production volume, which was the result of shutting down some generating units that did not meet EU emission standards. The effect of high consumption of electricity, not covered by domestic production, was an increase in its import. This is a permanent tendency, mainly due to the loss of competitiveness of the Polish offer on the open electricity market. Producing electricity from coal is simply expensive. Since 2014, Poland has increased the scale of energy imports, among others, thanks to the development of cross-border connections. In 2019, electricity consumption for the entire year was 174,612 GWh, i.e., less by 0.6% than in the previous year, with a total production of 163,989 GWh (a decrease by 3.6%). Imports covered the production shortage in the country. For 2019, the negative foreign exchange balance amounted to 10,623.7 GWh, i.e., more than in the previous year by 4906.0 GWh (
Figure 2).
In 2020, the COVID-19 pandemic had a significant impact on the functioning of the energy market in Poland. In the first period of the pandemic, the demand for electricity decreased. Energy production was the lowest in a decade at 157.7 TWh, and energy imports increased to 13.3 TWh, which accounted for about 7.8% of energy consumption. Moreover, for the first time ever, the share of energy from coal was less than 70%, i.e., it had dropped to around 65%. This was due to the construction of new gas-fired units and renewable sources (RES). In 2020, over 24% of capacity (28 TWh) was constituted by renewable energy sources, but the share of RES was still lower than the level meeting the EU obligations. The production of energy from photovoltaics grew the most dynamically thanks to the appropriate support systems, and in 2020, it was 3.5 times higher than in 2019 (
Figure 3) [
4].
In summary, the acceleration of RES development in Poland in 2020 was the result of both the commissioning of large-scale onshore solar and wind power plants and the rapidly growing number of so-called prosumers, i.e., conscious consumers involved in ecological energy production.
Renewable energy sources are becoming more and more popular in Europe. Scandinavian countries are the leaders in the European RES sector. For example, in Norway, as much as 97% of the national energy mix in 2021 is based on hydropower, and according to the announcements of government advisory institutes in Oslo, Norway has a chance to abandon fossil fuels by 2050. Sweden uses the potential of wind farms, hydropower plants, but also biomass. Already in 2015, it was reported that as much as 99% of Swedish waste is used for energy production. For comparison, in Poland this ratio is currently only about 6%. In 2019, Denmark declared that as much as 47% of the national mix was based on energy generated by windmills. In turn, Finland, increasing its investments in biogas, in 2020, achieved a 38.7% share of renewable energy in gross final energy consumption. Moreover, Finland, which had a great influence on the policy of the Baltic states, contributed to changes in the approach to the energy mix in Estonia and Latvia. Estonia already in 2019 could boast of a 30 percent share of renewable energy in gross final energy consumption (the 2020 target was 25%). In 2020, the Latvian national RES sector was third in terms of the share of renewable energy in the entire European Union with a result of 35.2%. The government in Riga based its energy policy on firewood, which facilitated the fight against GHG emissions, i.e., greenhouse gases. Ultimately, Latvia wants to base its energy policy on wind farms and is implementing investments in this direction. While the north of Europe is distinguished by dynamic investments in RES, other European countries are slightly behind in this respect [
5,
6]. In the case of Polish investments in RES, according to S. Jabłoński—President of the Management Board of Respect Energy, the domestic market must focus on an innovative approach to the sector and mobilization of the customers themselves. It is consumers who can most contribute to the development of the RES industry in Poland, and for them, green energy can become an integral part of life style [
7].
When considering the market choices of end consumers of electricity, it is reasonable to refer to selected areas of economic research. The theory of classical economics indicates that individuals make economic decisions on the basis of complete information and act rationally, i.e., they are guided by profit maximization (producers) and expected utility (consumers) maximization at given inputs [
8]. In turn, the most accepted contemporary definition of economics was formulated in 1932 by Lionel Ch. Robbins arguing that economics is a science that studies human behaviour as a relationship between goals and limited means that may have alternative applications [
9] (p. 16). The first part of this definition suggests the importance of studying human behaviour, and this element is emphasized by many contemporary researchers who define economics as a science [
10]. Additionally, it is worth mentioning that already Adam Smith, in the work The Theory of Moral Sentiments published in 1853, noted that man is often guided by higher feelings when it comes to the development of the community and its happiness [
11] (p. 126) as well as altruism and concern when one should take care of one’s own happiness, but also the happiness of the family or the country [
11] (p. 353). Hence, the core of economic theory must be the theory of human behaviour, because it is the species of homo sapiens that is the creator of the econosphere, i.e., the global economic system consisting of billions of people and organizations that multiply the achievements of humanity [
12] (p. 115).
Therefore, it can be assumed that the basic subject of economics as a scientific discipline is man and his behaviour related to broadly understood economic activities [
13]. Observations made in the field of behavioural economics disturbed two pillars on which the concept of homo œconomicus was based: self-interest and rational choice. Behavioural economics combined the theory of classical and neoclassical economics with psychological models of human behaviour verified experimentally, especially in the field of motivation research [
14].
The importance of behavioural economics in contemporary economic thought is confirmed by the winners of two Nobel Prizes. The first was awarded in 2002 to Daniel Kahneman [
15] and Vernon L. Smith [
16] in the fields of economic psychology and experimental economics, and the second in 2017 to Richard H. Thaler [
17,
18] for combining the analysis of the process of making economic decisions with psychological research. Thaler showed that people do not always act rationally, have problems with self-control, and the behaviour of individuals is influenced by social preferences [
19]. These theories are confirmed by, for example, consumer boycotts, which can also be treated as one of the manifestations of building a civil society. Their motivations are very different. An example of political motivation was the complete boycott of Japanese airlines in China in 2016, triggered by the dispute between Japan and China over access to the Senkaku islands, to oil fields. Ideological reasons in 2014 decided to boycott the Polish Ciech beer for homophobic statements of the brand owner. However, most often consumers are guided by ethical and ecological reasons, an example of which were: a very severe boycott of BP in 2010 in retaliation for the oil spill in the Gulf of Mexico, an effective boycott of Doritos in Poland in 2018, which resulted in the removal of palm oil from the composition of the company’s products, or forcing the Polish clothing concern LPP to suspend the sale of cashmere clothing in 2020 due to brutal practices in obtaining this raw material.
Thus, the consumer can consciously influence the prevention of ecosystem degradation and the improvement of the quality of social life through his choices, environmental empathy and ecological sensitivity. This also applies to the energy market, where the analysis of consumer behaviour and motivation in Poland was described in their works by, among others, Czarnecka M. [
20] emphasizing the role of consumer market education, Nagaj R. [
21] studying the cognitive distortions of energy end-users and Parzonko A.J., Balińska A., Sieczko A. [
22] analysing the pro-environmental behaviour of generation Z.
Quantitative electricity market research has a multidimensional aspect. In the literature, you can find many articles on forecasting the demand and prices of electricity or the production of renewable energy [
23]. Depending on the source of obtained energy, the forecasting of renewable energy market resources concerned: solar energy [
24,
25], wind energy [
26,
27,
28], marine and ocean energy [
29]. Currently, randomisation-based machine learning methods such as: Extreme learning Machines (ELM), Random Forrest (RF), Random Vector Functional Linc (RVFL), or Echo State Networks [ESN] are quite popular [
25]. The following are also used to forecast renewable energy consumption: the k-nearest neighbours algorithm [
30], and Artificial Neural Network (ANN) [
31].
The use of Autoregressive Integrated Moving Average (ARIMA) models to forecast energy consumption, including renewable energy, can be found in [
32]. The study took into account the consumption of coal, oil, gas and renewable energy along with the total energy consumption in 1970–2015. The research results indicated that energy consumption will increase until 2040, including the consumption of coal, oil, natural gas, renewable energy and total energy will grow at an average annual rate of 4.87%, 3.92%, 4.39%, 1.64% and 4.20% in the next 25 years. Another study taking into account, among others, ARIMA models in electricity market forecasting are [
33]. It confirmed that the transformation and standardization of the original series allows the use of ARIMA models and on their basis better forecasts were built than with the use of other algorithms, especially in long-term forecasts.
When forecasting the hourly average wind speed at two observation sites in North Dakota, three types of ANN were used in [
34]: adaptive linear element, backpropagation and radial basis function. In turn, in [
35] the Generalized Regression Neural Network (GRNN) was used for long-term forecasting of electricity consumption.
Model Seasonal Autoregressive Integrated Moving Average (SARIMA) and the non-linear autoregressive neural network (NARNET) were used to predict energy consumption based on historical data from the Mato Grosso Federal University [
36]. A similar method of forecasting energy consumption can also be found in [
37], where the ARIMA and ANN model were used. The ARIMA multiplicative seasonal model and the double seasonal Holt–Winters method were used in online electricity demand prediction for execution times from half an hour ahead to the next day at work [
38]. The predictions made by the new Holt–Winters dual seasonal method surpass those of the traditional Holt–Winters method and the well-defined multiplicative double-season ARIMA model. An innovative approach to forecasting energy consumption was applied in [
39], where the combined Bootstrap aggregation methods (Bagging) were used. In turn, in [
40] energy consumption projections for two real university buildings from Ecuador and Spain were built. Smoothing methods, simple and multiple regressions and ARIMA models were used. The results of the conducted analyses showed that the forecasts by the Holt–Winters and ARIMA methods have the best accuracy of electricity demand.
The literature review presented in this part of the work allows only to notice a wide spectrum of possibilities of forecasting electricity consumption. A comprehensive review of electricity price forecasting methods is included in [
41]. A literature review providing methodology’s verification of the acceptability assessment of the constructed energy consumption forecasts can be found in the works of Fabricio [
42] and Lampaga [
43]. Indications of the acceptability of the forecasts can be found in reports [
44,
45,
46].
For the highly effective functioning of the energy market, an information resource about electricity as a commodity is indispensable. As already mentioned, the behaviour and motives of end users in terms of energy consumption, including renewable energy, are difficult to predict due to the complexity and unnecessary rationality of the decision-making process. It is, however, possible to forecast the results of these behaviours, i.e., energy consumption. The main goal of the work is to examine the prospects for a greater share of renewable energy sources in obtaining energy in Poland based on the analysis of attitudes and opinions of consumers on the retail energy market, legal regulations and the energy balance. The research objective was a retrospective literature study on consumer energy behaviour and attitudes in Poland, along with a description of the internal conditions of the consumer energy market. The second aim was to assess the forecasting capabilities of popular machine learning models including neuron networks together with the XGBost and SARIMA model. The models used can be a certain alternative to the energy forecasting methods used so far. Forecasts for daily, weekly, monthly and quarterly energy consumption were built, along with the prediction of the share of RES, based on selected adaptive algorithms, machine learning and deep learning. The time series study uses the data of daily electricity consumption for 2015–2021 obtained from the cire.pl website based on ENTSO-E (European Network of Transmission System Operators for Electricity).
2. Materials and Methods
End consumers on the electricity market are in a compulsive and ambiguous situation for themselves. Continuous technological progress causes that consumers, on the one hand, use more and more devices that draw electricity. However, on the other hand, the growing ecological trends cause them to evolve their behaviour and shift from self-consumption to eco-consumption [
47].
Eco-consumption is strongly supported by the European Union and in accordance with Directive 2009/28/EC of the European Parliament and of the Council of 23 April 2009 on the promotion of the use of energy from renewable sources, Member States were required to ensure a certain share of energy from renewable sources in gross final energy consumption in 2020. The mandatory national overall targets consisted of an assumed 20% share of renewable energy in gross final energy consumption in the Community. For Poland, this target was set at 15% and it is initially known that this ceiling has not been reached. The national share of RES in gross final energy consumption consists of energy consumption in electricity, heating and transport. According to experts, preliminary forecasts suggest that this share for Poland will approach 14% in 2020 and achieve the 15% target in 2021. Percentage changes in the share of energy from renewable sources in gross final energy consumption in Poland in 2010–2019, according to Statistics Poland and Eurostat data, are presented in
Figure 4.
The next strategic goals of changes in energy consumption were adopted by the European Council on 24 October 2014 as part of the Community’s climate and energy policy until 2030 (revised in December 2018). It was established for the Member States to increase the share of energy from renewable sources in gross final energy consumption to at least 32% and to increase energy efficiency by at least 32.5%. According to the
Appendix to the resolution no. 22/2021 of the Council of Ministers of 2 February 2021 Poland’s Energy Policy until 2040 [
Appendix A] [
48]—taking into account the national potential of renewable resources, competitiveness of RES technology, technical possibilities of their work in National Energy System, as well as the challenges related to the development of RES in transport and heating, Poland declares to achieve a 23% share of RES in gross final energy consumption in 2030 (measured as total consumption in electricity, heating and cooling and for transport purposes) as part of the participation in the implementation of the EU-wide target for 2030. However, in the 2040 perspective, the share of RES is estimated at least at 28.5%.
In publications analysing the behaviour and motivations of consumers on the energy market, a growing pro-environmental and ecological awareness can be noticed. In this article, the results of household surveys in Ireland, Switzerland, Japan, Australia and Poland were used to analyze changes in attitudes of energy consumers. Researchers, D. Clancy, D. O’Loughlin [
49] in Ireland, S. L. Hille [
50] in Switzerland and E. Nakamura [
51] in Japan, analyzed personality traits and behavioral determinants related to energy savings, while the discrepancy between the knowledge, values, intentions declared by energy consumers with their observable changes in behavior was investigated by E. R. Frederiks, K. Stenner and E.V. Hobman [
52] in Australia. Last but not least, the analysis of cognitive distortion level of consumers in the electricity market in Poland was carried out by Nagaj R. [
53].
Answers to the question whether there is an ecological revolution in the thinking about the energy market in Polish society were given by the results of the IPSOS poll for oko.press conducted on 26–29 August 2019 using the CATI (Computer-Assisted Telephone Interviewing) method on a nationwide representative sample of 1006 people [
54]. Distribution of answers to the question asked: “If you were to decide in which
2 main sources of energy Poland should invest and improve them, what would you indicate?” is shown in
Figure 5:
The indicated preferences (
Figure 5) prove very favourable opinions of Polish consumers on investments in renewable energy sources (RES) and a high awareness of the need for the country’s energy transformation towards RES. There was a marked difference in the assessment of nuclear energy, the development of which was accepted by more than twice as many men as women. Such decisions are associated with a lower propensity to take risks in women.
On the other hand, responses to the question about identifying two investment preferred energy sources for Poland, analysed according to the age of the respondents, clearly suggest greater ecological and pro-social awareness among young people. In the 18–29 age group, the advantage of RES and nuclear energy is nearly three times greater than that of coal and gas that pollute the environment. In generations of 30–39 years, 40–49 years and 50–59 years, this advantage is slightly more than two times, and in the case of the oldest respondents it is 1.8 (
Figure 6). It is positive that all respondents, regardless of gender and age, point to the reduction of coal in the Polish energy economy.
The analytical and prognostic part of this study was performed on the basis of ENTSO-E data collected from the cire.pl website. This data represents a time series of aggregated daily electricity consumption expressed in Gigawatt hours (Gwh). The range of the data covers the dates from 31 December 2014 to 30 June 2021 (
Figure 7).
Two time points with missing data were observed in the set. To complete the series, an imputation method was used based on linear interpolation for data with seasonality, which was implemented in the forecast::na.interp function in the R package [
55]. In turn, for the models requiring the frequency determination, the value 7 was adopted, obtained from calling the forecast::findfrequency function [
55].
Data analysis consisted of two elements. As part of the initial data analysis, the data were broken down into monthly parts and basic descriptive statistics (mean, standard deviation, coefficient of variation) were calculated. The study focused not only on the forecast of electricity consumption in Poland, but also on the assessment of the accuracy of such forecasts. The primary consideration was the selection of the models to be used for these forecasting efforts. On the basis of the conducted literature research (see Introduction) and own preliminary calculations and simulations, 5 models were finally selected and then subjected to a broader analysis described in this paper. At this stage, we used: XGBoost [
56], SARIMA model with automatic model selection based on the stepwise selection of model hyperparameters [
57], the adaptive exponential smoothing model Smoothing State Space Model (ETS) with automatic selection of smoothing and error parameters, trend and seasonality [
58] and models using artificial neural networks: General Regression Neural Network (GRNN) [
59,
60], Neural Network Time Series Forecasts (NNETAR) [
55]. Neural networks were used as computational models for the machine learning model, XGBoost and the time series, SARIMA model. It is worth noting that application of some modern models (especially XGBoost) in this context can be seen as partially experimental. The nature of this experimental approach makes the discussion of the obtained model structures not as obvious as in the case of the SARIMA model, e.g., typically, machine learning models were based on decision trees and neural networks. A description of the models used can be found below.
XGBoost is an advanced machine learning method based on gradient boosting. In the settings of this model our choice is “gblinear” booster, which means a linear function model estimation for each weak learner. The final score consists of the weighted scores of the weak learners. The algorithm iteratively fits the regression models based on the given predictors until the optimum is achieved.
In the presented analysis, the model predictors were delayed daily values of electricity consumption. The model was built on delays not older than 3 years. The MAE error was chosen as the optimization criterion in the iterative improvement of the fit of the regression model.
The ETS function, in turn, creates a model belonging to the class of exponential smoothing models. They are identified by a triple: error type, trend type, seasonality type. In the case of the analysis, the ETS model selected was the Additive, Additive Damped and Additive model in each scenario.
The GRNN is a single-pass neural network which uses a Gaussian activation function in the hidden layer [
60]. It consists of input, hidden, summation, and division layers. The NNETAR is a feed-forward neural networks with a single hidden layer and lagged inputs for forecasting univariate time series. In presented analysis the average of 20 networks was performed.
The daily energy consumption forecast was carried out in the following three scenarios (
Table 2).
In order to determine the quality of forecasts of daily energy consumption, the relative ex-post error, MAPE, MPE, MAE, MSE, RMSE indicators were calculated on the validation data. In the case of quarterly, monthly and weekly forecasts, using the sum of quarterly, monthly of weekly forecasts, the relative ex-post error determined on the validation set was used. Additionally, quarterly, monthly and weekly forecasts of energy consumption covered by the 20% and 32% share of renewable energy are also provided (these scenarios are recommended by the European Council).
3. Forecasting Results
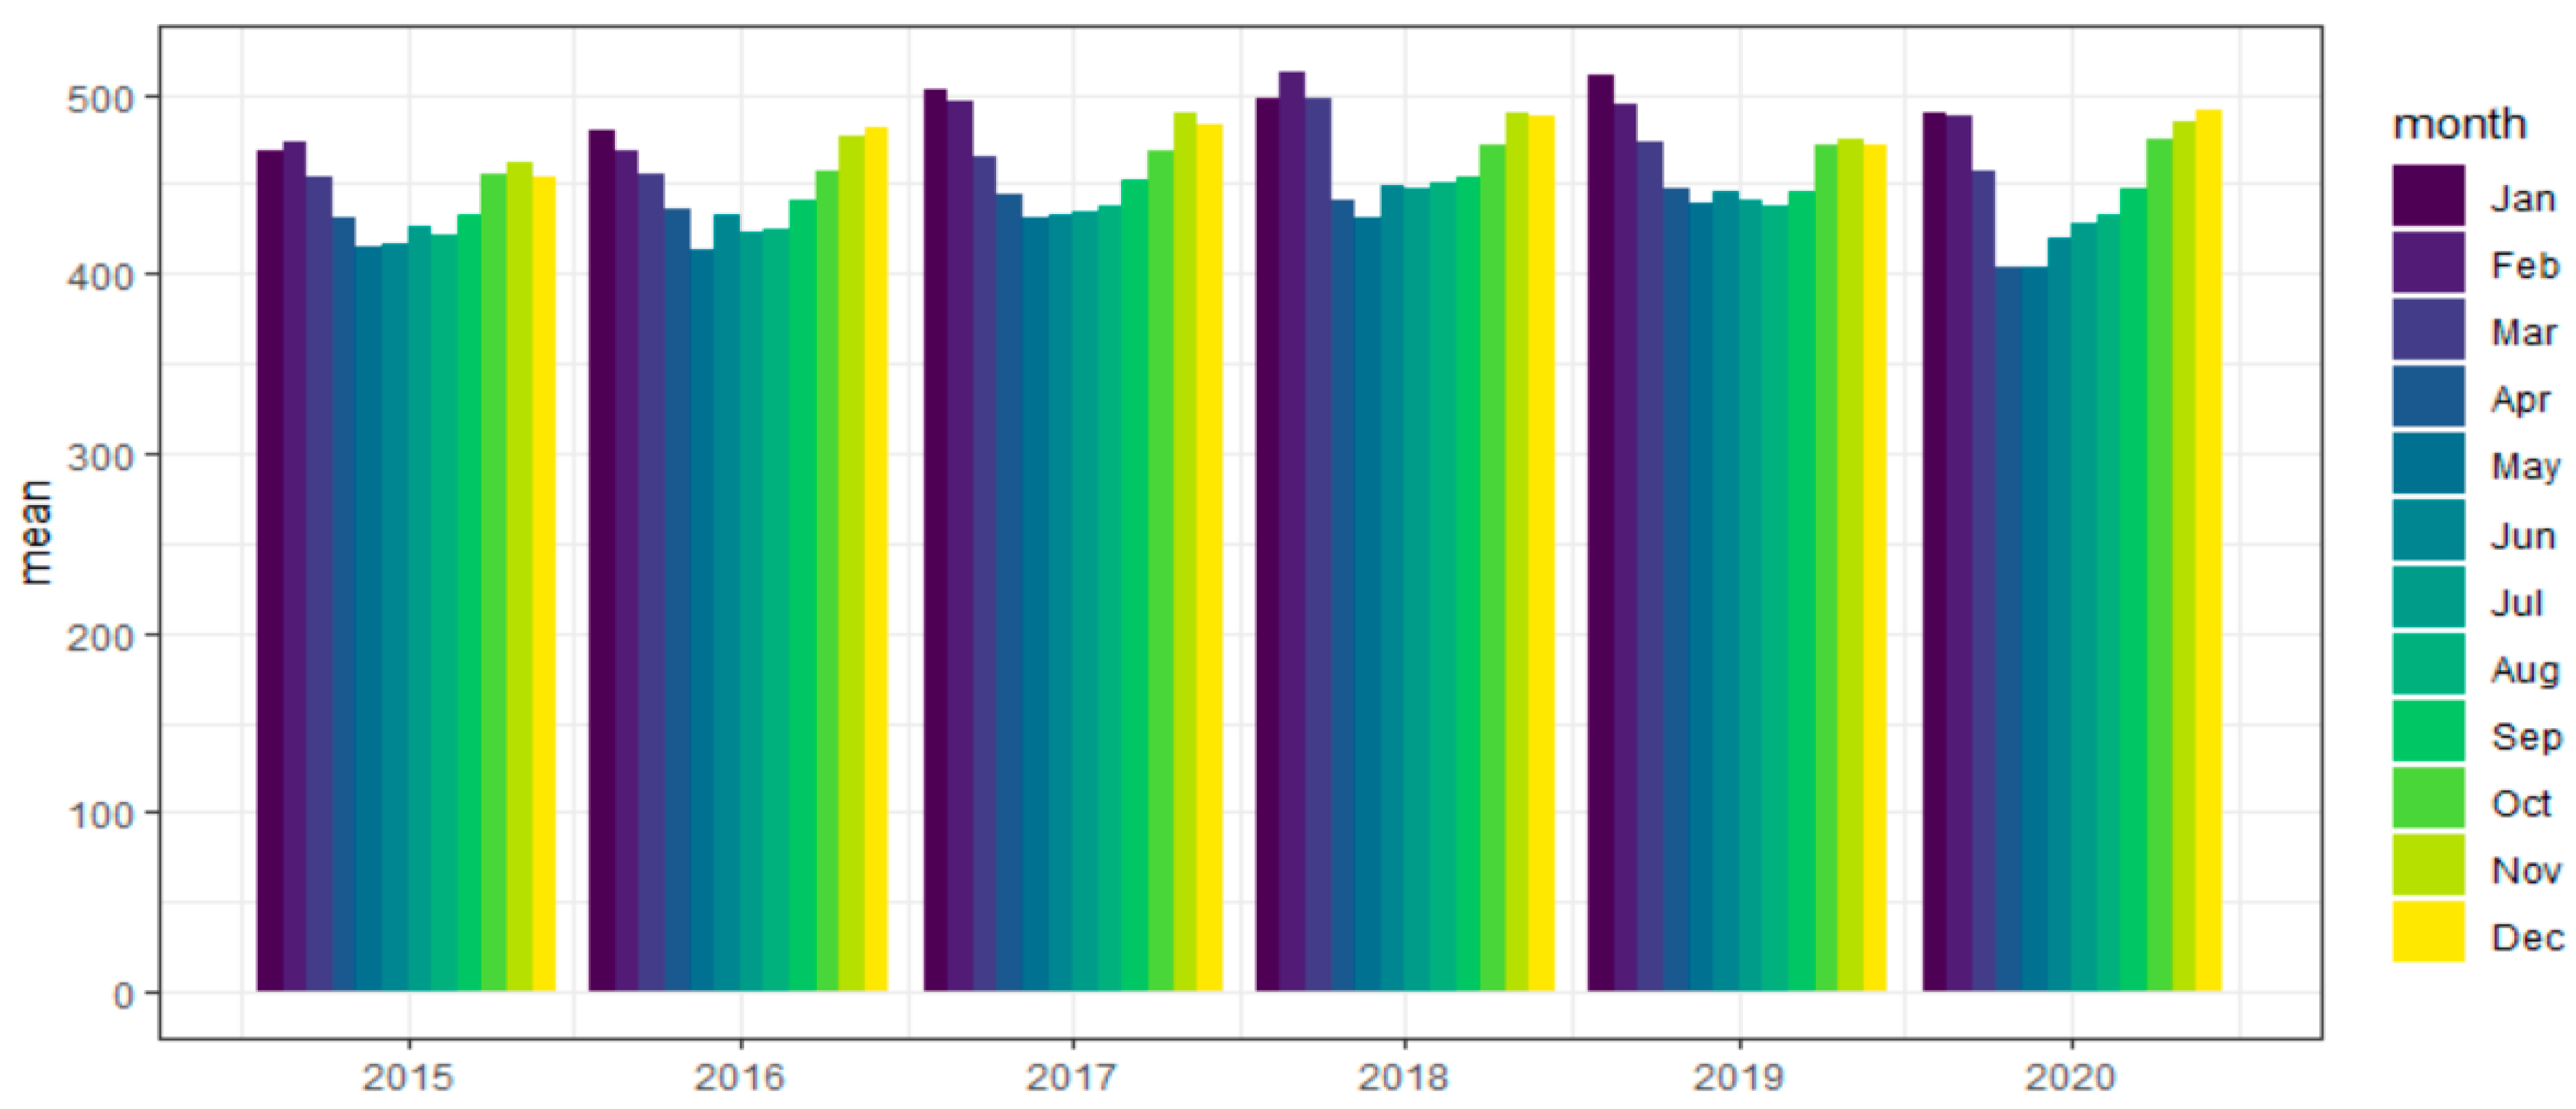
When analysing the values of descriptive statistics (
Figure 8), it can be seen that the highest daily consumption in each surveyed year was recorded in the winter months. January is usually the month with the highest consumption. In 2018, February was the month with the highest energy consumption, exceptionally. Among the remaining monthly averages, the average consumption for April and May 2020 are the lowest. The reduced energy consumption in these months can be associated with the introduction of restrictions on the operation of certain sectors of the economy during the first wave of the COVID-19 pandemic.
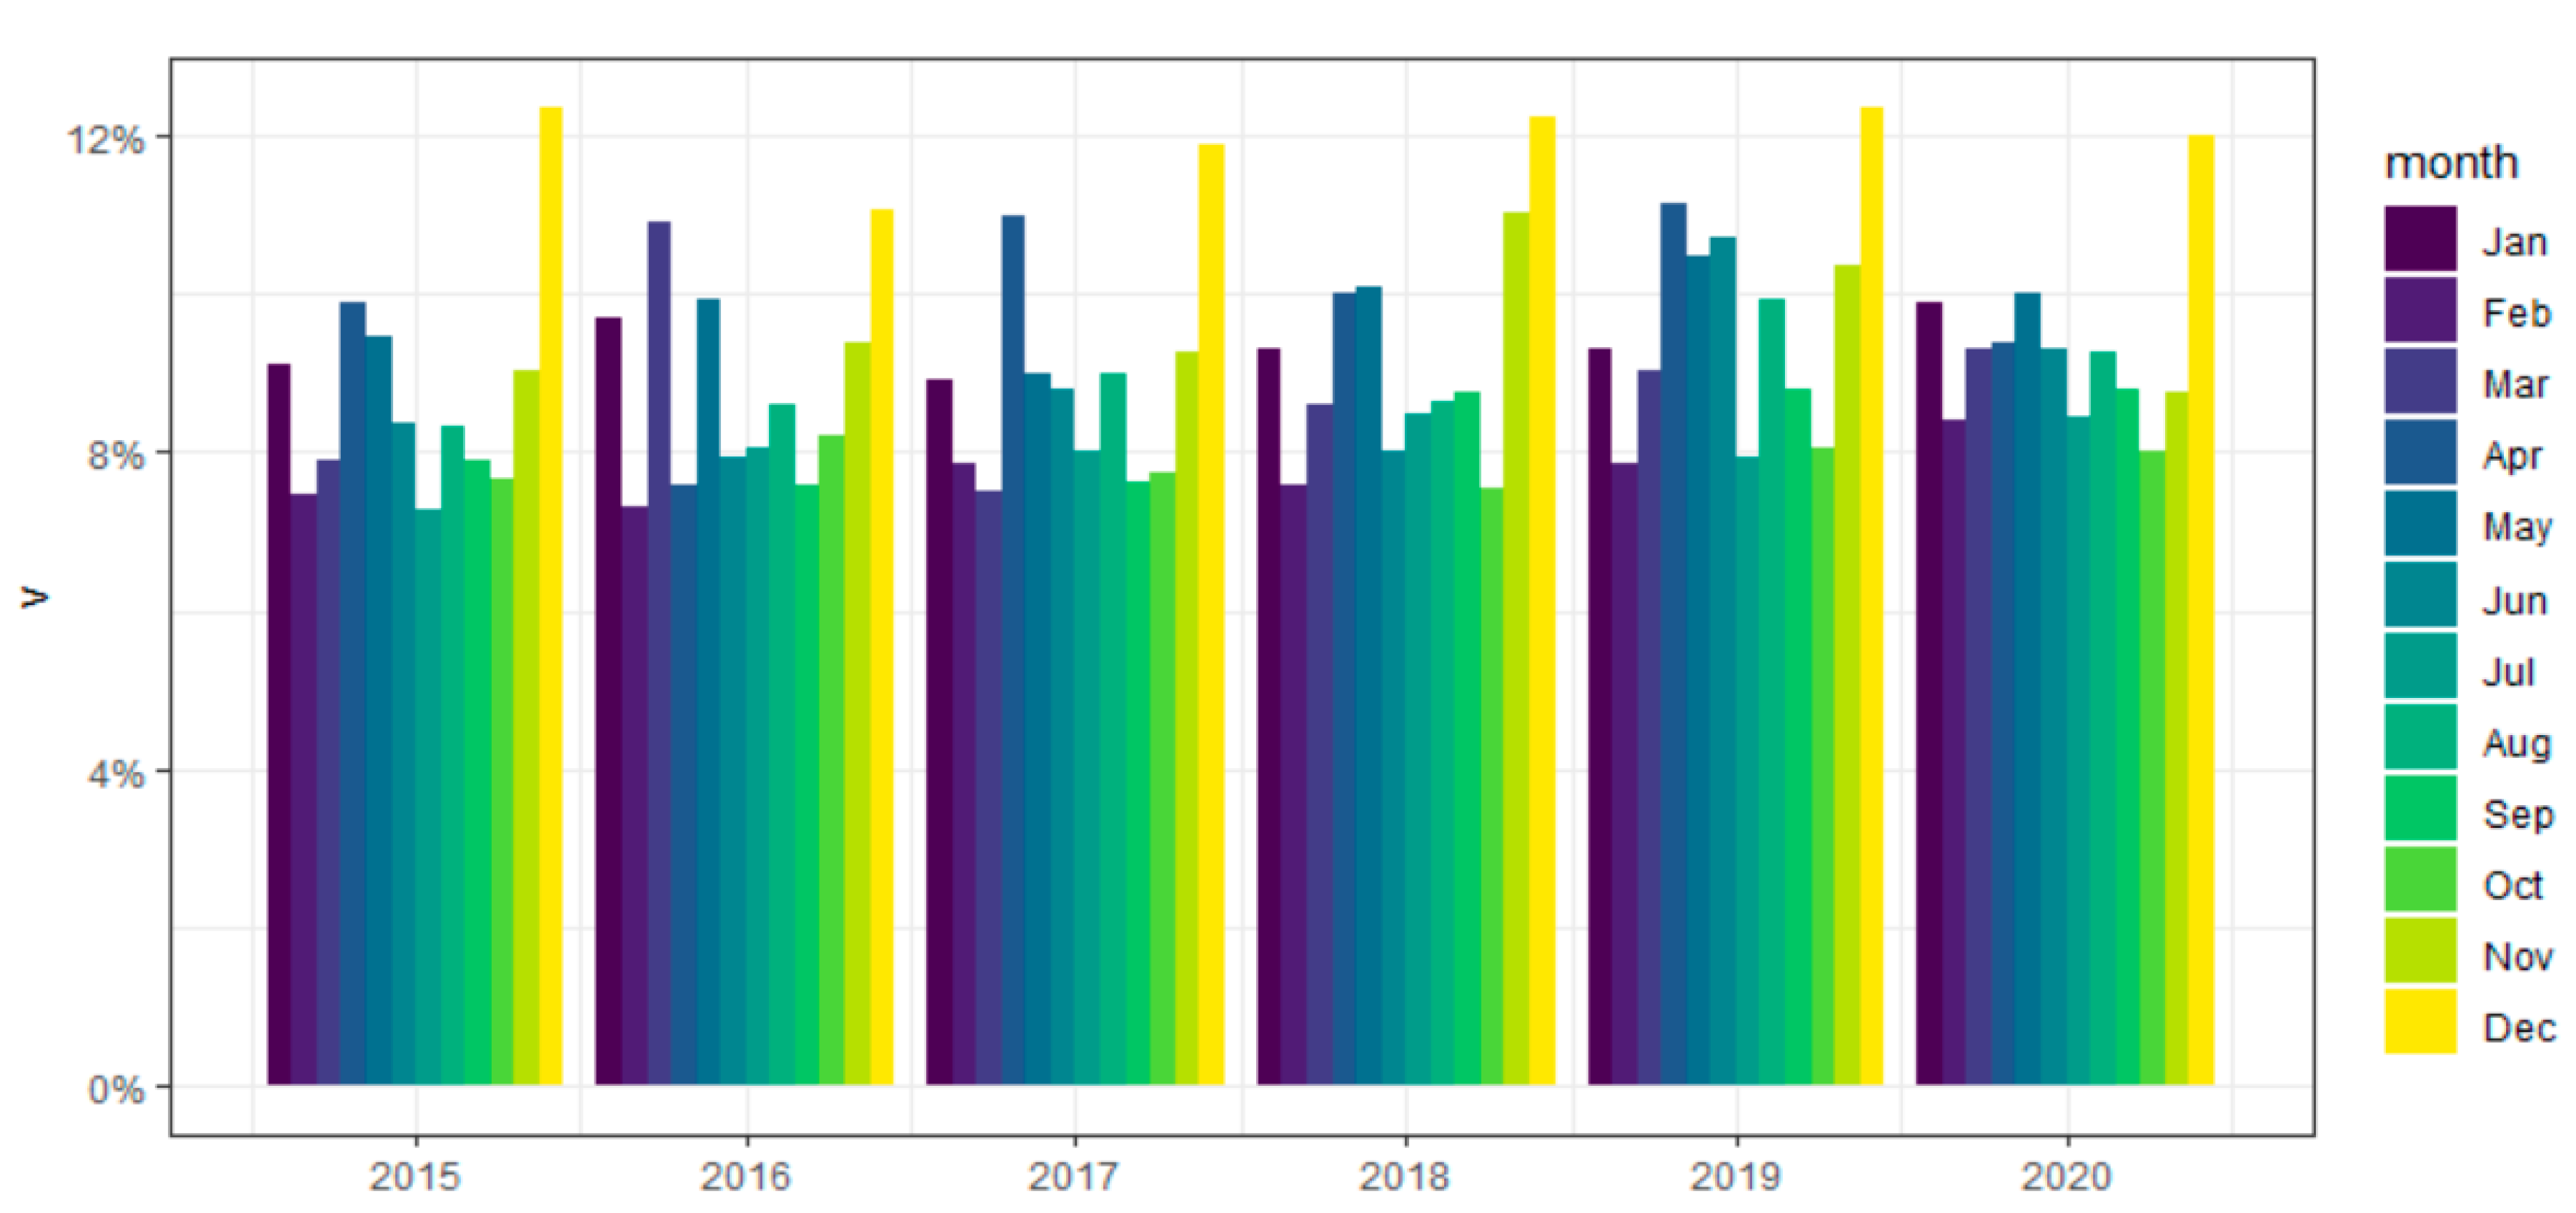
The within-month variation in daily energy consumption in 2015–2020 was not constant throughout the year (
Figure 9 and
Figure 10). It can be observed that in each of the analysed years, the greatest differentiation was observed in the last month.
Figure 11,
Figure 12 and
Figure 13 presents actual data and forecasts of daily energy consumption in Poland. In addition, the boxplots of the relative errors of forecasts for individual methods for the quarterly (Q), monthly (M) and weekly (W) horizon of the daily energy consumption forecast in Poland are presented. The
Appendix contains
Table A1,
Table A2 and
Table A3 with the obtained results of the error measures of the forecasts obtained (MAPE, MPE, MAE, MSE, RMSE).
In the case of the quarterly horizon, the lowest MAPE error values were obtained for the ETS and XGBoost forecasts. They were equal to 4.61% and 6.19%, respectively. Slightly worse results were obtained for the SARIMA model (MAPE = 6.36%). Additionally, observing the error boxplots, it can be noticed that these three methods are the most stable and are characterized by the lowest bias (which is also indicated by the MPE (
Table A1) values, not exceeding 6% in terms of the modulus). In the quarterly scenario, the forecasts of daily energy consumption obtained with the XGBoost algorithm are generally underestimated. In turn, the forecasts built with the help of ETS and SARIMA slightly overestimate the real value of daily energy consumption.
In the case of the monthly horizon, the forecasts based on the SARIMA and ETS models are the most accurate (MAPE = 4.92% and MAPE = 5.2%). The predictions obtained from these models are the most stable (p.
Figure 11,
Figure 12 and
Figure 13). However, it is worth noting that these forecasts slightly lower the actual value of daily energy consumption. They are also much less biased than those in the quarterly scenario—MPE does not exceed the value of 3% in terms of the module.
For the weekly horizon, the best forecasts were obtained using the NNETAR (MAPE = 1.25%), GRNN (MAPE = 1.32%) and SARIMA (MAPE = 1.96%) models. The most stable forecasts (the smallest spread of forecast error) was built using the NNETAR model. Nevertheless, the forecasts for energy consumption were somewhat overestimated.
Among the models used in the study, the SARIMA model has the greatest possible interpretation. In SARIMA approach the same model class in all scenario train data: SARIMA (5,0,0)(2,1,0)
7 has been obtained. The values of estimated hyperparameters are collected in
Table 3.
The form SARIMA (5,0,0)(2,1,0)7 indicates that the model includes, among others, weekly differences delayed by 5 consecutive periods, i.e., 5 consecutive delays of differences from one week before and the next week. Additionally, it can be noticed that the obtained form of the models is very stable. Parameter estimates have very similar values, regardless of the scenario under consideration.
Another element of the analysis was the assessment of the possibility of forecasting cumulative energy consumption. To this end,
Table 4 and
Table 5 provide a forecast for the cumulative quarterly (Q), monthly (M) and weekly (W) consumption together with the relative forecast errors. In the case of the quarterly forecast, the smallest relative error was obtained for ETS −2.76% (overestimated forecasts) and 2.83% for XGBoost (underestimated forecasts). For the monthly forecast, the best forecasts were obtained from SARIMA-error 1.73% (underestimated forecasts) and XGBoost −1.76% (overestimated forecasts). For the weekly forecast, the best forecasts are obtained from the GRNN model −0.33% (slightly overestimated forecasts) and XGBoost—error 0.85% (slightly underestimated forecasts) and NNETAR—error 0.96% (slightly underestimated forecasts).
Additionally,
Table 6 and
Table 7 provide a 20% and 32% forecast of quarterly, monthly and weekly demand from renewable energy sources. The percentages are in line with the requirements of achieving the RES targets for 2020 and 2030, respectively, set by the European Commission for the Community countries.
The presented values (
Table 6 and
Table 7) are suggestions of levels that to some extent meet the EU obligations for 2020 and 2030 in the field of electricity, because they do not constitute the full value of gross final energy consumption, which additionally includes consumption in heating and cooling, as well as for transport.
The obtained forecasts of the RES consumption are chosen from models with the lowest relative error. In the first scenario (assuming 20% energy), forecasts of 8454 GWh for the ETS models were obtained-quarter data, 2683 GWh for the SARIMA model-monthly data and 658 GWh for the GRNN model-weekly data. In the second scenario (assuming 32% energy), the forecasts of 13,527 GWh were obtained for the ETS models-quarterly data, 4293 GWh for the SARIMA model-monthly data and 1052 GWh for the GRNN model-weekly data.
4. Discussion
It should be noted that all changes made in recent years in the regulatory policy with regard to the energy sector in Poland are largely determined by the energy policy of the European Union and the adopted directives. In addition, the need to care for the natural environment and the wider use of renewable energy sources play an increasingly important role in decisions taken by energy companies. Although the so-called
distance act (introduced, among others, the obligation to erect new turbines only on the basis of local plans and the minimum distance of the device from residential buildings of at least 10 times its total height) severely limited the development of onshore wind farms, but subsequent editions of the government support program “Mój Prąd” (My Electricity), launched in July 2019 (with the planned implementation by 2025), contributed to the boom in photovoltaics and a strong increase in electricity production from solar panels. As already mentioned, in 2020, it was 3.5 times higher than in 2019. Poland joined the global European trend here, because according to SolarPower Europe, at the end of 2020 in 27 EU Member States the installed capacity in photovoltaics amounted to 137.2 GW. In just 12 months, almost 19 GW of capacity was added and it was the best annual result since 2011 (increase by 11%) [
61]. Undoubtedly, a strong motivation of Polish prosumers generating electricity in home photovoltaic micro-installations is the favourable barter settlement with the energy supplier. The possibility of using 80% of the electricity fed into the grid has encouraged hundreds of thousands of people to install PV installations. However, the Polish government is not entirely consistent in promoting RES, because the Ministry of Climate and Environment wants to abolish this system of deductions from January 1, 2022, which may discourage final energy consumers from investing in solar panels. Meanwhile, the Ministry of Development, Labour and Technology has prepared an amendment to the
Distance Act (planned for implementation at the end of November 2021), which will be of great importance for the development of onshore wind energy, in response to the need to achieve the RES targets set by the European Commission. The act is to bring a significant impulse to the development of the RES industry in Poland and, with the appropriate scale of modern investments, it is to ensure the inflow of a large amount of cheap, “green” energy from onshore wind farms to the Polish energy system. It is good that the Polish government noticed that green energy is simply cheaper, because the growing prices of energy from coal and gas in Poland, the prices of fuels and CO2 emission allowances translate into the competitiveness of the Polish economy and one of the highest energy prices in the EU for the consumers of the retail market. In addition, as noted in the work, the modern consumer of the energy market is a customer who, apart from paying attention to maximizing utility or saving on bills, tries to be aware of the ecological problems of the world. The research of end-users of energy on the Irish, Swiss, Japanese, Australian and Polish market cited in the article prove that the motivations to save energy are mainly the result of quite complex behavioural rather than rational factors. The results of research on the energy market customers in Ireland and in Switzerland apart from personality traits previously associated with energy saving, such as—activity, economy, technical attitude, ecological awareness, revealed new personality traits of prosumers—high aversion to consumption, strong sense of caution in relation to personal finances and a clear interest in investing in energy-saving technologies. On the other hand, the study of determinants of behaviour related to saving electricity in Japanese households showed that the motivations to save energy are mainly the result of behavioural rather than rational factors. Replacing devices with energy-saving ones was reinforced by the understanding of the importance of saving energy and social pressure, not the sole desire to save energy. According to researchers from Australia, consumers often act in ways that both fail to align with their knowledge, and fall short of maximising their material interests. A growing body of research indicates that people prefer lower-value certainties over higher-value risks, evaluate things in relative rather than absolute terms, and are heavily influenced by the people around them. Additionally it’s seems that energy consumers gain greater awareness of the value and need for sustainable energy practices, particularly amid growing public concerns over greenhouse gas emissions and climate change. This proves the observations quoted in the work of both the classics of economy theory L. Ch. Robbins and A. Smith, as well as the findings of the above-mentioned Nobel laureates from the trend of behavioural economics, D. Kahneman, V. L. Smith and R. H. Thaler, that the study of human behaviour is extremely important in identifying the causes of such and not other economic activities of a human being. In developing Poland, one of the main reasons for choosing services is the price, but in the case of the specifics of the domestic, expensive energy market, emotional, ethical and environmental attitudes are evident. It is documented by the mentioned research on the Z generation by Parzonko A.J., Balińska A., Sieczko A. and the presented results of research by R. Nagaj and the IPSOS survey. In the Nagaj study of households, it showed that a significant proportion of consumers are susceptible to cognitive distortions when making decisions on the electricity market. Almost 75% of the respondents underwent such behavioural distortions as: the certainty effect (preferring choices that are associated with certainty of their occurrence), narrow frames (analysis of a specific problem or phenomenon in isolation from the broader context) and accessibility error (paying excessive attention to remembered phenomena that are easy to recall). The research also resulted in conclusions that men are more susceptible to past memories, and women prefer stable market conditions and contracts based on long-term fixed rules to a greater extent. In turn, susceptibility to emotions increased as the amount of bills paid decreased. It should be noted that the offers of energy suppliers should place greater emphasis on providing customers with more tangible benefits for activities related to energy saving, because the billing of consumption itself does not lead to changes in consumer behaviour and pro-effective attitudes. On the other hand, the IPSOS survey proves the ecological awareness of Polish citizens, which already translates into attitudes of social involvement, which is a response to existential anxiety related to the life of future generations, climate change and the fate of our planet, which is endangered, among others, by the use of fossil fuels for energy production.
Young consumers are particularly aware of pro-environmental and pro-ecological activities. This is a group of customers who do not want to be passive market participants. Their free functioning on social media, on the one hand, allows for highly effective awareness of the importance of conscious consumption by broad social groups, and, on the other hand, for organizing effective consumer boycotts. In Poland, it was young people who drew attention to the growing problem of smog related to, among other things, obtaining heat energy from environmentally degrading fossil fuels. Involvement in the problem gave rise to the popularity of anti-smog mobile applications. On the other hand, the social pressure was so strong that it resulted in the government program “Czyste Powietrze” (Clean Air) with co-financing of the replacement of energy sources in households that pollute the environment.
The results of the calculated forecasts, apart from indicating which method gives the best results in forecasting electricity demand, may be a suggestion of the potential of energy production in GWh from renewable sources in order to achieve 20% and 32% (
Table 6 and
Table 7) shares of energy from RES in gross final energy consumption set by the European Commission. In 2019, the negative foreign exchange balance amounted to 10,623.7 GWh,, and in 2020, electricity imports from the Czech Republic, Sweden, Germany, Slovakia and Ukraine increased to a record level of 13.1 TWh net, which cost about PLN 3 billion [
62]. Thus, there are capacities to be supplemented on the basis of domestic production, and renewable energy could be a factor that turns the negative balance into a positive one.
Due to the lower costs of green energy production and environmental and social benefits, Poland should strive to significantly increase the production of energy from renewable sources in the coming years, which is actively supported by both end-users of energy on the retail market and the increasingly numerous group of prosumers.


 ,
, 