Article

Modelling Surface Electric Discharge Propagation on Polluted Insulators under AC Voltage

1
Laboratory of Electrical Industrial Systems (LSEI), Department of Electrical Engineering, University of Science and Technology Houari Boumediene, BP 32 El Alia, Bab Ezzouar 16111, Algeria
2
Modelling and Diagnostic of Electrical Power Network Equipment Laboratory (MODELE), Department of Applied Sciences, Université du Québec à Chicoutimi, Chicoutimi, QC G7H 2B1, Canada
*
Author to whom correspondence should be addressed.
Energies 2021, 14(20), 6653; https://doi.org/10.3390/en14206653
Submission received: 10 September 2021 / Revised: 30 September 2021 / Accepted: 8 October 2021 / Published: 14 October 2021
(This article belongs to the Special Issue Outdoor Insulation and Gas Insulated Switchgears)

Abstract

:
In this contribution, a mathematical model allowing for the prediction of the AC surface arc propagation on polluted insulators under non-uniform electric field is proposed. The approach is based on the experimental concept of Claverie and Porcheron. The proposed model, which makes it possible to reproduce the surface electric discharge, includes a condition for arrest of the propagating discharge. The electric field at the tip of the discharge is the key parameter governing its random propagation. A finite element approach allows for mapping of the electric field distribution while the discharge propagation process is simulated in two dimensions. The voltage drop along the arc discharge path at each propagation step is also taken into account. The simulation results are validated against experimental data, taking into account several electro-geometric parameters (distance between electrodes, pollution conductivity, radius of high-voltage electrode, length of the plane electrode). Good agreement between computed and experimental results were obtained for various test configurations.

1. Introduction

For the safe operation of any power system network, it is important that key equipment such as transmission line hardware operate properly for many years. Transmission lines pass through several hundreds of kilometres, being subjected to various climatic conditions (sea salts, domestic pollution, natural pollution, dirt, and chemical residues in the industrial areas, etc.). Pollution of insulators is recognised as a major engineering concern since in polluted areas, overhead lines may see their reliability and performance decline [1,2,3,4].
This is because when the contaminated surface is wet, the leakage currents then increase with potential flashover of the insulating surface, which means power outage [5]. Even though many investigations have been reported on the topic, there is still a dearth of information to gather. The physics of the flashover of polluted insulators is still not completely understood due to the complexity of the involved phenomenon resulting from the interaction of the electric field, pollution layer, and environmental conditions [6].
Due to fast-growing cities, industrialisation, and climate change, power grids are poised to experience more pollution. The study of the flashover of polluted insulators is therefore of interest due to potential power-related outages. Significant efforts have been made to better understand the evolution of insulator flashover. A large number of papers and books on the insulator surface flashover are available [7]. It is now well established that the flashover process of polluted insulators includes three steps: (i) arc initiation, (ii) arc propagation, and (iii) flashover. The electric field distribution along the insulator, which depends on several factors, has a great influence on the arc initiation and propagation. The initiation of an arc starts in a region of high local electrical stress.
Theoretical models for simulating electrical discharge may allow for a better understanding of the physical processes involved in the flashover of polluted insulators. From the engineering point of view, the ultimate goal of the simulation/modelling is to predict the behaviour of polluted insulators from purely macroscopic data. Therefore, reliable models may considerably reduce the time factor required for laboratory tests. Thus far, several flashover models, mathematical, numerical, or experimental investigations, e.g., [7,8,9,10,11,12], have been reported to determine the critical characteristics of the electric arc.
Few mathematical or numerical studies have been conducted to predict the critical flashover voltage of polluted insulators considering that an arc behaves like an equipotential surface in contact with the pollution layer and assumes propagation in one dimension [13,14,15]. Some models describe the electric arc behaviour using various criteria: electric field (Hampton’s criteria), leakage current variation (Hesketh’s criteria), applied voltage and energy (Anjana and Lakshminarasimha’s criteria), power variation (Wilkins’ criteria), and equivalent impedance [16,17,18,19,20]. All these models are based on equations involving the static arc constants (n and N) [12]. A survey of the literature shows that their values vary over a wide range for different types of arcs [21]. These values depend not only on the arc medium but also on the electrolyte used to form the resistive layer. The fundamental shortcoming is related to the large range between these values when comes to the time to select values for a specific application. Slama et al. [2] proved that the parameters n and N are, in reality, not static and depend on the thermal characteristics of the arc along with the equivalent electrical circuit simulating the phenomena.
The present paper aimed at studying the inception and propagation of an electric arc discharge up to flashover under polluted conditions. The main features include the electric field distribution mapping and the fact that the propagation process is superficial (2D). The electric arc discharge model is based on finite element method (FEM). It is generally reported that in the case of uniform pollution, the discharge occurs in the dry bands generated by the circulation of the leakage current [11,22,23,24]. For non-uniform pollution, the arc develops in unpolluted areas [11,22,23,24]. These observations allow for confirmation that the electric arc starts with a discharge in the air in contact with the pollution layer. The model established in this paper is based on this result by exploiting Peek’s work on electric discharges in gases.
The electrical arc discharges, initiated from the cylindrical electrode, propagate by stepping randomly along the polluted insulator plate once the field exceeds the threshold level computed at each time step. When the electric arc progresses, a new configuration is imposed on the system, represented by an increase of the arc length and changes in its characteristics. This increase in the arc length causes the inception field to change at each step. The electrical discharge is modelled by small branches in contact with the pollution layer. The proposed model is validated against experimental results. The comparison of the computed and measured flashover results indicates the validity of the proposed model for predicting the breakdown voltage. From this contribution, explicit information onto the influence of the electro-geometrical parameters on the electric field distribution that affects the flashover process of the polluted insulators is reported. Three aspects of the electrical discharge were analysed: arc initiation, discharge propagation law, and voltage drop. The influence of the electro-geometric parameters on the characteristics of the electric discharge is also discussed. In particular, the proposed model makes it possible to predict the flashover voltage of a polluted insulator according to the geometry of the electrodes, gap distance, and the conductivity of the pollution.
The rest of the paper is organised as follows. The laboratory model is described in Section 2. The experimental investigations are reported in Section 3. In Section 4, the mathematical model is described. The comparison of the simulated results with experimental ones is reported in Section 5. Conclusions and future directions of research are provided in Section 6.

2. Laboratory Model

The rod–plane arrangement constitutes one of the basic configurations in the investigation of non-uniform electric fields and insulation properties in high-voltage studies [25,26]. The physical laboratory model (Figure 1) is based on the plane model of Claverie and Porcheron [10,27]. It consists of a glass insulating plate on which a uniform pollution layer with specific conductivity (γ) is deposited. A cylindrical electrode with a radius (Rp) served for high voltage (U) application while a rectangular electrode of length (L) and width (a) served as the ground electrode. The cylindrical and rectangular electrodes are separated by a distance (D). It is also assumed that distance between the centre of the circular electrode and the end of the plane electrode is ‘XL’.

3. Experimental Investigations

The experimental circuit (Figure 2) adopted for the present study consists of a HV transformer (110 kV, 5 kVA) and voltage and leakage current measuring systems (voltage divider and shunt resistor). The arc discharge’s light emission intensity was recorded with a R3896 Hamamatsu Photonics photomultiplier (PMT) directed at the HV electrode. The covered wavelength ranges from ultraviolet light to the near-infrared region (185 to 900 nm), allowing the detection of early discharge inception since corona discharges in air emit light mainly in the 230–405 nm range. The most intense emissions are between 300 and 360 nm, whereas those of the arc phase are between 600 and 800 nm [7]. The PMT tube had a rise time of 22 ns. The applied voltage was increased at a rate of 1 kV/s using a High Volt WSM3 control device. Measurements signals (current, voltage, and PMT) were recorded via a National Instrument data acquisition system (NI PCI 6251).
The leakage current was recorded through a 100 Ω power shunt resistor (RSH).
The preparation of the saline solution, used for the pollution of insulators, was based on the salt fog method according to standard IEC 60507. The level of the pollution layer was chosen on the basis of earlier work by Teguar et al. [22,23,24,28]. These authors considered that the highly conductive layers have a conductivity greater than 400 μS/cm, while the weakly conductive layers have a conductivity lower than 40 μS/cm. The tap water was referred as median conductivity level.
The physical laboratory model was carefully cleaned with distilled water so that all traces of drifts were removed and dried with papers. The conductivity of the pollution layer was adjusted to a desired value using a conductivity meter of Yokogawa type by adding sodium chloride (NaCl) to deionised water. The pollution layer was deposited by spraying the surface of the insulating plate with the salty solution while respecting the number of sprays and distance to obtain a uniform and reproducible pollution layer.

4. Mathematical Modelling

4.1. Basic Concept

The backbone of the model originated from the Obenaus concept [29]. This concept was firstly developed to describe the flashover under DC conditions. Furthermore, some researchers such as Claverie [10] and Rizk [12,30,31] provided the essential criteria to adapt the Obenaus concept to AC voltages. The AC flashover on a polluted surface is considered as an arc in series with a residual resistance consisting of a pollution layer that is not bridged by the arc (Figure 3). The circuit equation then reads as follows:
U = V a r c + R p   l a r c . I
V a r c = N l a r c I n
where
U: applied voltage (V);
N and n: arc constants;
l a r c : arc length (cm);
I: leakage current (A);
V a r c : arc voltage (V);
R p   l a r c : residual resistance of the pollution layer (Ω).
The arc tends to extinguish at every half-cycle as the current passes through zero. The re-ignition can occur when the applied voltage reaches the critical value (depending on leakage current I and arc length larc) according to Claverie and Porcheron [10,27]:
U r e i 800   l a r c I
On the basis of some experimental results, Hampton established that the arc cannot propagate unless the voltage gradient in the pollution layer Ep exceeds the voltage gradient in the arc column Earc [16]. Therefore, the propagation condition yields
E p > E a r c  
On the basis of these equations, we propose a two-dimensional model. The fundamentally new feature of the model is its use of a field mapping criterion to describe the arc propagation. The angle between the arc discharge step and the axis of the gap is random with an assumed form of uniform probability distribution. The initiation and propagation criteria of the electric discharge are estimated by the modified Peek’s formula. The main features are described in the next section.

4.2. Simulation Model

Computations of the model were performed using the scientific library MATLAB®. To reproduce the arc discharge progression forms, we established a circular mesh (Figure 4), made up of (nmesh × mmesh) elements with angular (∆θ) and radial (∆r) steps. The nodes of this mesh represent the targeted points by the arc discharge.
The development of a superficial model of electrical arc discharge propagation is reproduced under the following assumptions:
-
The discharge progresses stepwise on a plane (two-dimensional) where the conductive surface of the polluted insulator is considered constant.
-
The electrical arc initiates at the cylindrical electrode subjected to high voltage and progress towards the grounded plane electrode.
-
The discharge propagates randomly from the most intense field points, emphasising the predominant effect of the electric field.
In the computer program, the system is reproduced by a matrix of dimension mmesh × nmesh where the centre of the circular electrode constitutes the element (1, 1) with the coordinates (0, 0). The other points are defined geometrically (x, y) or as a matrix (i, j) abscissas, as defined by Equations (5) and (6).
The difficulty of an electric arc rises as it takes place on a polluted surface. The conductivity and the distribution of pollution layers not only influences the inception/propagation of a surface electric discharge but is itself influenced by this electric discharge. The established model concerns two steps of discharge evolution: inception and propagation.
The coordinates of the points are calculated by the following relationships:
x =   i   Δ r   cos j   Δ θ
y =   i   Δ r sin j   Δ θ
with
∆θ, ∆r: angular and radial steps, respectively;
j: index varying between 1 and mmesh = 2π/Δθ;
mmesh: number of angular divisions;
i: index varying between 1 and nmesh = (X/Δr) + 1;
nmesh: number of radial divisions.

4.2.1. Discharge Inception

When the applied voltage stress (electric field) between two electrodes in an insulation system reaches a threshold value, a first corona discharge of initial length L0 is initiated. If the conditions for the discharge propagation are satisfied, the discharge channel fed by the arc discharge current lengthens. Otherwise, the channel switches off and disappears unless the applied voltage reaches the threshold re-ignition value [32,33].
The threshold electric field is estimated using empirical Peek’s law [33,34,35,36,37,38]:
E c = E a i δ 1 + K δ R p m 1 . m 2
The threshold voltage of the discharge inception for the considered configuration is [7,37,38]
U c = E a i δ 1 + K δ R p ln 2 D + R p R p 1 R p + 1 2 D + R p   m 1   m 2
where
Eai = 21.2 kVrms/cm, K = 0.3;
Rp: radius of rod electrode in cm;
m1: geometric correction coefficient (between 0 and 1) being equal to
m 1 = log X L 2   π
XL: distance between the centre of the circular electrode and the end of the plane electrode;
m2: correction coefficient of the pollution (0.3 to 0.9). For a clean surface, m2 = 0.9, whereas for highly polluted one, m2 = 0.3.
The surrounding condition is also taken into account through the density:
δ = (3.92 P)/(273 + t)
P: air pressure in cm Hg;
t: the surrounding temperature in °C.
The Equations (8)–(10) are used to determine the threshold voltage according to the electro-geometrical parameters and climatic conditions [7,37,38].

4.2.2. Discharge Propagation Criteria

A discharge initiation on a polluted insulator may not lead to a breakdown process unless two conditions are satisfied. First, the required conditions for discharge propagation must be satisfied. Second, the discharge should not stop, and therefore the first condition remains valid during the progression of the arc up to the flashover (otherwise the voltage has to be increased).
A mandatory condition for an electric discharge to be initiated is related to the distribution of electric fields, which greatly depend on geometrical dimensions and electric parameters of pollution.
The propagation of electric discharge being the succession of avalanches of critical size and the last phase is called the final jump, which corresponds to the establishment of the flashover between the electrodes.
In this work, the electric discharge starts from the energised electrode (cylindrical electrode) where the electric field value is high enough to sustain the discharge propagation to the grounded electrodes. Indeed, the electric discharge is considered to evolve randomly when the field at the target point exceeds the threshold field of corona appearance.
The proposed multi-arc FEM model uses the inception field calculated from Equation (7) as condition to initiate the discharge.
At each evolution step, the extreme point of the discharge M, a three-options random probability propagation is offered (Figure 4b): L (left), C (centre), and R (right).
Considering the target point with electric field E, the discharge evolution criterion (Hampton criteria) towards this point is given by
E > ϑ   E C
where
EC: the critical field (Equation (7);
ϑ : random variable generated at each step and each branch by a uniform probability distribution in the model.
The uniform law allows for pseudo-random number generation algorithms, to generate random variables with the same probability of occurrence over an interval.
If the likelihood is sufficiently high enough, a new segment connects the extremity M to the targeted point, which becomes itself a new discharge extremity.
After each propagation step, the electric field distribution is modified by the newly added branches. The electric field distribution is therefore computed.
The voltage at the new extremity referred to as V a r c is given by the following equation:
V a r c = U Δ v
with Δ v [V] representing the linear voltage drop along the discharge channel.
When the electric arcs progress, a new configuration is imposed on the system by the arc length and its voltage drop. This new configuration affects the critical field at each step of the evolution. The inception field is recalculated at each step of the electric discharge evolution (Equation (13)).
E c l a r c = E a i . δ 1 + K δ . R l a r c m 1 . m 2
where
R l a r c = R p + l a r c
l a r c : the maximum radial length of the discharge
l a r c = r .   N b e
N b e : number of steps;
∆r: radial steps.
The model used to compute the breakdown voltage is based on Obenaus [29] and Claverie-Porcheron [10,27] models. The electric field distribution is obtained by the Finite Element Method Magnetics software (FEMM) [38]. To do this, a rectangular domain defines the calculation limits with a Neumann condition. MATLAB is used to introduce the electro-geometric data in the form of an executable program and the exploitation of the FEMM results.
During each calculation step, if the propagation condition is satisfied, the discharge lengthens. Otherwise, the peak value of the applied voltage (U) has to be increased and the parameters initialised.
The flashover voltage is obtained when the discharge length exceeds the inter electrode gap D. Figure 5 presents the general flowchart of simulation.

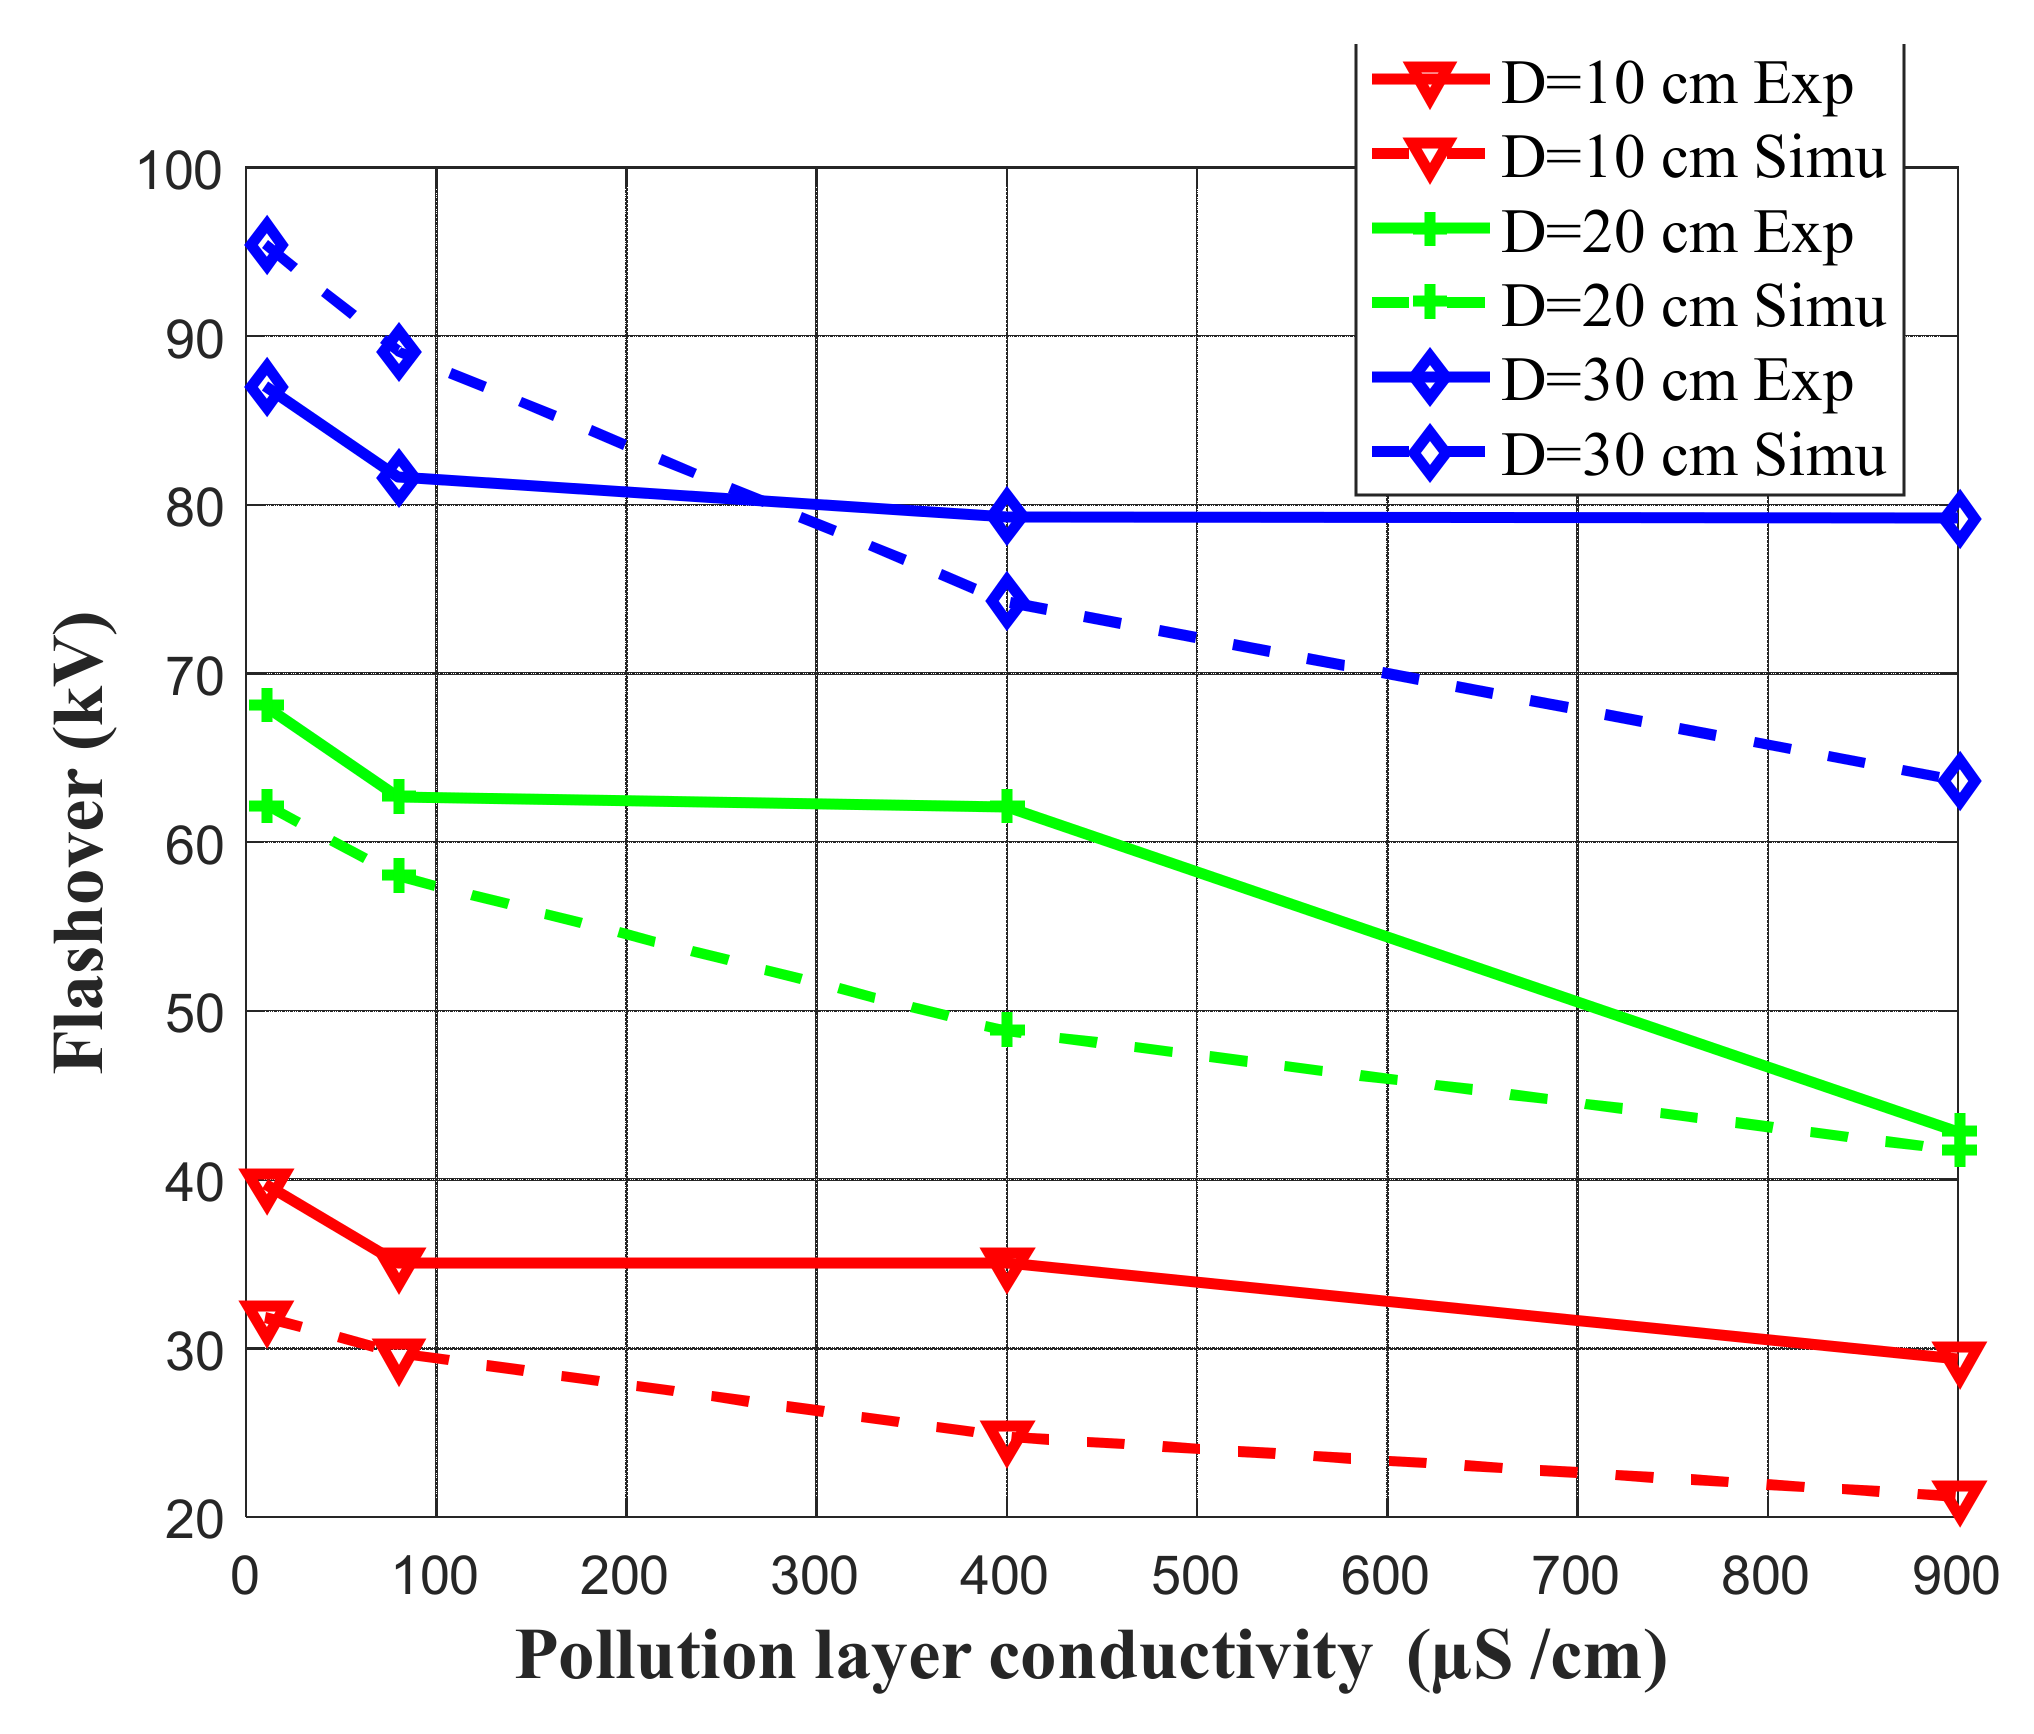
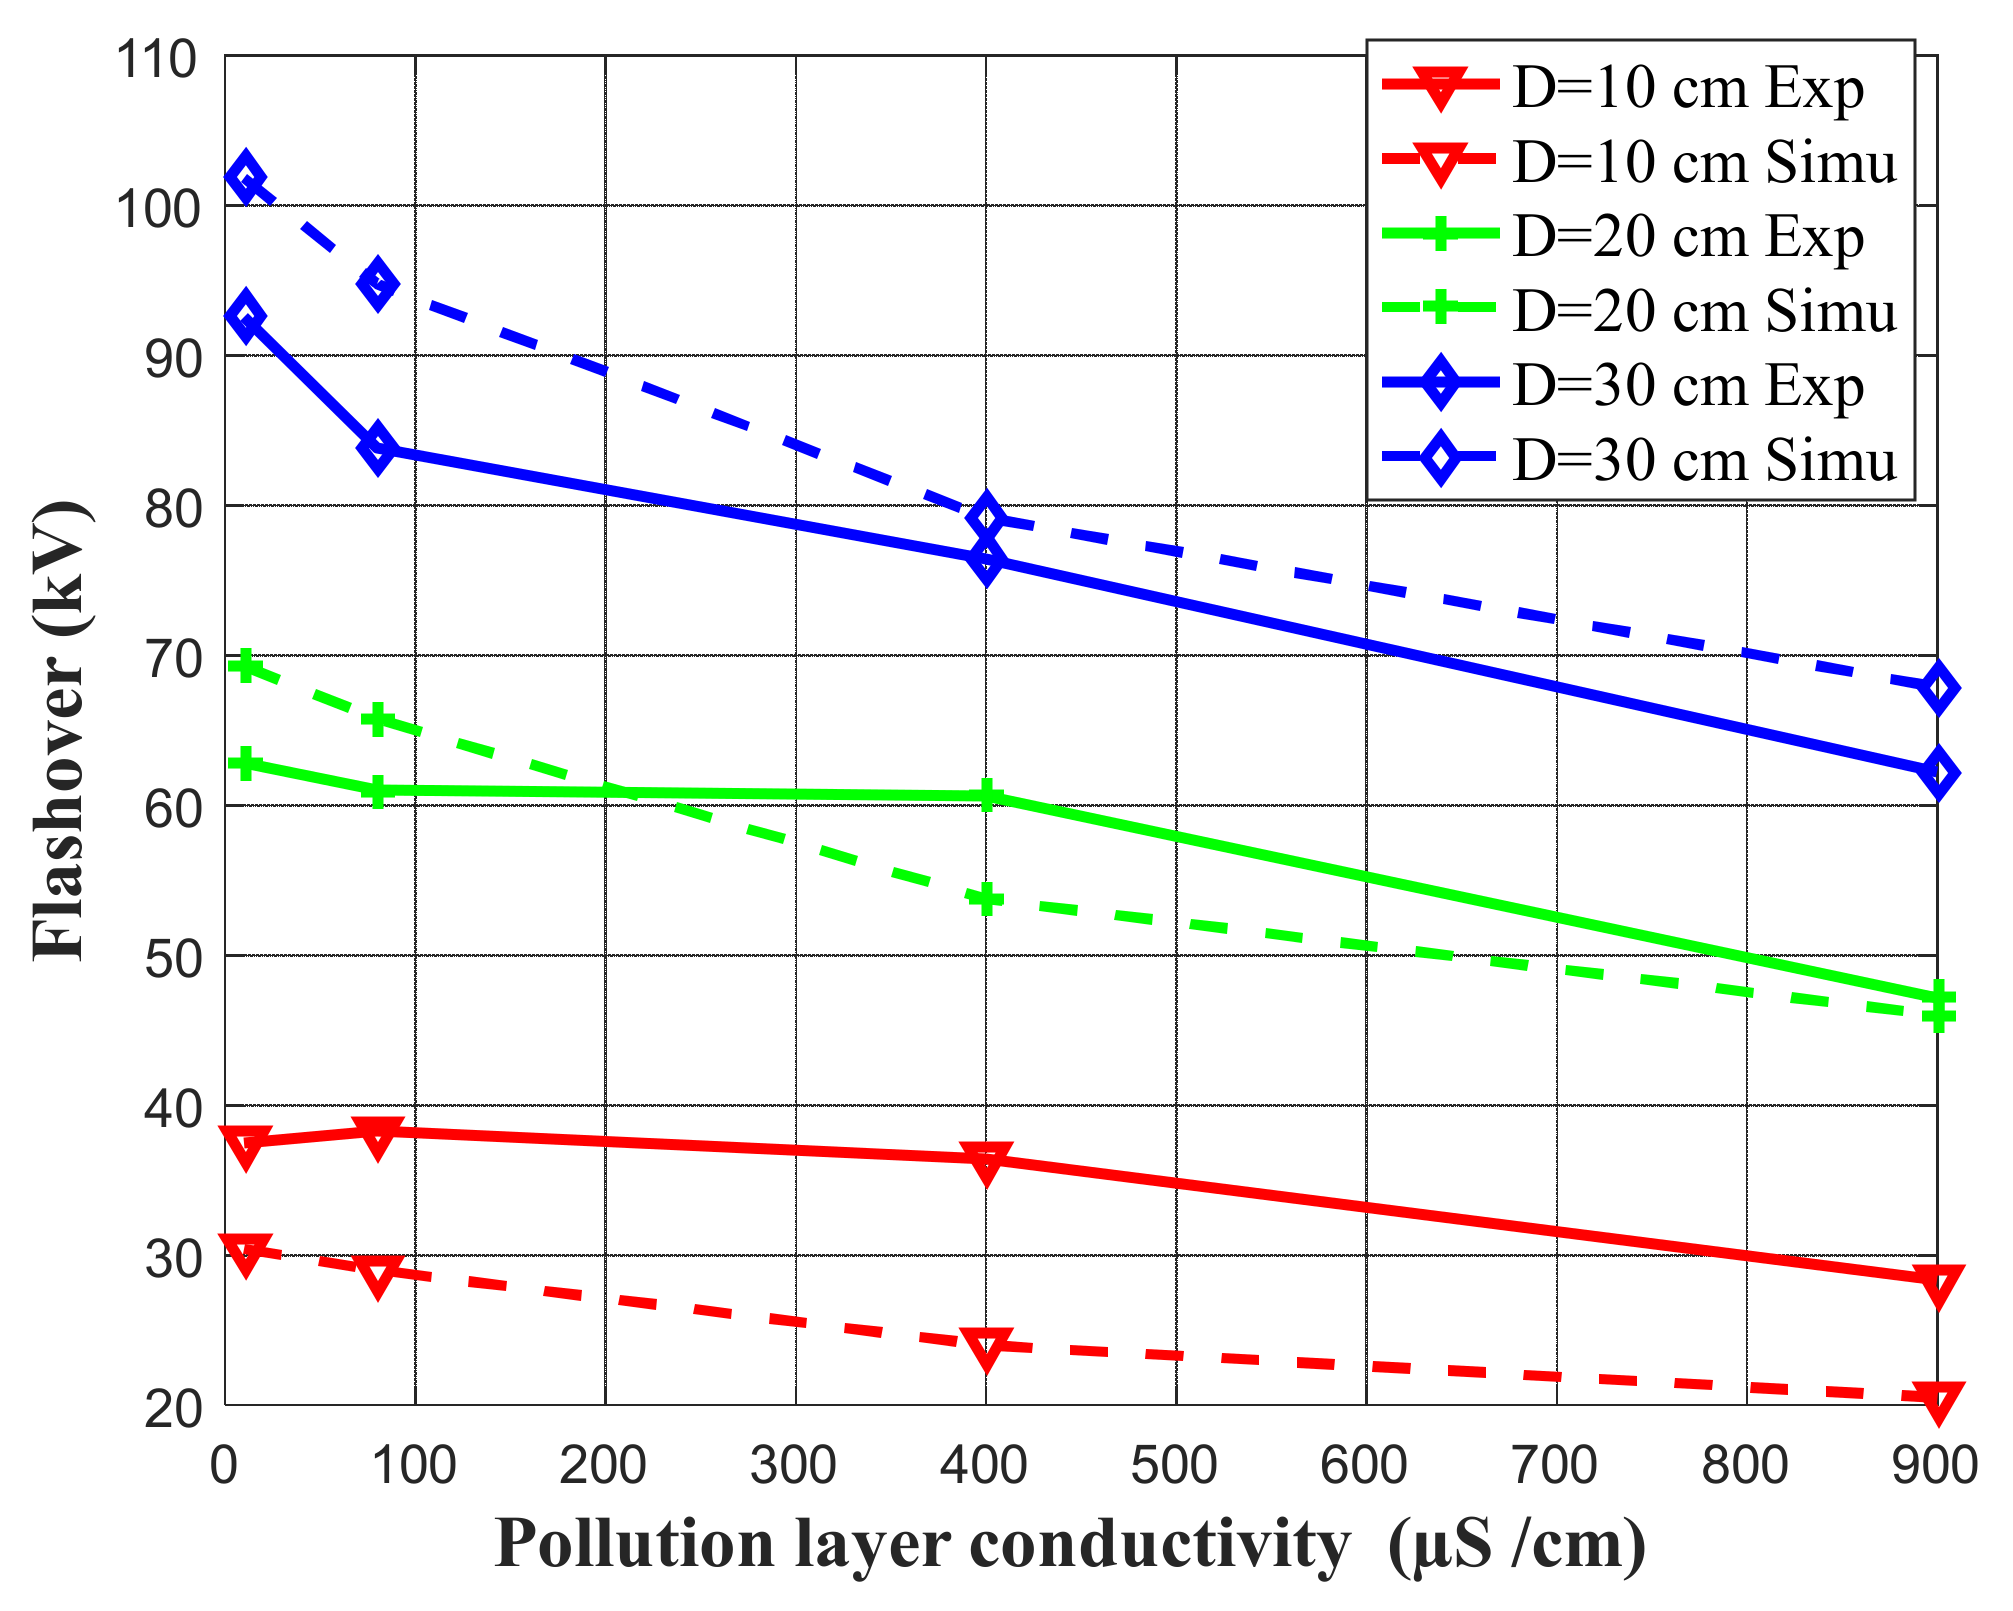
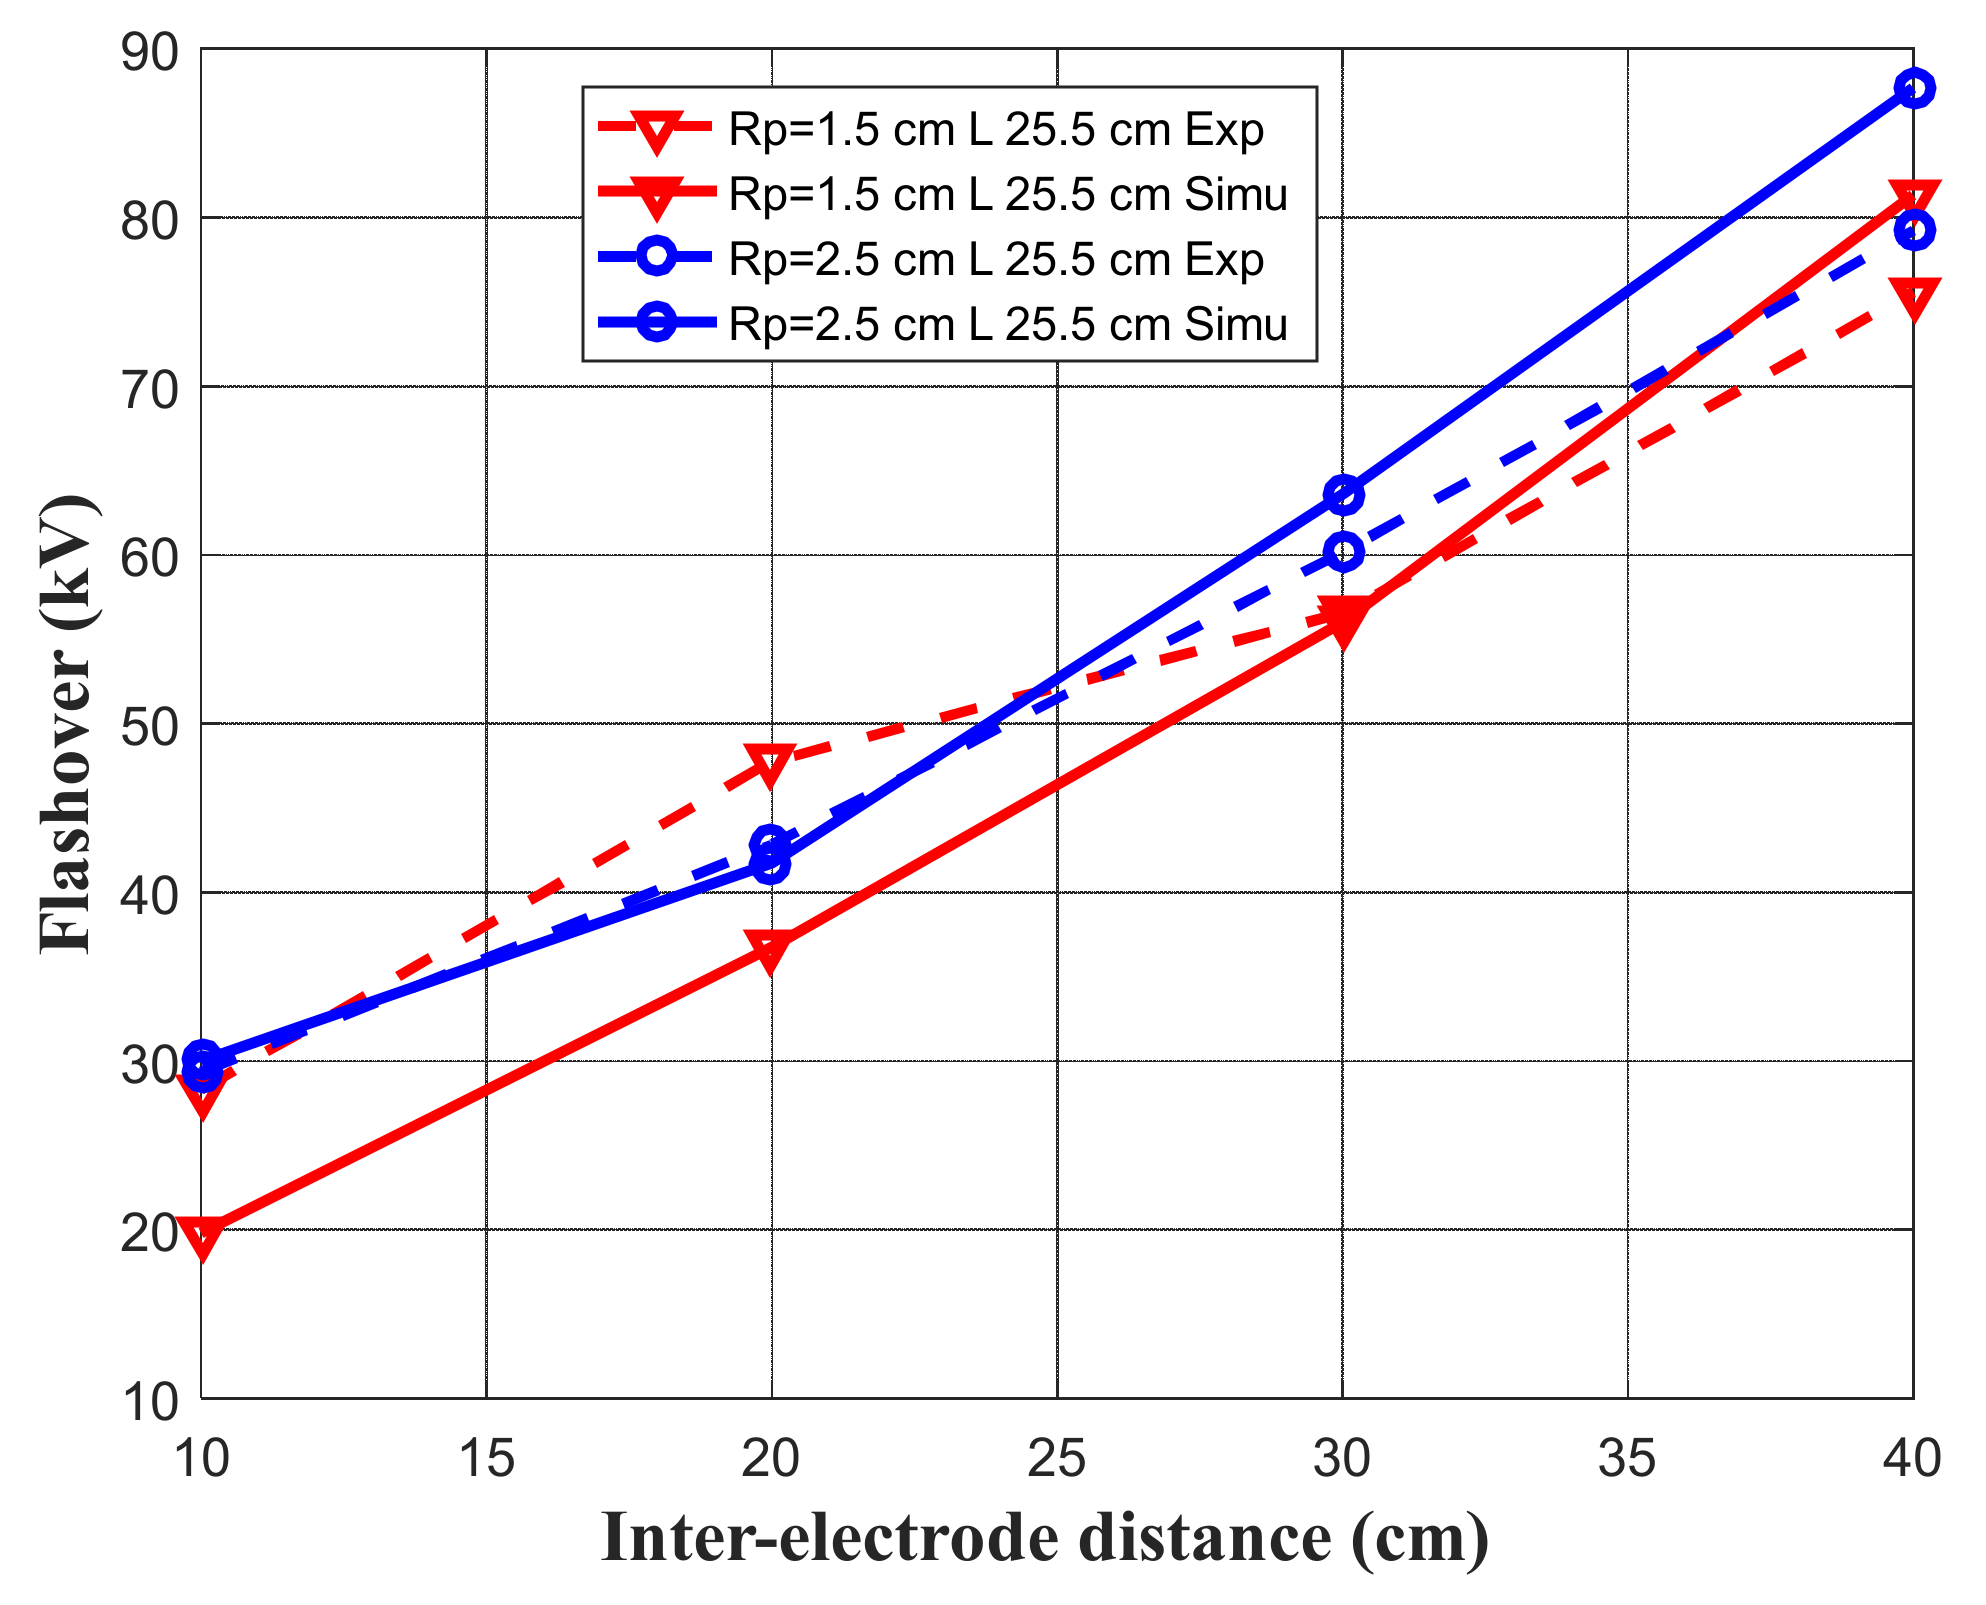
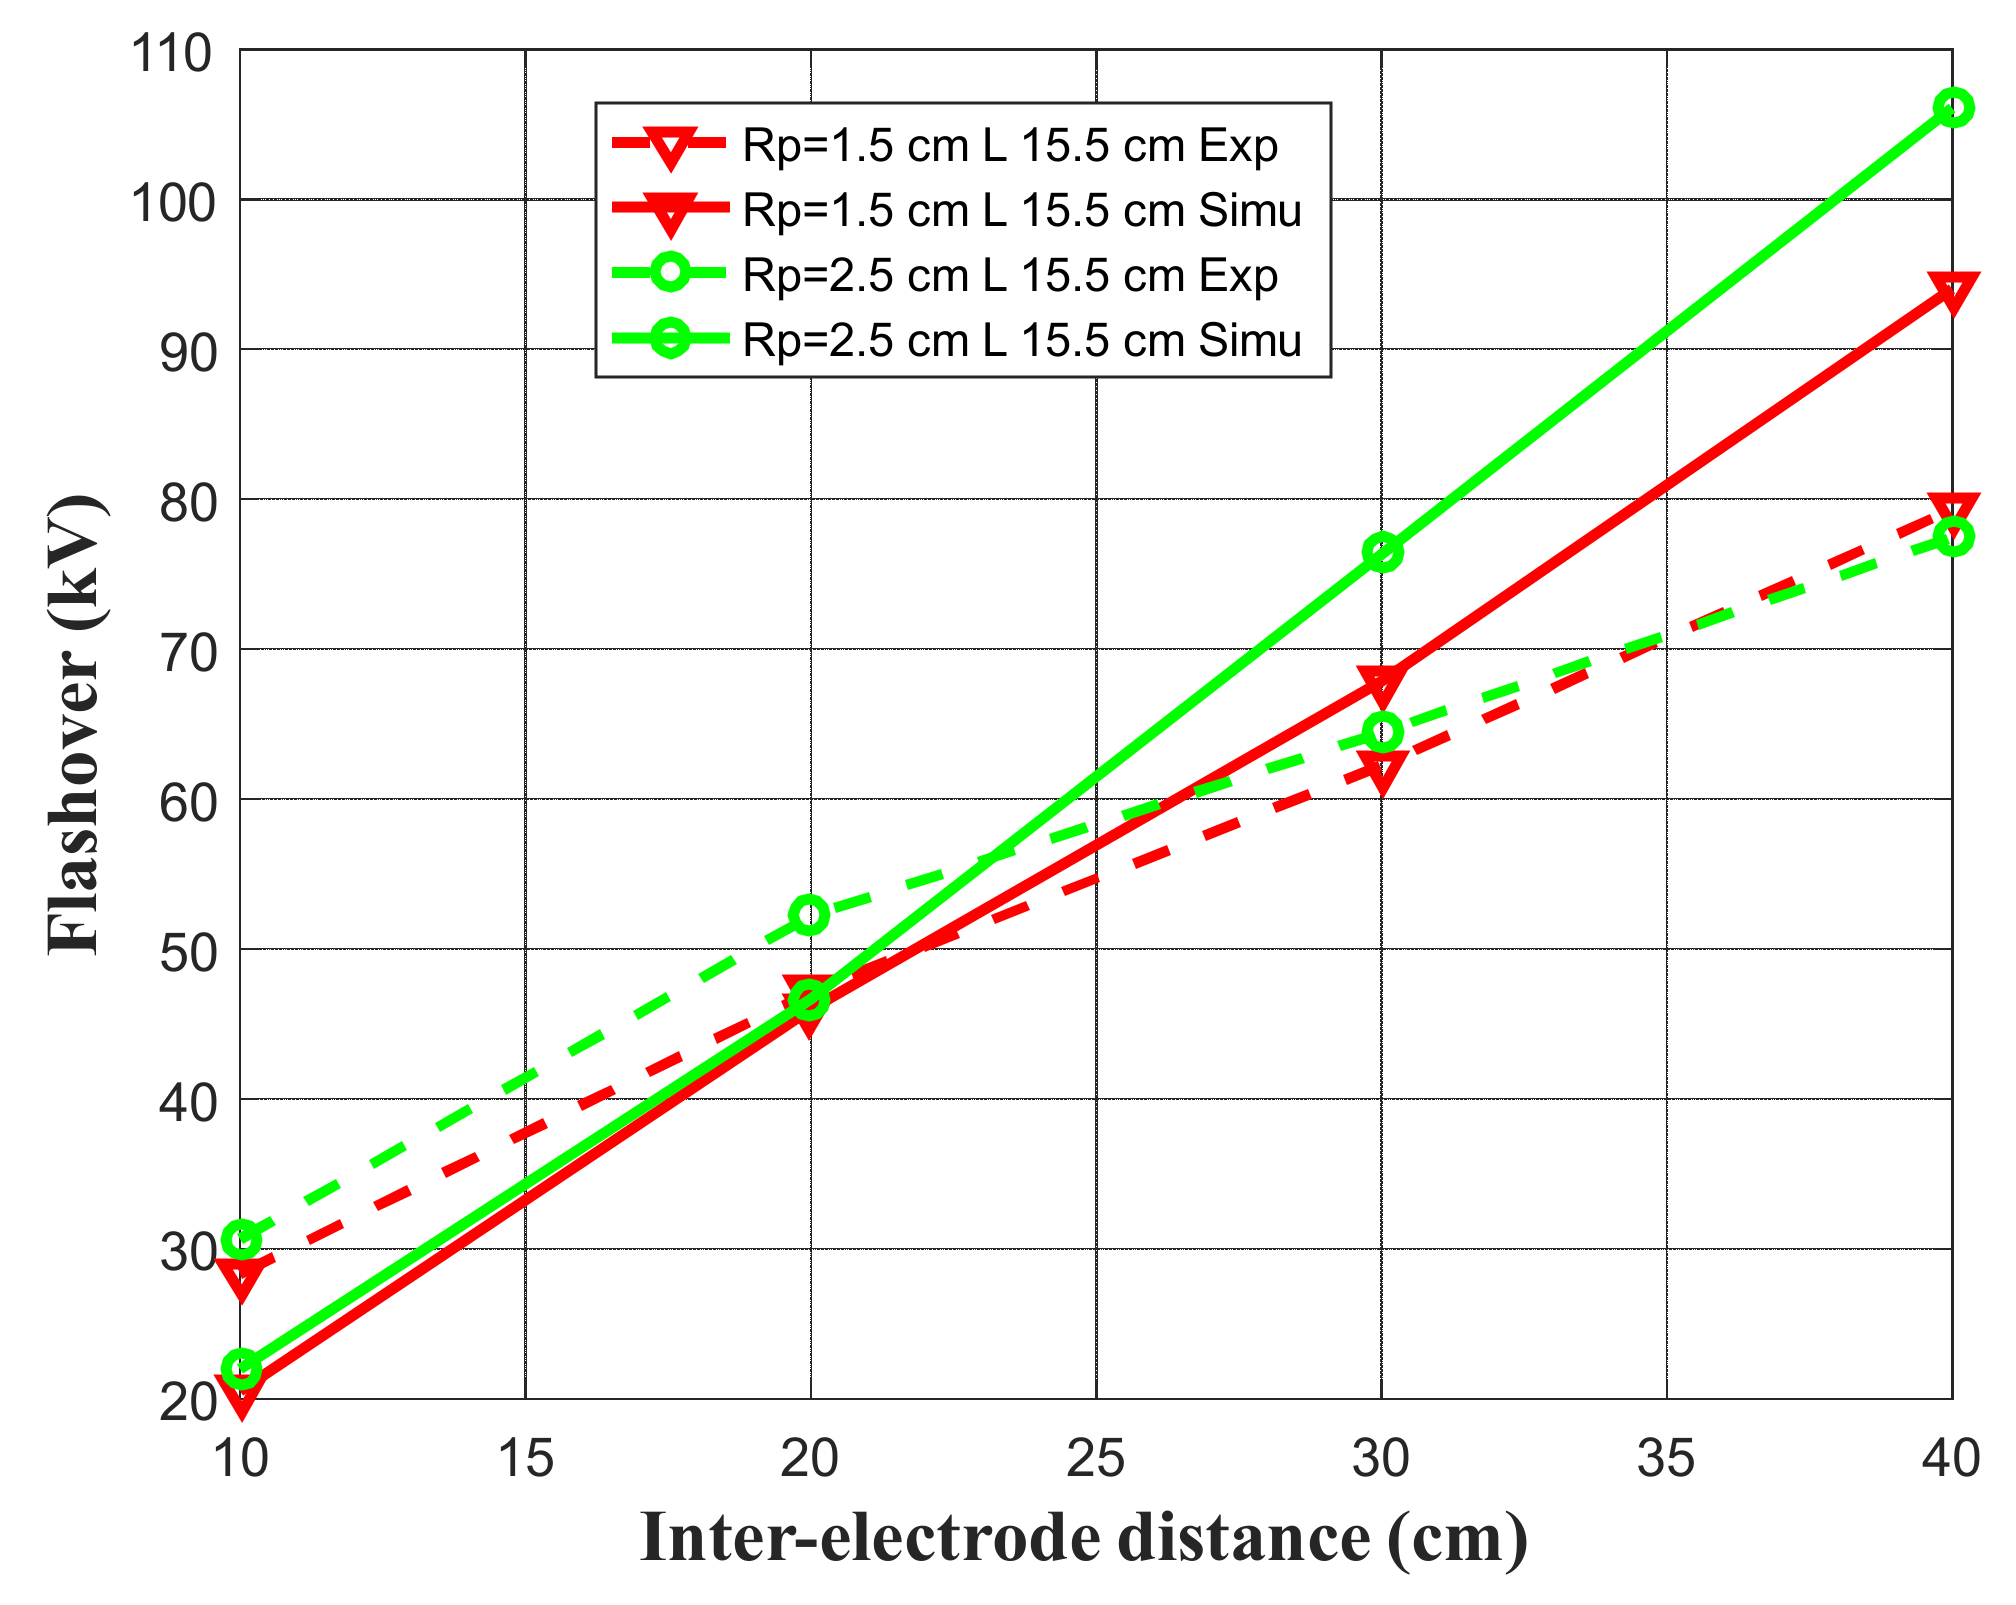
5. Simulation Results and Validation against Experiments

The flashover of the polluted insulator was measured and simulated while considering the effect of various electro-geometric parameters including conductivity, inter-electrode distance, HV electrode radius, and ground electrode width. For this purpose, we considered various electro-geometrical constraints as follows
-
Radius of circular electrode RP = 1.5 cm, 2.5 cm.
-
The length of the plane electrode L = 15.5 cm, L = 25.5 cm.
-
Inter-electrode distance D = 10 cm, 20 cm, 30 cm, 40 cm.
-
Four layers of pollution of different conductivity are considered (γ = 10 µS/cm, 80 S/cm, 400 µS/cm, γ = 900 µS/cm).
A comparison between simulated and experimental data to validate the proposed model is reported hereafter. The variation of the flashover voltage as a function of the above-mentioned electro-geometric parameters under AC voltage is given in Figure 6, Figure 7, Figure 8, Figure 9, Figure 10, Figure 11, Figure 12 and Figure 13.
It can be observed from Figure 6, Figure 7, Figure 8 and Figure 9 that the flashover voltage decreased with the pollution layer’s conductivity. In other words, increasing the pollution conductivity caused the electrical performance to worsen. It can also be seen that increasing inter-electrode distance and energised electrode radius caused the disruptive voltage to increase, regardless of the pollution layer’s conductivity and the length of the grounded electrode.
The electric field decreased with increasing D or Rp, thus requiring a higher level of applied voltage to generate a conductive current and dry bands that stimulate generation of arcs, leading to flashover.
The breakdown voltage was reduced with increasing pollution conductivity. The presence of pollution favours a conductive current in the regions of high electrical field stress, which create dry bands and facilitate arc generations.
The variation of the geometrical parameters such as the radius and the length of the ground electrode, as reported in Figure 10, Figure 11, Figure 12 and Figure 13, impacts the flashover by affecting the distribution of the electric field. For a given inter-electrode distance, with any increase in the electrode radius or the length of grounded electrodes, the electric field tends to be uniform. However, the length effect is less important than that of the inter-electrode distance.
For a given radius and inter-electrode distance, it should be noticed that the experimental data have the same order of magnitude as those predicted with the established numerical model (less than 20% error). This difference can be traced to the possible displacement of the wet part of the pollution, the difficulty in applying uniformly the pollution in real life, and/or the residues from the previous discharges.
It can be seen that the simulation results were close to the experimental ones for small radius, large gap electrodes, and large plane electrode. Furthermore, the difference between the simulation and experimental results was reduced when the HV electrode radius decreased and the ground electrode length increased. The random variable generated at each step and each branch by a uniform probability distribution in the model may be seen as a clear limitation of the model in its actual form.

6. Conclusions

In this contribution, experimental investigations on the flashover of a non-uniform field polluted insulators under AC was carried out. Different electro-geometrical parameters (conductivity, radius, inter-electrode distance, and the plane length) were considered.
The established model makes it possible to predict the flashover voltage of a polluted insulator, which is very useful information for electrical engineering. In addition, it is possible to determinate the initial value of the insulator degradation represented by the inception voltage. Knowledge of this data allows designers, builders, and managers of electrical power transmission lines to combat the inconvenience of insulator pollution in a technical manner. Moreover, it was confirmed that the flashover phenomenon depends on the interaction between the electric field and the conductivity of pollution layers.
The established model is in essence based on the electric field and the randomness of the evolution of the electric discharge on the surface of the polluted insulator. The choice of the progression criterion, which considers the modified Peek’s law, confirms that the discharge bypasses the dry bands and evolves in the air in contact with the pollution layer.
From these investigations, we report that the flashover voltage increased with increasing inter-electrode distance and high-voltage electrode radius. It decreased with increasing conductivity. The arc development was particularly dependent on the pollution layer’s conductivity and electrical field stress, which plays a primordial role on the flashover process. These observations were confirmed by the model.
The prediction of the electric arc initiation and development on a polluted surface is of significant interest for designing an HV system suitable for heavily polluted areas. It is hoped that the results presented can be viewed as a benchmark and a challenge for further research. It is also expected to have an impact on further modelling/simulation of discharge inception and propagation on polluted surface. Work is now in progress to improve the propagation concept and extend the model to non-uniformly polluted surfaces and real-life insulators. This should be of great help in outdoor insulation design.

Author Contributions

This research was conducted by M.L.A. under the supervision of S.B., I.F. and F.M.; M.L.A., F.M. and M.J. conducted the experimental investigations. Writing—original draft preparation, M.L.A.; writing—review and editing, S.B., I.F., D.K. and A.B. All authors have read and agreed to the published version of the manuscript.

Funding

This work was partially sponsored by the Natural Sciences and Engineering Research Council of Canada (NSERC) under grant no. RGPIN-201504403.

Institutional Review Board Statement

Not applicable.

Informed Consent Statement

Not applicable.

Data Availability Statement

Not applicable.

Acknowledgments

M.L.A. is especially thankful to the Directorate General for Scientific Research and Technological Development—Algerian Ministry of Higher Education and Scientific Research for supporting his research stay in Canada.

Conflicts of Interest

The authors declare no conflict of interest.

Abbreviations

ExpExperimental results
FEMFinite element method
ExpExperimental results
FEMFinite element method
FEMMThe Finite Element Method Magnetics software
HVHigh voltage
IECInternational Electrotechnical standards
PMTPhotonics photomultiplier simulation results
Nomenclature
AWidth of the rectangular electrode
DInter-electrode distance
EElectric field
EarcThe voltage gradient in the arc column
E c The threshold electric field
EpThe voltage gradient in the pollution layer
ILeakage current
LLength of the rectangular electrode
l a r c Arc length, the maximum radial length of the discharge
m1Geometric correction coefficient
m2Correction coefficient of the pollution
mmeshNumber of angular divisions
N and nArc constants
nmeshNumber of radial divisions
N b e Number of steps
PAir pressure
RpRadius of the cylindrical electrode
R p   l a r c Residual resistance of the pollution layer
tTemperature
U c The threshold voltage
U r e i Critical voltage of the re-ignition condition
V a r c Arc voltage
UApplied voltage
XLDistance between the centre of the circular electrode and the end of the plane electrode
γConductivity of pollution layer
∆θAngular steps
∆rRadial steps
Δ v The linear voltage drop
δThe air density
ϑ Random variable

References

  1. Venkataraman, S.; Gorur, R.S. Prediction of flashover Voltage of non-ceramic Insulators under Contaminated Conditions. IEEE Trans. Dielectr. Electr. Insul. 2006, 13, 862–869. [Google Scholar] [CrossRef]
  2. Slama, M.E.-A.; Beroual, A.; Hadi, H. Analytical Computation of Discharge Characteristic Constants and Critical Parameters of Flashover of Polluted Insulators. IEEE Trans. Dielectr. Electr. Insul. 2006, 17, 1764–1771. [Google Scholar] [CrossRef]
  3. Hussain, M.M.; Farokhi, S.; McMeekin, S.G.; Farzaneh, M. Risk Assessment of Failure of Outdoor High Voltage Polluted Insulators under Combined Stresses Near Shoreline. Energies 2017, 10, 1661. [Google Scholar] [CrossRef] [Green Version]
  4. Hussain, M.M.; Farokhi, S.; McMeekin, S.G.; Farzaneh, M. Mechanism of saline deposition and surface flashover on outdoor insulators near coastal areas part II: Impact of various environment stresses. IEEE Trans. Dielectr. Electr. Insul. 2017, 24, 1068–1076. [Google Scholar] [CrossRef] [Green Version]
  5. Fofana, I.; N’cho, J.S.; Betie, A.; Hounton, E.; Meghnefi, F.; Yapi, K.M.L. Lessons to Learn from Post-Installation Pollution Levels Assessment of Some Distribution Insulators. Energies 2020, 13, 4064. [Google Scholar] [CrossRef]
  6. Farzaneh, M.; Chisholm, W.A. Insulators for Icing and Polluted Environments; Wiley: Hoboken, NJ, USA, 2009. [Google Scholar]
  7. Amrani, M.L. Etude de L’évolution en Bidimensionnel de L’arc Electrique sur une Surface Diélectrique Polluée. Ph.D. Thesis, Université des Sciences et de la Technologie Houari Boumediene, Alger, Algerie, 2019. [Google Scholar]
  8. Rumeli, A.; Hızal, M.; Demir, Y. Analytical Estimation of Flashover Performances of Polluted Insulators. Madras 1981, 1, 1–6. [Google Scholar]
  9. Aydogmus, Z.; Cebeci, M. A New Flashover Dynamic Model of Polluted HV Insulators. IEEE Trans. Dielectr. Electr. Insul. 2004, 11, 577–584. [Google Scholar] [CrossRef]
  10. Claverie, P. Predetermination of the Behaviour of Polluted Insulators. IEEE Trans. 1971, 90, 1902–1908. [Google Scholar] [CrossRef]
  11. Mekhaldi, A. Etude des Phénomènes de Conduction et de Décharge Electrique sur des Surfaces Isolantes Polluées Sous Tension Alternative 50 Hz. Ph.D. Thesis, Ecole Nationale Polytechnique, Alger, Algerie, June 1999. [Google Scholar]
  12. Rizk, F.A.M. Mathematical Models for Pollution Flashover. Electra 1981, 78, 71–103. [Google Scholar]
  13. Volat, C.; Farzaneh, M.; Mhaguen, N. Improved FEM models of one- and two-arcs to predict AC critical flashover voltage of ice-covered insulators. IEEE Trans. Dielectr. Electr. Insul. 2011, 18, 393–400. [Google Scholar] [CrossRef]
  14. Jabbari, M.; Volat, C.; Farzaneh, M. A New Single-arc AC Dynamic FEM Model of Arc Propagation on Ice Surfaces. In Proceedings of the 31st Electrical Insulation Conference (EIC), Ottawa, ON, Canada, 2–5 June 2013; pp. 360–364. [Google Scholar]
  15. Jabbari, M.; Volat, C.; Fofana, I. Application of a New Dynamic Numerical Model to Predict Polluted Insulator Flashover Voltage. In Proceedings of the Electrical Insulation Conference, Philadelphia, PA, USA, 8–11 June 2014; pp. 102–106. [Google Scholar]
  16. Hampton, B.F. Flashover Méchanism of Polluted Insulation. Proc. PIEE. 1964, 111, 985–990. [Google Scholar]
  17. Hesketh, S. General criterion for the prédiction of pollution flashover. Proc. IEE. 1967, 114, 531–532. [Google Scholar] [CrossRef]
  18. Anjana, S.; Lakshminarasmha, C.S. Computed of Flashover Voltages of Polluted Insulators using Dynamic Arc Model. In Proceedings of the 6th International Symposium on high-voltage Engineering, New Orleans, LA, USA, 28 August–1 September 1989. [Google Scholar]
  19. Wilkins, R. Flashover Voltage of High Voltage Insulators with Uniform Surface Pollution Films. Proc. IEE. 1969, 116, 457–465. [Google Scholar] [CrossRef]
  20. Dhahbi-Megriche, N.; Beroual, A.; Krahenbuhl, L. A New Proposal Model for Polluted Insulators Flashover. J. Phys. D Appl. Phys 1997, 30, 889–894. [Google Scholar] [CrossRef]
  21. Tavakoli, C.; Farzaneh, M.; Fofana, I.; Beroual, A. Dynamics and Modeling of AC Arc on Surface of Ice. IEEE Trans. Dielectr. Electr. Insul. 2006, 13, 1278–1285. [Google Scholar] [CrossRef]
  22. Teguar, M.; Mekhaldi, A.; Boubakeur, A.; Harid, N. Flashover performance of non-uniformly polluted glass insulating surface under hvac stress. Int. J. Power Energy Syst. 2017, 37. [Google Scholar] [CrossRef]
  23. Mekhaldi, A.; Namane, D.; Bouazabia, S.; Beroual, A. Flashover of Discontinuous Pollution Layer on HV Insulators. IEEE Trans. Dielectr. Electr. Insul. 1999, 6, 900–906. [Google Scholar] [CrossRef]
  24. Mekhaldi, A.; Bouazabia, S. Conduction Phenomena on Polluted Insulating Surfaces under AC High Voltage. In Proceedings of the 9th International Symposium on HV Engineering, Graz, Austria, 19–23 October 1995; pp. 31–74. [Google Scholar]
  25. Fofana, I.; Farzaneh, M.; Hemmatjou, H.; Volat, C. Study of Discharge in Air from The Tip of an Icicle. IEEE Trans. Dielectr. Electr. Insul. 2008, 15, 730–740. [Google Scholar] [CrossRef]
  26. Farokhi, S.; Farzaneh, M.; Fofana, I. Experimental Investigation of the Process of Arc Propagation over an Ice Surface. IEEE Trans. Dielectr. Electr. Insul. 2010, 92, 464–485. [Google Scholar] [CrossRef]
  27. Claverie, P.; Porcheron, Y. How to Choose Insulators for Polluted Areas. IEEE Trans. Power Appar. Syst. 1973, 92, 1121–1131. [Google Scholar] [CrossRef]
  28. Teguar, M. Modélisations D’isolateurs Pollués Soumis à Divers Paramètres Electrogéométriques. Ph.D. Thesis, Ecole Nationale Polytechnique, Alger, Algerie, 2003.Obenaus, F. Fremdschichtüberschlag und Kriechweglänge. Dtsch. Elektrotech. 1958, 4, 135–136. [Google Scholar]
  29. Rizk, F.A.M. Analysis of Dielectric Recovery with Reference to Dry—Zone Arcs on Polluted Insulators. In Proceedings of the IEEE PES Winter Power Meeting, New York, NY, USA, 28 January–2 February 1971. [Google Scholar]
  30. Rizk, F.A.M. A Criterion for AC Flashover of Polluted Insulators. In Proceedings of the IEEE PES Winter Power Meeting, New York, NY, USA, 28 January–2 February 1971. [Google Scholar]
  31. Dhahbi, N.; Beroual, A. Flashover dynamic model of polluted insulators under ac voltage. IEEE Trans. Dielectr. Electr. Insul. 2000, 7, 283–289. [Google Scholar] [CrossRef]
  32. Pelissier, R. L’effet Couronne sur les Lignes Aériennes; Indice D-160; Technique de L’ingénieur: Paris, France, 1951; Volume 1. [Google Scholar]
  33. Rakotonandrasana, J.H.; Beroual, A.; Fofana, I. Modelling of the negative discharge in long air gaps under impulse voltages. J. Phys. D Appl. Phys. 2008, 41, 105210. [Google Scholar] [CrossRef]
  34. Peek, F.W. Dielectric Phenomena in High-Voltage Engineering; McGraw-Hill: New York, NY, USA, 1929. [Google Scholar]
  35. Warner, E.H. Corona Discharge; Forgotten Books: London, UK, April 2018; 146p. [Google Scholar]
  36. Amrani, M.L.; Bouazabia, S.; Fofana, I.; Meghnefi, F.; Jabbari, M. Modified Peek formula for calculating positive DC corona inception voltage on polluted insulator. Electr. Eng. 2019, 101, 489. [Google Scholar] [CrossRef]
  37. Amrani, M.L.; Bouazabia, S.; Fofana, I.; Meghnefi, F.; Jabbari, M. On Discharge Inception Voltage for Insulators under Non-uniform Field with AC Voltage. In Proceedings of the International on Advanced Electrical Engineering 2019 (ICAEE 2019), El Hamma, Algiers, 19–21 November 2019. [Google Scholar] [CrossRef]
  38. Meeker, D. Finite Element Method Magnetics; Version 4.2, User’s Manual; University of Virginia: Charlottesville, VA, USA, 2004. [Google Scholar]
Figure 1. Overview of the laboratory physical model. (a) Schematic illustration. (b) Photo.
Energies 14 06653 g001
Figure 2. Measuring circuit for AC inception and breakdown test.
Energies 14 06653 g002
Figure 3. Model of flashover on a polluted insulator [29].
Energies 14 06653 g003
Figure 4. Progression discharge grid. (a) Mesh. (b) Target points.
Energies 14 06653 g004
Figure 5. General flowchart of the simulation.
Energies 14 06653 g005
Figure 6. Flashover vs. pollution layer conductivity (Rp = 1.5 cm, L = 25.5 cm).
Energies 14 06653 g006
Figure 7. Flashover vs. pollution layer conductivity (Rp = 2.5 cm, L = 25.5 cm).
Energies 14 06653 g007
Figure 8. Flashover vs. pollution layer conductivity (Rp = 1.5 cm, L = 15.5 cm).
Energies 14 06653 g008
Figure 9. Flashover vs. pollution layer conductivity (Rp = 2.5 cm, L = 15.5 cm).
Energies 14 06653 g009
Figure 10. Flashover vs. inter-electrode distance for electrode radius (γ = 900 µS/cm, L = 25.5 cm).
Energies 14 06653 g010
Figure 11. Flashover vs. inter-electrode distance for electrode radius (γ = 900 µS/cm, L = 15.5 cm).
Energies 14 06653 g011
Figure 12. Flashover vs. inter-electrode distance for different electrode radius (γ = 80 µS/cm, L = 25.5 cm).
Energies 14 06653 g012
Figure 13. Flashover vs. inter-electrode distance for electrode radius (γ = 80 µS/cm, L = 15.5 cm).
Energies 14 06653 g013
Publisher’s Note: MDPI stays neutral with regard to jurisdictional claims in published maps and institutional affiliations.

