Abstract
This paper investigates the impact of tube wells on the discharge and water table of the Quetta Valley aquifer and conducts a financial analysis of the solar photovoltaic water pumping system (SPVWP) in comparison with a typical pumping system for the Water and Sanitation Agency of Quetta’s (WASA) tube wells. Quetta Valley is dependent on groundwater as surface resources are on decline and unpredictable. The population of this city has exponentially increased from 0.26 million in 1975 to 2.2 million in 2017 which has put a lot of pressure on the groundwater aquifer by installing more than 500 large capacity tube wells by WASA and Public Health Engineering (PHE) departments in addition to thousands of low-capacity private tube wells. The unprecedented running of these wells has resulted in drying of the historical Karez system, agricultural activities, and the sharp increase in power tariffs. There are 423 tube wells in operation installed by WASA in addition to PHE, Irrigation and Military Engineering Services (MES), which covers 60% of the city’s water demand. The results will be beneficial for organizations and positively impact the operation of these wells to meet public water demand. For the two zones, i.e., Zarghoon and Chiltan in Quetta Valley, recommendations are given for improved water management.
1. Introduction
Today, clean, safe, and continuous water supplies is needed for all areas in society, such as agricultural, drinking, industries, sanitation, and energy generation. Therefore, the world water systems face the imbalance of water supply and challenging hazards [1]. In the United Nations Educational, Scientific and Cultural Organization’s (UNESCO) research [2], around 700 million people in 43 different countries are suffering from water shortage. Furthermore, the report forecasts that two-thirds of the earth’s population could be living under water-harassed circumstances and 1.8 billion people will be living in regions with complete water shortage until 2025. Pakistan’s economy depends on smart agriculture as part of sustainable development [3] and this accounts for 26% of the gross domestic product (GDP). Therefore, agriculture is the largest user of freshwater resources [4].
The groundwater is a significant source of water to sustain life. This is a reliable resource that can be used. Groundwater is used worldwide for agriculture, drinking water supply, and business. Thirty-five percent of Pakistan’s agricultural water needs are met from groundwater. Most supplies of drinking water come from groundwater [5]. The local, regional, and global conflicts over groundwater resources arise with enhanced water use [6]. Pakistan, with a population of 207 million, loses most of the available water. Around 70% of the inhabitants are living in rural zones of the country where the main drinking water source is groundwater on account of safe wellspring of water while the country is moving from a water-stressed to water-scarce nation [7]. There are multiple factors responsible for lowering groundwater. These include the lack of initiative and/or infrastructure to use floodwater for direct irrigation, the lack of effective wastewater treatment facilities resulting in increasing pollution loads, and the lack of institutional arrangements for regulation, management, and monitoring of water resources [8].
Currently, there are more than 600,000 private tube wells in Pakistan. A pump is a device typically used to lift water from the ground and supply up to the point where it is needed. To operate these pumps, a large amount of energy is required. Different kinds of pumps are used to extract water from the ground, such as diesel water pumps, pumps run by grid electricity, the solar photovoltaic water pumping system and pumps run by wind turbine [9,10]. Since 1998, the groundwater table has been dropping in almost every channel command. It shows that the present net abstraction of groundwater in a channel is greater than recharge. The growth of groundwater at the present rate is, therefore, unsustainable. The water hardships of the 3 million population of Quetta are declining as the underground water level was exhausted to an excess of 300 m, in some regions of the city. The previous groundwater policies and arrangements made by the government made a massive decline in underground water resources [11,12,13].
This study aims to assess the impacts of WASA tube wells on the total discharge and water table in the valley aquifer. Furthermore, the cost-benefit analysis is performed on running these wells on SPVWP system. This research study has been conducted in Quetta, the capital of the Baluchistan province, which is characterized by low precipitation and is a dry to semi-dry locale in Pakistan. The bowl-shaped valley of Quetta is covered by dry mountains including rocks of the Triassic to the Pliocene age. This city is located in northern Baluchistan near the Pakistan Afghanistan border with the latitude 30.20 and longitude 67.01 and at the elevation of 1682 m. Quetta City is geographically divided into two zones, Zarghoon and Chiltan. The water table decline rate in the Zarghoon zone was observed at 2 to 5 m/year and discharge was reduced from 4 to 19%, while the water table decline rate in the Chiltan zone was observed between 2 and 8 m/year and discharge was reduced from 5 to 20%. Quetta receives the highest average solar radiation, due to which solar photovoltaic pumping is potentially efficient and economical. The solar photovoltaic viability and cost-benefit (CB) analysis for these tube wells was carried out using the Clean Energy Management RETScreen software. Using data from the tube wells, the CB ratio for different pumps was analyzed and it was noted that for five different pumps, with power capacities of 5.5 kW, 11 kW, 15 kW, 18.5 kW, 30 kW, there is 3–5 years payback period, and the CB is 2.05, 3.52, 2.92, 2.52, and 2.97 respectively. Based on the data analysis of 30 tube wells, it is recommended that two pumps with capacities of 18.5 kW should be installed for shallow depths and 30 kW for deeper depths, depending on their discharge.
2. Related Work
The related work are portioned into multiple sections for detailed review, which are as follows:
2.1. Overview of SPVWP Technology
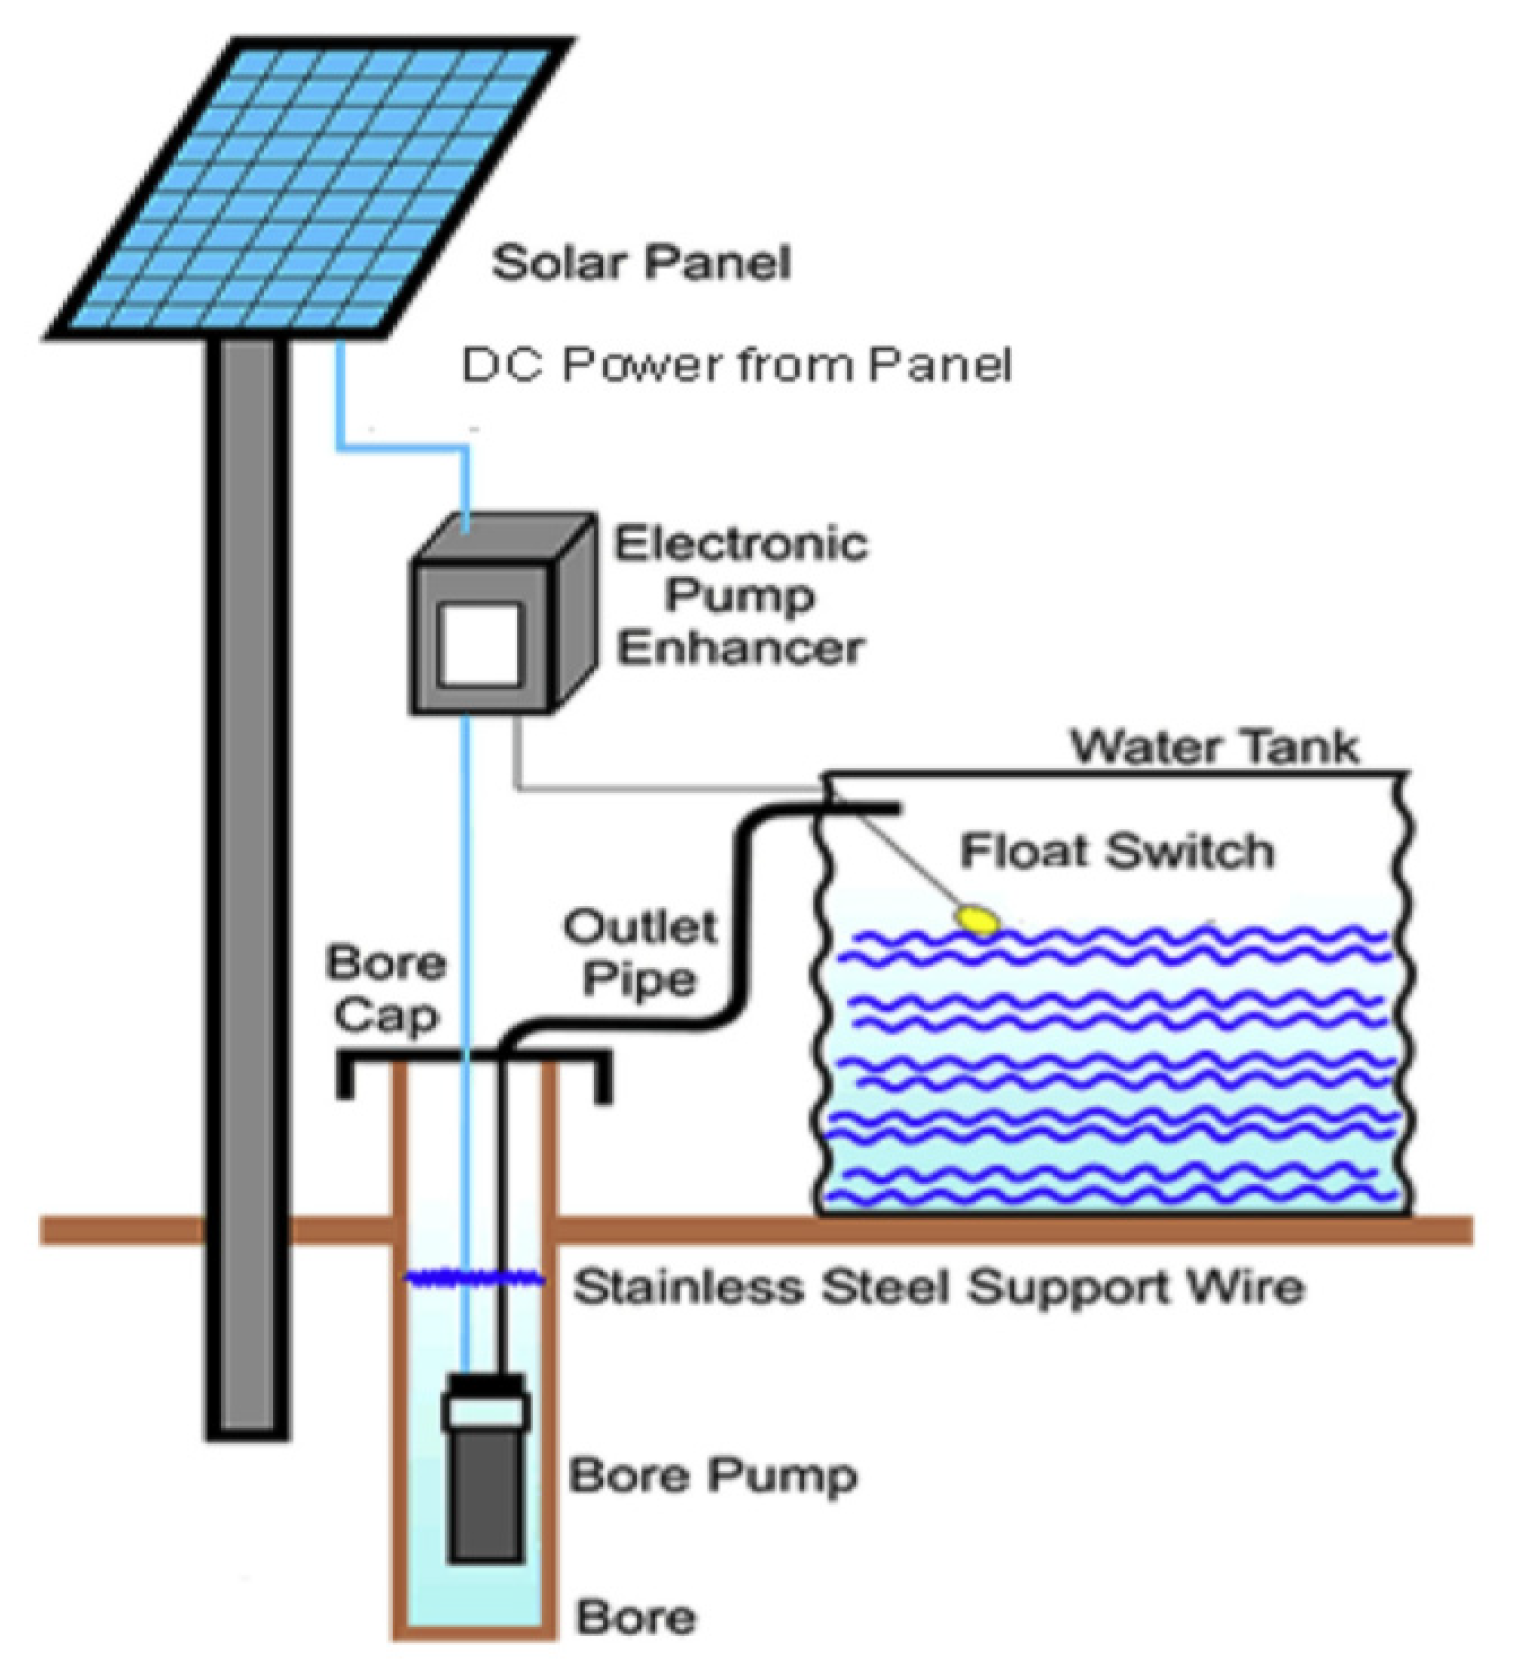
SPVWP is a standout among most ordinary PV applications in creating nations and can possibly turn into a noteworthy power for social and monetary advancement. The utilization of photovoltaic as the power hotspot for pumping water is considered as a standout among the most encouraging territories of PV applications. The pumping water can be utilized in numerous applications, for example, household use, water for irrigation systems, and town water supplies. A typical installation setup of sun-based photovoltaic water pump (SPVWP) system is shown in Figure 1 [14].

Figure 1.
A typical solar PV water pumping system.
The sun-based photovoltaic (SPV) frameworks are perfect, common sense, and prudent to provide capacity to family applications as an expansion of electrical cables to country zones. It has applications in water pumps in remote territories, reference points, hydrological estimating stations, microwave repeaters, the driving of lighting signs, meters, and so on. The maximum conversion efficiency of the SPV Module is 4–17% [15].
2.2. Potential of Solar Irradiation
The total share of electricity of the Quetta Electricity Supply Company (QESCO) is 650–700 MW against the demand of 1620 MW, resulting in a shortfall of 970 MW [16]. Quetta’s altitude ranges above 1500 and reaches up to 2500 and closer toward the mountain, resulting in higher solar intensity reaching its surface as compared to low altitude areas. It receives the highest average solar radiation, due to which solar photovoltaic pumping is potentially efficient and economical. The peak sunshine hours in the area are 2021 h/year, and the average annual radiation is about 7275 MJ/m2, which is rich in solar energy resources.
Solar energy has an extra favorable position over petroleum derivatives. Therefore, it gives outflows free power utilizing an inexhaustible wellspring of electricity [17,18,19]. The growing population of Quetta Valley and the increase in urbanization has a tremendous effect on the aquifer of this valley due to extreme discharge, which is still not sufficient to meet the demand. This research study aims to know the impact of tube wells on the discharge and water table and the assessment of SPVWP for economical water pumping.
2.3. Groundwater Extraction System
Extensive depletion of groundwater in urban areas can contribute to water shortages, land subsidence, and water quality issues [16]. Quetta Valley is the Baluchistan province’s largest population center in western Pakistan. This region is arid, and the main source of domestic and agricultural use is groundwater. This work suggests that over the past three decades, Quetta Valley has undergone a gradual decline in groundwater levels also causing land subsidence. Quetta’s WASA has been tracking groundwater levels since 1989 and found water falls in some parts of the valley were up to 24 m in 30 years [7].
Over the decades, groundwater extraction has been developed exponentially, causing aquifer exhaustion and groundwater contamination. In Quetta Valley, precipitation estimates 217 mm/year, with an extensive fluctuation. The yearly potential evaporation is around 1750 mm while the zone is mainly arid. The water supply system and the source conclude the source of drinking water. Improved sources include piped water, tap or standpipe, hand pump, donkey pump/turbine, or well dug shielded. Unprotected sources include well dug, lake, river, canal, or stream as well as other less prevalent sources, such as supplied seller, tanker truck, or bottled/canned water. Baluchistan depends mainly on household piped water (25%) and well, lake, or tank protected (13%). Sources that have not been improved (48%) include unprotected well or lake (24%) and river, canal, or stream (17%).
Groundwater utilization is not new in Baluchistan. Prior, groundwater utilization depends on open surface burrowed wells or common water Karezes and normal springs, however to a constrained degree. Nevertheless, with the accessibility of power and the heightening of tube well advancement, the capacity of water markets to give water are in existence. In order to deal with the effect of water shortage and groundwater decrease, casual groundwater markets are rising in upland Baluchistan. Groundwater is the fundamental wellspring of the water system in upland Baluchistan and is primarily served through cylinder wells, dug wells, Karezes, and springs. After some time, tube well numbers have expanded fundamentally from 2500 in 1971 to 21,231 in 2008.
This development quickened with the dry spell of 1998–2005 and, in light of sub-discretionary groundwater, the executive approach which caused an extensive number of groundwater sources to evaporate, including Karezes, springs, and cylinder wells. The normal decrease in water tables in the three upland regions was 75, 60, and 57 m in high, medium, and low height areas, respectively. The improvement of the groundwater showcase is the consequence of the joined impact of various climatic, financial, and natural elements [20]. The geological features range from the early Jurassic to the Quaternary crop out in the valley of Quetta. The left-lateral strike-slip fault of Chaman is active, west of the Quetta Valley, and defines the Indian Plate’s western boundary, complicating the geological and tectonic past. In the Quetta Valley, two aquifers are identified: an unconsolidated alluvial aquifer and a bedrock aquifer. Water supply is largely dependent on groundwater, mainly derived from this alluvial aquifer. The bedrock aquifer consists of the limestone of the Shirinab and Chiltan formations and conglomerates of the Urak Formation. This aquifer is recharged in the surrounding mountain areas where these formations are exposed [21].
3. Material and Methods
3.1. Study Area
Quetta is geologically divided into two zones, namely Zarghoon and Chiltan. The lithology of Quetta Valley consists of two formations, hard rocks, and alluvial soil. Most of the city area has been covered by alluvial aquifer and somehow the mountainside formation comprises of hard rocks. The first layer of the alluvial aquifer consists of gravel and sand up to 130 m. The second layer starts from 130 m to 140 m and consists of pure clay. The third layer of the alluvial aquifer is sand gravel, starting from the depth of 140 m to 180 m, while the fourth formation of this aquifer is clay, which starts from the depth of 180 m to 230 m. Similarly, the depth of the structure from 220 m to 230 m is sand silt, and from 230 m to 240 m is clay. The study aims to analyze the assessment of solar photovoltaic water pumping of WASA tube wells for the Quetta Valley aquifer. In order to calculate water pumping, energy bills, and quantify the pump and power requirements, thirty tube wells out of 423 were identified in Quetta City. Figure 2 shows the selected tube wells from different parts of the town as a sample to assess the variation in discharge. The annual decline in ground water, and the supply and demand gap, is analyzed in order to propose the conversion of the selected tube wells on to SPVWP.
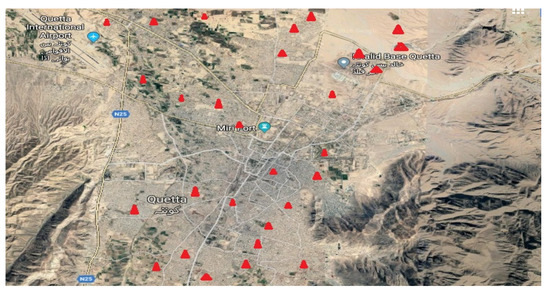
Figure 2.
GPS location of thirty selected tube wells.
3.2. Sampling Procedure of Different Parameter for the Study
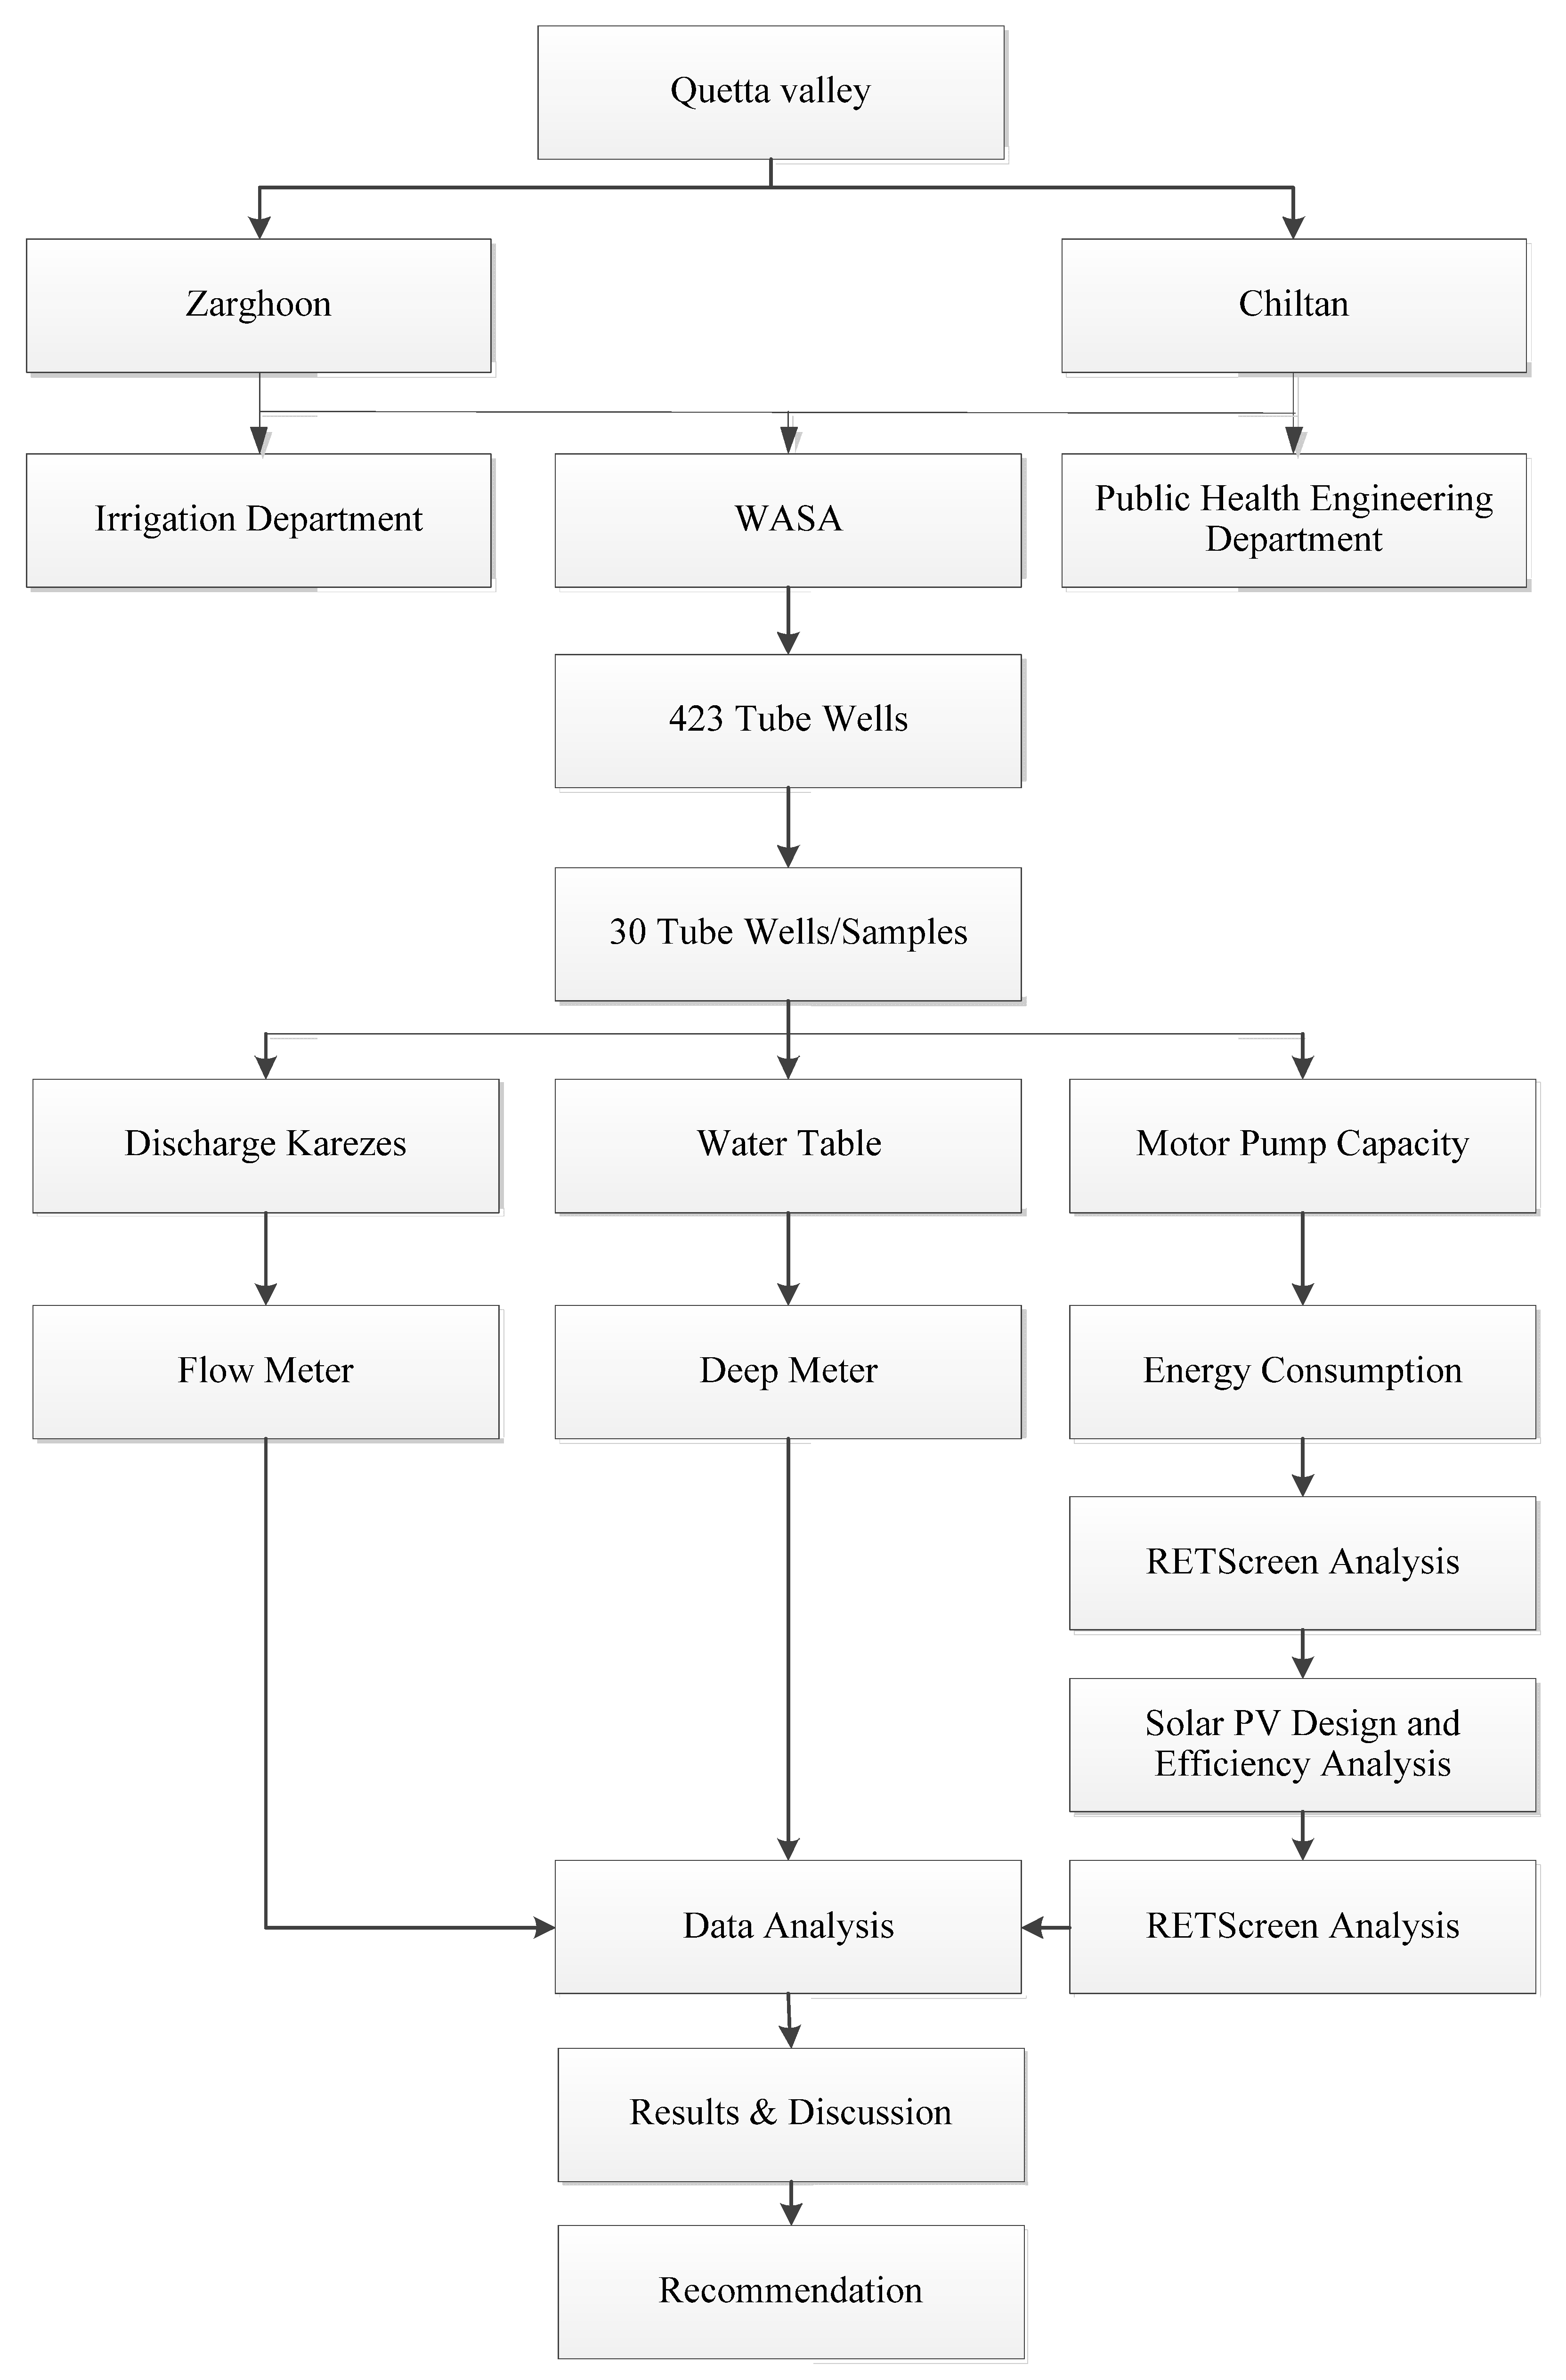
Thirty different tube wells out of 423 tube wells were collected for each parameter as a sample. Data were collected from these sample tube wells. The collected data were compared to previous data of sampled tube wells which was provided by WASA, Quetta. The methodology used for each parameter is shown in Figure 3.

Figure 3.
Methodology steps in this study.
The coordinates of the related tube wells were found via the GPS device model GPS map GARMIN 62 and is used for testing. The discharge of the tube well has been measured by using ultrasonic flow meters. Discharge was measured by placing the censor above and below on the pipe of the tube well. The ultrasonic flow meter’s transit time measuring method requires relatively “clean” fluid to enable the sound waves to complete their circuit. The ultrasonic flow meters may be operated in the transit-time mode.
The water table of the related tube well has been measured using both a manual and a sonic deep meter. Sonic water level meters use sound waves to measure water level in wells, while the manual deep meter consists of a long wire attached to censor in the head and when the censor hits the water table the alarm sound is produced, and the water table is noted from the measurements on the wire. The sonic water level meter is an innovative approach for measuring water level in seconds without the use of down-hole probes or instrumentation, all while avoiding the cross contamination of imperial and metric units. The billing of the concerned tube well has been collected from the WASA Quetta in order to analyze the energy consumption of the tube wells. An average of four bills from different tube wells, namely Marriabad, Gol Masjid, Nawa Killi, and Chasma Achozai, have been chosen for analysis. Table 1 indicates the average monthly electricity consumption in KWH and the bills in PKR of these four tube wells.

Table 1.
Average monthly electricity consumption of 4 tube wells.
The solar-related data includes multiyear solar radiation and peak hours, feasibility, and a cost benefit analysis was taken from the RETScreen database, shown in Table 2. The peak sunshine hours in the area are 2021 h/years, and the average annual radiation is about 7275 MJ/m2, which is rich in solar energy resources.
Table 2.
Solar radiations received in Quetta Valley.
4. Results and Discussion
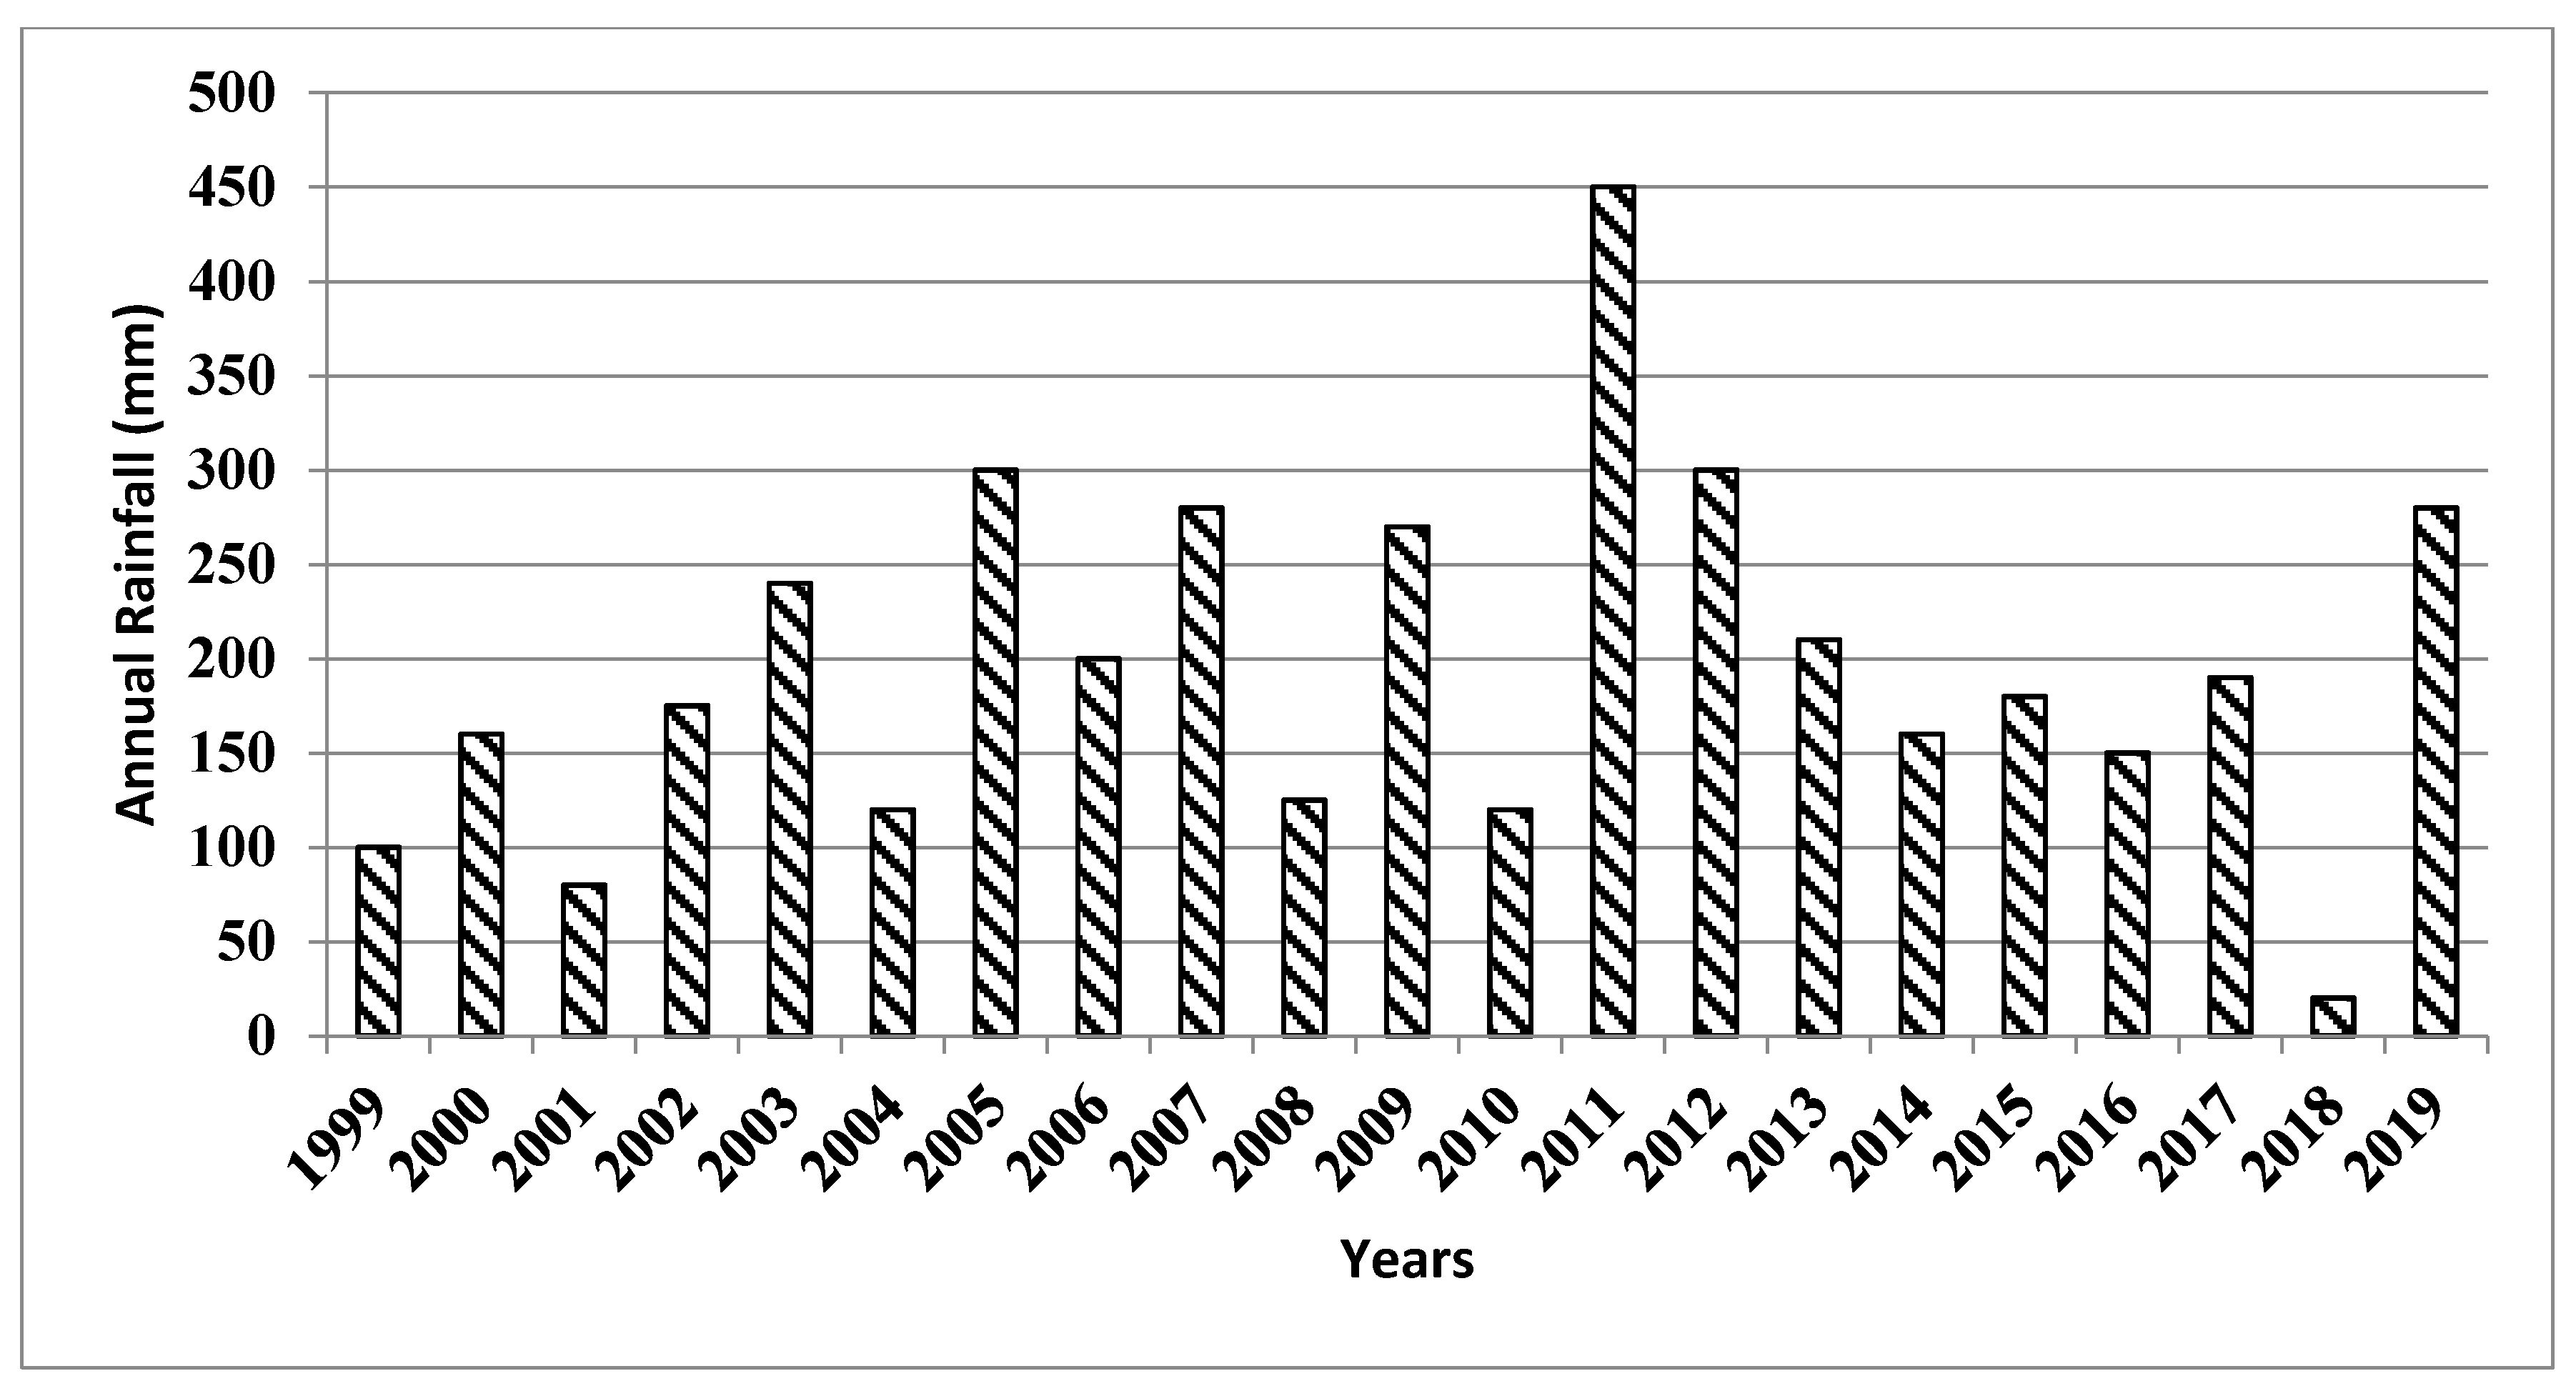
The results are based on the data collected from selected WASA Quetta tube wells. WASA fulfills approximately sixty percent of Quetta City’s water demand. For this purpose, four hundred and twenty-three (423) tube wells were installed in two groundwater aquifer zones of the city limits. Based on previously explained methodology, we want to assess different factors of these tube wells by selecting the sample tube wells in this area and apply a model for the selection of suitable solar systems for water pumping. Precipitation and temperature data have been collected from the Pakistan Meteorological Department (PMD) for the last 20 years. Figure 4 shows the average annual rainfall recorded in the city in the previous two decades; the average rainfall of Quetta City is 240 mm while the weather is semi-arid. The average maximum temperature is recorded at 30 °C, and the average minimum temperature is 7 °C.
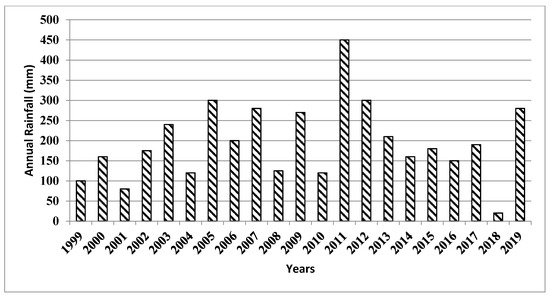
Figure 4.
Annual rainfall data collected by PMD in Quetta City for last 20 years.
The growing urbanization of Quetta City and the gain in several housing schemes in Quetta leads the demand for water to its peak. A significant increase was observed in the installation of government and private tube wells to meet this demand. The total number of tube wells installed in the last two decades by WASA is 277 in Quetta Valley. The city demand for water has increased because of population growth. Water is currently being supplied to the city by tube wells collecting fossil water. Total water extracted from the ground by WASA is approximately 21 million gallons/day, whereas 423 tube wells are in operation. These tube wells have been selected in the Zarghoon zone of Quetta Valley to study the variation in discharge while the water table is shown in Table 3.
Table 3.
Tube wells discharge and water table data for Zarghoon zone.
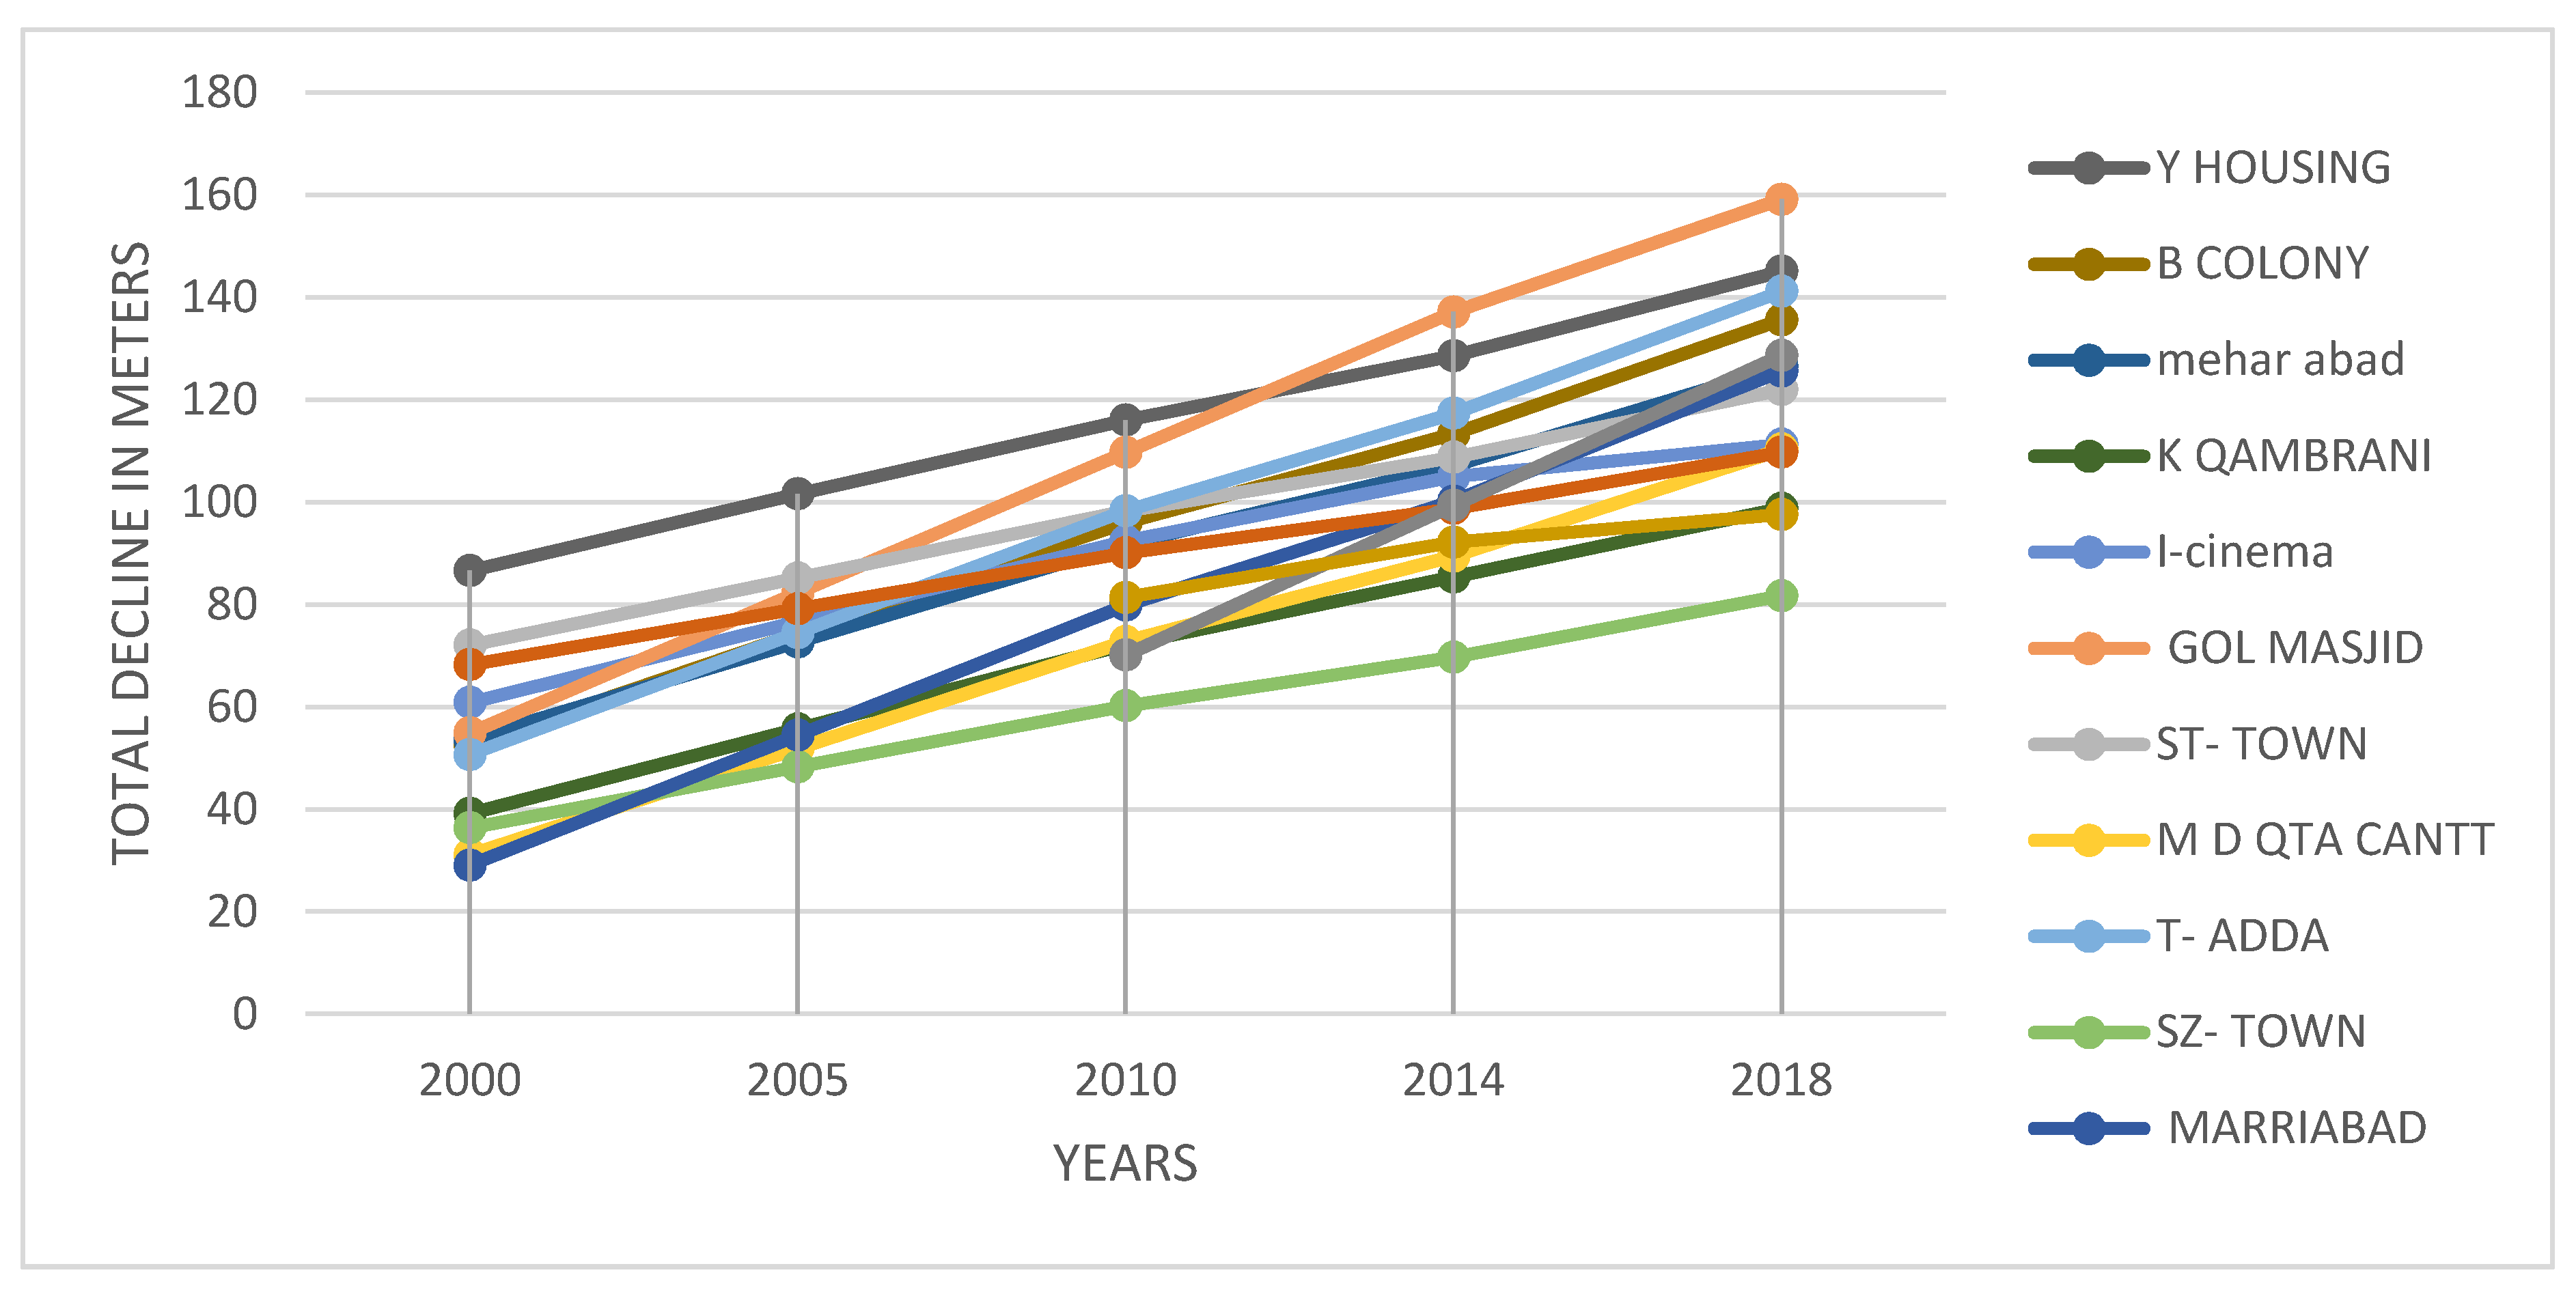
It has been observed that the discharge of zone 1 is reduced from 4 to 20% in areas, as shown in Figure 5. The maximum discharge reduction of 20% was observed by the Yousaf housing scheme, while the minimum discharge reduction of 4% was observed at Killi Qambrani. Similarly, the discharge of Satellite Town and Marri Abad was reduced by 19% and 16%, respectively. Variation in the water table has been observed at various points in zone 1, as shown in Figure 6. Water table declination rates have been recorded from their date of installation. The declination rate was observed from 2% to 8% m/year in various sampling points of zone 1. Figure 7 shows the total declination in meters from 2000–2019, in these areas. The declination was higher at the Sabzal Road tube well with a rate of 8 m/year, which is the southwest part of the city. Similarly, the declination was lower at Barech Abad with a rate of 2 m/year.
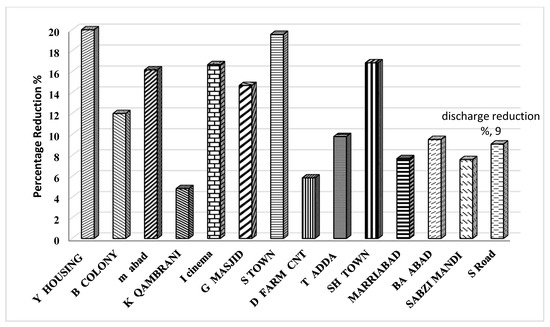
Figure 5.
Discharge reduction in zone 1 (Zarghoon).
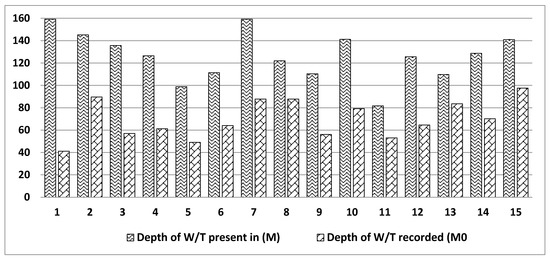
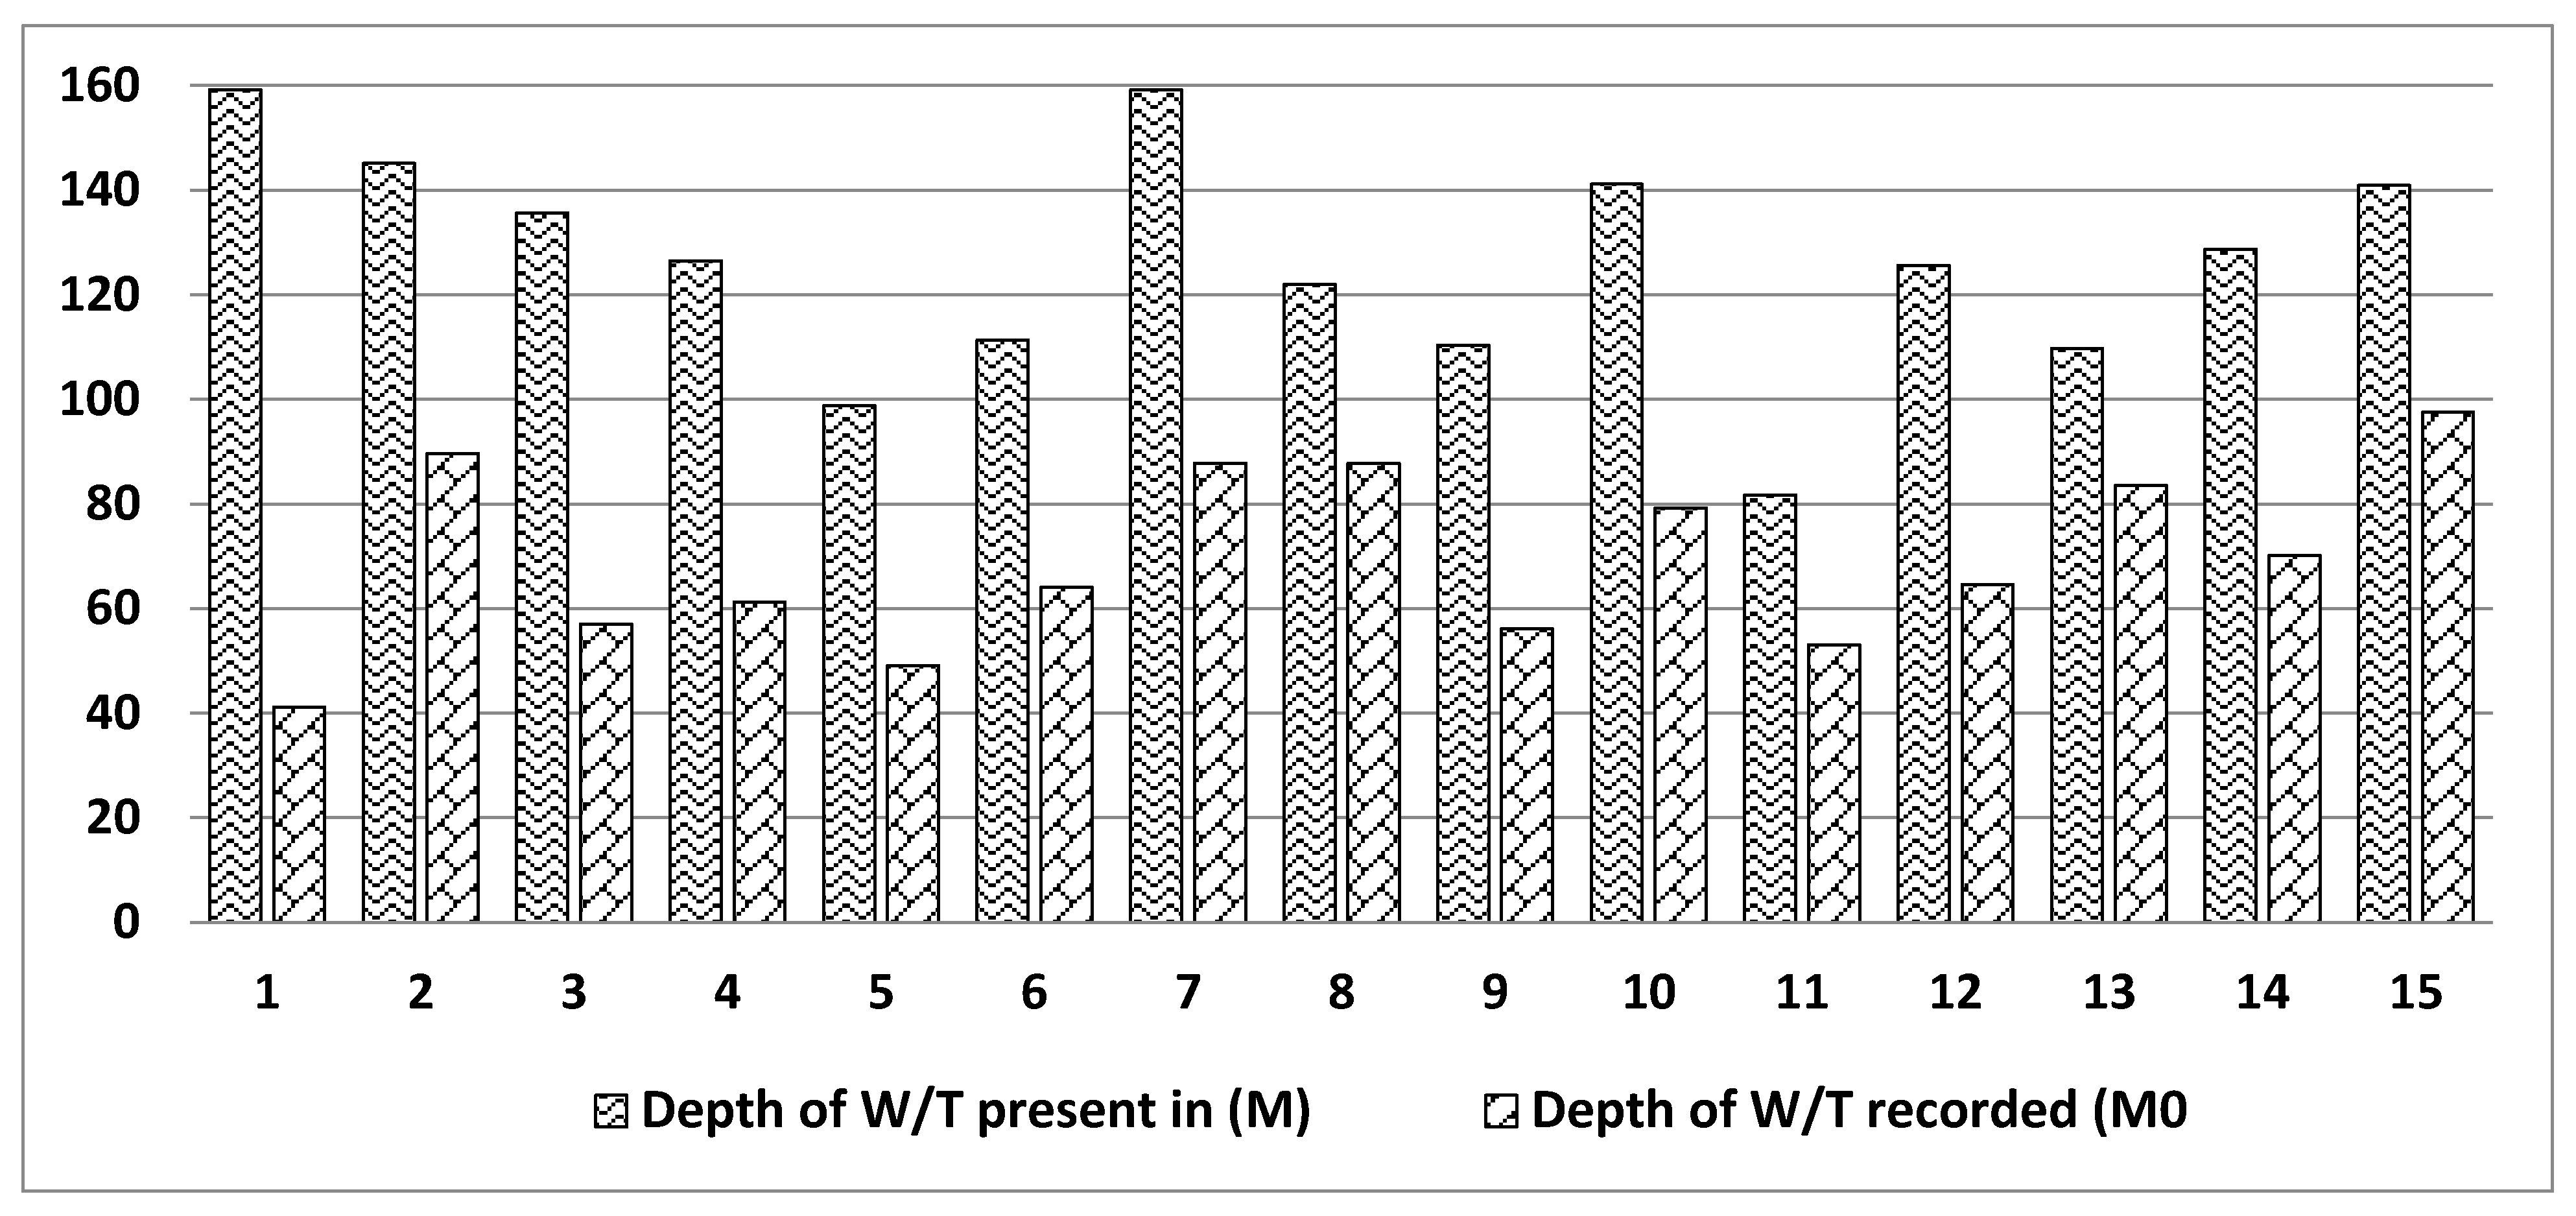
Figure 6.
Difference in the water table observed in zone 1 during 2018 since its installation.
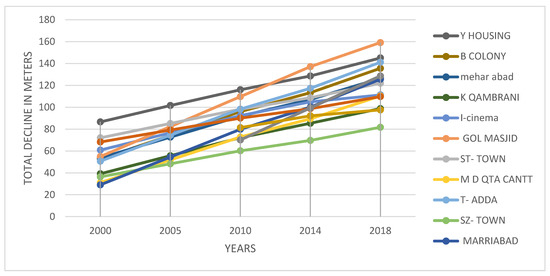
Figure 7.
Total declination in water table from 2000–2018 in sampling points of zone 1.
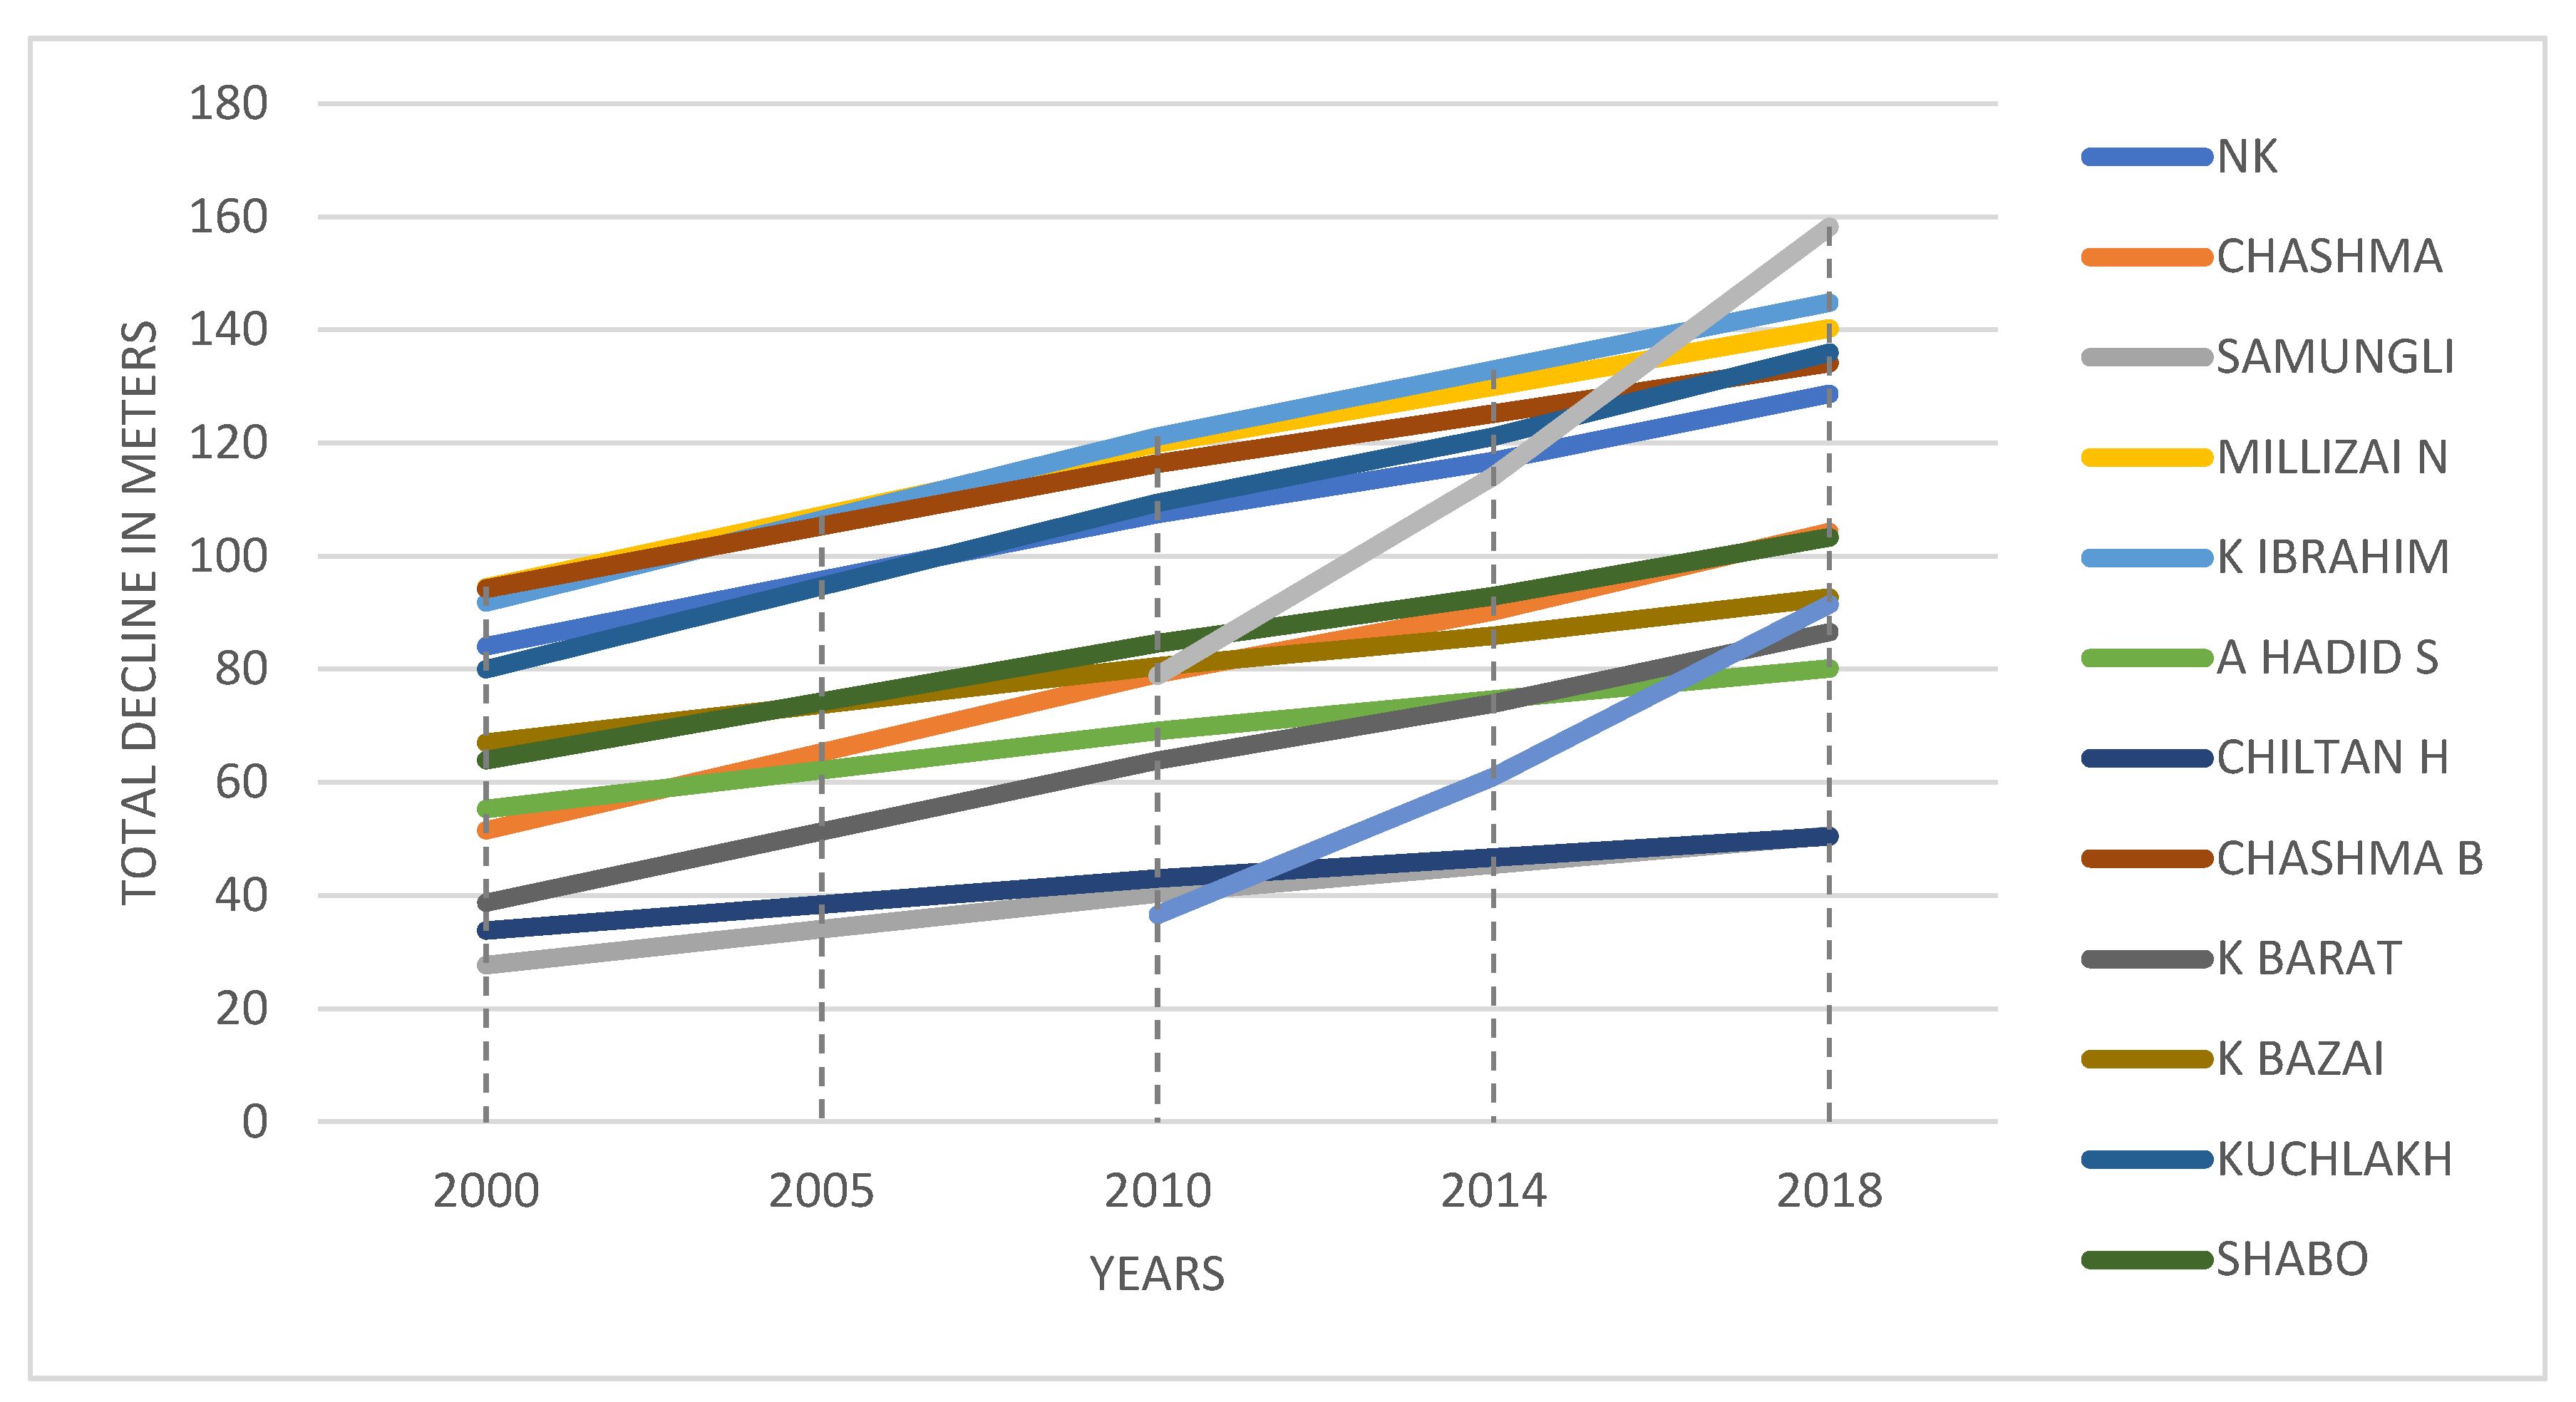
The Chiltan zone of Quetta Valley is the northern side of the city, which consists of the following areas: Nawa Killi, Killi Shabak, Sra Khula, Killi Nasaran, Chasma Achozai, Chiltan Housing, Killi Ibrhami, Al Hadid School, Killi Barat, Killi Bazai, Kuchlak, Shabo, and A.K. Road, each with a tube well, as shown in Table 4.
Table 4.
Tube wells discharge and water table data for Chiltan zone.
It has been observed that the discharge of zone 2 (Chiltan) is reduced by 4% to 19% in areas, as shown in Figure 8. A maximum discharge reduction of 19% has been observed in Nawa Killi, while the minimum discharge reduction of 4% was observed at Al Hadid Army Public School. Similarly, the discharge of Kuchlagh and Killi Barat was reduced by 18%, respectively. Variation in the water table has been observed at various points in zone 2. Water table declination rates have been recorded from their date of installation. The declination rate was observed at 1.5–5 m/year in various sampling points of zone 2. Figure 9 shows the total declination in meters from 2000–2019 in these areas. The declination was higher at the Arbab Karam Khan Road tube well with a rate of 5 m/year, which is the western part of the city. Similarly, the declination was lower at Al-Hadid Army Public School and Samugnli with a rate of 1.5 m/year.
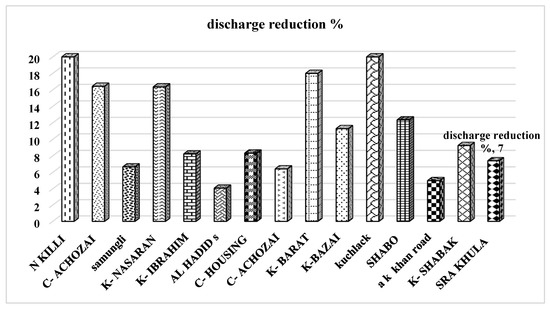
Figure 8.
Discharge reduction in zone 2 (Chiltan).

Figure 9.
Total declination in water table from 2000–2018 in sampling points of zone 2.
Electricity rate analysis has been defined by the power consumption of the motor and total operation hours in a day, as shown in Table 5. The solar modules have been selected from the Yingli Solar company [22]. The electricity rate base case was set to Rs. 14 per KWh, and the operation time is 8 h.
Table 5.
Electricity rate, base case analysis for different loads.
Total loads (PV units) and cost-benefit ratios for the different pump capacities are 5.5 KW, 11 KW, 15 KW, 18.5 KW, and 30 KW, as described in Table 6. Cost-benefit analysis for different pumps rating systems based on PV units system are explain in Table 7, was found by Renewable-energy and Energy-efficiency Technology Screening software, (RETScreen software). The cost of the pumps and inverter was taken from the solar photovoltaic company name Lorentz, while the development cost, labor cost, and miscellaneous expenses were taken from the local consultants and contractors in the area.
Table 6.
Cost-benefit analysis.
Table 7.
PV units, initial cost, and cost-benefit ratio for different combination.
The solar photovoltaic viability and cost-benefit analysis for these tube wells was carried out and the proposed pumps for this study are 18.5 KW and 30 KW. The total capital cost for these two pumps are 2.4 and 3.6 million rupees with a payback time of 4 and 3 years, respectively. In summary, the daily peak solar radiation in the area is 7 to 8 h which is rich in solar energy. The water table decline rate is 2–8 m/year with discharge reduction of 4–20% in Quetta Valley. The total replacement cost of 30 tube wells to SPVWP is 99.79 Million (PKR) with a payback time of 3–5 years. The cost-benefit ratio is between 2.05 and 3.92 for SPVWP. The detailed analysis of discharge reduction, water table fluctuations, and solar photo photovoltaic financial analysis was carried out and the following are the recommendations for researchers and engineers:
- The SPVWP should be recommended in the water deficit zone of Pakistan because of their efficiency, reliability, and cost-benefit ratio;
- The efficiency of SPV should be increased to achieve better results;
- The SPV system requires a large area, so compact systems should be preferred;
- The SPV system requires regular cleaning and minuteness for high efficiency;
- The temperature of SPV should be maintained by sprinkling water;
- The solar water pump should extract water at daytime so the low yielding borehole has time to refill.
5. Conclusions
This study aimed to assess the impacts of WASA tube wells on total discharge and water table in the valley aquifer and conducted a cost-benefit analysis of running these wells on the SPVWP system. The study revealed that the water table decline rate in the Zarghoon zone was observed at 2 to 5 m/year and discharge was reduced from 4 to 19%, while the water table decline rate in the Chiltan zone was observed between 2 and 8 m/year and discharge was reduced from 5 to 20%. Quetta receives the highest average solar radiation, due to which solar photovoltaic pumping is potentially efficient and economical. The solar photovoltaic viability and cost-benefit analysis for these tube wells has been carried out using RETScreen software. Using data of these tube wells, the CB ratio for different pumps was analyzed and it was noted that for five different pumps with power capacities of 5.5 KW, 11 KW. 15 KW, 18.5 KW, and 30 KW, the CB is 2.05, 3.52, 2.92, 2.52 and 2.97, respectively, while their payback period is 3–5 years. Based on the data analysis from 30 tube wells, it is recommended that two pumps having capacities of 18.5 KW should be installed for a shallow depth, and 30 KW for a deeper depth, depending on their discharge.
Author Contributions
The concept was conceived together by M.S.K., A.T. and W.U.K.T. and research data presented in this review paper was collected and structured by I.A., S.R., M.U., N.A.B., S.A. and M.R. All authors have read and agreed to the published version of the manuscript.
Funding
This research received no external funding.
Data Availability Statement
Not applicable.
Conflicts of Interest
The authors declare no conflict of interest.
References
- Chatzopoulos, T.; Domínguez, I.P.; Zampieri, M.; Toreti, A. Climate extremes and agricultural commodity markets: A global economic analysis of regionally simulated events. Weather Clim. Extrem. 2020, 27, 100193. [Google Scholar] [CrossRef]
- Yokomatsu, M.; Ishiwata, H.; Sawada, Y.; Suzuki, Y.; Koike, T.; Naseer, A.; Cheema, M.J.M. A multi-sector multi-region economic growth model of drought and the value of water: A case study in Pakistan. Int. J. Disaster Risk Reduct. 2020, 43, 101368. [Google Scholar] [CrossRef]
- Haider, S.; Ullah, K. Projected crop water requirement over agro-climatically diversified region of Pakistan. Agric. For. Meteorol. 2020, 281, 107824. [Google Scholar] [CrossRef]
- Mehmood, Q.; Mahmood, W.; Awais, M.; Rashid, H.; Rizwan, M.; Anjum, L.; Muneer, M.A.; Niaz, Y.; Hamid, S. Optimizing groundwater quality exploration for irrigation water wells using geophysical technique in semi-arid irrigated area of Pakistan. Groundw. Sustain. Dev. 2020, 11, 100397. [Google Scholar] [CrossRef]
- Bhutta, M.N.; Alam, M.M. Prospectives and limits of groundwater use in Pakistan. In Groundwater Research and Management: Integrating Science into Management Decisions; Sharma, B.R., Villholth, K.G., Sharma, K.D., Eds.; Malhotra Publishing House: New Delhi, India, 2006; pp. 105–114. [Google Scholar]
- Fienen, M.N.; Arshad, M. The international scale of the groundwater issue. In Integrated Groundwater Management; Springer: Berlin/Heidelberg, Germany, 2016; pp. 21–48. [Google Scholar]
- Khan, A.S.; Khan, S.D.; Kakar, D.M. Land subsidence and declining water resources in Quetta Valley, Pakistan. Environ. Earth Sci. 2013, 70, 2719–2727. [Google Scholar] [CrossRef]
- Hakhoo, N.; Bhat, G.M.; Pandita, S.; Hussain, G.; Haq, A.U.; Hafiz, M.; Ahmed, W.; Singh, Y.; Thusu, B. Natural hazards-their drivers, mechanisms and impacts in the Shyok-Nubra Valley, NW Himalaya, India. Int. J. Disaster Risk Reduct. 2019, 35, 101094. [Google Scholar] [CrossRef]
- Allouhi, A.; Buker, M.S.; El-houari, H.; Boharb, A.; Amine, M.B.; Kousksou, T.; Jamil, A. PV water pumping systems for domestic uses in remote areas: Sizing process, simulation and economic evaluation. Renew. Energy 2019, 132, 798–812. [Google Scholar] [CrossRef]
- Mukherjee, P.; Sengupta, T.K. Design and Fabrication of Solar-Powered Water Pumping Unit for Irrigation System. In Computational Advancement in Communication Circuits and Systems; Springer: Berlin/Heidelberg, Germany, 2020; pp. 89–102. [Google Scholar]
- Khair, S.M.; Mushtaq, S.; Reardon-Smith, K. Groundwater Governance in a Water-Starved Country: Public Policy, Farmers’ Perceptions, and Drivers of Tubewell Adoption in Balochistan, Pakistan. Groundwater 2015, 53, 626–637. [Google Scholar] [CrossRef] [PubMed] [Green Version]
- Khair, S.M.; Mushtaq, S.; Culas, R.J.; Hafeez, M. Groundwater markets under the water scarcity and declining watertable conditions: The upland Balochistan Region of Pakistan. Agric. Syst. 2012, 107, 21–32. [Google Scholar] [CrossRef] [Green Version]
- Owolabi, A.B.; Nsafon, B.E.K.; Roh, J.W.; Suh, D.; Huh, J.-S. Validating the techno-economic and environmental sustainability of solar PV technology in Nigeria using RETScreen Experts to assess its viability. Sustain. Energy Technol. Assess. 2019, 36, 100542. [Google Scholar] [CrossRef]
- Rathore, P.K.S.; Das, S.S.; Chauhan, D.S. Perspectives of solar photovoltaic water pumping for irrigation in India. Energy Strategy Rev. 2018, 22, 385–395. [Google Scholar] [CrossRef]
- Sharma, R.; Goel, S. Performance analysis of a 11.2 kWp roof top grid-connected PV system in Eastern India. Energy Rep. 2017, 3, 76–84. [Google Scholar] [CrossRef]
- Saleem, M. Benchmarking and Regulation for the Electricity Distribution Sector in Pakistan: Lessons for Developing Countries. South Asia Econ. J. 2007, 8, 117–138. [Google Scholar] [CrossRef]
- Mohanraj, M.; Chandramohan, P.; Sakthivel, M.; Kamaruzzaman, S. Performance of photovoltaic water pumping systems under the influence of panel cooling. Renew. Energy Focus 2019, 31, 31–44. [Google Scholar]
- Meunier, S.; Heinrich, M.; Quéval, L.; Cherni, J.A.; Vido, L.; Darga, A.; Dessante, P.; Multon, B.; Kitanidis, P.K.; Marchand, C. A validated model of a photovoltaic water pumping system for off-grid rural communities. Appl. Energy 2019, 241, 580–591. [Google Scholar] [CrossRef] [Green Version]
- Chandel, S.S.; Naik, M.N.; Chandel, R. Review of performance studies of direct coupled photovoltaic water pumping systems and case study. Renew. Sustain. Energy Rev. 2017, 76, 163–175. [Google Scholar] [CrossRef]
- Benghanem, M.; Daffallah, K.O.; Almohammedi, A. Estimation of daily flow rate of photovoltaic water pumping systems using solar radiation data. Results Phys. 2018, 8, 949–954. [Google Scholar] [CrossRef]
- Chilundo, R.J.; Neves, D.; Mahanjane, U.S. Photovoltaic water pumping systems for horticultural crops irrigation: Advancements and opportunities towards a green energy strategy for Mozambique. Sustain. Energy Technol. Assess. 2019, 33, 61–68. [Google Scholar] [CrossRef]
- Urban, F.; Geall, S.; Wang, Y. Solar PV and solar water heaters in China: Different pathways to low carbon energy. Renew. Sustain. Energy Rev. 2016, 64, 531–542. [Google Scholar] [CrossRef] [Green Version]


Publisher’s Note: MDPI stays neutral with regard to jurisdictional claims in published maps and institutional affiliations. |
© 2021 by the authors. Licensee MDPI, Basel, Switzerland. This article is an open access article distributed under the terms and conditions of the Creative Commons Attribution (CC BY) license (https://creativecommons.org/licenses/by/4.0/).