Article

A Simplified Approach to Estimate EV Charging Demand in Urban Area: An Italian Case Study

Fondazione LINKS, Via Pier Carlo Boggio, 61, 10138 Torino, Italy
*
Author to whom correspondence should be addressed.
Energies 2021, 14(20), 6697; https://doi.org/10.3390/en14206697
Submission received: 24 September 2021 / Revised: 12 October 2021 / Accepted: 12 October 2021 / Published: 15 October 2021
(This article belongs to the Section G1: Smart Cities and Urban Management)

Abstract

:
The development and the diffusion of the electromobility is crucial for reducing air pollution and increase sustainable transport. In particular, electrification of private mobility has a significantly role in the energy transition within urban areas, since the progressive substitution of conventional passenger cars by electric vehicles (EVs) leads to the decarbonisation of transport sector without direct emissions. However, increasing EV penetration in the market forces an expansion of the existing charging infrastructure with potential negative impacts on the distribution grid. In this context, a simplified approach is proposed to estimate the energy and power demand owing to the recharge of electric passenger cars within the city of Turin in Italy. This novel approach is based on the usage of floating car data (FCD) to identify the travel behaviour and parking habits of a non-EV passenger car in the city. Mobility data were then used to evaluate EVs energy consumption and charging needs considering different charging options (public or domestic) and range anxiety in different scenarios of EV diffusion. Aggregated load profiles and demand were finally evaluated both for the whole and for each zone of the city as possible resource for city planner or distribution system operators (DSO).

1. Introduction

Air pollution and the related health problems are still one of the main issues for people living urban areas [1]. The urban population is, in fact, exposed to concentrations of pollutants above the World Health Organisation (WHO) air quality guidelines in most of the EU countries. Consequently, decarbonisation of urban mobility is crucial to invert the current trend and increase the quality of life and health condition of the people living in cities [2]. The diffusion of electric vehicles (EVs) and the electrification of the road transport sector currently represents one of the main opportunity for reducing pollutant emission [3].
Recently, the EV penetration increased in almost all the EU countries due to the introduction of national support schemes [4], even if differences persist country by country, since the EV costs and the driving range are still barriers for large part of the users. Nevertheless, the progressive technology improvements of EV batteries [5], the cost reduction, and the potential integration of supercapacitors [6,7] can further boost the EV adoption.
However, a wide EV diffusion can lead to a deep impact on the existing electric grid infrastructure with overloads, voltage instabilities, and increased power losses [8]. For this reason, the estimation of EV charging demand is fundamental to evaluate these impacts and to identify possible strategies and solutions for improving the grid reliability to support the EV and renewable energy source (RES) diffusion [8,9,10]. For instance, grid reinforcement can increase the hosting capacity and consequently satisfy the increasing energy demand due to the electrification of the transport sector. As a result, reduction in the pollutant emissions are expected and higher environmental benefits could be obtained if RES local production supplied part of the charging demand [11].
Usually, energy demand can be estimated when data on the use of the charging infrastructure are available, as presented in [12], where aggregated charging profiles were obtained by a statistical combination of specific charging power dataset to evaluate the impact of EV charging on the distribution grid. Other similar approaches are proposed in [13,14] where the estimation of EV charging profile is based on data from public charging stations and big data, data driven and machine learning techniques are considered. A more simplified statistical approach is instead proposed in [15], where the charging demand in public stations is estimated through data from national surveys where potential charging location and mobility behaviours are investigated.
Alternatively, EV charging demand can be evaluated by the modelling of the mobility patterns capable to catch the traffic condition for EV in an urban context and the consequent arrival rate of the vehicles at the charging stations [16]. In this case the battery state of charge ( S o C ) at the beginning of the charging session and the consequent energy demand due to EV charging is randomly generated considering a Gaussian probability density function. The estimated electricity consumption from EV charging is instead based on consumer preferences for EVs, charging location (public and private), types of electric vehicle supply equipment and charging time of day in [17]. In particular, the energy demand is forecasted assuming the same driving pattern for all the users. In addition, the behaviour of EV users is also analysed in [18] to propose a spatial-temporal distribution prediction model of EV charging load solved by Monte Carlo simulation.
Although this wide literature deals with the estimation of EV charging demand, the mobility patterns of EVs are generally estimated through simulations or simplified assumptions. In this context, the usage of floating car data (FCD) can represent a solution for urban areas, since vehicle location, speed, and other information of vehicle trip can be collected in a dataset. Consequently, driving and parking habits of the users can be extracted from this type of dataset to reveal main patterns and how cars travel and park within different zones of a city [19,20]. However, most of the current literature limit the FCD usage to the traffic forecasting or the identification of potential congestion zones [19,21]. Only a recent study figured out the potentiality of FCD investigating the environmental impact of different electric mobility scenarios in the urban area of Rome [22], but electricity demand of EV charging is not evaluated.
In this paper, FCD are instead used to identify mobility habits of the users to estimate the energy demand due to EV charging in the urban area of Turin located in the northwest of Italy. In particular, the dataset of FCD is used here to evaluate how passenger cars travel and park within the different zones of the city. As a consequence, parking habits are used to identify potential charging location (domestic or public) where EVs can recharge. On the other hand, driving patterns extracted from FCD are considered to estimate EV battery consumption due to travelling and consequently to identify electricity demand during the charging sessions. Finally, assuming potential EV diffusion based on the Bass’s model, different scenarios of energy demand are evaluated considering range anxiety of the users.
The paper is organised as follows: in Section 2 the methodology concerning the FCD analysis and the estimation of EV diffusion are presented; in Section 3 the assumptions considered to calculate the EV energy consumption and the charging demand are presented; simulations and results of different scenarios are finally discussed in Section 4.

2. Methodology

The estimation of potential energy demand from EVs in an urban area is substantially based on three main aspects: the mobility patterns of the vehicles, the parking habits of the drivers and the diffusion rate of the electromobility. The first influences the electricity consumption of each EV due to travelling, the second reflects where the charging sessions can occur, while the latter is needed to consider the number of EVs potentially circulating within the city.
According to this approach, data about mobility patterns and parking habits of the users are crucial. Among others, floating car data (FCD) offer a more detailed description of the mobility [23], so FCD have been used here to better identify how passenger cars travel and where they park within the urban area. Similarly, the estimation of the diffusion of EVs, through a widely adopted methodology, such as Bass model, is also fundamental to identify the number of EVs in the future due to new adopters.
Consequently, both the FCD analysis and the Bass model adopted in this work are presented in the following sections.

2.1. Floating Car Data Analysis

In recent years, many technologies have been developed to deliver traffic data in the intelligent transport system (ITS) field. One of the most widespread is FCD technology, which is based on the data collection of vehicle location, speed, direction, and travel time through devices installed onboard. Such information allows various applications, including: traffic monitoring in real time, dynamic routing and fleet management. Two main types of FCD can be adopted:
  • GPS-based: the GPS onboard device communicates to the service provider by using the normal radio unit or via the cellular network. Thus, the system can pinpoint the exact location and movement of the vehicle;
  • Mobile-based: no special devices or hardware are installed onboard, but user’s mobile phone is used as sensor to identify the location and movement of the vehicle.
These technological solutions can be used both in EVs and in non-EVs. Thus, generally, FCD are not able to identify if a passenger car is an EV or a non-EV.
In this work, GPS-based FCDs, provided by an Italian mobile phone operator, were used. However, since the current EV diffusion in Turin is still marginal, the FCD used here should mostly refer to non-EVs. The data refer to a fleet of 35,535 vehicles, which travelled in the metropolitan area of Turin in November 2019. The FCD extracted from the onboard GPS were available in tabular format, so that each row provides the record of a part of the journey travelled by the vehicle. In other words, each record does not contain the information of the journey as a whole, but only a part of it, since the travel information is transmitted by GPS with a sampling between 2 and 5 min. Thus, each record is characterised by both a vehicle ID and a journey ID.
The total records collected are more than 24 millions, which describes almost 3 millions of trips travelled by the 35,535 vehicles in a month. However, a pre-processing stage performed in a three-steps procedure was needed to remove data error and to filter the data, as follows:
  • Data cleaning: to remove from the dataset the trips containing errors, mainly related to the location provided by the GPS;
  • Trips merge: consecutive trips with idle time between trips lower than 15 min on the same day were grouped to form a single trip;
  • Filtering: all trips whose distance travelled is less than 1 km and speed is less than 1 km/h have been removed from the dataset.
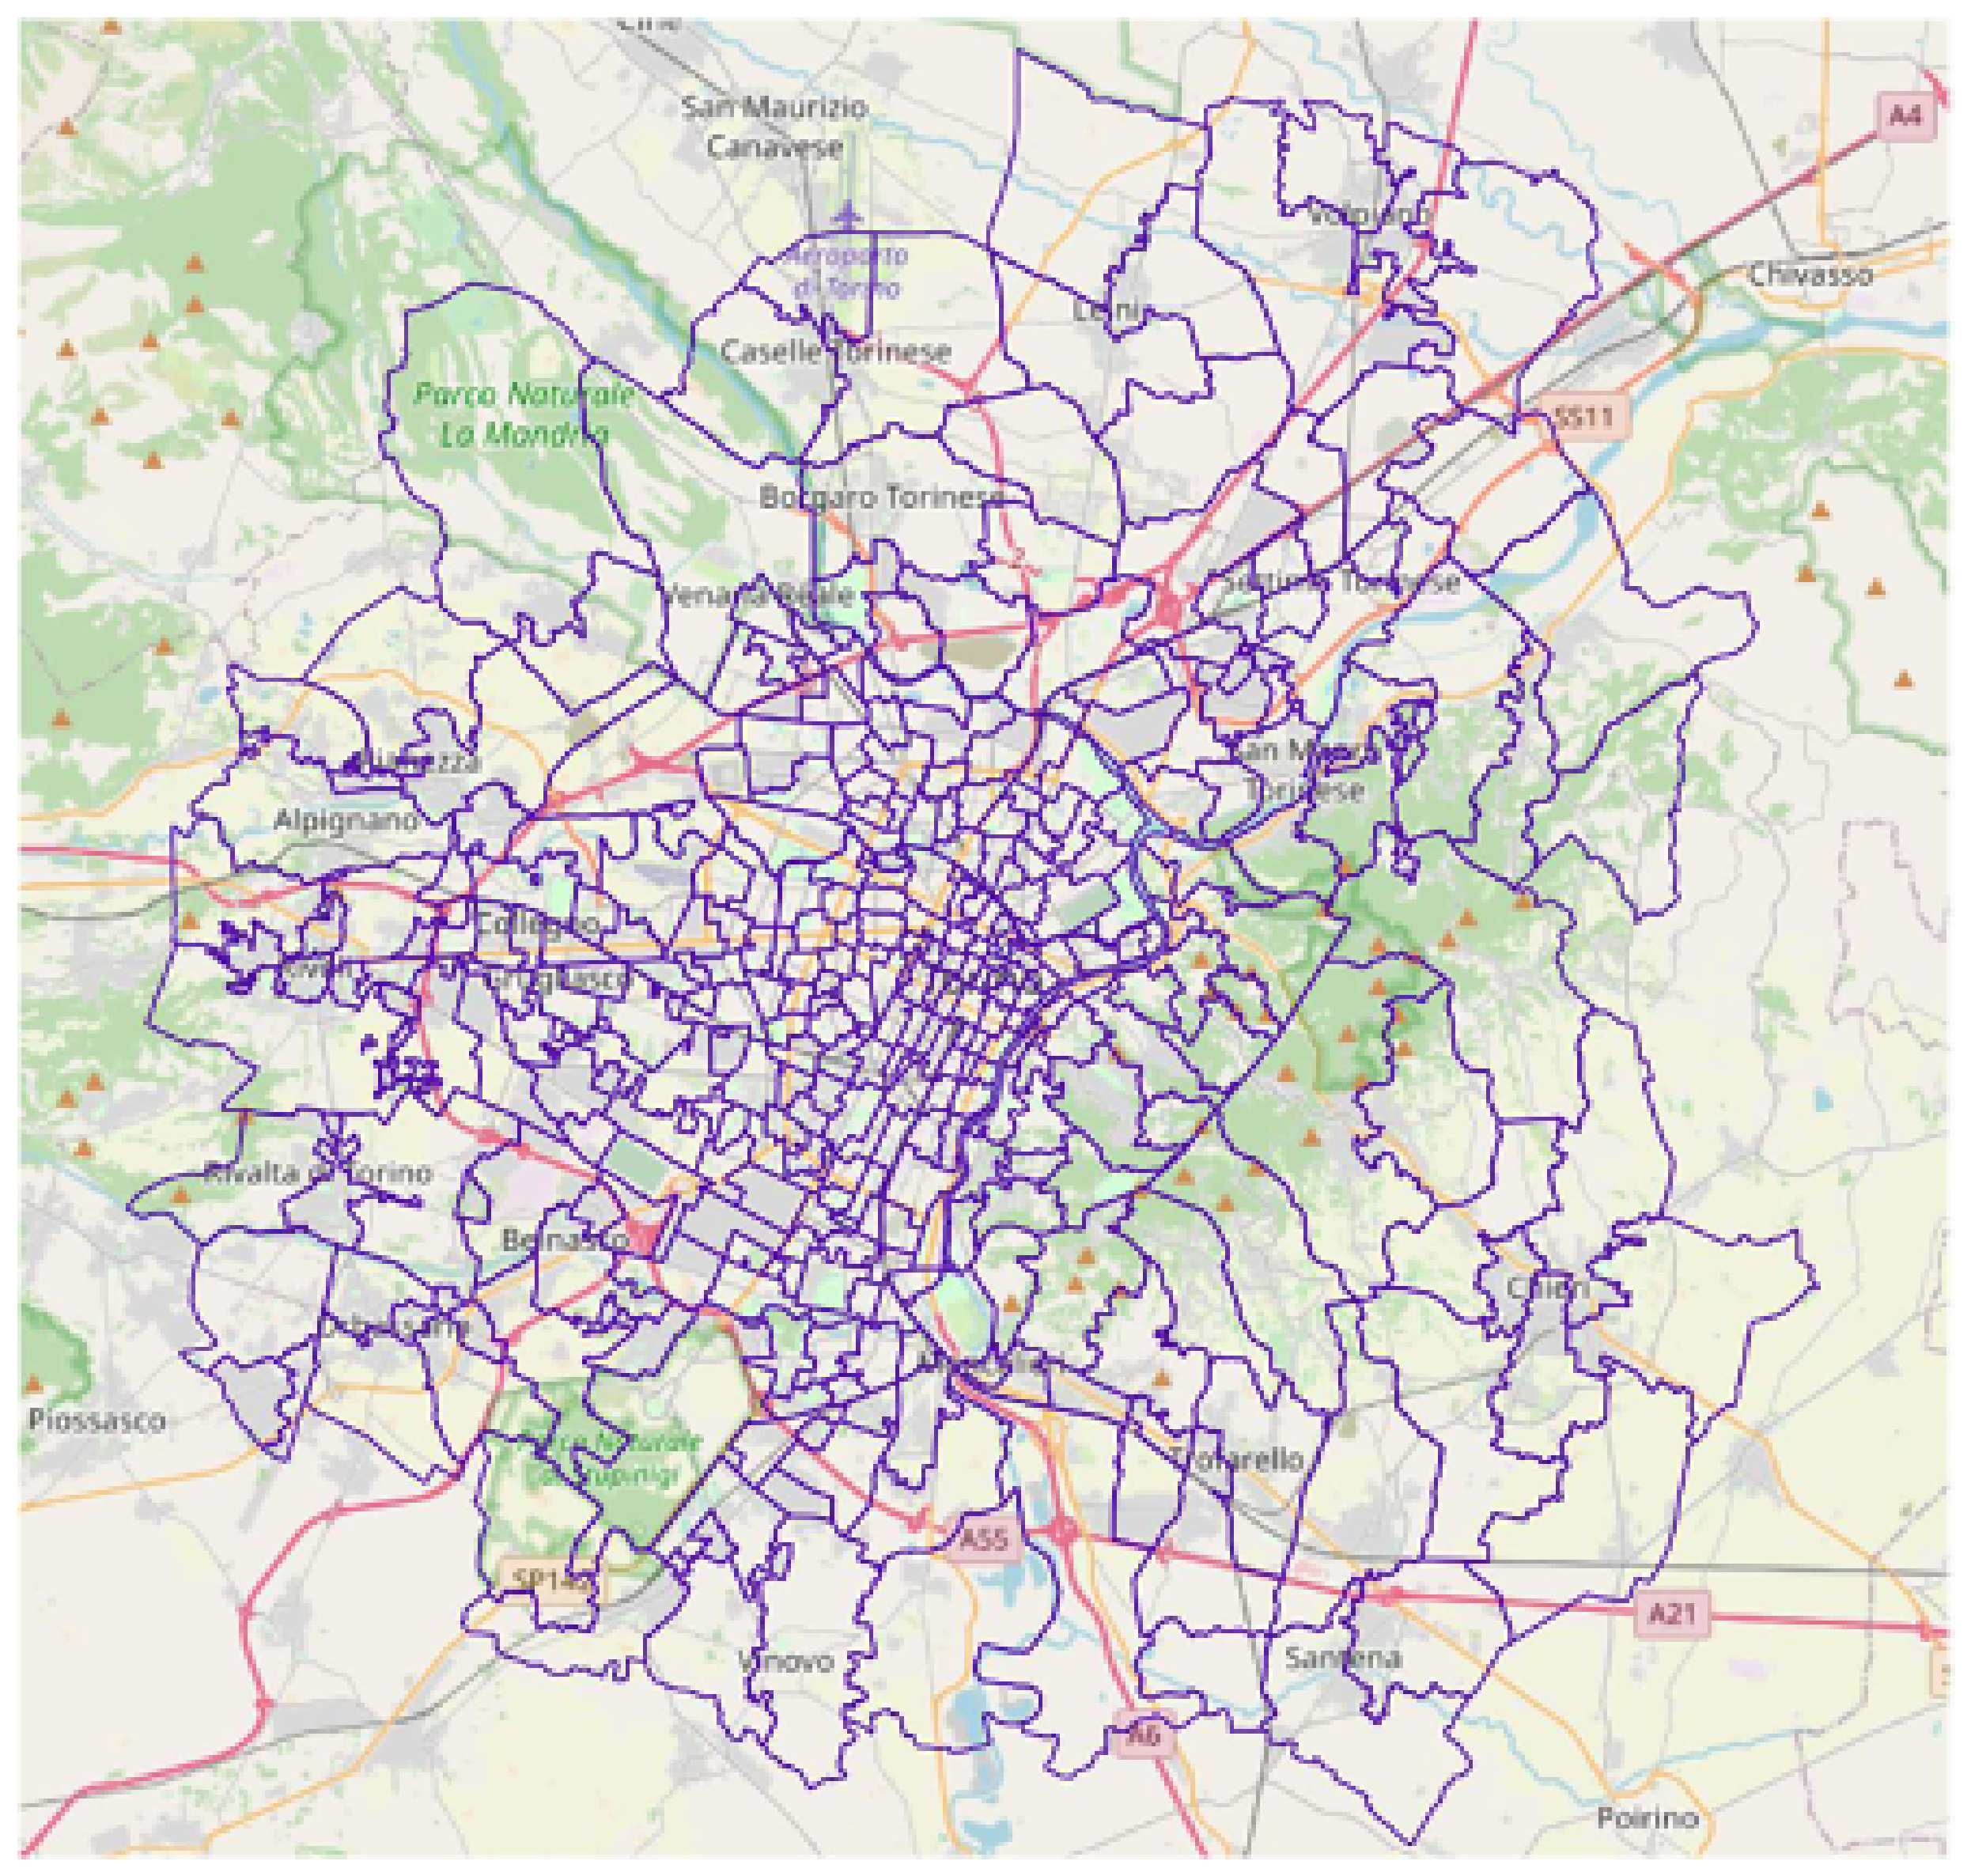
A zoning system was also used to aggregate the resulting data for modelling purposes [24]. The zoning provided by the public company managing the traffic data in Turin (5T) [25] includes 258 zones, composed by 166 areas within the municipality of Turin and 92 zones within the metropolitan area of Turin. The total area of Figure 1 covers about 636.42 km2 inhabited by 1.43 millions of people.
The analysis of the FCD obtained after the pre-processing stage shows that the majority of the trips (81%) takes place within the metropolitan area (i.e., internal trips); about 18% of trips originate or destine outside the metropolitan area (i.e., incoming/outgoing trips); a small part of travels (about 1%) are crossing trips (i.e., both origin and destination occur outside the metropolitan area of Turin).
Table 1 shows the results for the main indicators pointed out by the trips analysis where crossing trips are neglected. The number of daily trips on a weekday, Saturday and Sunday are substantially comparable in internal trips, while fewer average values can be observed for incoming or outgoing trips. This result is due to longer distance travelled by incoming or outgoing trips which corresponds to a lower frequency of daily trips. On the other hand, higher average speed is calculated for incoming/outgoing journeys compared to internal trips, since the latter are more affected by traffic congestion. Interesting results concern active parking time per trip (i.e., the average parking time between the first and the last trip of a day): the highest one occurs on weekdays (3.22 and 5.06 h for internal and incoming or outgoing trips, respectively), due to working activities. This result is in line with the results achieved for the distances travelled, because users with long trips usually spend more time at destination, resulting in an increased average parking time.
The results of FCD analysis were also validated for the municipality of Turin by a comparison with traffic data on hourly basis provided by the public company managing these data in Turin (5T). Significant similarities can be observed in Figure 2. In particular, the percentages of trips occurred during the morning and evening peak hours are comparable (with a maximum relative difference of around 1%), with the exception of Sunday, where the distribution obtained by FCD seems to slightly overestimate the number of trips.
Starting from the zoning presented in Figure 1, the origin–destination matrix (i.e., OD matrix) was then obtained using FCD. However, the OD matrix obtained from FCD sample refers to only around 35,000 vehicles (i.e., about 3% of the passenger cars registered in the municipality of Turin [26]). Therefore, the expansion of the FCD matrix to the universe was needed to be able to represent the Turin context, preserving the an appropriate level of information.
For this purpose, the OD matrix from FCD were compared with one from the public company managing traffic data in Turin (5T). In particular, weights were calculated for each zone of Figure 1 as the ratio between the number of trips originated in the 5T matrix and those presented in the FCD matrix.
These coefficients have been used within a simplified approach to expand the travel habits of vehicles in the FCD to the whole circulating fleet. In other words, expansion factors have been introduced so that each vehicle in the FCD is representative of a number of vehicles in the current circulating fleet. In a first approximation, this number is coincident to the weights identified for each zone. Thus, the FCD dataset was duplicated (and expanded) proportionally to the weights bringing the total number of vehicles to 48,428.
Subsequently, a further re-scaling of the number of vehicles was performed to make the FCD dataset more representative of the current average daily (estimated) number of vehicles circulating in the city of Turin. The circulating fleet in the city (see Table 2) has been estimated by elaborating the data from [27] and considering the daily trips per capita (2.88), as well as the occupancy rate of cars (1.33).
The further expansion of FCD dataset was carried out through a re-scaling based on the average number of circulating vehicles presented in Table 2 and on the different type of trips (internal, incoming or outgoing), bringing the total number of vehicles in the dataset equal to 171,222 close to the total estimated number in Table 2. This simplified procedure inevitably affects the results in some areas of the city of Turin. However, the results of energy demand and load profiles due to EV charging sessions could be more realistic.

2.2. Bass Model

As already observed, the diffusion of the electromobility is one of the fundamental parameters needed to identify the electricity demand due to EV charging. In fact, the energy demand is strictly correlated to the number of EVs circulating in a city: the higher the EVs, the higher the potential energy request. For this reason, an estimation of EVs circulating within a city have to be performed to evaluate future trends and demand.
In particular, the Bass model has been used here to identify the EV diffusion, since it is capable to describe the process of the diffusion of new products within a population [28]. As usually observed, the adoption of new technologies has a characteristic trend formed by three sequential steps: an initial phase with slow growth, followed by a faster growth phase due to the technology spreads and, finally, a saturation phase when technology is no longer perceived as new. This trend is mathematically explained by the Bass model considering two types of behaviours:
  • Innovators: consumers who adopt the technology first and are mainly influenced by “external communication” (e.g., mass media);
  • Imitators: consumers who adopt it later influenced by “internal communication” (e.g., word of mouth).
Based on these assumptions, the Bass model calculates the likelihood of adopting the new technology, by consumers, at a given time t as:
P ( t ) = p + q N ( t 1 ) M
where N ( t 1 ) is the cumulative of the new adopters before t time, M is the maximum number of new technology users, p and q are the “innovative” and the “imitative” coefficient, respectively. Even if M is usually well known, the coefficients p and q can be estimated by two alternative methods:
  • Through historical sales data;
  • The ‘by analog’ approach, by considering the diffusion of similar product.
However, the diffusion of EV in the city of Turin is still on an initial stage (i.e., around 0.1% for BEV and 0.067% for PHEV), thus the ‘by analog’ approach was used in this case. In particular, three possible analogs were considered:
  • Data of the diffusion of hybrid (HEV) cars in Italy [29,30];
  • Data of the diffusion of cars fuelled by natural gas (CNG) in Italy [29,30];
  • A previous study developed for electric cars in Northern Europe by [31].
The scenario with lower diffusion (see Figure 3) corresponds to the curve obtained by considering the study of Jensen et al. [31], instead the higher diffusion is obtained in the analog with CNG vehicles. An intermediate scenario is instead represented by the analog with HEV vehicles.
The estimated coefficients of the Bass model and diffusion rate of EV for the different approaches are highlighted in Table 3 and Table 4 by assuming two potential time horizon at 2030 and 2035.
Table 4 shows how the estimated diffusion rate of EV in the city of Turin at 2030 is substantially from 1.3% to 5.6%, while the diffusion is in a range from 3.5% to 26.6% at 2035. However, the estimation of EV diffusion pointed out by HEV analog appears in an average position compared to the others, so this type of approach was considered as the reference for the diffusion of EV in this work. Therefore, a diffusion rate of 2.4% and 8.8% was assumed in 2030 and 2035. In particular, these diffusion rates have been considered to identify, in the following sections, the number of EVs as portion of the whole circulating fleet.

3. Assumptions

As already mentioned, the dataset of FCD can represent the mobility and parking habits of the vehicles in the circulating fleet of the city of Turin, by adopting appropriate expansion factors. In this way, each vehicle in the FCD dataset is representative of a certain number of vehicles in the circulating fleet. Assuming that a portion of these vehicles are electric (based on the results of the Bass’s model) and assuming that the mobility and parking habits of the users remain unchanged, an estimation of the energy demand during charging sessions can be performed.
However, further assumptions are needed to better identify the characteristics of the charging sessions. These assumptions are described in the following sections.

3.1. Location and Power of Charging Sessions

A recent literature analysis [32] highlights how 50% of Italian users living in a large city or metropolitan area park their own cars in a private parking space (e.g., a garage).
According to this result, 50% of future EVs circulating in the city of Turin could be parked in a private place. As a consequence, a domestic recharge can be assumed at home for these EVs through wallbox, without the use of public charging infrastructure, while a public recharge can be assumed for the 50% of EVs without an available private parking space. In this case, the EV charging session is assumed to be exploited in the zone of the city with higher parking time.
Hence, EVs can mainly perform two types of charging sessions accordingly to the current characteristics of the domestic and public charging infrastructure available in Italy [33]:
  • Domestic charging of 4 kW if an EV has a private parking place at home;
  • Public charging of 22 kW if the EV is parked in a public parking place.
Under these assumptions, the following characteristics of daily travel and parking have been extracted for each vehicle from the expanded FCD dataset considering the busiest day of November 2019 (i.e., 25 November):
  • The zone O i where the vehicle starts its first trip of the day (i.e., it represents the zone where users with private parking space can potentially have a domestic recharge);
  • The time when the vehicle arrived in O i the day before (i.e., it represents the time when users with private parking space can potentially start a domestic recharge);
  • The time when the vehicle departs from O i for the first trip of the day, (i.e., it represents the time when users with private parking space stop a domestic recharge);
  • The zone D j where the vehicle stops for the longest time after the first and before the last trip of the day, (i.e., it represents the zone where users without private parking space can potentially have a public recharge);
  • The time when the vehicle arrives in D j , (i.e., it represents the time when users without private parking space can potentially start a public recharge);
  • The time when the vehicle departs from D j , (i.e., it represents the time when users without private parking space can potentially stop a public recharge);
  • The cumulative distance travelled by the vehicle to reach D j throughout the day, (i.e., it is related to the energy consumption of battery EV before a public recharge).
When a vehicle included in the FCD dataset is assumed as EV, all these data have been used to identify the zone and the timing of the domestic and public charging, as well as the energy demand.

3.2. Duration and Energy Demand of Charging Sessions

The definition of the new dataset with the characteristics and information summarised in the previous section is closely connected to the previously identified charging options (domestic or public). From the Bass model the number of EV potentially circulating in the city of Turin can be randomly generated. Then, 50% of EVs are assumed to be recharged in O i at constant power of 4 kW (standard power for home charging in Italy) and 50% of vehicles recharge at the corresponding D j (where the vehicle stops longer) at a constant power of 22 kW (standard power for public charging in the city of Turin).
In both cases, the energy demand of each EV during the charging session depends on the distance travelled. For this reason, a maximum driving range ( E R m a x ) was first set for all EVs, which corresponds to the distance that can be travelled by the EV without the need to recharge. Of course, the E R m a x corresponds to a state of charge ( S o C ) of the EV batteries equal to 100%.
The decrease in S o C and the corresponding level reached by the EV before charging depends on the travelled distance T D . In fact, if the remaining EV driving range E R can be defined, as follows:
E R = E R m a x T D
the S o C reached by the EV battery before charging, can be calculated, as follows:
S o C = E R E R m a x · 100
The S o C was also associated with a specific lower bound S o C m i n in order to preserve the battery lifetime as much as possible, by limiting the depth of discharge ( D o D ). Under the assumption of a fully recharge up to 100% for each vehicle, the amount of energy required during the charging session can be calculated, as follows:
E E V = 1 S o C 100 · E R m a x · μ
where μ represents the average energy consumption of an EV.
The driving range, battery size, minimum S o C , and the average EV consumption used in this work are summarised in Table 5, which correspond to data of an average representative EV belonging to the B segment of the market [34].
Once the energy demand was calculated by Equation (4) the corresponding duration of the charging session (domestic or public) can be defined, as follows:
C T = E E V P
where P represents the power required during the charging session.
However, the duration of the recharge was also compared with the parking time of the EV both in domestic and public recharge. If the C T is higher than the parking time, the charging time was assumed equal to the parking time and the energy demand calculated accordingly, so that EV could be not fully charged.

4. Results

All the the mobility patterns and parking habits of the users and the assumptions identified in the previous sections were then used to calculate and estimate the power and electricity demand due to EV charging in each zone of the city of Turin.
The results were obtained on the simplified assumption that the current and the future charging infrastructure is always capable to meet users’ demand for EV charging (i.e., there are no infrastructural limitation in the supply of EV charging). Moreover, energy demand and the corresponding load profiles for charging EVs was assessed on hourly basis in each zone of the city of Turin.

4.1. Simulated Scenarios

The electricity demand and the related load profiles due to the charging of EV have been identified for each zones of the city of Turin, considering 6 different possible scenarios (see Table 6). These scenarios differ from each other for the level of EV diffusion and for charging habits. In particular, a short and a medium time horizons have been considered (i.e., 2030 and 2035, respectively), while three levels of range anxiety have been assumed to simulate different charging behaviour, as follows:
Therefore, Scenarios 1a and 2a represent conditions in which range anxiety is not particularly relevant, since users will charge EVs when the S o C of the batteries is less than 40%. Conversely, Scenarios 1c and 2c identify conditions where users need to recharge more frequently due to higher range anxiety, since users need to charge EVs when the S o C of the batteries is lower than 80%.

4.2. Results at 2030

Figure 4 shows the aggregated energy demand and the load profiles due to EV charging, obtained by summing up the hourly load profiles of all the zones of the city of Turin for Scenarios 1a, 1b, and 1c, respectively. Additionally, Figure 4 also identifies domestic (blue bars) and public charging (green bars).
As expected, the former have a greater impact during evening/night period, since users will charge at home after the last trip of the day. Conversely, the latter is more significant during daytime since users could usually charge EV on street at public infrastructures. In this context, considering the estimated EV diffusion at 2.4%, about 4000 EVs could be in circulation within the city of Turin.
It is noticeable that a peak demand between h.9.00 and 10.00 in the morning is observed in all the 2030 scenarios with values ranging between 1.41MW and 4.25 MW. These peaks are mainly due to public charging that requires higher power with respect to domestic one. Further peaks demand, lower than those during daytime, can be observed at night and evening with values ranging between 1.1 MW and 2.7 MW. These lower peaks are instead mainly due to domestic charging. The trend of these peaks are similar to those observed in [18] considering both residential (i.e., domestic) and public charging.
On the other hand, Figure 5 provides a summary of the results obtained for the different scenarios at 2030. It can be noticed that the number of EV charging increases with the range anxiety, because of more frequent need to charge. In fact, about 16% of circulating EV need to be charged in Scenario 1a, while the share of EVs that need to be charged rises to 61% in Scenario 1c. Similarly, the daily electricity demand required to the grid increases from about 21 MWh (Scenario 1a) to about 51 MWh (Scenario 1c).
Figure 6 shows instead how electricity demand is distributed among the various zones of the city of Turin in the most critical scenario for the distribution grid (i.e., Scenario 1c with higher range anxiety) at the daytime peak (h 9.00–10.00) and during evening/night (h 20.00–21.00), respectively. Generally, the average power required to the grid during morning peak will not exceed 200 kW in all the zones of the city of Turin, while the average power demanded to the grid will not exceed 150 kW during evening/night peak.
Finally, for Scenario 1c, the duration curves of charging sessions and the energy required by both public and domestic recharges are also represented in Figure 7 and Figure 8.
From these figures it can be noticed that, almost all EVs in domestic charging (i.e., around 1100 as highlighted in Figure 7), which perform slow charging at low power (i.e., 4 kW), have a duration of the charging session generally greater than 150 min (i.e., approximately 2.5 h) with an energy demand higher than 10 kWh. On the other hand, almost all EVs in public charging (i.e., around 1200 as highlighted in Figure 7), which perform a faster charge at 22 kW, have a duration of the charging session slightly higher than 25 min with an energy demand higher than 10 kWh.
Moreover, about 50% of EVs with domestic charge have long charging session (i.e., more than 6 h), while about 50% of EVs with public charging have a duration of the charging session longer than 1 h. The energy demand from EV is instead more than 20 kWh for both types of charging (domestic and public). Obviously, a decreasing number of EVs perform charge for longer times and with greater energy demands. In particular, only 11% of domestic charge are close to 10 h, as well as only 12% of vehicles in public charging have charging times close to 1.75 h.

4.3. Results at 2035

Similarly to the previous section, Figure 9 shows the estimation of the aggregated energy demand and the load profiles due to EV charging in 2035, obtained by summing up the hourly load profiles of all the zones of the city of Turin for Scenarios 2a, 2b, and 2c, respectively. Figure 9 also reports how the load profiles are related to domestic (blue bars) and public charging (green bars).
As already observed when lower EV diffusion is expected in 2030, the domestic charging have a greater impact during evening/night period, since users will mainly charge at home after the last trip of the day. Oppositely, the public charging is more significant during daytime since users could prefer to charge EV on street at public infrastructures close, for instance, to working or leisure place, such as an office or shopping mall. In this context, considering the estimated EV diffusion of 8.8% in 2035, about 14,800 EVs could be in circulation within the city of Turin.
A peak demand between 9 and 10 in the morning can be observed in all the 2035 scenarios with values ranging between 6.24 MW and 17.22 MW. These peaks are mainly due to public charging that requires higher power during charging sessions with respect to domestic one. Further peaks demand, lower than those during daytime, can be observed at night or evening with values ranging between 4.12 MW and 10.12 MW. These lower peaks are instead mainly due to domestic charging.
On the other hand, Figure 10 provides a summary of the results obtained for the different scenarios in 2035. It can be noticed that the number of EV charging increases with the range anxiety, because of more frequent need to charge EVs. In fact, about 15% of circulating EV need to be charged in Scenario 2a, while the share of EVs that need to be charged rises to 62% in Scenario 2c. Similarly, the daily electricity demand required to the grid increases from about 74 MWh (Scenario 2a) to about 188 MWh (Scenario 2c).
Figure 11 shows instead how electricity demand is distributed among the various zones of the city of Turin in the most critical scenario for the distribution grid (i.e., Scenario 2c with higher range anxiety) at the daytime peak (h 9.00–10.00) and during evening/night (h 20.00–21.00), respectively. Generally, the average power required to the grid during morning peak will not exceed 600 kW in all the zones of the city of Turin, while the average power demanded to the grid will not exceed 400 kW during evening/night peak.
Finally, for Scenario 2c, the duration curves of charging sessions and the energy required by both public and domestic recharges are also represented in Figure 12 and Figure 13.
As already observed for results in 2030, these figures show that almost all EVs in domestic charging (i.e., around 4100 as highlighted in Figure 12), which perform slow charging at low power (i.e., 4 kW), have a duration of the charging session generally greater than 150 min (i.e., approximately 2.5 h) with an energy demand higher than 10 kWh. On the other hand, almost all EVs in public charging (i.e., around 4400 as highlighted in Figure 12),which perform a faster charge at 22 kW, have a duration of the charging session slightly higher than 25 min with an energy demand higher than 10 kWh.
Additionally, about 50% of EVs with domestic charge have long charging session (i.e., more than 6 h), while about 50% of EVs with public charging have a duration of the charging session longer than 1 h. The energy demand from EV is instead more than 20 kWh for both types of charging (domestic and public). Obviously, a decreasing number of EVs perform charge for longer times and with greater energy demands. In particular, only 11% of domestic charge are close to 10 h, as well as only 12% of vehicles in public charging have charging times close to 1.75 h.

5. Conclusions

The estimation of the impact of EV charging is currently fundamental to plan potential grid reinforcement to foster the diffusion of the electromobility in urban areas. In this context, a simplified methodology is proposed here based on the use of mobility data from floating car data (FCD) to estimate charging needs of EV taking into account possible charging behaviour of users. The estimated electricity demand in terms of load profiles for the different zones of the city represent an interesting opportunity for a DSO or City Planner to better understand if and where a grid reinforcement or an improvement of the charging infrastructure is needed within the city.
In the proposed approach, mobility and parking habits were extracted from FCD to identify how and when passenger cars travel and park within the urban area. Then, this result was expanded to the whole city according to existing data to fit the results with the reality of the study case, since FCD usually represent only a portion of the total mobility of a city. Later, the number of EVs has been estimated as part of the whole circulating fleet according to the Bass’s model considering two different time horizon (2030 and 2035). Finally, different charging behaviours have been assumed for the users considering different range anxiety (i.e., users charge when battery S o C is lower than 40%, 60%, or 80%) and charging location (domestic or public). Consequently, different scenarios were simulated to evaluate the load profiles of each zone for an urban case study (i.e., the city of Turin) due to EV charging.
Results show that higher peak loads are related to public charging in the morning, while lower peaks are observed in the evening/night hours related to domestic charging. In fact, according to the assumed users charging behaviour, the public charging is more frequent during daylight at higher power, but the domestic one mainly occurs in the evening at lower power.
Of course, relatively lower impact is observed for scenario with low range anxiety and EV diffusion (i.e., 2030). In this case peak load is close to 1.41 MW with a daily energy demand close to 21.1 MWh. In contrast, the worst condition (i.e., maximum grid impact) is observed in the scenario with a high range anxiety (i.e., users need to charge when battery S o C is lower than 80%) by 2035 (i.e., with higher EV diffusion). In fact, this scenario corresponds to a peak load of 17.2 MW and a daily energy demand of 188 MWh. However, the average power required to the grid during morning peak will not exceed 600 kW in each zone of the city of Turin by 2035.
Further research will be developed in future since results highlighted in this paper could be also potentially used to investigate how smart charging solutions can reduce the impact of EVs charge. In fact, the estimated electricity demand can be adopted as a reference profile to be compared to one obtained by the integration of smart charging algorithm. Additionally, improvements of the present methodology will be developed in future to better modelling user charging behaviour and mobility habits when limited availability of FCD occurs, in order to estimate EV charging demand and its impact at urban level based on a more statistical approach. For instance, logistic regression model will be adopted to modify the distribution of domestic and public charging to better identify charging preferences of the EV users.

Author Contributions

Conceptualisation, M.A., C.B., B.C. and P.L.; methodology, M.A., C.B., B.C. and P.L.; software, P.L. and B.C.; validation, P.L., C.B. and B.C.; formal analysis, P.L., C.B. and B.C.; data curation, P.L. and B.C.; writing—original draft preparation, P.L.; writing—review and editing, M.A., C.B. and B.C.; supervision, M.A. and B.C. All authors have read and agreed to the published version of the manuscript.

Funding

This research was funded by IREN s.p.a.

Institutional Review Board Statement

Not applicable.

Informed Consent Statement

Not applicable.

Data Availability Statement

Data concerning market of passenger cars are available at https://www.aci.it/laci/studi-e-ricerche/dati-e-statistiche/open-data.html and http://www.unrae.it/dati-statistici/immatricolazioni (both accessed on 10 September 2021).

Acknowledgments

The authors would like to thank IREN s.p.a. in supporting the research activities presented in this work and 5T s.r.l. for providing zoning data of the municipality of Turin.

Conflicts of Interest

The authors declare no conflict of interest.

Abbreviations

The following abbreviations are used in this manuscript:
C T Charging time
D o D Depth of discharge
D j Zone where a vehicle stops for the longest time
DSODistribution system operator
E R Remaining driving range of an EV
E R m a x Maximum driving range of an EV
EVElectric vehicle
FCDFloating car data
ITSIntelligent transport system
O i Zone where a vehicle start daily trips
S o C State of charge
T D Travelled distance by an EV

References

  1. European Environment Agency (EEA). Urban Air Quality. Available online: https://www.eea.europa.eu/themes/air/urban-air-quality (accessed on 10 September 2021).
  2. European Commission. A European Strategy for Low-Emission Mobility. Available online: https://eur-lex.europa.eu/resource.html?uri=cellar:e44d3c21-531e-11e6-89bd-01aa75ed71a1.0002.02/DOC_1&format=PDF (accessed on 10 September 2021).
  3. Rizza, V.; Torre, M.; Tratzi, P.; Fazzini, P.; Tomassetti, L.; Cozza, V.; Naso, F.; Marcozzi, D.; Petracchini, F. Effects of deployment of electric vehicles on air quality in the urban area of Turin (Italy). J. Environ. Manag. 2021, 297, 113416. [Google Scholar] [CrossRef] [PubMed]
  4. European Alternative Fuels Observatory (EAFO). Available online: https://www.eafo.eu (accessed on 10 September 2021).
  5. Burd, J.T.J.; Moore, E.A.; Ezzat, H.; Kirchain, R.; Roth, R. Improvements in electric vehicle battery technology influence vehicle lightweighting and material substitution decisions. Appl. Energy 2021, 283, 116269. [Google Scholar] [CrossRef]
  6. Ren, R.; Wang, H.; Chen, C.; Wang, J. An energy conservation and environmental improvement solution-ultra-capacitor/battery hybrid power source for vehicular applications. Sustain. Energy Technol. Assess. 2021, 44, 100998. [Google Scholar] [CrossRef]
  7. Kumar, Y.A.; Kumar, K.D.; Kim, H. Reagents assisted ZnCo2O4 nanomaterial for supercapacitor application. Electrochim. Acta 2020, 330, 135261. [Google Scholar] [CrossRef]
  8. Hussain, M.T.; Sulaiman, B.N.; Hussain, M.S.; Jabir, M. Optimal Management strategies to solve issues of grid having Electric Vehicles (EV): A review. J. Energy Storage 2021, 33, 102114. [Google Scholar] [CrossRef]
  9. Egert, R.; Daubert, J.; Marsh, S.; Muhlhauser, M. Exploring energy grid resilience: The impact of data, prosumer awareness, and action. Patterns 2021, 2, 100258. [Google Scholar] [CrossRef] [PubMed]
  10. Fachrizal, R.; Sephero, M.; van der Meer, D.; Munkhammer, J.; Widen, J. Smart charging of electric vehicles considering photovoltaic power production and electricity consumption: A review. eTransportation 2020, 4, 100056. [Google Scholar] [CrossRef]
  11. Brinkel, N.B.G.; Schram, W.L.; AlSkaif, T.A.; Lampropoulos, I.; van Sark, W.G.J.H.M. Should we reinforce the grid? Cost and emission optimization of electric vehicle charging under different transformer limits. Appl. Energy 2020, 276, 115285. [Google Scholar] [CrossRef]
  12. Van ber Berg, M.A.; Lampropoulos, I.; AlSkaif, T.A. Impact of electric vehicles charging demand on distribution transformers in an office area and determination of flexibility potential. Sustain. Energy Grids Netw. 2021, 26, 100452. [Google Scholar] [CrossRef]
  13. Kim, Y.; Kim, S. Forecasting Charging Demand of Electric Vehicles Using Time-Series Models. Energies 2021, 14, 1487. [Google Scholar] [CrossRef]
  14. Huang, S.; Ye, C.; Ding, Y.; Zou, B.; Xu, C.; Wang, K.; Wang, L. Estimation of EV Charging Profiles Based on the Diffusion Estimator. In Proceedings of the IEEE Sustainable Power and Energy Conference (iSPEC), Beijing, China, 21–23 November 2019. [Google Scholar]
  15. Thingvad, A.; Andersen, P.B.; Unterluggauer, T.; Træholt, C.; Marinelli, M. Electrification of personal vehicle travels in cities—Quantifying the public charging demand. eTransportation 2021, 9, 100125. [Google Scholar] [CrossRef]
  16. Mariz, A.; Myungchin, K.; Sungwoo, B. Prediction of electric vehicle charging-power demand in realistic urban traffic networks. Appl. Energy 2017, 195, 738–753. [Google Scholar]
  17. Moon, H.; Park, S.Y.; Jeong, C.; Lee, J. Forecasting electricity demand of electric vehicles by analyzing consumers’ charging patterns. Transp. Res. Part D 2018, 62, 64–79. [Google Scholar] [CrossRef]
  18. Yi, T.; Zhang, C.; Lin, T.; Liu, J. Research on the spatial-temporal distribution of electric vehicle charging load demand: A case study in China. J. Clean. Prod. 2020, 242, 118457. [Google Scholar] [CrossRef]
  19. Erdelic, T.; Caric, T.; Erdelic, M.; Tisljaric, L.; Turkovic, A. Estimating congestion zones and travel time indexes based on the floating car data. Comput. Environ. Urban Syst. 2021, 87, 101604. [Google Scholar] [CrossRef]
  20. Sun, D.; Leurent, F.; Xie, X. Uncovering mobility typologies of territorial zones based on Floating Car Data mining. Transp. Res. Procedia 2021, 52, 708–715. [Google Scholar] [CrossRef]
  21. Li, J.; Boonaert, J.; Doniec, A.; Lozenguez, G. Multi-models machine learning methods for traffic flow estimation from Floating Car Data. Transp. Res. Part C 2021, 132, 103389. [Google Scholar] [CrossRef]
  22. Liberto, C.; Valenti, G.; Orchi, S.; Lelli, M.; Nigro, M.; Ferrara, M. The Impact of Electric Mobility Scenarios in Large Urban Areas: The Rome Case Study. Trans. Intell. Transp. Syst. 2018, 19, 3540–3549. [Google Scholar] [CrossRef]
  23. Altintasi, O.; Tuydes-Yaman, H.; Tuncayc, K. Detection of urban traffic patterns from Floating Car Data (FCD). Transp. Res. Procedia 2017, 22, 382–391. [Google Scholar] [CrossRef]
  24. Ortuzar, J.; Willumsen, L.G. Modelling Transport, 4th ed.; Wiley: Hoboken, NJ, USA, 2011. [Google Scholar]
  25. 5T srl. Available online: http://www.5t.torino.it/en/ (accessed on 10 September 2021).
  26. Osservatorio PUMS. Parco Auto Circolante. Available online: https://www.osservatoriopums.it/torino (accessed on 10 September 2021).
  27. Agenzia per la Mobilità Metropolitana e Regionale. Le Indagini sulla Mobilità delle Persone e sulla Qualità dei Trasporti. Analisi sulla Città di Torino. 2015. Available online: https://mtm.torino.it/it/dati-statistiche/indagini/ (accessed on 10 September 2021).
  28. Bass, F.M. A New Product Growth for Model Consumer Durables. Manag. Sci. 1969, 15, 215–227. [Google Scholar] [CrossRef]
  29. Automobile Club Italia (ACI). Open Data. Available online: https://www.aci.it/laci/studi-e-ricerche/dati-e-statistiche/open-data.html (accessed on 10 September 2021).
  30. Unione Nazionale Rappresentanti Autoveicoli Esteri (UNRAE). Dati Statistici. Available online: http://www.unrae.it/dati-statistici/immatricolazioni (accessed on 10 September 2021).
  31. Jensen, A.F.; Cherchi, E.; Mabit, S.L.; Ortuzar, J. Predicting the Potential Market for Electric Vehicles. Transp. Sci. 2017, 51, 427–440. [Google Scholar] [CrossRef] [Green Version]
  32. Scorrano, M.; Danielis, R.; Giansoldati, M. Dissecting the total cost of ownership of fully electric cars in Italy: The impact of annual distance travelled, home charging and urban driving. Res. Transp. Econ. 2020, 80, 100799. [Google Scholar] [CrossRef]
  33. Energy and Strategy Group. Smart Mobility Report—Opportunità e Sfide Emergenti per la Filiera della Mobilità Elettrica in Italia. 2019. Available online: https://www.energystrategy.it/osservatorio-di-ricerca/smart-mobility/ (accessed on 10 September 2021).
  34. Electric Vehicle Database. Available online: https://ev-database.org/ (accessed on 10 September 2021).
Figure 1. Zoning for the municipality of Turin (166 zones) and its metropolitan area (92 zones).
Energies 14 06697 g001
Figure 2. Percentage distributions of daily trips for the different time slots (comparison between FCD and 5T data).
Energies 14 06697 g002
Figure 3. Estimation of EV diffusion in the city of Turin considering three possible options ‘by analog’.
Energies 14 06697 g003
Figure 4. Aggregated hourly load profile due to EV charging for different scenarios at 2030 in the city of Turin.
Energies 14 06697 g004
Figure 5. Number of vehicles charging, daily energy and peak demand required to the grid for the different scenarios at 2030.
Energies 14 06697 g005
Figure 6. Distribution of power demand in the various areas of the city of Turin during daytime (a) and night-time (b) by 2030.
Energies 14 06697 g006
Figure 7. Duration curves of charging time for domestic and public charging in Scenario 1c.
Energies 14 06697 g007
Figure 8. Duration curves of energy demand for domestic and public charging in Scenario 1c.
Energies 14 06697 g008
Figure 9. Aggregated hourly load profile due to EV charging for different scenarios at 2035 in the city of Turin.
Energies 14 06697 g009
Figure 10. Number of vehicles charging, daily energy and peak demand required to the grid for the different scenarios at 2035.
Energies 14 06697 g010
Figure 11. Distribution of power demand in the various areas of the city of Turin during daytime (a) and nighttime (b) by 2035.
Energies 14 06697 g011
Figure 12. Duration curves of charging time for domestic and public charging in Scenario 2c.
Energies 14 06697 g012
Figure 13. Duration curves of energy demand for domestic and public charging in Scenario 2c.
Energies 14 06697 g013
Table 1. Average values of the indicators obtained from FCD of Turin metropolitan area.
IndicatorsInternal TripsIncoming/Outgoing Trips
WeekdaySaturdaySundayWeekdaySaturdaySunday
Average number of trips34,49828,22420,254863273476067
Daily trips (trips/day)2.562.582.321.881.81.75
Distance travelled per trip (km/trip)7.097.067.4531.531.4834.04
Daily travel distance (km/day)17.5717.7316.9553.2250.9954.02
Travel times per trip (min/trip)24.2423.2922.3747.1345.8446.18
Daily travel times (hours/day)1.010.980.851.381.281.26
Average speed per trip (km/h/trip)171819384042
Active parking time (hours/trip/day)3.222.813.115.063.693.92
Table 2. Estimation of the average circulating fleet in the city of Turin.
Type of TripNumber of TripsNumber of PassengersNumber of Vehicles
Internal34,498116,01589,243
Incoming161,54565,66950,515
Outgoing106,41436,94928,423
Table 3. Estimated Bass’ coefficients by the different analog approaches.
Analogpq
CNG0.010760.41240
HEV0.00000140.3063771
Jensen et al. [31]0.0020.230
Table 4. Estimated EV diffusion at 2030 and 2035 in the city of Turin considering different analog approaches.
AnalogEV Diffusion (%)
20302035
CNG5.626.6
HEV2.48.8
Jensen et al. [31]1.33.5
Table 5. Characteristics of a representative EV of the B segment of the market.
Driving Range ER max Average Consumption μ Battery Size SoC min
(km)(kWh/km)(kWh)(%)
3000.16850.420
Table 6. Simulated scenarios for the city of Turin.
YearRange Anxiety
(as Battery SoC Threshold)
40%60%80%
2030Scenario 1aScenario 1bScenario 1c
2035Scenario 2aScenario 2bScenario 2c
Publisher’s Note: MDPI stays neutral with regard to jurisdictional claims in published maps and institutional affiliations.

