Article

Performance Enhancement of Self-Cleaning Hydrophobic Nanocoated Photovoltaic Panels in a Dusty Environment

1
Mechanical Engineering Department, The University of Jordan, Amman 11194, Jordan
2
Department of Electrical Engineering and Computer Engineering, Université Laval, Quebec City, QC G1VA06, Canada
3
Department of Mechanical Engineering, Hashemite University, Zarqa 13115, Jordan
4
Electrical Engineering Department, Hashemite University, Zarqa 13115, Jordan
5
Department of Electrical and Electronics Engineering, Higher Colleges of Technology, Sharjah 7947, United Arab Emirates
6
Department of Electrical Engineering, Qatar University, Doha 2713, Qatar
*
Author to whom correspondence should be addressed.
Energies 2021, 14(20), 6800; https://doi.org/10.3390/en14206800
Submission received: 30 August 2021 / Revised: 22 September 2021 / Accepted: 12 October 2021 / Published: 18 October 2021

Abstract

:
The efficiency of a photovoltaic (PV) panels drops significantly in dusty environments. The variation in temperature could have a substantial impact on PV panel cells, which could further lead to high deterioration and eventually permanent damage to the PV material in the presence of dust. To resolve this issue, in this work a novel hydrophobic silicon dioxide (SiO2)-based nanoparticle coating is proposed for the PV panel, to shrink the surface stress developed between the water and the coated facet. Two identical PV modules were installed to conduct comparable experimental tests simultaneously. The first module is coated by the SiO2 nanoparticles, and the second is uncoated and used as a reference. To maintain coherency, the experiments are done in the same environmental conditions, cleaning the PV modules at regular intervals. Results reveal that the accumulated energy generated during this period of study was comprehensively enhanced. Moreover, the self-cleaning property of the hydrophobic surface of the coated panel allowed water droplets to slide smoothly down the PV module surface, carrying dust particles. Useful recommendations are made at the end to enhance the performance of PV panels in dusty environments.

1. Introduction

1.1. PV-Based Renewable Energy Solutions for Bulk Energy Demand

Bulk energy demand in recent years has prompted the production of state-of-the-art renewable energy solutions and designs. This is because of variation in oil prices on the international market and sharp growth in harmful gases in the atmosphere. Solar energy and PV panels have become a primary technology option when searching for a feasible and economical energy source. Solar energy can also be harvested on Earth [1,2,3,4]. The PV panels used for solar energy have been extensively studied to find routes to enhance their performance. For example, solar cell designs undergo dust accumulation that lead to reduced power transformation efficiency and high operating expenses related to the cleaning method for PV modules [5,6,7,8,9]. Though results are mostly prejudiced by local environment, they still significantly improve the scientific field and offer great assistance for future investigation for advanced innovative solutions in PV-based renewable energy production.

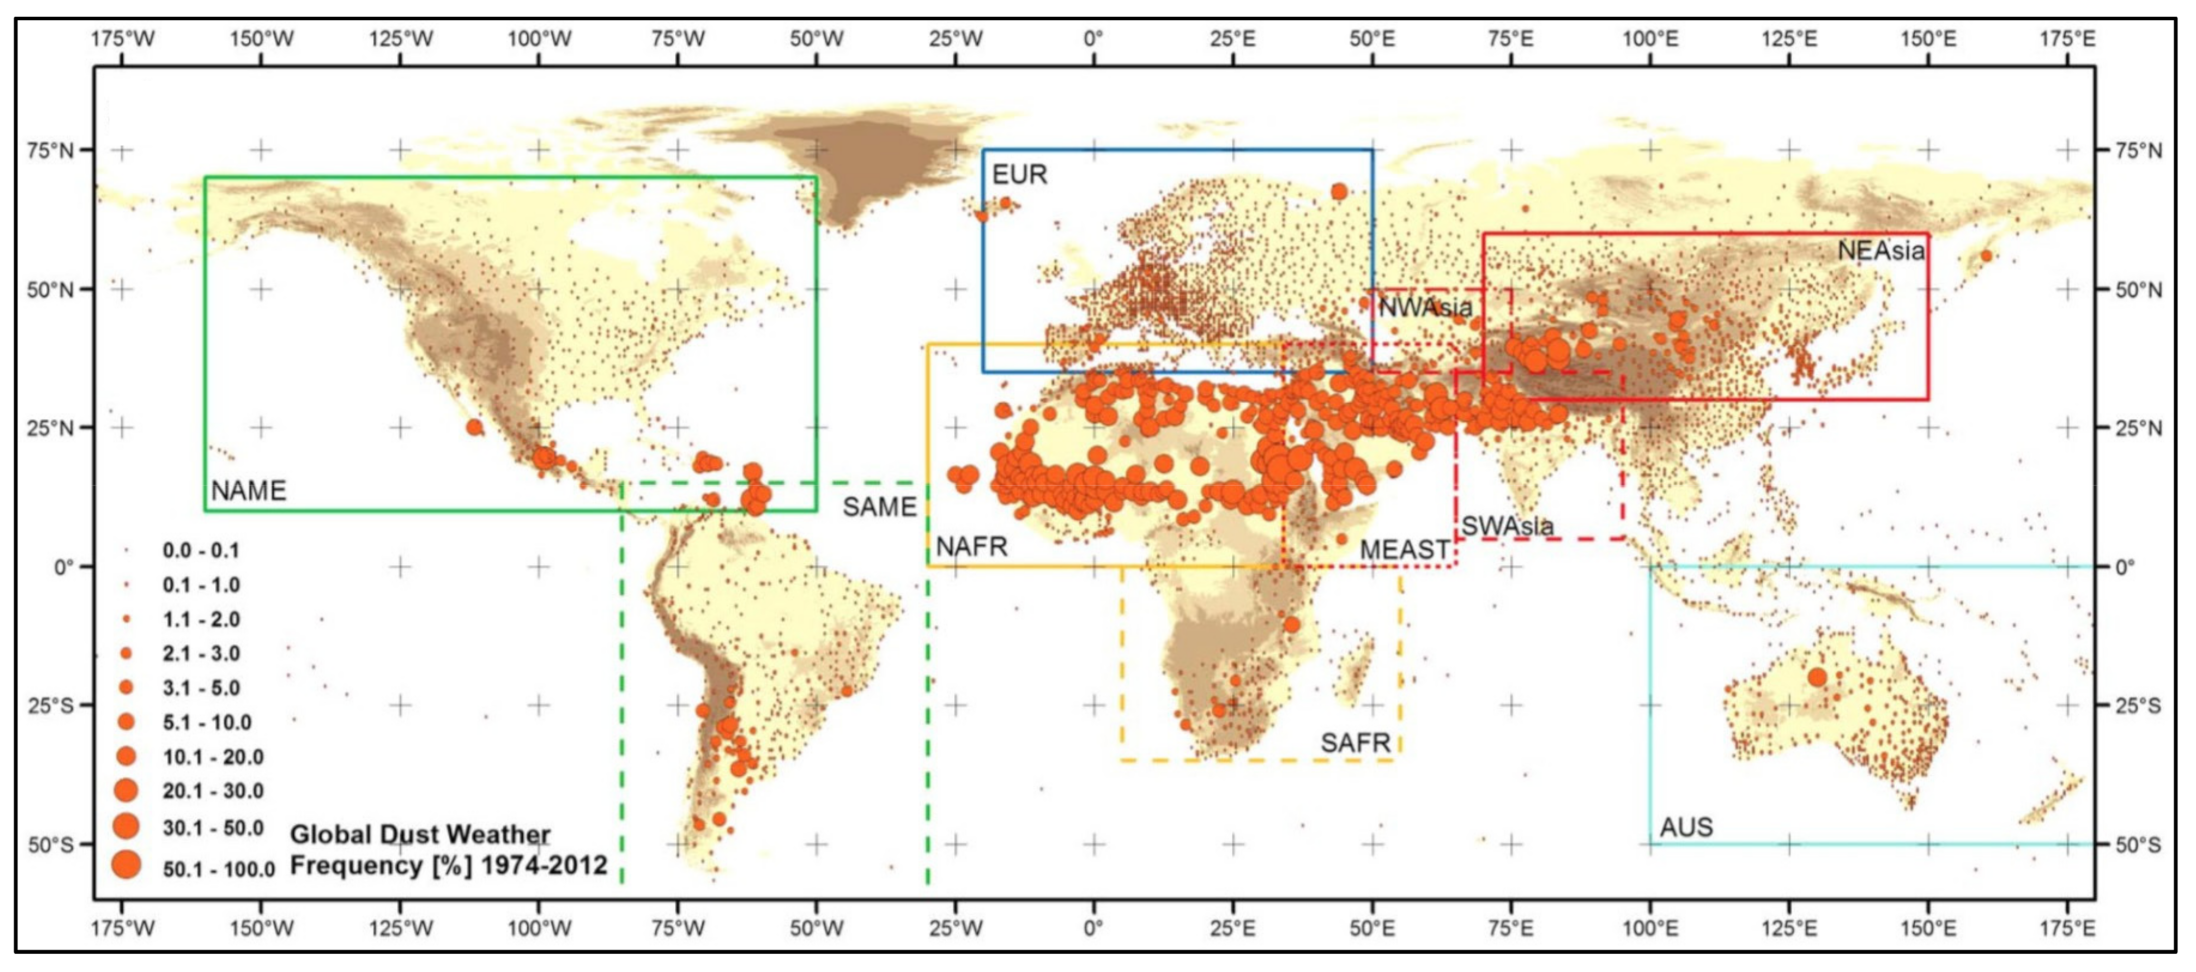
1.2. PV Panels and the Impact of Dust

The accumulation of dirt or dust on the protective glass layer can result in deterioration of the output performance of a solar power plant. Solar irradiance will also be affected and eventually scattered by the particles of dust. This inhibits light transmission to the solar panel-based cell, which affects PV cell output. Considering a regional survey on dust distribution patterns, the Middle East and North Africa (MENA) region is identified as one of the severest dust accumulation regions in the world [10,11,12,13]. Particulate matter concentrations in the MENA region are higher compared to the ones in the United Nation (UN) region [14]. Figure 1 shows the global frequency pattern. The pattern was built based on weather reports.
Soiling is defined as the accumulation and racking up of variants that may affect the performance of PV panels. These variants are dust, sand, snow, dirt, pollen, leaves, and bird droppings. These variants can significantly decrease the energy generated by a PV module. In severe situations with complete coverage of the PV module with soiling, there is no energy produced [15]. Considering the soiling situation in the MENA region, there are certain times of year where power loss can be up to 30–65% in Saudi Arabia and North Africa [10,16]. In severe situations, this could damage the silicon inside the solar panel [8].

1.3. Performance of PV Panels and Their Cleaning Characteristics

Research on dust and soiling effects on PV modules shows that the effects significantly diminish the efficiency of PV systems exclusively in sunny geographical sites [9,17]. Extensive studies have been conducted into PV energy with the aim of increasing the efficiency of the PV panels. A chief problematic issue in PV operation is the frequent necessity to clean the modules to preserve decent power output [18]. Dust particle build-up undesirably disturbs efficiency by reducing the diffusion of solar irradiance through the enclosed PV glass. A new method is required to enhance the performance of PV panels and their cleaning characteristics, which is the scope of this work. A proposed setup to analyze the performance of cleaning characteristics can be seen in Figure 2.

1.4. PV Panel Efficiency and Its Maximization

Many researchers investigate PV panels to estimate the best methods to increase efficiency. Some of this research is concentrated on the impact of dust accumulation on PV module performance, which fluctuates according to location, quantity of dust gathered, and cleaning frequency [19]. Research into dust and mud build-up has been made with PV modules in the Kingdom of Saudi Arabia (Dhahran). It shows that dust has a diverse effect on the optical properties of glass [20]. The existence of alkaline and alkali earth combinations in sludge causes a chemically energetic solution and greatly influences the chemical properties of glass [21,22]. The results showed that the atoms of dust are generated from a non-uniform distribution of sodium ions (Na+), potassium ions (K+), magnesium ions (Mg+2), calcium ions (Ca+2), oxygen (O2), silicon (Si), and iron (Fe). Ultraviolet–visible (UV–V) spectroscopy demonstrates that the evolution of a dry form of mud could significantly reduce the diffusion of light through the glass. Further research was conducted into the ideal cleaning frequency of PV panels, particularly in semi-arid and desert areas such as Hashemite University (HU) in Jordan. It was observed that an average period of 13–15 days is required between cleaning. The average day-to-day efficiency drop is 0.768%. This energy loss has a huge impact on running costs. The loss of energy is 10.282 kWh/m2 due to dust. This corresponds to an average loss of 1.03 USD/day [22]. Comparative research on various approaches to cleaning solar panels is presented to highlight the technology of dust separation. This is achieved with an electrostatic precipitator. First, the electrodes are charged to achieve very high negative and positive voltages. Then, the positively charged electrode extracts the dust atoms and periodically removes them. This keeps the panel dust-free, and increases the solar panels’ insolation absorption ability [23]. The solar panel automated cleaning environment is presented. An automated solar panel cleaner reports the adverse effect of soiling on marketable PV cells. The present apparatus uses a cleaning strategy with brush-cleaning system. This system uses regular cleaning cycles [24].

1.5. Contribution of This Paper

The main contribution of this work is to develop an experimental platform for enhancing PV system efficiency from the perspective of hydrophobic coating using SiO2 nanoparticles as a cleaning agent. This is realized by examining the performance of Si PV modules with hydrophobic SiO2. A thin coating of SiO2 nanoparticles repels all contaminants from the PV panel surface. Moreover, hydrophobic solar panel coating permits water to stream more easily from the panel surface and acts as an anti-reflective layer, and thus the transmission of light through the surface of the panel increases. This also enhances the module performance ratio and generated power. The improved design proposes a hydrophobic SiO2 nanoparticles-based PV coating solution to resist dust accumulation. The formulation of the problem is also informed by a state–space-based representation and the performance parameters of the proposed system.

1.6. Structure of This Paper

The rest of this paper has the following formation: Section 2 represents the formulation of the problem based on the proposed system. The experimental setup and materials are described in Section 3. Section 4 describes the results and evaluation of the proposed scheme. Conclusions are drawn in Section 5.

2. Problem Formulation: Performance Management for Coated PV Panels

The formulation of the problem of a coated PV panels-based setup is described in this section. Figure 3 shows the schematic diagram of the setup. This consists of (1) a set of PV panels, (2) micro-inverters, (3) a set of temperature sensors, (4) an anemometer for solar radiation, (5) a pyrometer for wind speed, (6) wireless sensors, and (7) a data logger. The blend of this setup is also integrated with two identical polycrystalline PV panels (coated and uncoated). Each PV module has a separate connection to a micro-inverter to a 220 V AC low grid, which has a frequency of 50 Hz.

2.1. State Representation of the Proposed System

A PV temperate-based state representation is expressed as:
Γ t + 1 f = F t + 1 f Γ t + 1 f + R t c α t Γ c , t + β t Γ u c , t
where Γ t + 1 f   r is a fused form of temperature state. The superscript f in this representation can be stated as f = c + u c . c and uc denote the coated and uncoated panels, respectively. F t f r × r is a modal matrix of temperature state. α t , β t r × r are the transition matrices of the coated PV module temperature reference PV module temperature Γ c , t , and uncoated PV module temperature Γ u c , t respectively, such that Γ c , t , Γ u c , t   r . R t f is the PV module total radiation, such that R t f = Q i n , t / ρ a b s i = 1 3 A i . Here, Q i n , t is the heat absorbed by the PV solar, ρ a b s is the coefficient for heat absorption, A i is the area of each PV module. Q i n , t is the heat produced per unit as Q i n , t = 1 R I n δ e 8 z . Here R is the reflectivity, I n is the intensity of solar radiation, δ is the absorption coefficient with temperature function, such that δ t = f Γ f . z is the depth of penetration of solar light.

2.2. PV Modules and Efficiency

The determination of electrical efficiency (η) for PV modules can be made by I/O relationship. The representation of electrical efficiency (η) of the reference module can be made as follows:
ηpv,c = Pout/Pin = Ppv,c/GA
where ηpv,c is the coated module electrical efficiency. The output module power can be expressed as Ppv,c in watts. The incident solar radiation can be represented by G in W/m2. The module area can be expressed by A. Its unit is m2.
Once the illustration of efficiency modules is made, the percentage of improvement is used as a tool to build on the proposed performance of coated PV panels.

2.3. Improvement Factor of PV Panels—Coated and Uncoated

The noticeable improvement in power generation for coated and uncoated PV panels is found using the improvement factor. The improvement factor can be expressed as:
£pv,c (%) = (Ppv,c − Ppv,uc)/Ppv,uc
where the improvement factor of the coated panel is defined by £pv,c. The output module power with the coated and uncoated panel is represented by Ppv,c and Ppv,uc, respectively. The unit is watts.
Once the percentage improvement factor is expressed, the representation of module performance is made.

2.4. Proposed Coated PV Panel and its Performance Ratio

The performance ratio of the proposed coated PV panel is determined by generating a ratio between actual and expected energy values as follows:
PR = Eactual/Eexpected
where PR is the performance ratio, and Eactual is the actual output module energy. Its unit is kWh. Eexpected is the expected output module energy with coating. Its unit is also in kW/h.
Once the performance enhancement of proposed coated PV panels is made, the experimental setup and materials are described.

3. Proposed Self-Cleaning Hydrophobic Nanocoated PV Panel—Experimental Setup and Materials

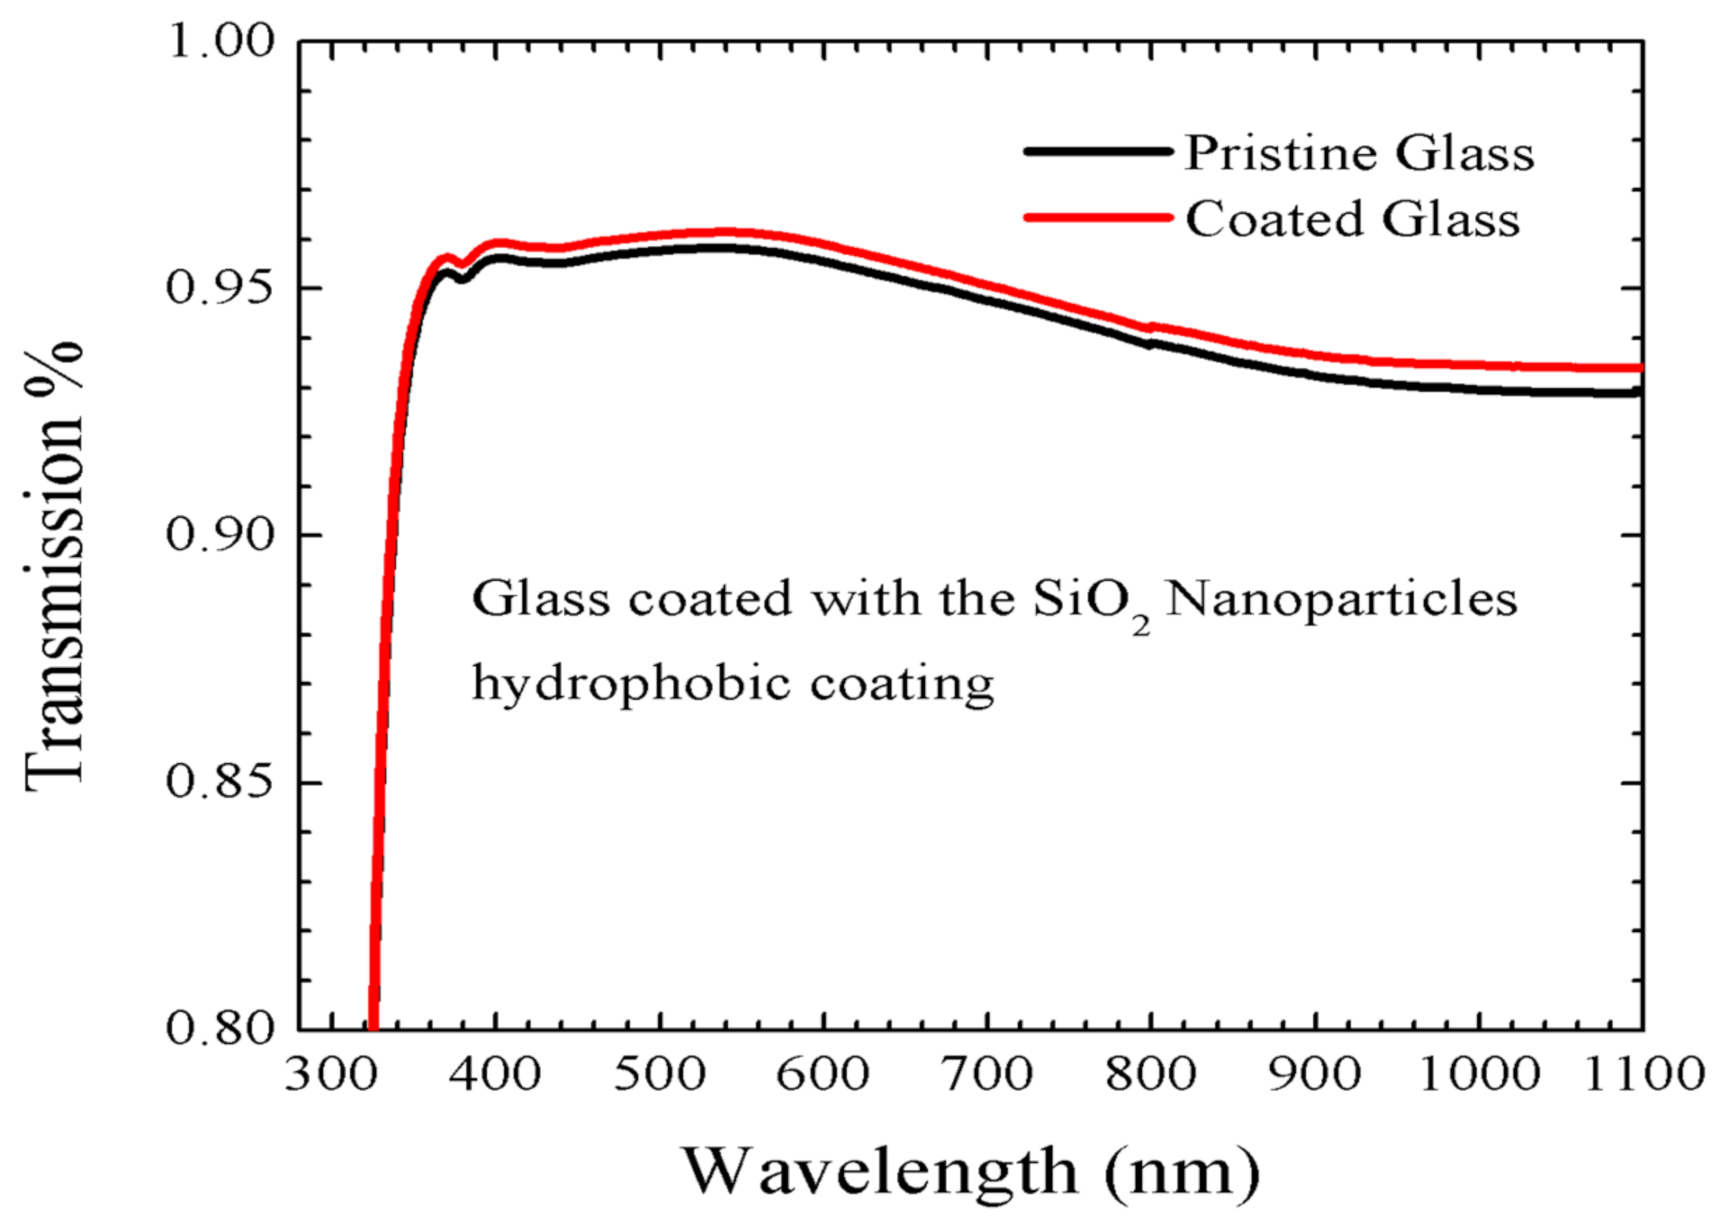
3.1. Nanocoating Materials

Nanocoating materials have been extensively used on glass. The advantages are well known since such coatings can make glass hydrophobic and dust-repellent, and therefore easier to clean. Moreover, the hydrophobic solar panel coating allows water to flow more easily from the panel surface and an anti-reflective layer, which increases light transmission potency through the surface of the panel and thus increases efficiency. This also makes the coating dust-free, and prevents the growth of any kind of mold or fungus.

3.2. Testing of Coated Samples

Two tests for nano-ceramic coated samples were made in the Nanotechnology Institute at the Jordan University of Science and Technology. This procedure took place before nanomaterial was coated on the PV module.

3.2.1. First Test

The contact angles between the liquid and the sample surface were defined as shown in Figure 4a–c. It shows contact angle values where, if the contact angle is zero, it represents complete wetting for the surface. If it is less than 90°, it shows that the liquid wets the surface. If it is greater than greater than 90°, it shows non-wetting with the liquid (they have a hydrophobic surface). The results of the contact angles of these samples can be seen in Table 1. The tested samples have angles of more than 90°, which means they are not wetting (they have a hydrophobic surface).

3.2.2. Second Test

This test shows the ratio of light transmitted through the sample surface to the incident light on the surface using a Shimadzu UV3600-Nir NIR spectrometer, as shown in Figure 5. The light absorption amount was determined by this device. This was made by passing a photon-based beam of light. The light intensity was therefore measured by light reaching the detector on the other side. The tested samples measured the transmittance quantity. The transmittance quantity is defined as the ratio of transmitted light to incident light on the surface. The Beer–Lambert law derives these measurements. This law considers describing the light intensity as an exponential function. The function decreases with light being absorbed. Figure 6 shows the blocking for UV radiation up to a wavelength of 350 nm.

3.3. Test Samples Coating Procedure

Table 2 shows the test sample coating procedure. A clear nano-ceramic coating provides premium surface care protection from all types of weather, chemicals, and extensive damaging induced by UV rays.

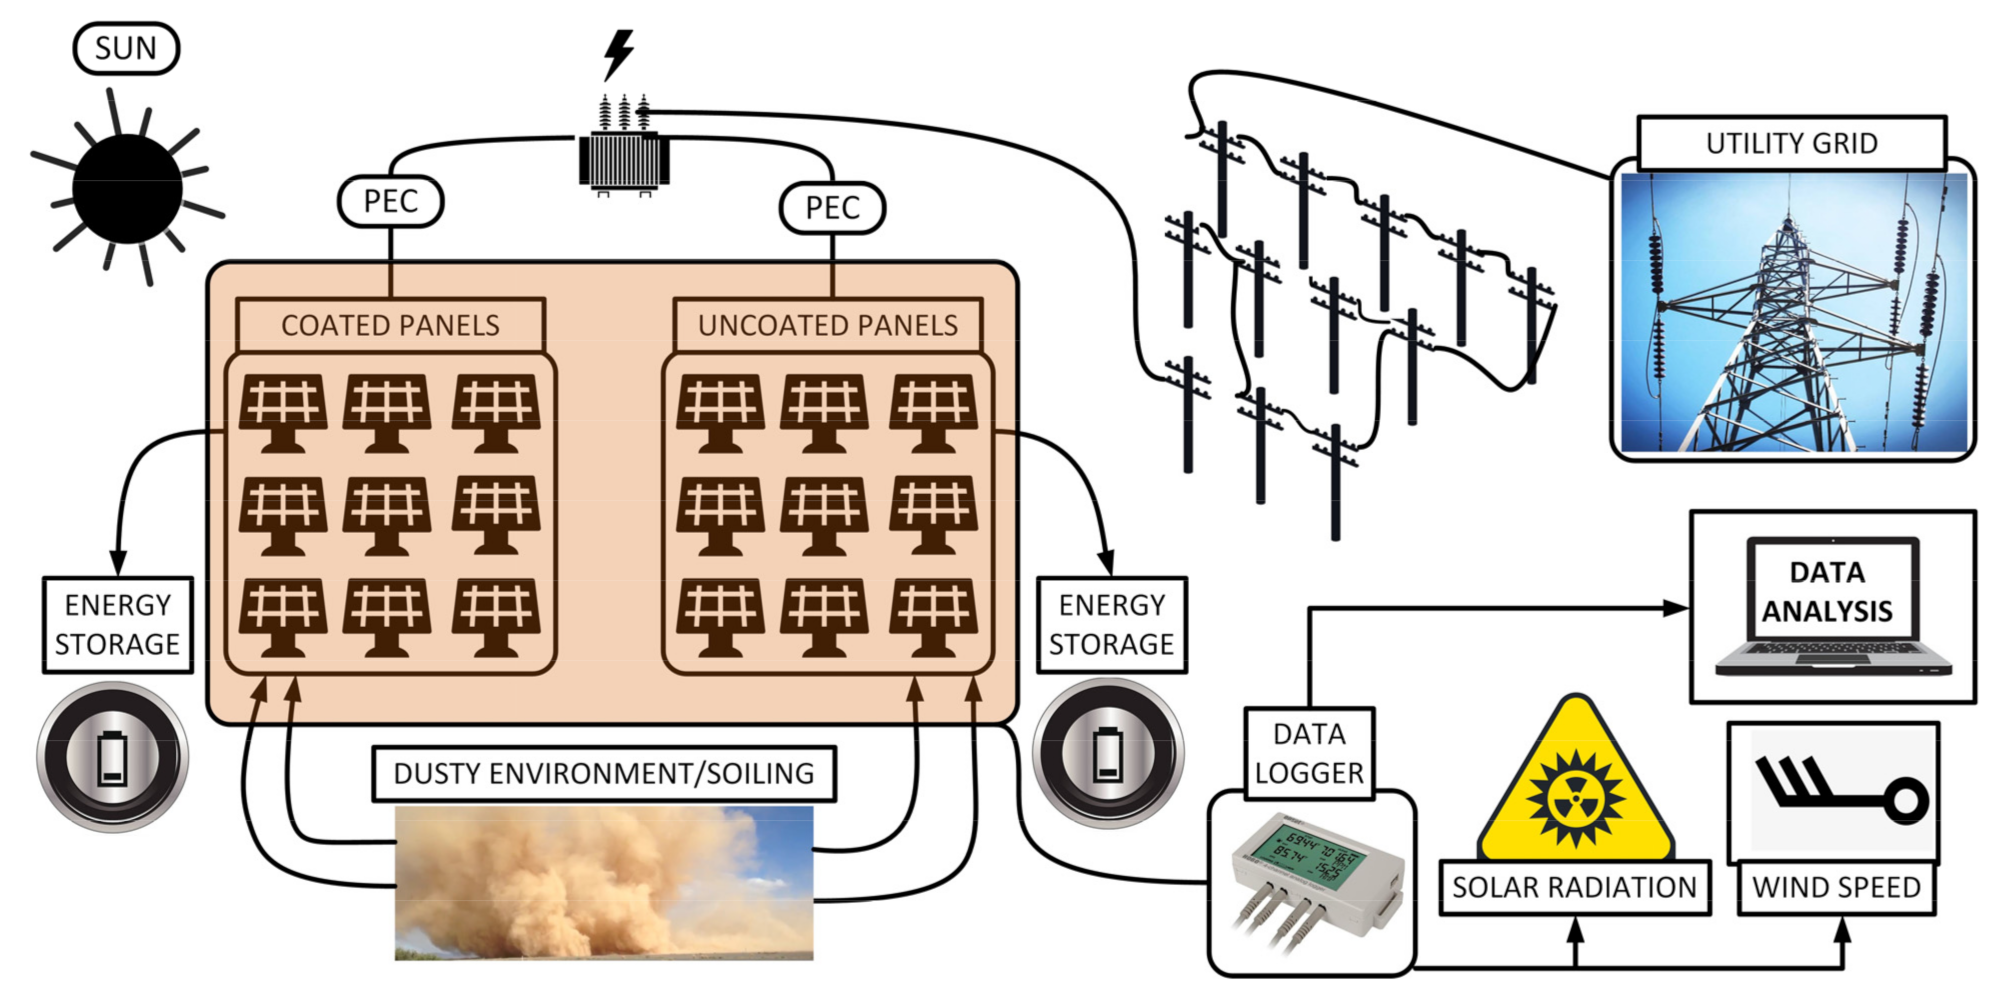
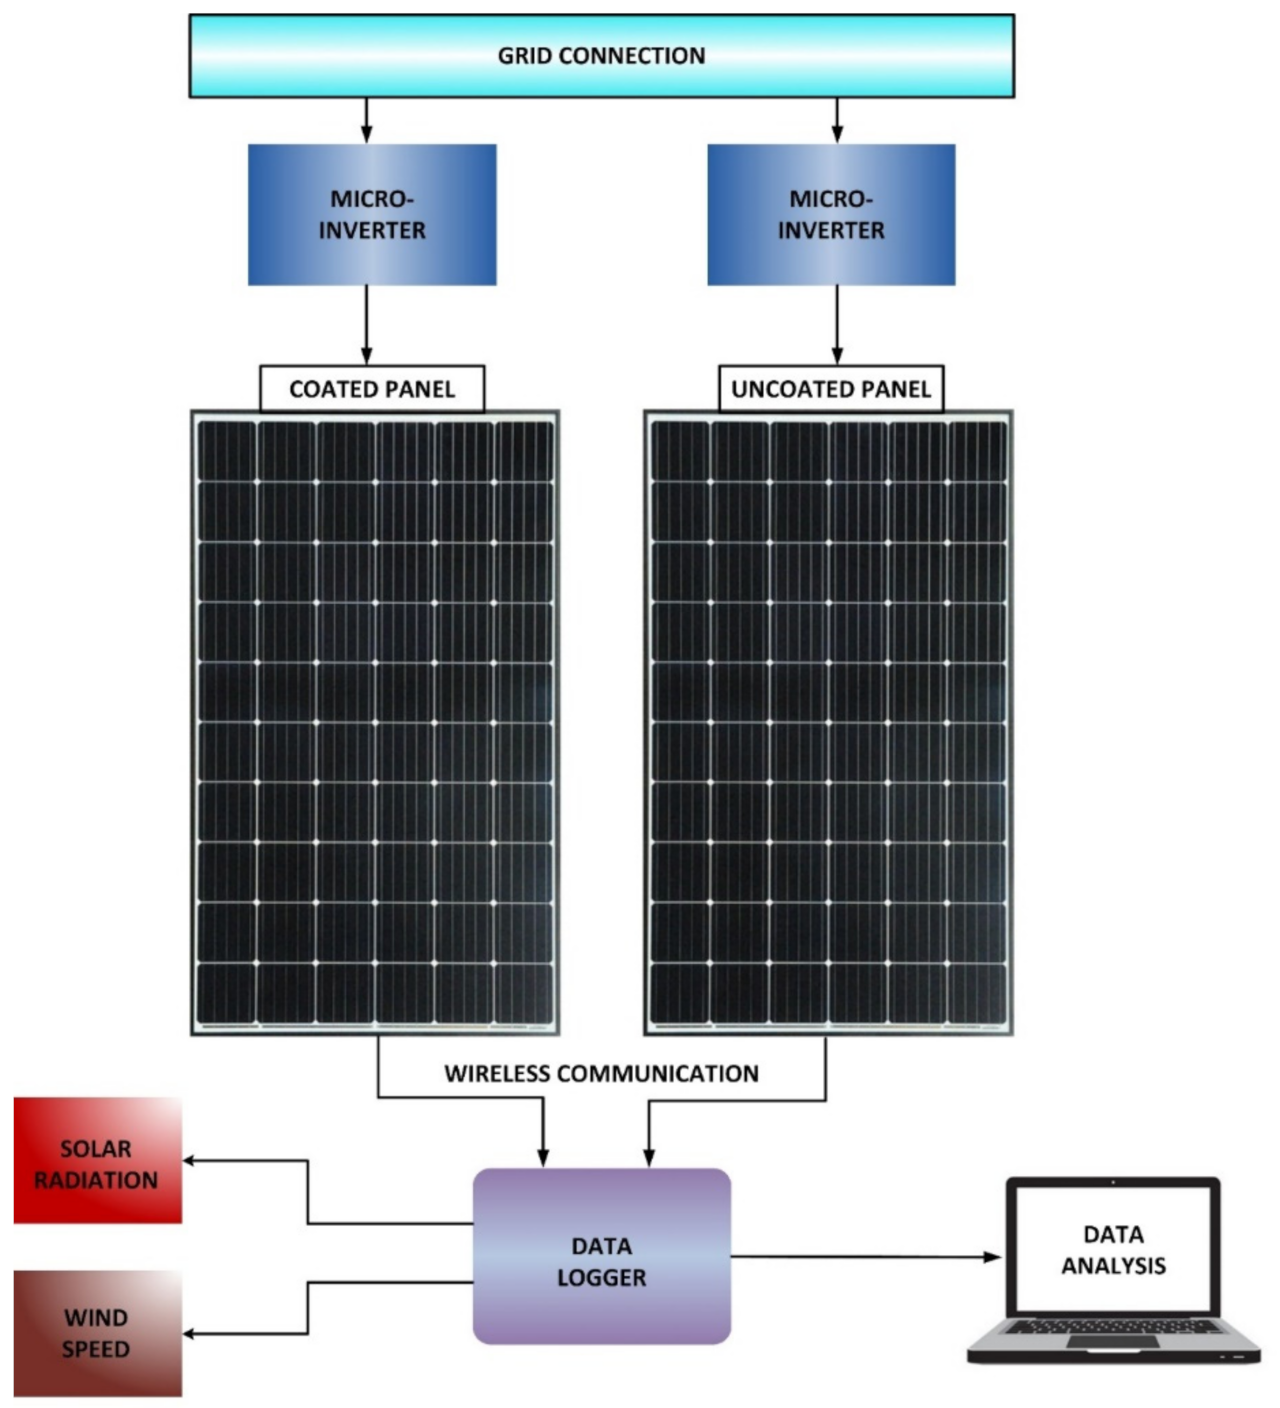
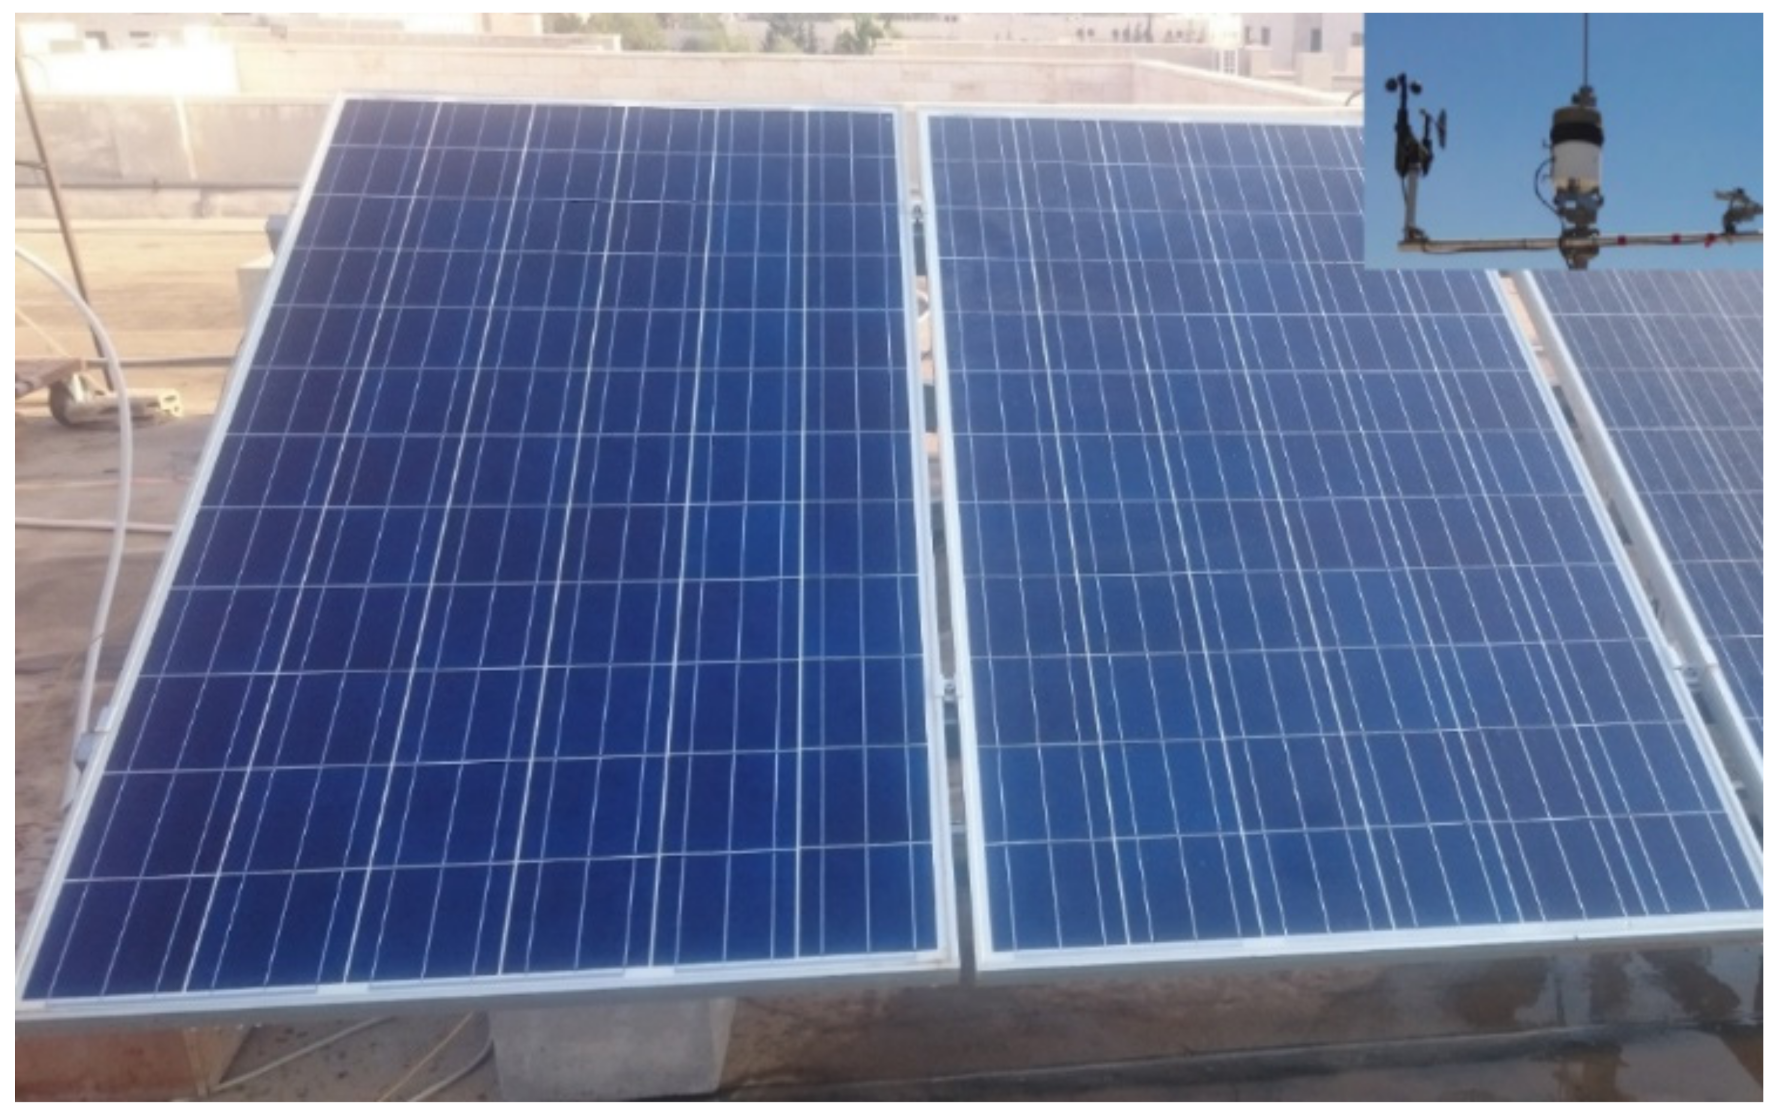
3.4. Experimental Setup

The experimental setup was installed at Hashemite University, Jordan. The experiment consisted of two identical polycrystalline PV modules of 300 W to study the enhancement of PV performance using the nanotechnology coating technique. The connection of each module was made separately with a micro-inverter (ABB, Zurich, Switzerland). This was then further connected to the national grid. The uncoated module operated normally and was cleaned every two weeks using a manual method. The coated module was cleaned by spraying water using the new technique (pipe). The system was installed in dry desert conditions at Hashemite University, Jordan (32.05° N, 36.06° E) at an elevation of 570 m, where a probable tilt angle of 26° was considered on the southern side. The setup consists of five main parts: (1) PV modules, (2) a micro-inverter, (3) a data logger, (4) a plan-viewer, and (5) a weather station. The basis of the installed setup is represented in Figure 3.
The system components are described as the following:

3.4.1. PV Panels

Two identical PV panels (YL300P-35P) are deployed in this experiment (See Figure 7). The specifications are given in Table 3.

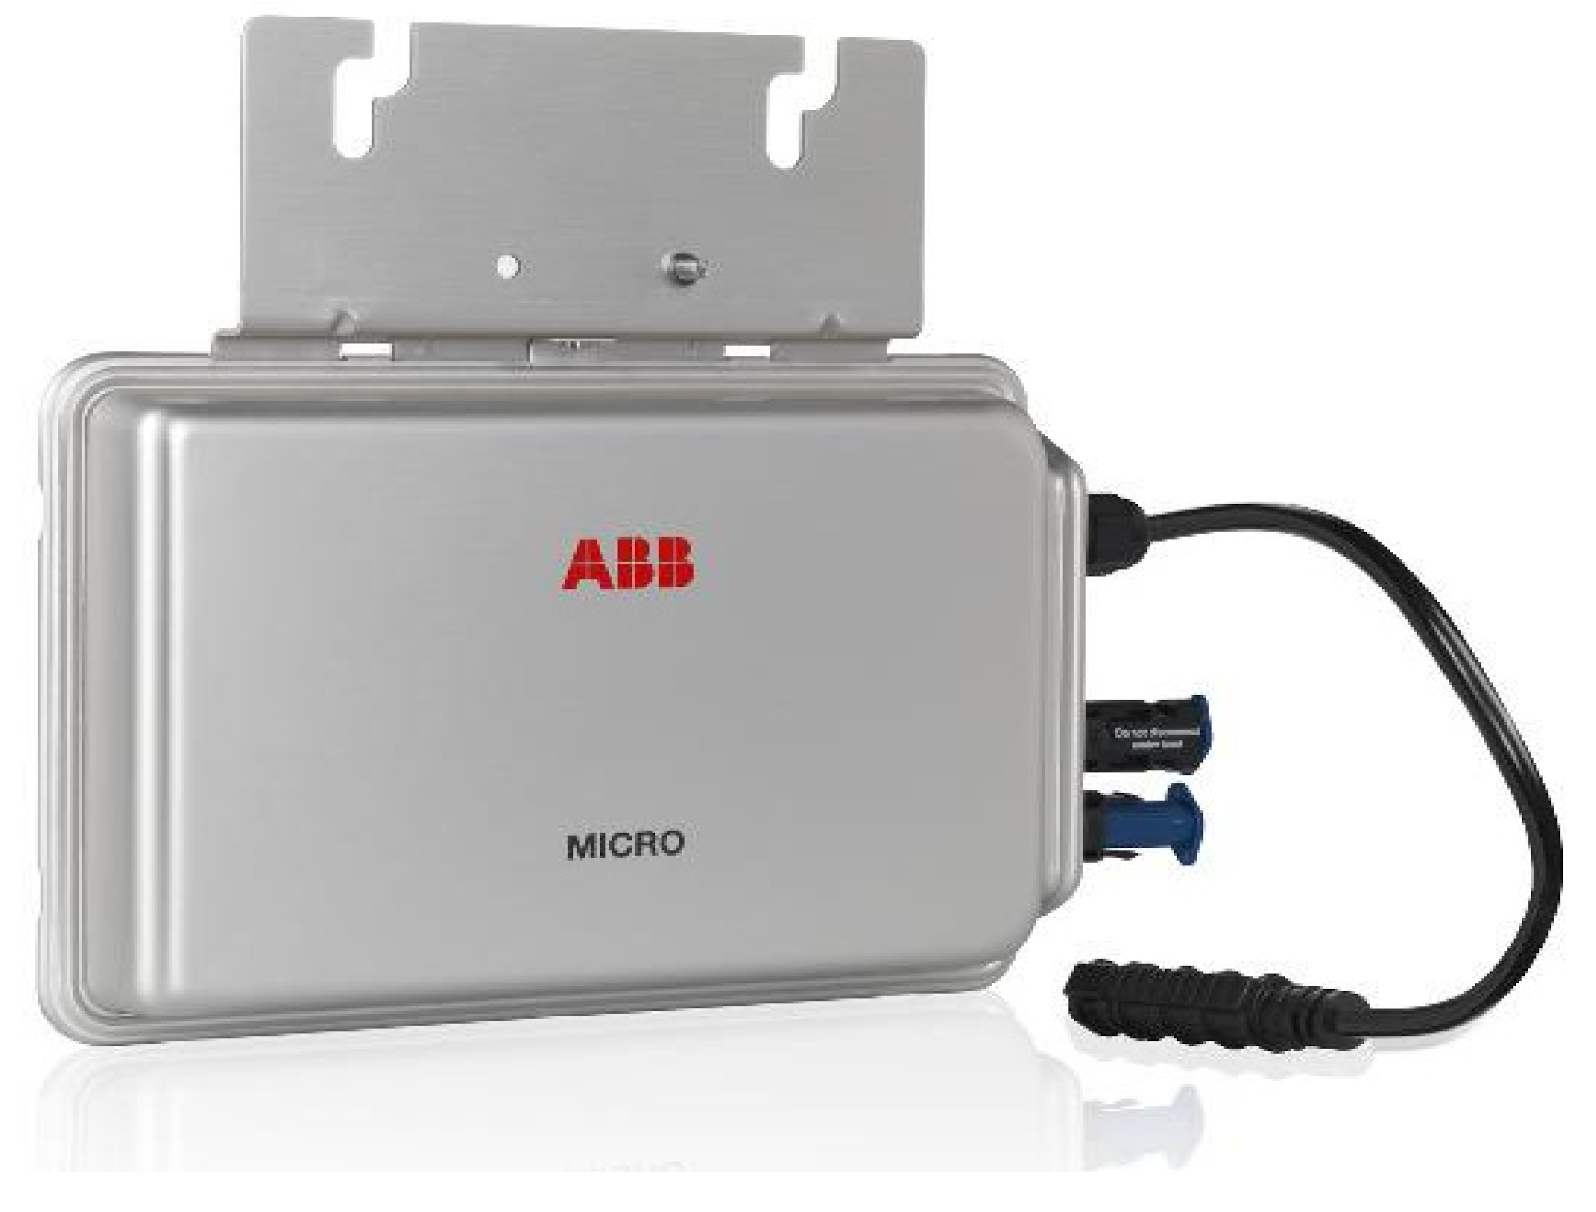
3.4.2. Micro-Inverter

Each solar PV panel was connected to a micro-inverter (ABB microgrid inverter, MICRO-0.3-I-OUTD-230 (see Figure 8)), which allowed individual panel output control to reduce shading and the mismatching effects. In addition, it offers increased flexibility and maximum energy due to the maximum power point tracking (MPPT) algorithm. The technical specifications of the ABB MICRO inverter are given in Table 4.

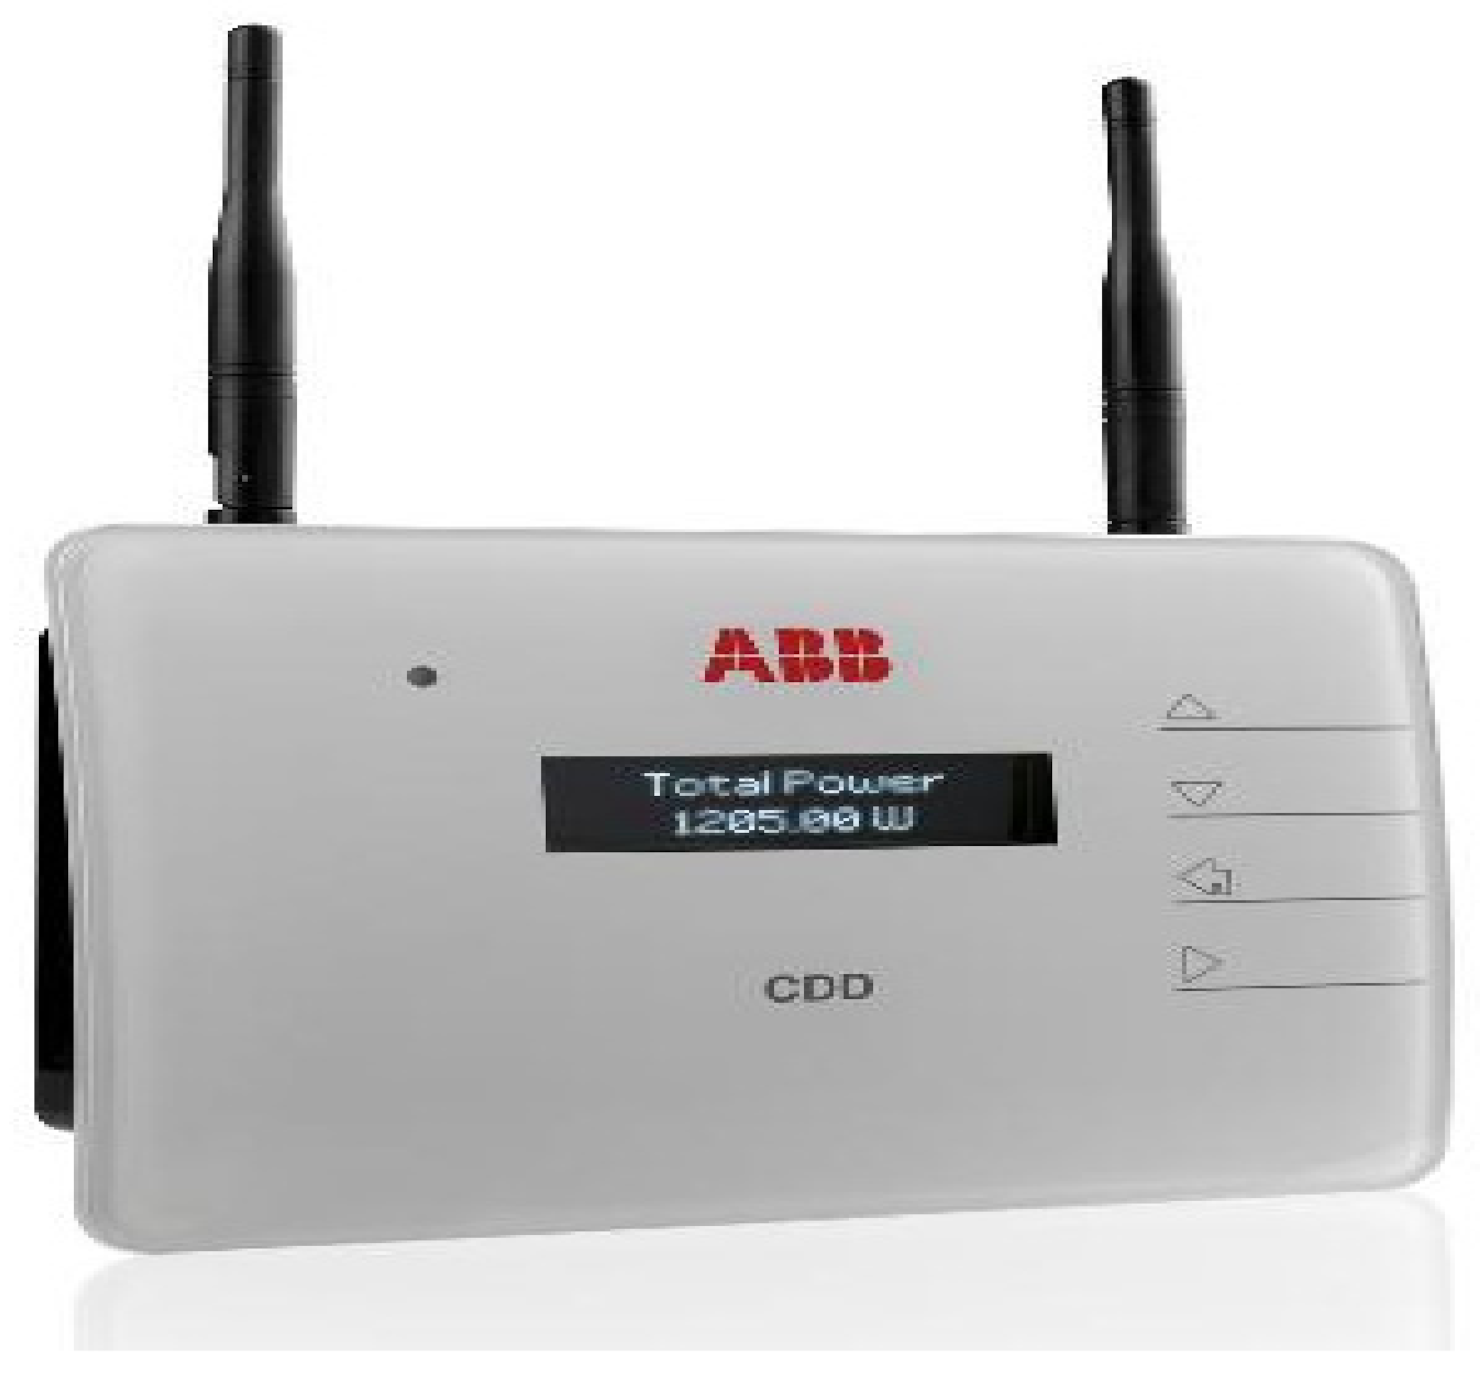
3.4.3. ABB Data Logger

The ABB Concentrator Data Device (CDD) is the communication hub between the ABB MICRO inverter system and the plant operation. The device can be seen in Figure 9. It can provide immediate and complete feedback of the plant status, and can also provide information on monitoring and troubleshooting. The specifications of the data logger are given in Table 5.

3.4.4. Plant Viewer

A plant viewer is a device that allows tracking of the energy produced as well as key energy metrics throughout the lifetime of solar power plant. A plant viewer by AURORA Vision Plant Management was used in this experimental setup.

3.4.5. Weather Station

The weather station provides basic weather measurements such as air temperature, solar radiation, direction and speed of wind, barometric pressure, relative humidity, etc.

3.4.6. Other Materials

Other materials used in this experiment are: (1) silicone oil (-Si(CH3)2O-] n), (2) SiO2 nanoparticles, (3) polysiloxane resin R4 (OR5) p—OH, and (4) isopropyl alcohol (CH3)2CHOH). These materials were imported from Merck Germany and used without any further purifications. The SiO2 nanoparticles were mixed with the silicone oil matrix on a stirring plate at room temperature for 24 h.

4. Results and Evaluation

The evaluation was made by taking the measurements from the setup shown in Figure 3. The recording of measurements was extensively made using a personal computer (PC) with data acquisition modules. Monitoring was performed for more than nine months. The parameters measured and further analyzed were as follows: (1) output energy for each panel in kWh/day, (2) global irradiation at 26° of inclination angle in kWh/m2 day, (3) ambient temperature in °C, (4) wind speed in m/s, and (5) efficiency of power conversion for each module.

4.1. Experimental Procedures

The experimental procedures involve (a) an optimization coating process, (b) contact angle measurement, (c) coating of the PV module, and (d) a cleaning process.

4.1.1. Coating Process Optimization

Optimization of the coating process was performed on the micro-glass slides before coating the PV panels with the super-hydrophobic SiO2 nanoparticles. The micro-glass slides offer the same optical properties as the glass of the panels. Therefore, the transmission of the coating material can be investigated as if it is directly coated on the panels.
The transmission spectra of the pristine glass and the coated samples were obtained using a Cary 5000 UV-Vis NIR spectrophotometer (See Figure 10). It is noted from the transmission spectra that visible light is not reduced due to the coating effect. On the contrary, it was further enhanced after the coating. This increase in transmission after sample coating is attributed to the refractive index of the SiO2, which improves the light absorption into the glass covering the PV modules [1,16].

4.1.2. Measurement of Contact Angle

Contact angle measurements were performed on the coated samples, to measure surface wettability. The measurements are performed using the Attention Theta drop shape analyzer from Biolin Scientific. As shown in Figure 11, the contact angle measurement is around 106.02°. This angle is considered hydrophobic according to the Wenzel–Baxter definition. Since the PV modules are already installed in an inclined manner, this angle shows decent hydrophobic properties.

4.1.3. Coating of PV Module

PV modules are coated with a micro-cloth after the optimization coating process. Coating involves the following steps: (1) a conventional cleaning technique is used to wash the surface with deionized (DI) water, (2) cleaning the surface of the panels with isopropyl alcohol takes place to remove any organic residuals from the glass surface, (3) the first and second step is repeated twice to achieve a shiny and clean surface, (4) the panels are blown dry with air to remove any moisture left on the glass surface, (5) the prepared nanoparticle solution is used to coat the cleaned glass using a micro-cloth, (6) the material is applied gently horizontally and then vertically to ensure uniform coating on the panels, (7) modules are left to dry for 24 h, (8) panels are covered with plastic sheets such that no contaminants become stuck on the coated surface during the material curing time.

4.1.4. PV Module Cleaning Process

According to the proposed cleaning frequency [17], both pristine and coated modules are only cleaned every two weeks, after installing the PV modules in the field. To ensure repeatable and standard results, the panels are installed with a water sprinkler system to standardize the cleaning process and to measure the water consumption precisely. It was found that the coated modules require 3.5 L of water per module to be cleaned and the uncoated panel consumed more than 7 L of water. In addition to that, the coated samples only need water for cleaning, whereas the uncoated panels need other hand-cleaning tools required in the conventional methods.

4.2. Parameter Performance

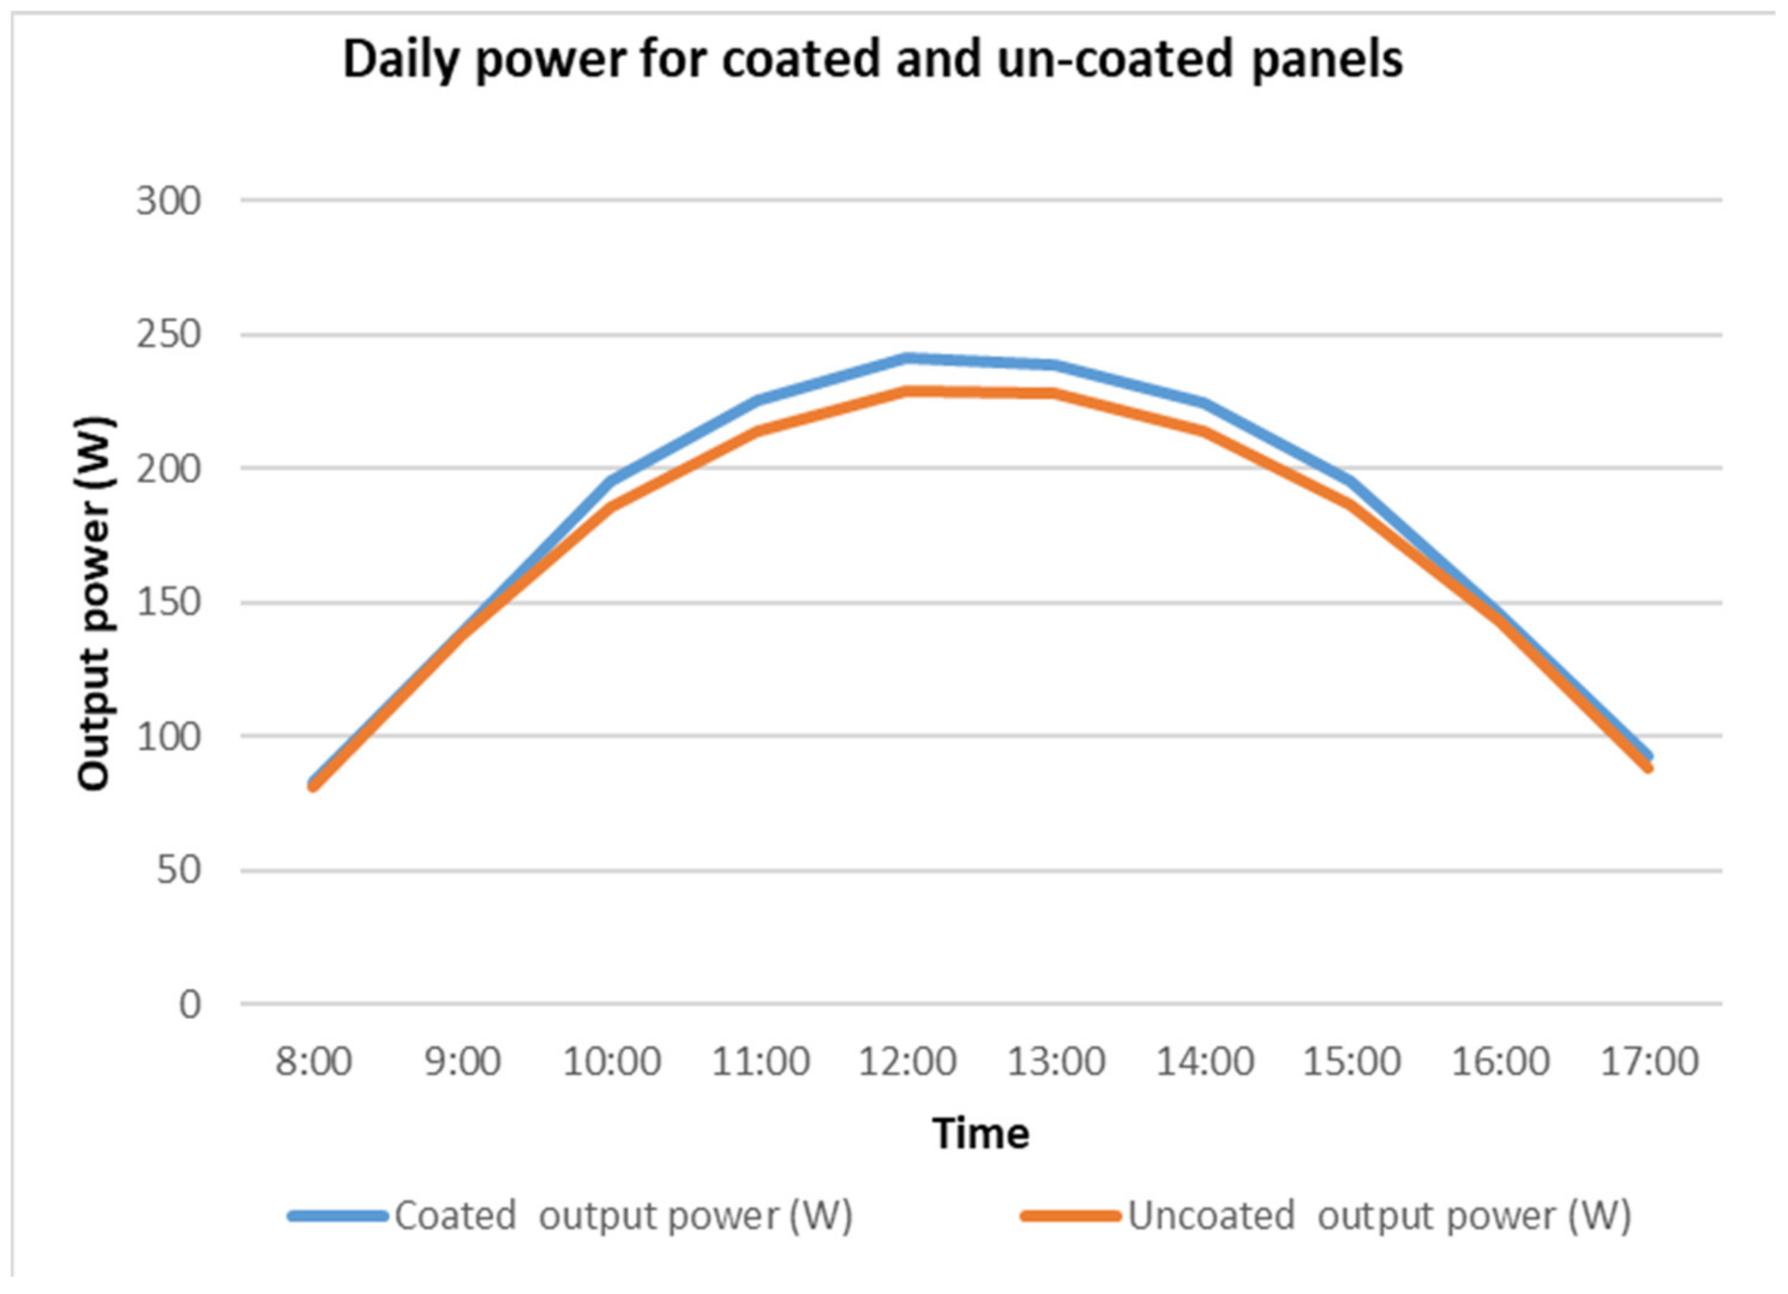
4.2.1. Hourly Daily Power for Coated and Uncoated Modules

A sample of the hourly output power during the day is shown in Figure 12. The results reveal that the coated panel exhibits higher output power generation than the uncoated panels throughout the day. Note the maximum difference occurred at noon where the system is facing normal light incidence.

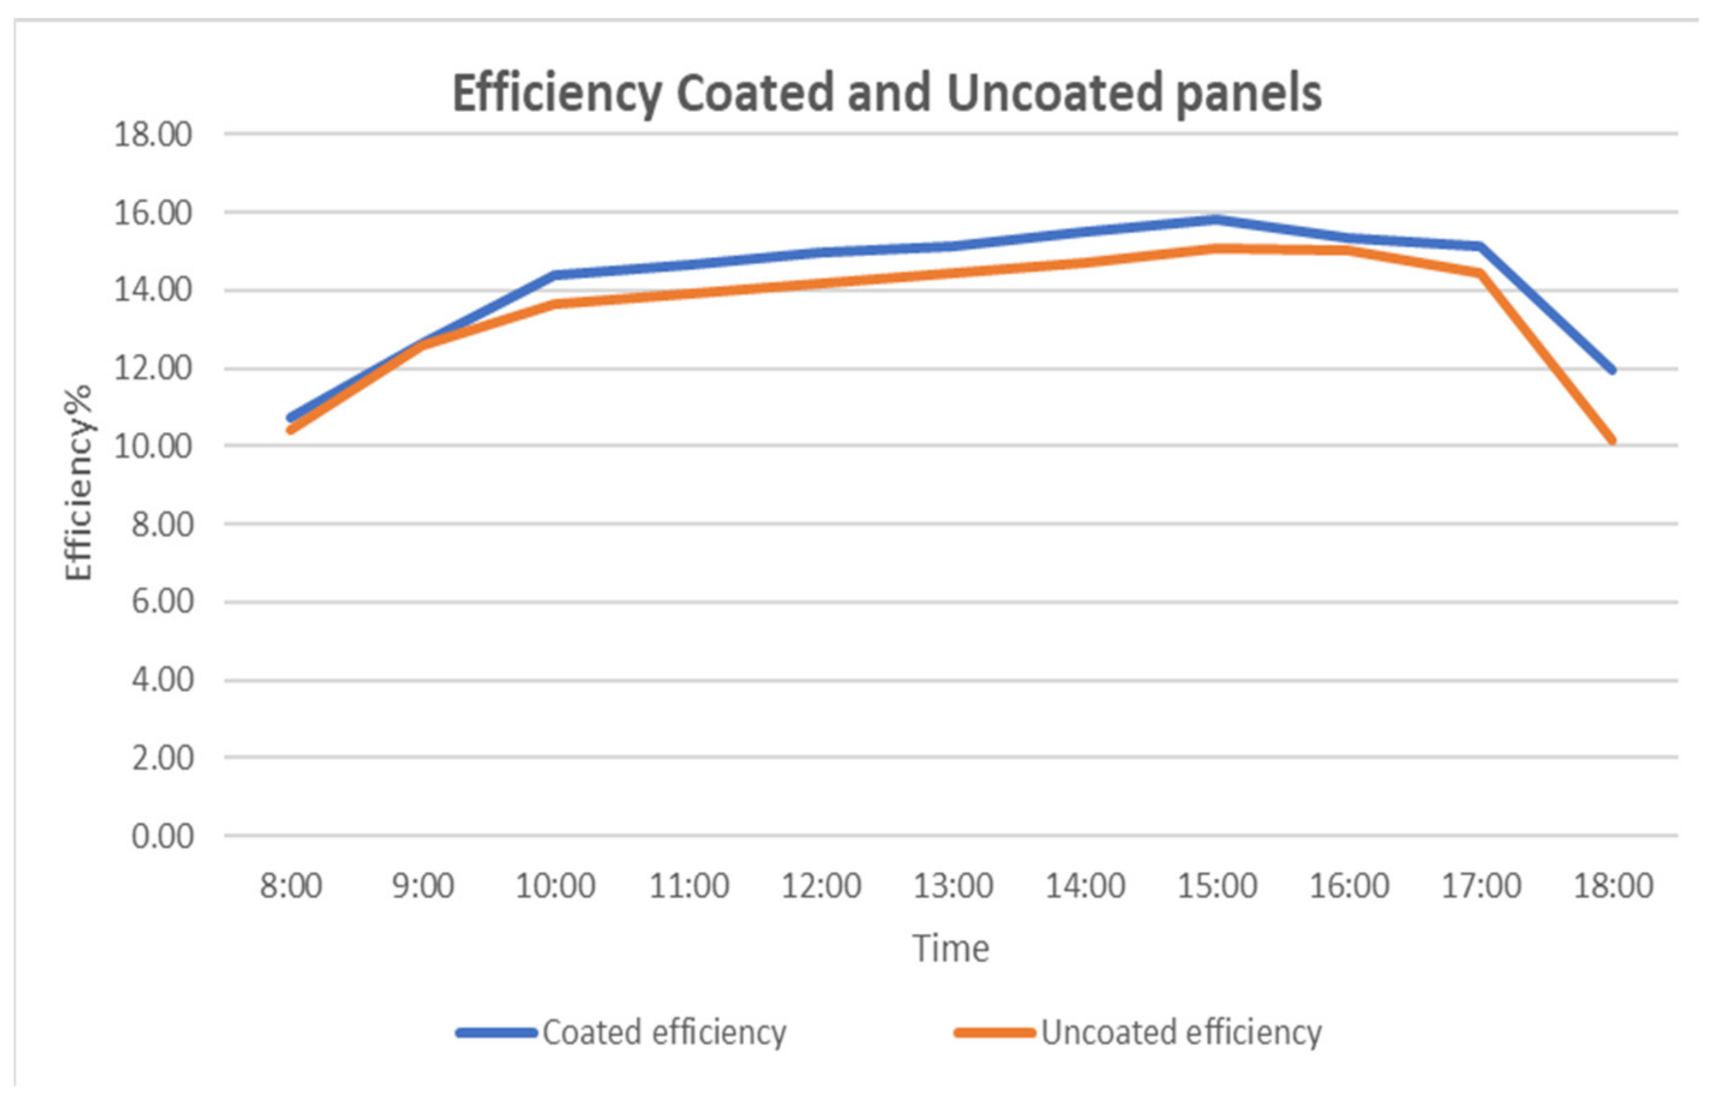
4.2.2. Power Efficiency for Coated and Uncoated Panels

The power conversion efficiency for both panels is shown in Figure 13. These results show clearly how the efficiency of both panels changes with the light incident angle. Although both panels change efficiency during the day, the coated panels show enhanced efficiency compared to the uncoated panel. From the results shown in Figure 12 and Figure 13, it can be concluded that the coated panel has less dust accumulation compared to the uncoated panels. This situation is preferred in any PV system installed in dusty areas, as it can maintain higher energy generation than uncoated panels, even if the panels are not cleaned regularly.

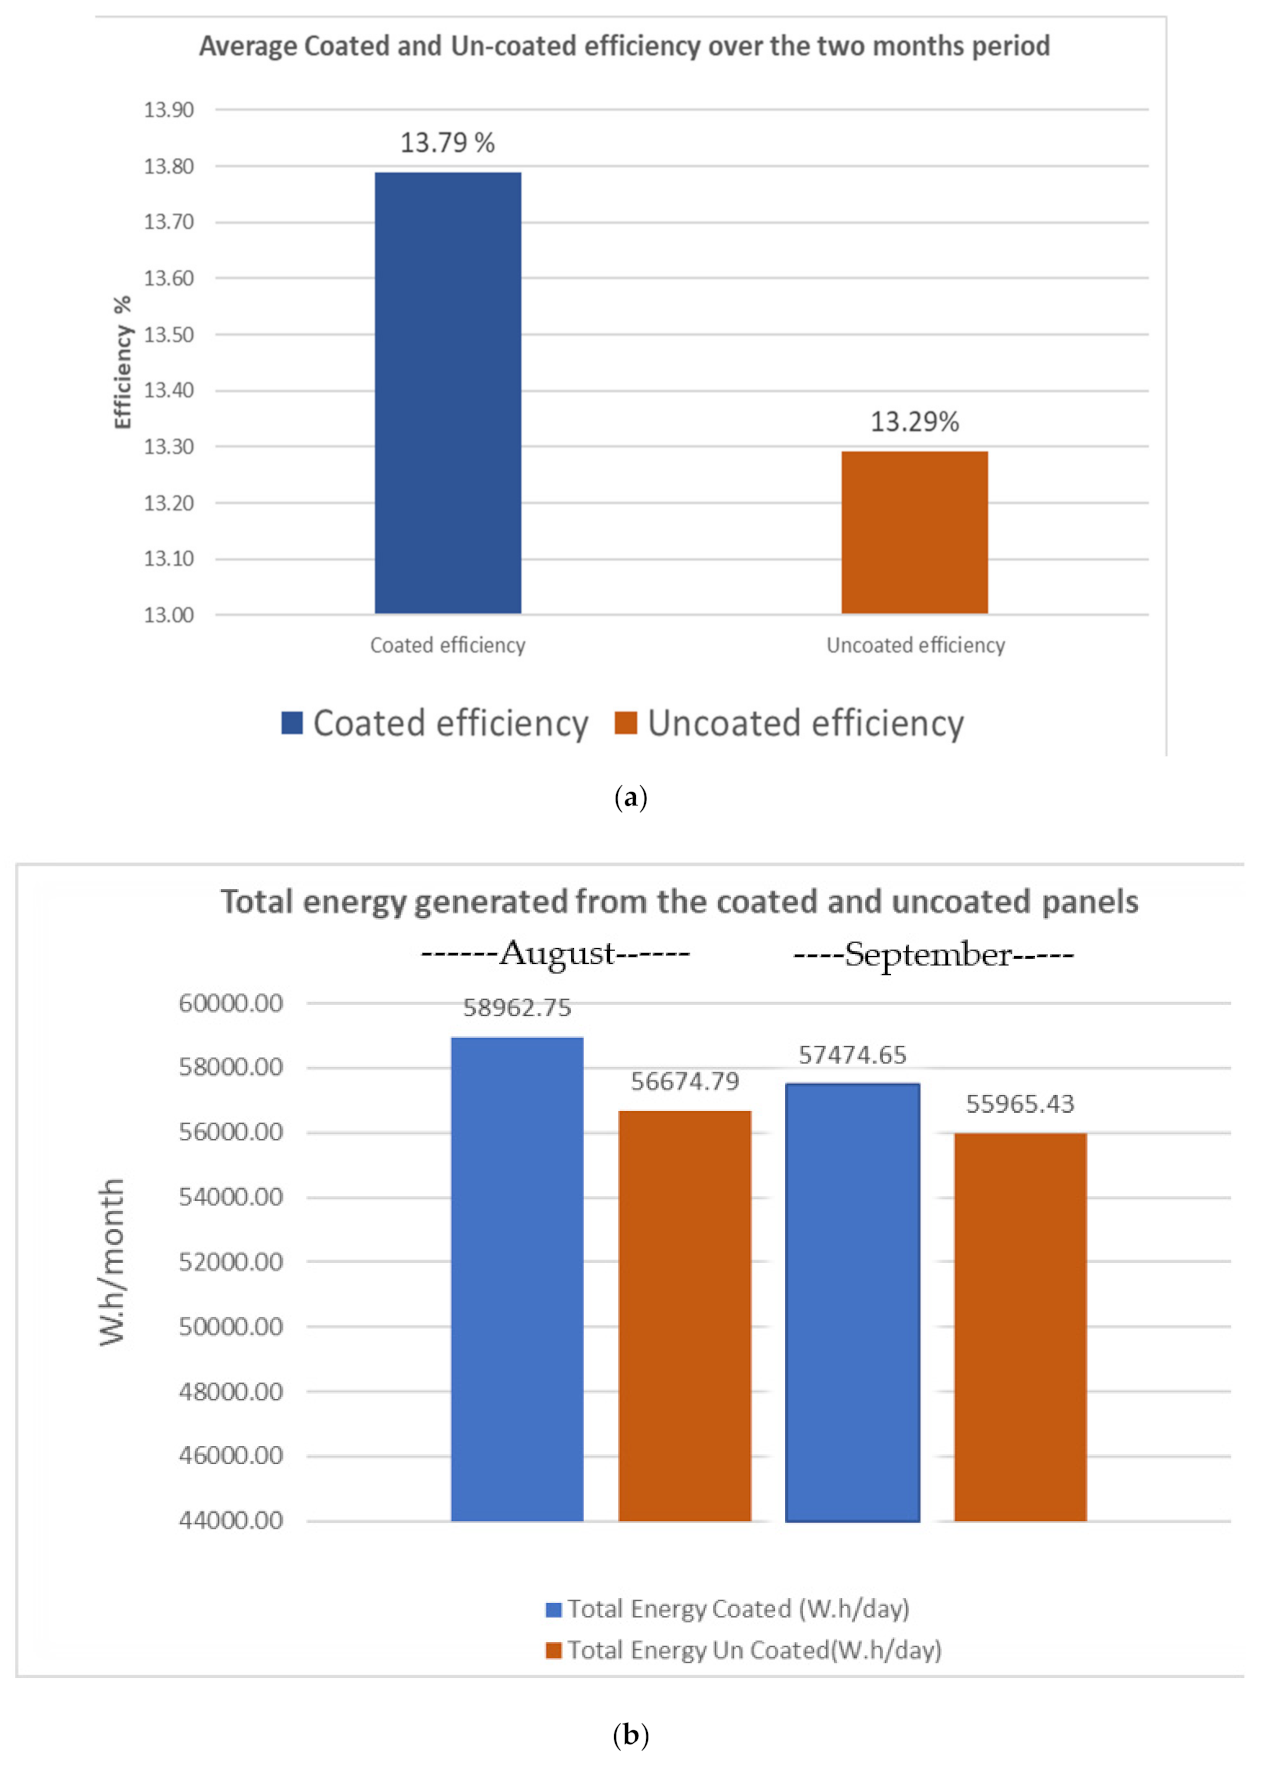
4.2.3. Average Electrical Efficiency of the Coated Module

The average electrical efficiency of the coated module is about 13.79%, and that of the uncoated one is around 13.29% (see Figure 14a). This data was recorded for 60 days, during the summertime (August and September), when most of the dust accumulation occurs. It is noted that the total energy generated in August by the coated modules is 58.9 kWh/month, and that generated by the uncoated module is 56.6 kWh/month, as shown in Figure 14b. Reduced energy generation in September occurred due to less solar radiation compared to August. However, the coated panels show higher power generation. During the 60-day period, the output power of the coated panels was 0.5% higher than the uncoated panels. Increased power generation will have greater effectiveness when the same coating technique is used for large projects, especially in the megawatt (MW) range.

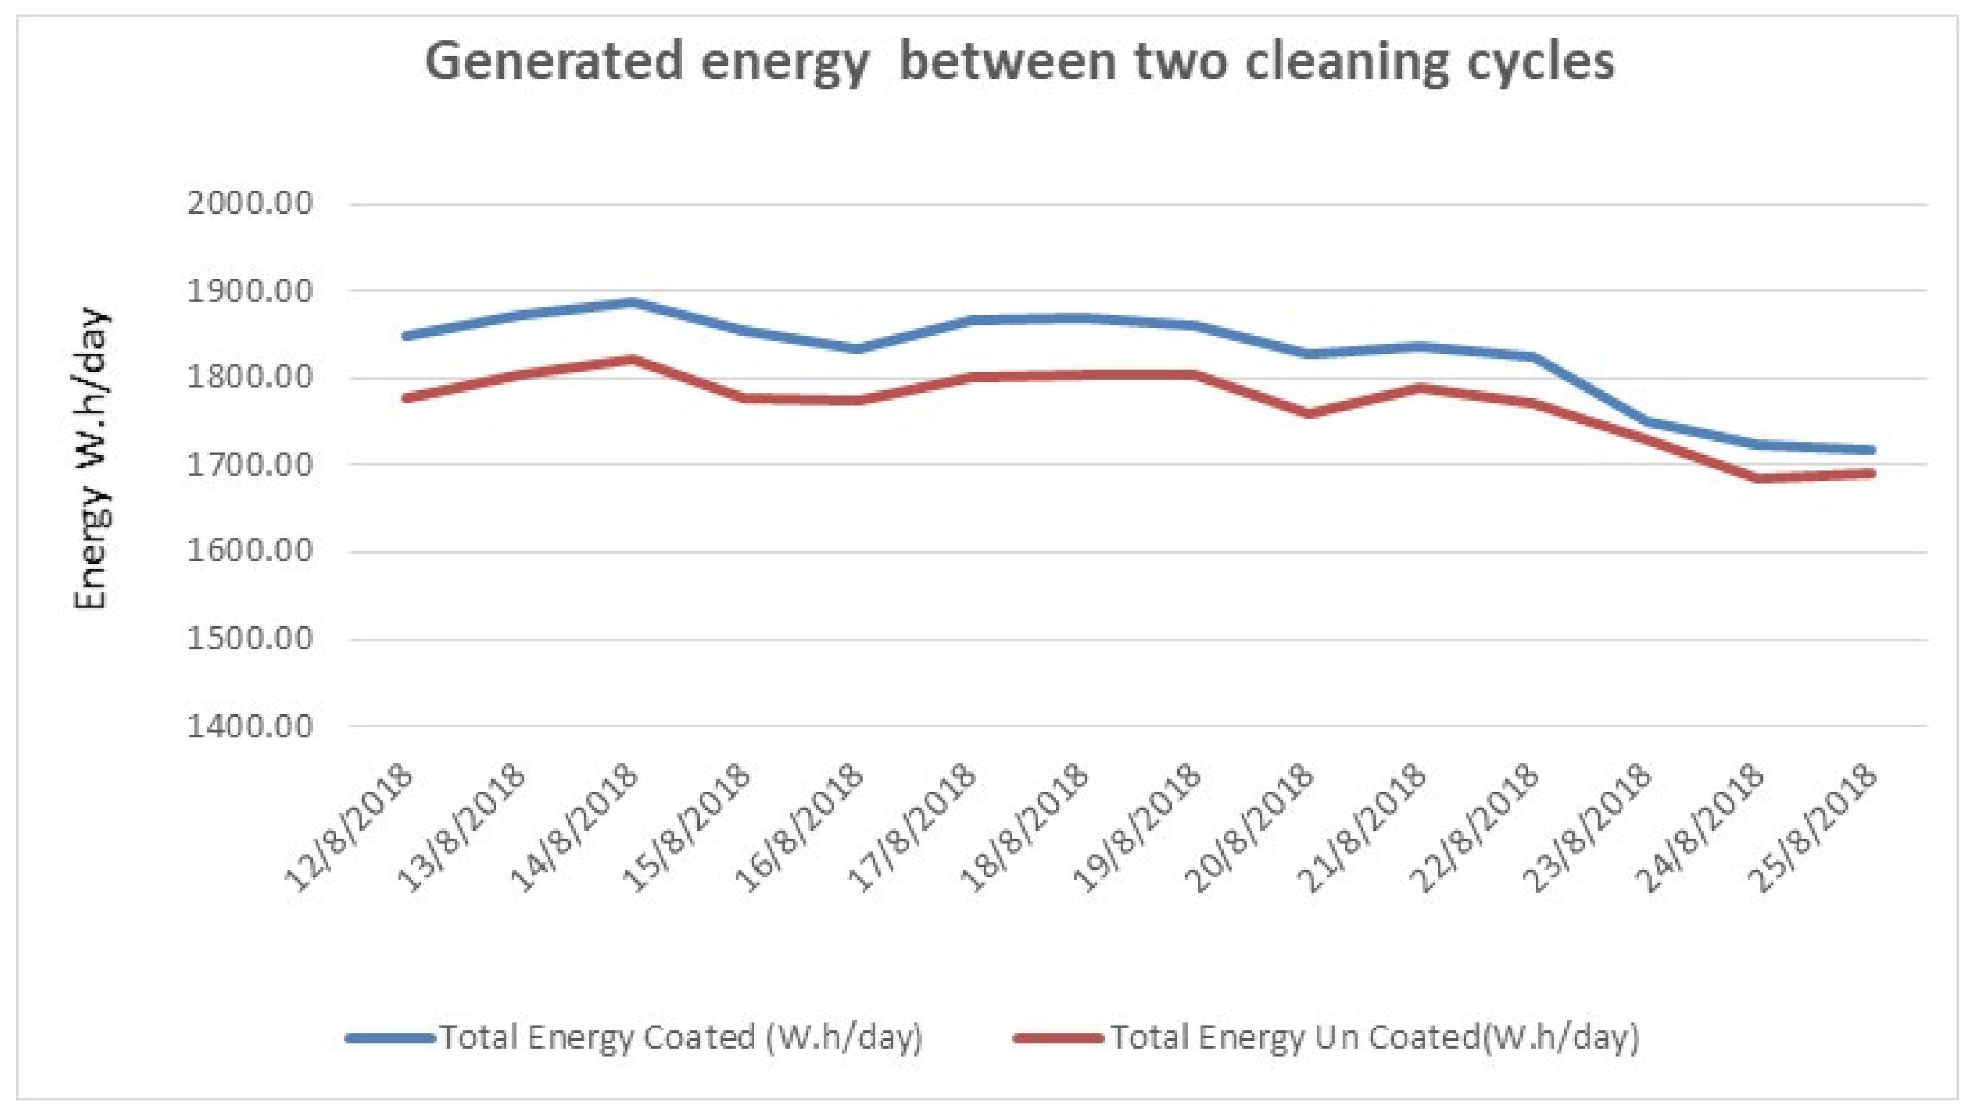
4.2.4. Daily Generated Energy between Two Cleaning Cycles

According to [20], for semi-arid and desert regions, the optimal average period between cleaning is 13 to 15 days. This cleaning frequency is followed strictly in this study. During the two-week period and due to the accumulation of dust, a drop in efficiency is expected. This is clearly shown in Figure 15. Although both panels have output energy reduction, the coated panels are still superior to the uncoated panels. This can be attributed to the fact that hydrophobic surfaces have less surface tension, therefore reducing the tendency for dust particles to stick on the coated surface [25,26,27,28,29,30]. Therefore, less dust accumulation is achieved, making this method an excellent choice for dusty areas.

5. Conclusions

PV performance is enhanced by the self-cleaning hydrophobic nanocoating technique. The study was conducted on photovoltaic polycrystalline Si solar cell modules in a semi-arid geographical location. The high dust accumulation on the solar panels in these areas reduces generated power. The proposed PV coating enhanced the properties of PV panels by reducing dust accumulation and costs associated with cleaning cycles. It is found and concluded that the coated panels have 13% more output power generation, even without regular surface cleaning. Moreover, the coated panels consumed 50% less water than the uncoated panels. Additionally, the coated panels do not require any cleaning tools that are needed when conventional cleaning methods are used. These results can be applied to large-scale production of PV modules worldwide, making these systems more cost-effective and environmentally friendly.

Author Contributions

Conceptualization, E.A., I.K., W.H., M.A., T.S., H.M.K. and S.M.M.; methodology, E.A., I.K., W.H., M.A., T.S., H.M.K. and S.M.M.; software, E.A., W.H. and H.M.K.; validation, E.A., I.K., W.H., M.A., T.S., H.M.K. and S.M.M.; formal analysis, I.K., H.M.K. and S.M.M.; investigation, E.A., I.K., W.H., M.A., T.S., H.M.K. and S.M.M.; resources, E.A., I.K., W.H., M.A., T.S., H.M.K. and S.M.M.; data curation, M.A. and T.S.; writing—original draft preparation, E.A., I.K., W.H., M.A., T.S., H.M.K. and S.M.M.; writing—review and editing, I.K., H.M.K. and S.M.M.; visualization, M.A., T.S. and H.M.K.; supervision, I.K., H.M.K. and S.M.M.; project administration, I.K., H.M.K. and S.M.M.; funding acquisition, I.K. and S.M.M. All authors have read and agreed to the published version of the manuscript.

Funding

Natural Sciences and Engineering Research Council of Canada (NSERC), Discovery Grant no. RGPIN-2021-02574, Innocent Kamwa, Laval University.

Conflicts of Interest

The authors declare no conflict of interest.

Nomenclature

Acronyms
AUSAustralia
CDDConcentrator Data Device
DIDeionized
EUREurope
HUHashemite University
MEASTMiddle East
MENAMiddle East and North Africa
MPPTMaximum Power Point Tracking
MWMega Watt
NAFRNorth Africa
NAMENorth America
NEAsiaNortheast Asia
PCPersonal Computer
PRPerformance Ratio
PVPhotovoltaic
SAMESouth America
SWAsiaSouthwest Asia
UNUnited Nations
UV-VUltraviolet–Visible
Symbols
Na+Sodium ion
Ca+Calcium ion
K+Potassium ion
Mg+2 Magnesium ion
Ca+2Calcium ion
O2Oxygen
SiSilicon
SiO2Silicon Dioxide
FeIron
(-Si(CH3)2O-] n)Silicone oil
R4 (OR5) p—OHPolysiloxane resin
(CH3)2CHOH)Isopropyl alcohol
Γ fused form of temperature state
subspace
ccoated panel
ucuncoated panel
Fmodel matrix of temperature state
α transition matrix of coated PV module temperature
β transition matrix of coated PV module temperature
Q heat absorbed by the PV solar
ρ a b s coefficient for heat absorption
Aarea of PV module
Rreflectivity
Iintensity of solar radiation
δ absorption coefficient
f temperature function
z depth of penetration of solar light
η efficiency
P output module power
G incident solar radiation
G B P   improvement factor
E output module energy

References

  1. Ali, M.; Alireza, R.; Behrooz, M.Z.; Farzad, S.; Lasse, R. Hybrid energy harvesting system to maximize power generation from solar energy. Energy Convers. Manag. 2020, 205, 112352. [Google Scholar]
  2. Laveet, K.; Hasanuzzamana, M.; Rahim, N.A. Global advancement of solar thermal energy technologies for industrial process heat and its future prospects: A review. Energy Convers. Manag. 2019, 195, 885–908. [Google Scholar]
  3. Montaser, M.; Mohamad, R.; Abdul-Ghani, O.; Keith, P.; Sumsun, N. A review of mechanical energy storage systems combined with wind and solar applications. Energy Convers. Manag. 2020, 210, 112670. [Google Scholar]
  4. Solar Energy Ranks as the Top Renewable Energy Source in the World. The NYU Dispatch, 23 April 2018. Available online: https://wp.nyu.edu/dispatch/2018/04/23/solar-energy-ranks-as-the-top-renewable-energy-source-in-the-world/ (accessed on 23 April 2018).
  5. Gholami, A.; Khazaee, I.; Eslami, S.; Zandi, M.; Akrami, E. Experimental investigation of dust deposition effects on photo-voltaic output performance. Sol. Energy 2018, 159, 346–352. [Google Scholar] [CrossRef]
  6. Al-Badra, M.Z.; Abd-Elhady, M.S.; Kandil, H.A. A novel technique for cleaning PV panels using antistatic coating with a mechanical vibrator. Energy Rep. 2020, 6, 1633–1637. [Google Scholar] [CrossRef]
  7. Zhong, H.; Hua, Y.; Wang, Y.; Yang, H. TiO2/silane coupling agent composed of two layers structure: A super-hydrophilic self-cleaning coating applied in PV panels. Energy Procedia 2017, 105, 1077–1083. [Google Scholar] [CrossRef]
  8. Abd-Elhady, M.S.; Fouad, M.M.; Khalil, T. Improving the efficiency of photovoltaic (PV) panels by oil coating. Energy Convers. Manag. 2016, 115, 1–7. [Google Scholar] [CrossRef]
  9. Sun, K.; Jiang, L.; Lu, Y.; Wang, Y.; Zhou, K.; He, Z. Integrated effects of PM2.5 deposition, module surface conditions and nano-coatings on solar PV surface glass transmittance. Renew. Sustain. Energy Rev. 2018, 82 Pt 3, 4107–4120. [Google Scholar] [CrossRef]
  10. Maghami, M.R.; Hizam, H.; Gomes, C.; Radzi, M.A.; Rezadad, M.I.; Hajighorbani, S. Power loss due to soiling on solar panel: A review. Renew. Sustain. Energy Rev. 2016, 59, 1307–1316. [Google Scholar] [CrossRef] [Green Version]
  11. Cordero, R.R.; Damiani, A.; Laroze, D.; MacDonell, S.; Jorquera, J.; Sepúlveda, E.; Feron, S.; Llanillo, P.; Labbe, F.; Carrasco, J.; et al. Effects of soiling on photovoltaic (PV) modules in the Atacama Desert. Sci. Rep. 2018, 8, 1–14. [Google Scholar] [CrossRef] [Green Version]
  12. Caron, J.R.; Littmann, B. Direct monitoring of energy lost due to soiling on first solar modules in California. IEEE J. Photovolt. 2013, 3, 336–340. [Google Scholar] [CrossRef]
  13. Ghazi, S.; Sayigh, A. Dust effect on flat surfaces—A review paper. Renew. Sustain. Energy Rev. 2014, 33, 742–751. [Google Scholar] [CrossRef]
  14. Shao, Y.; Klose, M.; Wyrwoll, K.H. Recent global dust trend and connections to climate forcing. J. Geophys. Res. Atmos. 2013, 118, 1–11. [Google Scholar] [CrossRef]
  15. Deutsche Gesellschaft für Sonnenenergie (DGS). Planning and Installing Photovoltaic Systems: A Guide for Installers, Architects and Engineers; Routledge: London, UK, 2008; pp. 1–521. [Google Scholar]
  16. Mekhilef, S.; Saidur, R.; Kamalisarvestani, M. Effect of dust, humidity, and air velocity on efficiency of photovoltaic cells. Renew. Sustain. Energy Rev. 2012, 16, 2920–2925. [Google Scholar] [CrossRef]
  17. Costa, S.C.S.; Diniz, A.S.A.C.; Kazmerski, L.L. Dust and soiling issues and impacts relating to solar energy systems: Literature review update for 2012–2015. Renew. Sustain. Energy Rev. 2016, 63, 33–61. [Google Scholar] [CrossRef] [Green Version]
  18. Costa, S.C.S.; Diniz, A.S.A.C.; Kazmerski, L.L. Solar energy dust and soiling R&D progress: Literature review update for 2016. Renew. Sustain. Energy Rev. 2018, 82, 2504–2536. [Google Scholar]
  19. Zeedan, A.; Barakeh, A.; Al-Fakhroo, K.; Touati, F.; Gonzales, A.S.P., Jr. Quantification of PV Power and Economic Losses Due to Soiling in Qatar. Sustainability 2021, 13, 3364. [Google Scholar] [CrossRef]
  20. Shaju, A.; Chacko, R. Soiling of photovoltaic modules—Review. In Proceedings of the International Conference on Recent Advancements and Effectual Researches in Engineering Science and Technology (RAEREST), Kerala State, India, 20–21 April 2018; Volume 396, pp. 1–10. [Google Scholar]
  21. Mehmood, U.; Al-Sulaiman, F.A.; Yilbas, B.S. Characterization of dust collected from PV modules in the area of Dhahran, Kingdom of Saudi Arabia, and its impact on protective transparent covers for photovoltaic applications. Sol. Energy 2017, 141, 203–209. [Google Scholar] [CrossRef]
  22. Yilbas, B.S.; Ali, H.; Khaled, M.M.; Al-Aqeeli, N.; Abu-Dheir, N.; Varanasi, K.K. Influence of dust and mud on the optical, chemical and mechanical properties of a PV protective glass. Sci. Rep. 2015, 5, 15833. [Google Scholar] [CrossRef]
  23. Hammad, B.; Al-Abed, M.; Al-Ghandoor, A.; Al-Sardeah, A.; Al-Bashir, A. Modelling and analysis of dust and temperature effects on photovoltaic systems’ performance and optimal cleaning frequency: Jordan case study. Renew. Sustain. Energy Revis. 2018, 82, 2218–2234. [Google Scholar] [CrossRef]
  24. Hudedmani, M.G.; Joshi, G.; Umayal, R.M.; Revankar, A. A comparative study of dust cleaning methods for the solar PV panels. Adv. J. Grad. Res. 2017, 1, 24–29. [Google Scholar] [CrossRef] [Green Version]
  25. Burke, M.; Greenough, R.; Jensen, D.; Voss, E. Project SPACE: Solar Panel Automated Cleaning Environment. Bachelor’s Thesis, Santa Clara University, Santa Clara, CA, USA, 2016. [Google Scholar]
  26. Makableh, Y.F.; Aljaiuossi, G.; Al-Abed, R. Comprehensive design analysis of electron transmission nanostructured layers of heterojunction perovskite solar cells. Superlattices Microstruct. 2019, 130, 390–395. [Google Scholar] [CrossRef]
  27. Mohammed, H.A.; Al-Hilli, B.A.M.; Al-Mejibli, I.S. Smart system for dust detecting and removing from solar cells. J. Phys. Conf. Ser. 2018, 1032, 1–8. [Google Scholar] [CrossRef]
  28. Makableh, Y.F.; Vasan, R.; Lee, S.; Manasreh, O.M. Enhancement of the performance of InAs quantum dots solar cell by surface modification using Poly-L-Lysine homopolymers. Appl. Phys. Lett. 2013, 102, 051904. [Google Scholar] [CrossRef]
  29. Makableh, Y.F.; Nusir, A.I.; Morris, H.; McKenzie, K.; Manasreh, O. Performance enhancement of InAs quantum dots solar cells by using nanostructured anti-reflection coating with hydrophobic properties. J. Nanophotonics 2016, 10, 046018. [Google Scholar] [CrossRef]
  30. Cully, P.; Karasu, F.; Muller, L.; Jauzein, T.; Leterrier, Y. Self-cleaning and wear-resistant polymer nanocomposite surfaces. Surf. Coat. Technol. 2018, 348, 111–120. [Google Scholar] [CrossRef]
Figure 1. Dust frequency global pattern—synoptic present weather records. NAME, SAME, NAFR, MEAST, SWAsia, NEAsia, EUR, and AUS are the acronyms of North America, South America, North Africa, Middle East, Southwest Asia, Northeast Asia, Europe, and Australia, respectively.
Energies 14 06800 g001
Figure 2. Performance monitoring and analysis of PV performance with cleaning characteristics.
Energies 14 06800 g002
Figure 3. Schematic diagram showing the main parts of the experimental PV module setup.
Energies 14 06800 g003
Figure 4. (ac) Types of contact angle.
Energies 14 06800 g004
Figure 5. Shimadzu UV3600 UV-Nir NIR spectrometer.
Energies 14 06800 g005
Figure 6. Spectrometer samples test result.
Energies 14 06800 g006
Figure 7. Solar Panels—YL300P-35P.
Energies 14 06800 g007
Figure 8. MICRO-0.3-I-OUTD-230.
Energies 14 06800 g008
Figure 9. ABB data logger—Radio-IEEE-802.15.4.
Energies 14 06800 g009
Figure 10. Transmission spectra of pristine glass and coated glass with SiO2 hydrophobic nanoparticles.
Energies 14 06800 g010
Figure 11. Contact angle between the liquid and solid coated.
Energies 14 06800 g011
Figure 12. Hourly daily power for coated and uncoated modules.
Energies 14 06800 g012
Figure 13. Hourly efficiency for coated and uncoated panels.
Energies 14 06800 g013
Figure 14. (a) Average coated and uncoated efficiency over the two-month period. (b) Total energy generated from the coated and uncoated panels in August and September.
Energies 14 06800 g014
Figure 15. The daily generated energy between two cleaning cycles.
Energies 14 06800 g015
Table 1. Contact angle results of samples.
Contact AngleFirst SampleSecond Sample
Degree of Angle104.91104.47
Contact Angle Picture
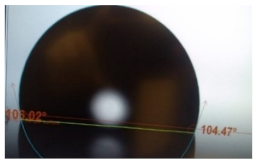
 Energies 14 06800 i001 Energies 14 06800 i002
Table 2. Test samples coating procedures.
Steps of Coating ProcedureImages of Procedure
STEP 1: Two samples were cleaned with water and soap. Energies 14 06800 i003
STEP 2: Samples were washed by distilled water. Energies 14 06800 i004
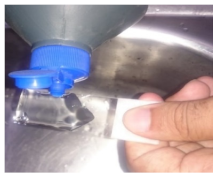
STEP 3: The sample was flooded in organic cleaners (isopropanol) at (US portable cleaner) ultrasound device. This was required to be cleaned from dirt, oil, and grease contamination. Energies 14 06800 i005
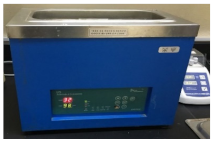
STEP 4: Nanomaterial was added to a sponge. This is then further swabbed on the surface of the sample horizontally and vertically. Energies 14 06800 i006
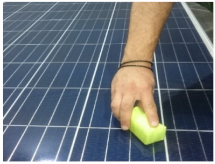
STEP 5: The module was buffed with a towel.
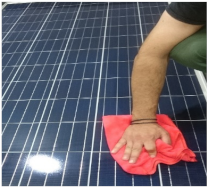
 Energies 14 06800 i007
Table 3. PV module specifications—Polycrystalline Si.
PV Module—Polycrystalline SiliconSpecification
Module Efficiency at standard test conditions (STC)15.4%
Maximum Power Output300 W
Maximum Power Voltage36.7 V
Maximum Power Current8.17 A
Open Circuit Voltage46.3 V
Short-Circuit Current8.77 A
Temperature Coefficient−0.45 °C
Module Area1970 mm × 990 mm
Weight25.8 kg
Table 4. Micro-inverter specifications—MICRO-0.3-I-OUTD-230.
ABB MICRO InverterSpecification
Nominal output power300 W
Maximum DC input power310 W
Maximum voltage V DC max65 V
Maximum current I DC max10.5 A
Maximum short-circuit limit12.5 A
Table 5. Data logger specifications—ABB Radio-IEEE-802.15.4.
ABB Data Logger-Radio-IEEE-8.2.15.4Specifications
Sample rate1 min
Maximum distance50 m
Wireless communicationRadio-IEEE 802.15.4/b-2.4 GHz/10 Mbps
Wired communicationEthernet RJ45 Ethernet
Publisher’s Note: MDPI stays neutral with regard to jurisdictional claims in published maps and institutional affiliations.

