Abstract
The transformation of our energy system toward zero net CO2 emissions correlates with a stronger use of low energy density renewable energy sources (RES), such as photovoltaic (PV) energy. As a source of flexibility, distributed PV systems, in particular, are oftentimes installed in combination with battery storage systems. These storage systems are dispatchable, i.e., controllable by the operating owners, who can thereby take over an active market role as energy prosumers. The particular battery operation modes are based on the individual prosumer decisions, which, in turn, are strongly affected by the regulatory framework in place. Regulatory frameworks differ from country to country, but almost all regulatory frameworks feature a network charge mechanism, which allocates network infrastructure and operating costs to the end customers. This raises the question of the extent to which different network charges lead to different prosumer decisions, i.e., battery operation modes, and thus different energy system configurations (system costs). In order to evaluate this question we apply (a) a fundamental linear optimization model of the energy wholesale market, which we stringently link to (b) an analysis of peak-coincident network capacity utilization as well as (c) an evaluation of the complete costs of energy for prosumers and consumers. This stringent cycle of analysis is applied to two prototypical network allocation schemes. We demonstrate that network allocation schemes that are orientated to peak-coincident network capacity utilization could both better incentivize a distribution network-oriented behaviour and better share financial burdens between prosuming and purely consuming households than would be the case for volumetric network charge designs. This paper further demonstrates that network-oriented battery operation does not, per se, result in optimal RES integration at the wholesale market level and CO2 emissions reduction. To identify effects from increasing sector integration, an analysis is both performed for a setting without and with consideration of widespread e-mobility. As a broader conclusion, our results demonstrate that future regulatory frameworks should have a stronger focus on prosumer integration by means, among other things, of an adequate network charge design reflecting the increasingly distributed nature of our future energy system.
1. Introduction
The shift from a conventional, centralized electricity production to a more distributed generation of electricity brings numerous distributed stakeholders into play who evolve from passive energy consumers to active market participants (prosumers) (Parts of this paper were originally presented at the 1st IAEE Online Conference; see [1]. However, this manuscript provides a substantial extension of results, analysis and conclusions over the conference proceedings paper, including a comprehensive overview of the state of the art, consideration of different prosumer penetration ratios, and analysis of the impact of widespread e-mobility. Sections that have been adopted from [1] are explicitly identified in this paper. The introduction section itself is adopted in parts from [1]). Distributed PV power systems, in combination with controllable flexibility elements such as battery storage units, are expected to play a major role, in particular. While prosumer storage capacities can provide a necessary source of needed flexibility in general, in reality, these flexibilities oftentimes operate inflexibly for individual profit maximization. In principle, three prototypical battery operation modes can be distinguished as follows:
- Distributed flexibilities can operate for individual profit maximization, depending on the regulatory framework. This oftentimes equals self-consumption maximization; scope of analysis: n = one household;
- Distributed flexibilities can operate (distribution) network-beneficially, reducing peak-coincident network utilization; scope of analysis: n = tens to hundreds of households;
- Distributed flexibilities can operate market beneficially to leverage portfolio effects for optimal RES integration at the wholesale market (system) level; scope of analysis: n = thousands to millions of households.
In principle, prosumer households could have direct market access and participate individually and independently in the energy market. Another option is that several prosumer households join together to form (virtual) prosumer associations, energy cooperatives, or the like. In both cases, the prosumer behaviour is strongly driven by the specific policy instruments in place. Among these instruments, network charges play a crucial role in view of re-financing network operation and infrastruture costs. For regulatory frameworks with volumetric network charges, profit maximization oftentimes results in self-consumption (SC) maximization. However, from a system perspective, SC maximization by means of predetermined prosumer heuristics results in overall flexibility reduction, potentially burdening both the distribution network and the wholesale market; see [2]. The basic idea of our research approach is to analyze these effects for two exemplary network charge mechanisms. The novelty value of this study consists in a fully stringent consideration of individual end-user effects (energy bills), local network aspects and global system (wholesale market) impacts. This way, our approach combines the analysis of social needs (e.g., allocation of network costs), the analysis of technical aspects (e.g., peak-coincident network capacity utilization), and the analysis of system effects (e.g., RES market integration at the wholesale market level).
1.1. Previous Works
The relevant existing literature for this study can be divided into three groups. The first group of studies deals with the general theory of network charge design and/or analyzes particular network cost allocation mechanisms in view of individual end-consumer aspects. The second group of studies analyzes local distribution network aspects in the presence of high shares of distributed prosumer generation. The third group of studies takes on a system perspective to evaluate the impact of distributed prosumer generation at the (wholesale) market level.
1.1.1. General Theory of Network Charge Design and Individual Aspects
Network charges fulfill different functions in the energy system; most importantly:
- As their primary objective, network charges are the instrument of re-financing network operation and infrastructure to guarantee fixed-cost recovery;
- Moreover, network charges can constitute a steering element for the system-beneficial operation of flexibilities. System-beneficial operation may involve both grid- and market-oriented behaviour, which could coincide, but could also conflict. In other words, network charges should ideally provide an efficient, economic signal to end users in the system.
An overview of the existing network charge mechanisms of selected European countries is provided by [3], for instance. Studies such as [4,5] provide a more conceptual overview of existing network charge mechanisms. The latter classifies network charge mechanisms into three clusters: nodal marginal methods (nodal marginal pricing), rolled-in methods via postage stamp and mean participation factors, and embedded methods based on power flow analysis, such as MW-mile methods. These methods are not necessarily mutually exclusive but can come in combinations. Ref. [6], for instance, discusses that nodal marginal pricing is not able to recover the full network costs in reality and evaluates a combination of locational marginal pricing and rolled-in methods. The authors study mean participation factors as a particular rolled-in method, based on a cost causality (or “extent of use”) principle. The basic idea is to allocate complementary network costs (i.e., the remaining part of the network costs after marginal network pricing) to system users according to their individual contributions to each line flow of the network. This method has been considered or finally applied in reality, albeit only sporadically. One important and widely used (e.g., in the ENTSO-E) alternative is volumetric network charges, i.e., fixed charges per unit energy transmitted via the public grid. They belong to the class of postage stamp methods (i.e., the network charge is independent of the actual electricity transmission distance). Their widespread use is also due to their technical simplicity. However, the problem with volumetric network charges is that they do not properly comprise cost causality; see [7], for instance. This is due to the fact that grid infrastructure, in particular, is not based on marginal costs; i.e., the individual avoidance of grid charges does not result one-to-one in overall lower grid costs. Further analysis of rolled-in network charges is provided by [8], who evaluate different exogenous network charge mechanisms (equal sharing, allocation by electrical distance, zonal cost allocation) for a consumer-centric peer-to-peer market framework, illustrated on a 39-bus system. This paper demonstrates that relatively simple (and transparent) exogenous cost allocation mechanisms can, in principle, incite a network-beneficial prosumer behaviour. The earlier mentioned MW-mile method is the first of the power flow-based pricing strategies that considers the actual network use; see [9]. The core idea is to allocate transmission costs per line length of transmission and per power flow per line. This method encourages an efficient network use; however, it is complicated to realize, as it requires multiple power flow calculations. Further improvements of this method could also consider the load quality, distinguishing between reactive and active power. Moreover, one could also base the method on current flows instead of power flows; see [10]. Ref. [11] analyzes uniform marginal prices (as opposed to locational marginal prices), which they derive from a maximum social welfare condition on the basis of a 42-bus test distribution network. They demonstrate that such uniform, but time-varying, prices can send efficient signals to end customers to optimize grid operation (e.g., high peak load prices). This study is relevant for our analysis in that we will take on the concept of peak-load pricing; however, we will add a consideration of system effects and allocation aspects between different customer groups.
A couple of studies have a particular focus on the impact of prosumers on network tariffs. Studies such as [7,12] discuss the problem of cross subsidies from consumers to prosumers with volumetric network charges. Ref. [7] discusses that volumetric network charges can lead to cross subsidies, which burden consuming (when we use the term consumers/consuming households, we refer to non-prosuming households throughout the manuscript) households in the presence of self-consuming prosumers. This is a direct result from the option of prosuming households to cover a part of their electricity demand by their own PV production (SC), which is exempt from regulatory cost allocations such as network charges. As a consequence, total network costs are allocated to fewer households (or, to be precise, there is a lesser amount of energy withdrawn from the grid), leading to higher specific, and in the case of consuming households also higher absolute, network charges. Ref. [12] specifically analyzes the effect of widespread distributed generation on network tariffs in the context of cost allocation between different costumer groups of prosuming and consuming households. The authors demonstrate that volumetric tariffs in combination with prosumer net metering can rise significantly with increasing PV penetration due to the above-mentioned effects. Consequently, the authors conclude that such network tariffs do not properly reflect cost causality originating from load- and PV-driven costs. Ref. [13] further analyzes equity issues between prosumers and consumers by means of a non-cooperative game for the network cost recovery in view of different rate designs including volumetric and capacity-based network charges. All of these studies provide valuable insights regarding the design of different network charges on their local impacts. However, they do not (aim to) analyze system level effects to a full extent; i.e., simulation or optimization is restricted to the local grid.
1.1.2. Analysis of Local Distribution Network Systems with High Distributed Generation
A range of studies analyze local distribution networks, in many cases on the basis of specific n-bus systems. Ref. [14] provides a review of the impacts of high PV penetrations in low voltage distribution networks, including a discussion of several (mostly technical) mitigation techniques. Amongst other methods, they discuss distributed battery storage systems, which can be operated for load leveling (energy is stored in a battery when grid power exceeds load demand and vice versa), arbitrage mode (energy is purchased at off-peak and utilized during peak hours) or export curtailment mode (excess PV generation is stored into battery storage). However, given the status of a review paper, the authors do not provide an actual system analysis to determine in what way the different operation modes could actually contribute to network stress reduction—which we address in our paper. Ref. [15] provides a range of technical tools and methodologies to investigate the steady-state as well as dynamic impacts of widely spread distributed PV generation on the distribution network, such as reverse power flows and voltage fluctuations. Ref. [16] evaluates the impact of distributed battery storages on low-voltage distribution networks, especially in view of inverse power flows. The authors demonstrate that there is a conflict of interests between distributed battery owners and network operators. They demonstrate that for certain inflexible storage operation strategies, which aim at SC maximization, high stress is induced on the distribution network. This is a consequence of high feed-in peak times, which occur when peak PV generation meets batteries already fully charged. When batteries are operated to absorb peak generation, the distribution network can be relieved, however, at the cost of lower individual SC. Ref. [17] analyzes voltage stability for residential customers in distribution networks with high small-scale grid-connected PV penetration. According to their analysis of a local 13-bus system network, voltage instability typically occurs for PV penetration levels ≥40% The authors also investigate the impact of distributed battery storage systems, demonstrating that batteries can maintain voltage stability in general. However, reduction of voltage instability crucially depends on the local positioning of the batteries within the network. Again, the mentioned papers provide valuable insights regarding the impact of distributed generation and battery storage. However, the authors do (a) not provide a full system perspective to determine in what way the battery operation modes impact the wholesale market, and (b) do not fully evaluate the individual end customer costs of electricity and allocation aspects between different end-user groups.
1.1.3. Analysis of System Impacts
A third group of studies analyze system-level impacts in the presence of high prosumer shares. Ref. [18] analyzes different aspects of alternative network charge designs, modelling both customer bill and system operational costs. In particular, they compare volumetric network charges with a design that includes peak-coincident network capacity charges (EUR/kW) and Ramsey-like allocation of the residual network costs (e.g., fixed charges per customer in EUR/user). They argue that a design based on peak-coincident network capacities constitutes an efficient ideal approach, in that such a design incites the network users to relieve the grid, in contrast to volumetric charges, which incite SC maximization. On top of this, their suggested design avoids direct interference with energy prices [EUR/MWh] and therefore minimizes economic distortion effects. They demonstrate that this approach both leads to the lowest end customer bill and leads to the greatest reduction of marginal system costs. This paper is of special importance for us in that we apply the suggested construction of capacity charges to our closed-loop analysis. Energy cooperatives, such as those analyzed by [19], could represent a particularly interesting level of aggregation and could play an important role for effective prosumer integration into the energy system. Another approach to combine the individual household and system perspectives is provided by the authors of [20], who analyze the role of electric SC in view of distinct levels of aggregation. The authors demonstrate by means of an energy supply system optimization that self-sufficiency at the individual household level is economically favorable only at decent degrees (around 30%). At higher aggregation level (≥560 households), however, full self-sufficiency could be economically advantageous. The authors conclude that this is a consequence of system-oriented battery operation in combination with profile smoothing effects, such as a reduction in demand fluctuation and reduction of peak loads. However, these studies are limited in that the system analyses crucially depend on exogenous model assumptions such as exogenous time series of wholesale market prices. Moreover, quantification of distributional effects between prosuming and consuming households is missing. Finally, ref. [21] reviews a total of 359 studies that deal with system modelling of decentralized energy autonomy. The authors conclude that (a) studies generally lack an evaluation of the impact of autonomous systems (such as prosumers striving for SC maximization) on the surrounding system and (b) local stakeholders need to be considered methodologically. Both aspects are crucial parts of this paper and will be focused on in the following.
1.2. Our Contribution
The aim of our analysis is to study the impact of high shares of energy prosumers under consideration of two different network charge mechanisms. The first mechanism, volumetric network charges, is representative for a widespread status quo, whereas the second mechanism, peak-coincident capacity network charges, represents a potential future scheme in order to integrate distributed PV and battery systems more efficiently. The novelty value of this manuscript lies in the simultaneous consideration of end-consumer effects, distribution network effects, and wholesale market effects under the realistic depiction of relevant regulatory aspects of the electricity retail market. According to our knowledge, such an integrated view of network charges has not yet been carried out. Key questions to be answered in this study are:
- Individual stakeholder level: In what way do certain network charge mechanisms contribute to distributive justice, e.g., fair allocation of costs among prosuming and consuming households?
- Distribution network level: In what way can certain network charge mechanisms contribute to steer network-beneficial, i.e., grid-relieving, behaviour?
- Wholesale market level: In what way do local distribution network relief (e.g., reduction of peak-coincident network capacity utilization) and global wholesale market benefits (e.g., optimal RES integration) coincide or conflict?
2. Materials and Methods
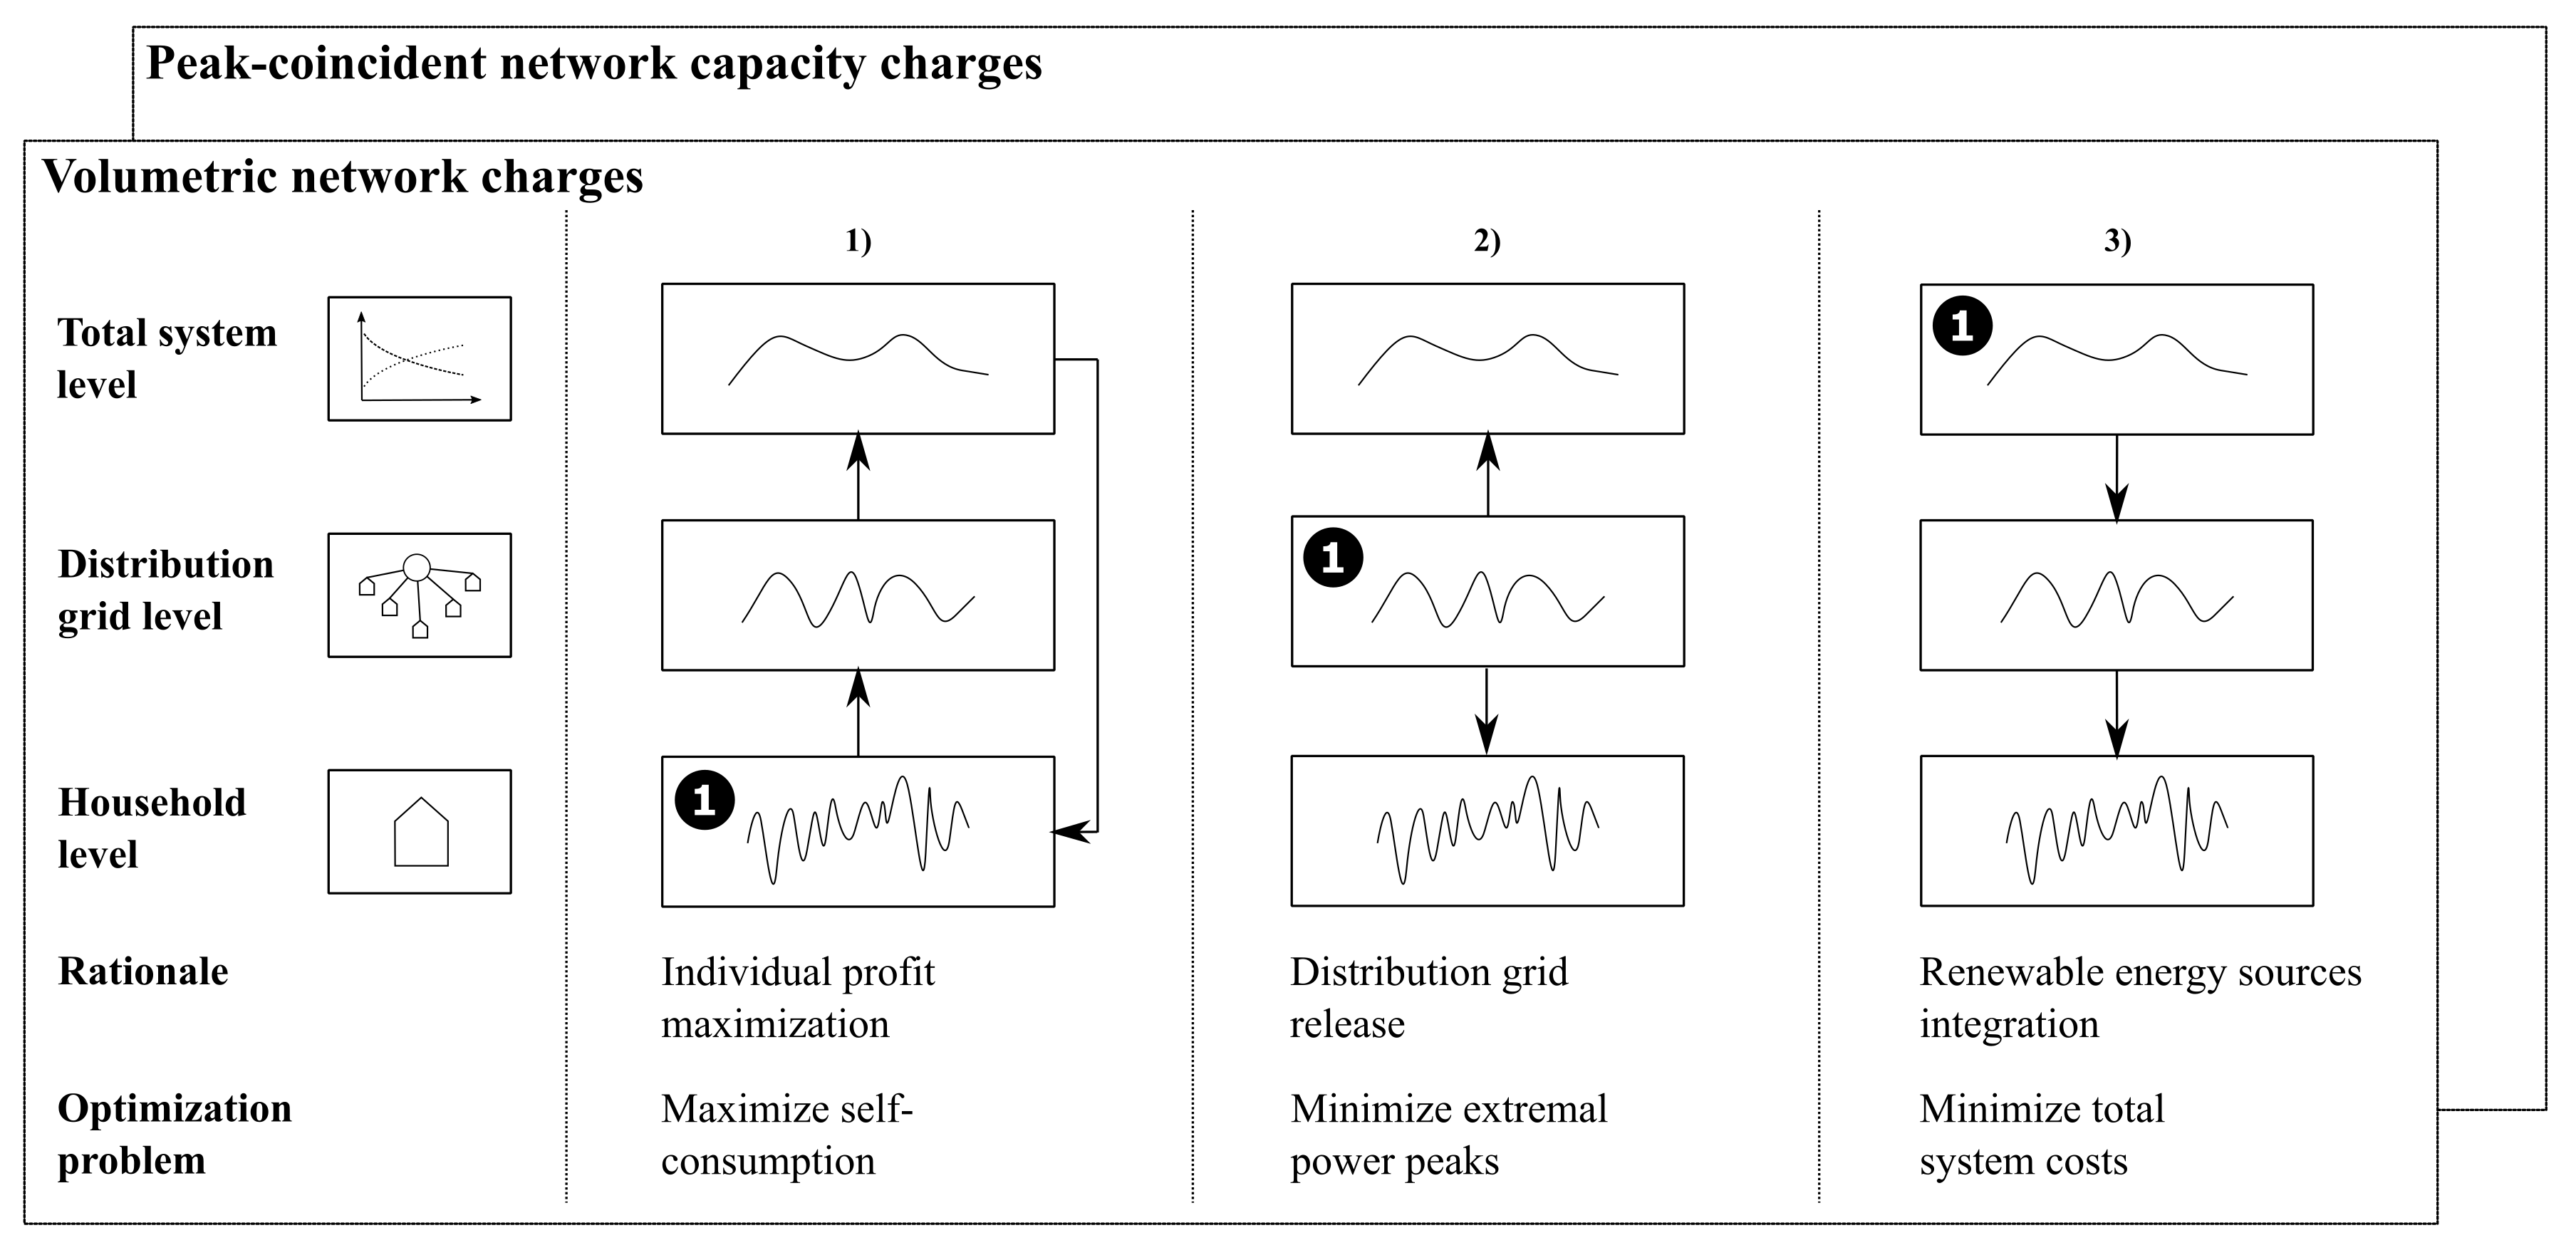
This study’s approach involves establishing a closed-loop analysis of prosumer battery operation and an analysis of the resulting full costs of electricity (FCOE) (The following materials and methods section is taken from [1] and slightly adapted and complemented). Additionally, the process includes an analysis of network capacity utilization and a study of the resulting total system costs. These are examined using a fundamental linear optimization model for the three flexibility operation modes (denoted by 1, 2, 3 and further defined in the following sections; see Figure 1). For the FCOE analysis, the study applies quarter-hour household profiles on the basis of real generated measured data. This is a key feature of this study and is in contrast to several other studies that apply synthetic, and already aggregated, household profiles for electric demand and PV production. The FCOE contain the levelized cost of energy (LCOE: annualized fixed and variable costs of energy) and regulatory network charges under the consideration of two different allocation schemes.
- Volumetric network charges
- Peak-coincident network capacity charges; as detailed by [18]
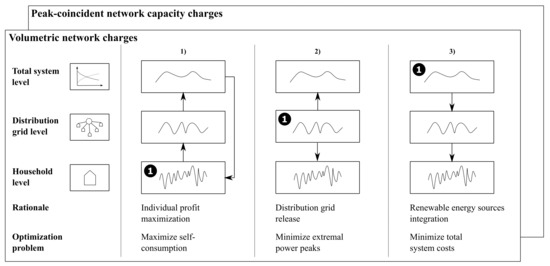
Figure 1.
Workflow of analysis; encircled “1” denotes the starting point of analysis, corresponding to the respective battery operation mode (1, 2, or 3).
Figure 1.
Workflow of analysis; encircled “1” denotes the starting point of analysis, corresponding to the respective battery operation mode (1, 2, or 3).
Both prosumer and consumer (residual) load profiles are aggregated at the distribution network level under consideration of simultaneity effects. The resulting aggregated residual load profiles per distribution network node are quantified to measure the distribution network (thermal) stress level that is induced through different prosumer behaviors (i.e., different battery operation modes).
Finally, the residual load profiles are further smoothed to generate aggregated wholesale market profiles. These residual load profiles enter a linear optimization model of the electricity market, which minimizes the total system costs. Each battery operation mode leads to a different residual load profile at the wholesale market level and thus to a different system optimum. In this analysis we focus on three prototypical battery operation modes, namely:
- Operation mode 1: Objective: Maximize prosumer SC. In this case, the battery is operated according to a static, predetermined prosumer heuristic, which ensures a maximum consumption of self-produced electricity;
- Operation mode 2: Objective: Release distribution grid. The battery is, again, operated in order to maximize prosumer SC. In this case, however, SC maximization is implemented as a linear optimization problem with a grid-releasing constraint in order to reduce peak-coincident network capacity utilization;
- Operation mode 3: Objective: Minimize system (wholesale market) costs. In this case, the battery is operated market-beneficially, i.e., the battery reacts fully flexibly to the real-time wholesale market price signal.
Instead of looking at individual prosumer households with direct market access, one could also consider the association of several households into energy cooperatives. This bundling of decentralized flexibilities would, in a sense, form an intermediate level between the individual households and the wholesale market. Even though such energy cooperatives would partially enable different battery operation modes than considered in this paper, the general distinction between individual optimization (either at the individual household or the cooperative level), grid orientation and wholesale market orientation remains valid.
2.1. Battery Operation Mode 1: Maximization of Prosumer Self-Consumption
2.1.1. Battery Operation
The rationale behind battery operation mode 1 is to maximize prosumer SC. Generally, there is a countable set of algorithms that can accomplish this objective. In this manuscript, an algorithm is used that is referred to as “chronological charging”; see [2]. This algorithm promotes the use of self-produced electricity whenever possible, either directly for momentary consumption or indirectly for charging the prosumer battery. A pseudocode is provided in Appendix A (Algorithm A1), with variable and parameter descriptions provided by Table 1. This algorithm can be interpreted as the canonical implementation of SC maximization. Regarding the data input, the electric load profile is provided by measured data of a single-family household in the German city Düsseldorf with a temporal resolution of 15 min; see [22,23]. The PV production profile is provided by a PV plant in the Stuttgart area with a temporal resolution of 15 min.

Table 1.
Summary of the used variables and parameters for the prosumer battery storage operation.
The outputs from this algorithm are time series for the prosumer grid supply, , and feed-in, , which can be consolidated in one time series, referred to as the prosumer residual load (throughout this paper, the notion of residual load refers to the residual load after battery operation, to be distinguished from ResLoad = prosumer load − prosumer PV production) and denoted by , as shown in Equation (1).
Next, one can evaluate the prosumer and consumer FCOE. The FCOE contain the annualized PV and battery investment costs (for prosumers), the (wholesale) market costs, and network charges, as depicted in Equation (2).
In this equation, represents the specific investment cost vector including PV and battery investment costs with parameters set as shown in [2], whereas contains the installed PV and battery capacities; see Table 1. represents the average (wholesale) market price (In general, follows as a dual variable of the load coverage restriction as model-endogenous output. In this study, we consider a (constant) mark-up of 120 EUR/MWh on top of the wholesale market price which is, in particular, high enough to enable prosumers to refinance their investments into PV entirely through the market price); and stand for the annual amounts of energy withdrawn from the grid (GS: annual grid supply; ) and fed into the grid (FI: annual feed-in; ), respectively. The market value factor accounts for the actual PV wholesale market value and is assumed to be 50% in this study. The last term in Equation (2), , represents the specific network costs (either per kWh in the volumetric case or per kW in the case of peak capacity charges); see Section 2.1.3. Elsewhere, is specified in the following chapter as either a function of the volume (volumetric network charges) withdrawn from the grid or as a function of the peak-coincident power withdrawn from or fed into the grid (peak capacity charges).
2.1.2. Network Utilization
Next, this study quantifies the resulting peak-coincident network capacity utilization—that is, the stress level induced at a distribution network node through the respective prosumer battery operation. In this analysis, this is performed using a stylized approach under certain assumptions and simplifications, namely:
- The assumption of a radial distribution network topology;
- The consideration of thermal stress on components only, neglecting other aspects, such as voltage unbalance or the like; see [24], for instance. That is—we only consider the network resistance R, neglecting its reactance X and phases, which seems to be justified by usually high ratios in distribution grids; see [14], for instance.
- The use of prototype (residual) load profiles. That is, rather than aggregating multiple real generated measured profiles, in this study we use one single load profile and one single PV profile as the starting point and account for simultaneity effects in a separate analysis step as described in the following paragraphs. This is a strong simplification—however, for our purposes, we are only interested in the relative change of the maxima of the aggregated residual load resulting from different battery operational modes. This purpose seems to be attainable by our approach.
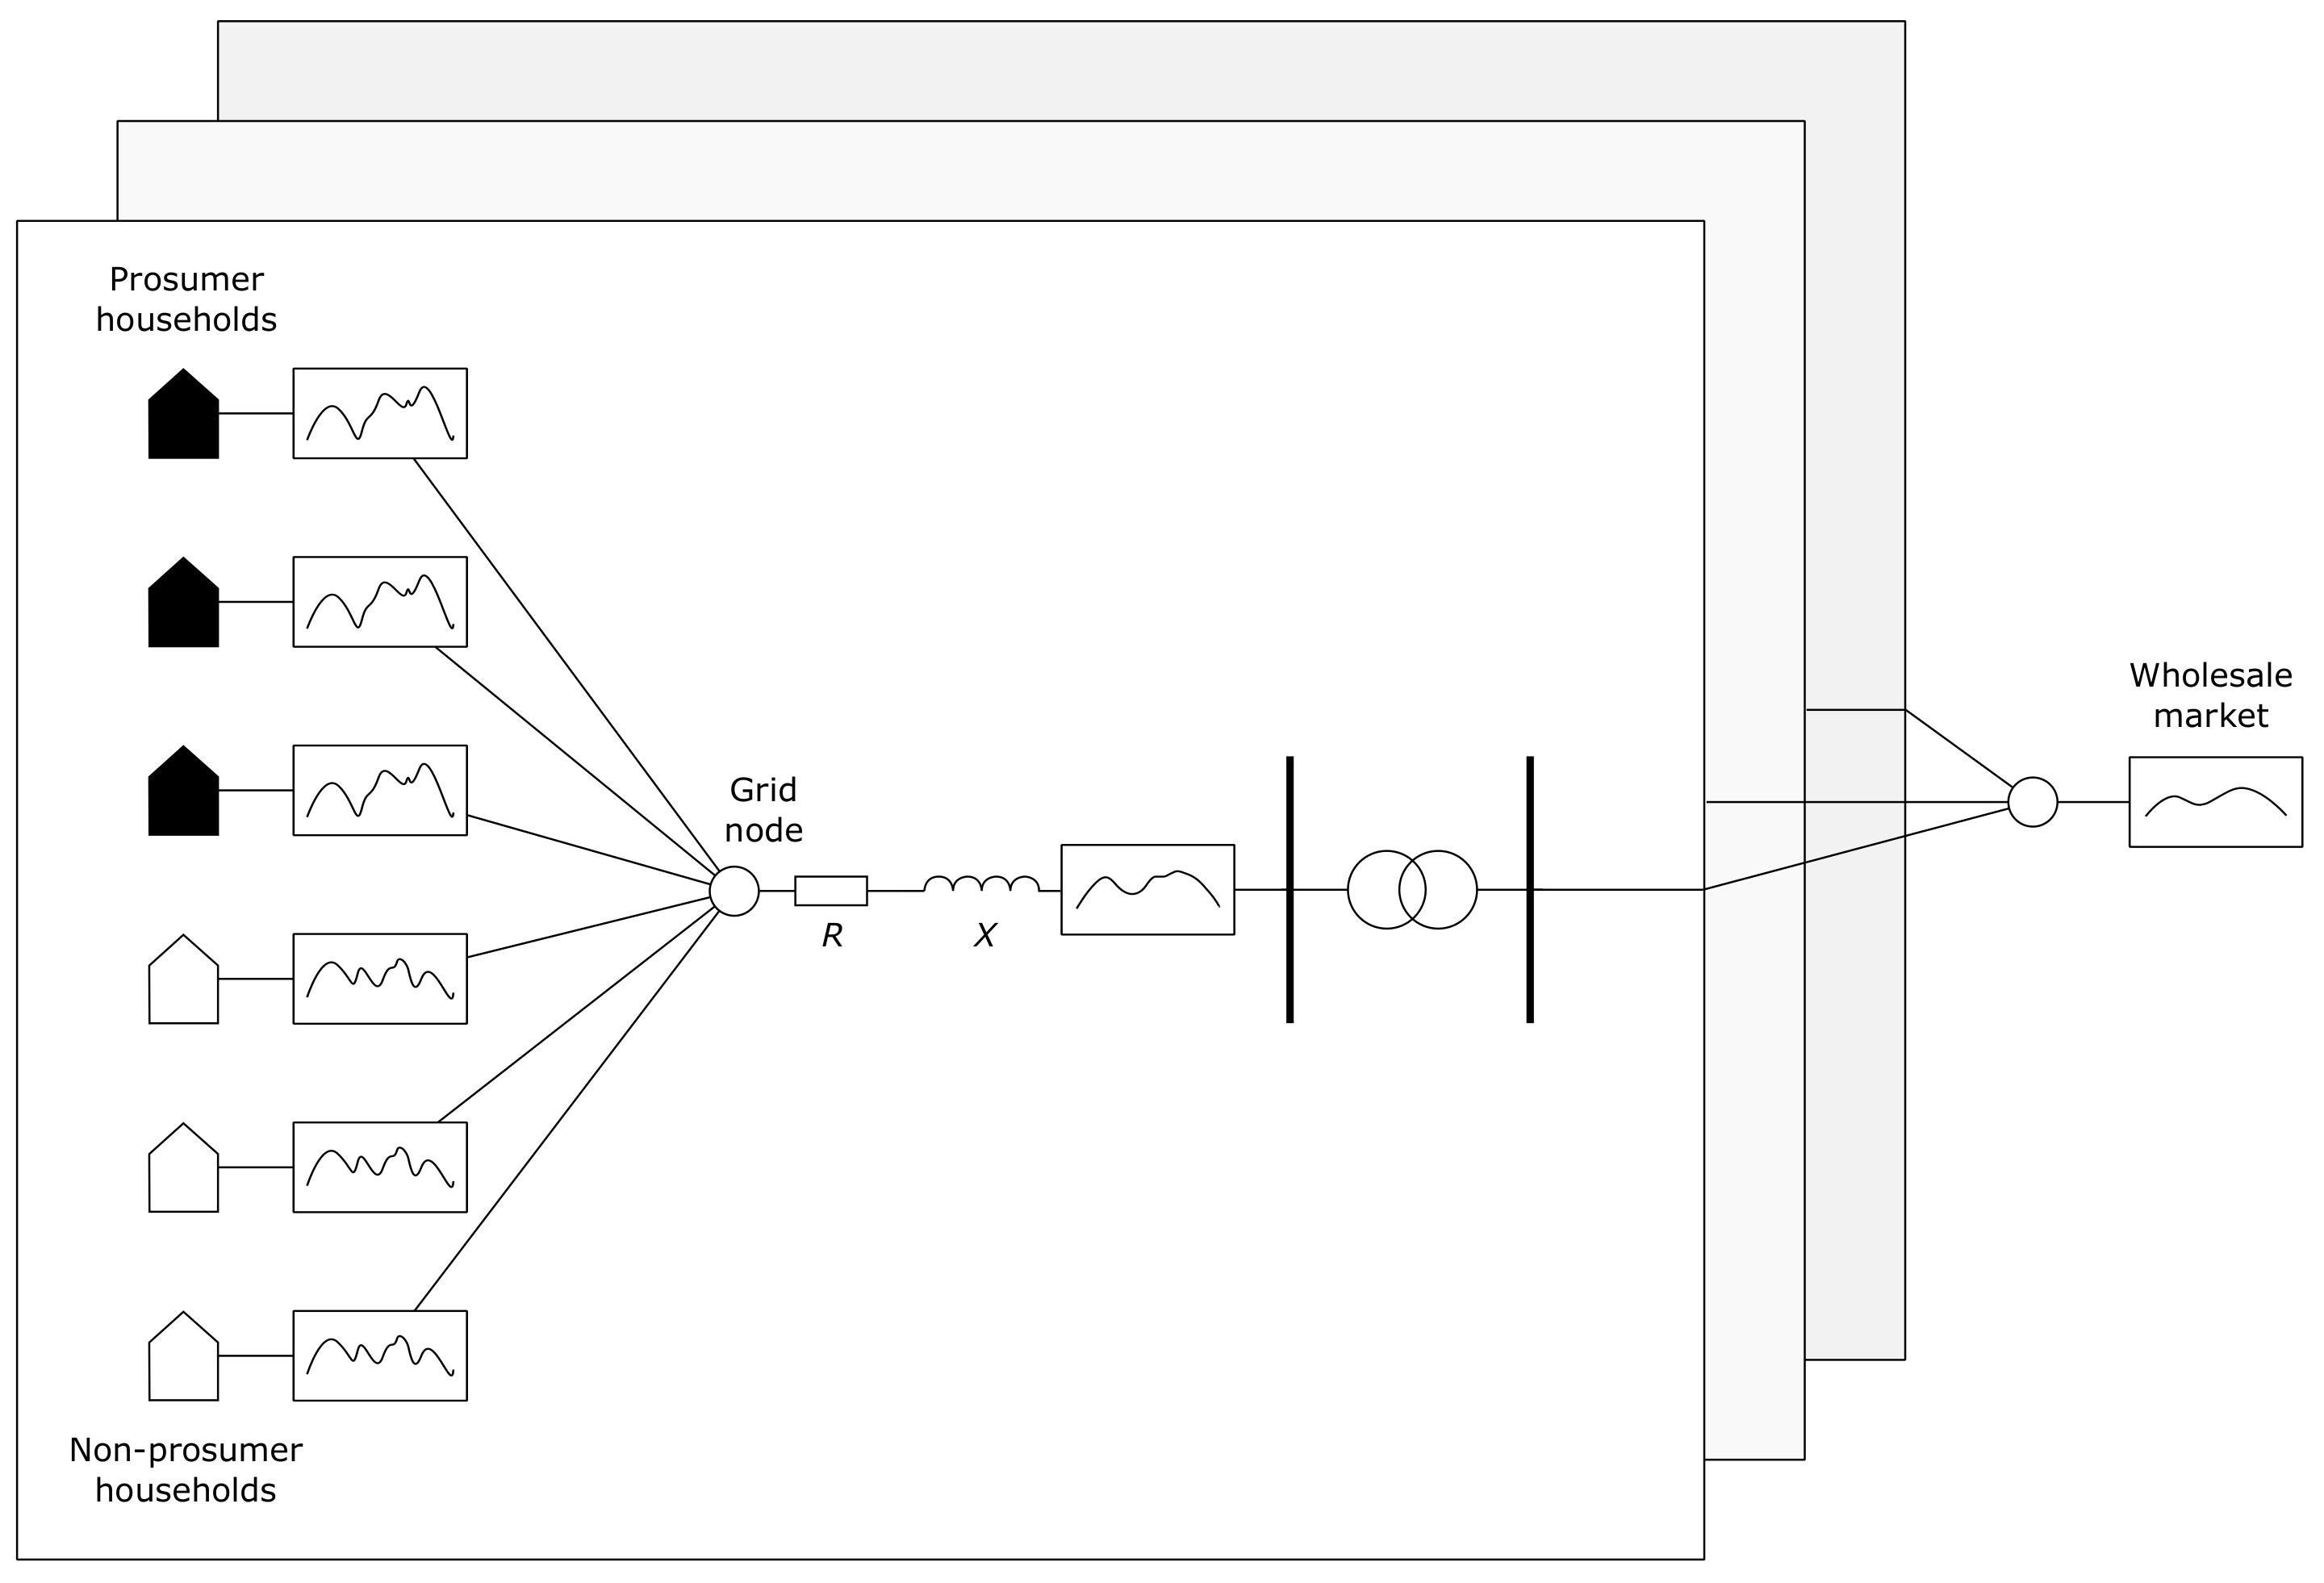
To be precise, this study assumes n households to be connected to a network node, of which a share of are assumed to be prosumers and a share of are assumed to be traditional consumers. To quantify the actual residual load on the network node, one must first smooth the sharp prosumer and consumer household (residual) load profiles (consumer residual load = consumer load), as described in the next paragraph, denoted by a bar in this paper, to account for simultaneity effects. Second, the smoothed prosumer and consumer profiles () are superposed according to their respective penetration ratios, resulting in the actual network node residual load ; see Equation (3) and Figure 2.
Profile smoothing is performed using Gaussian smoothing (also referred to as Gaussian blur in other fields, such as image processing). It begins from a given (sharp) initial residual load profile and generates further residual load profiles by shifting the initial profile values to the left and right (in the temporal dimension). For the aggregation, shift probabilities are weighted by a Gaussian normal distribution, as shown in Equation (4).
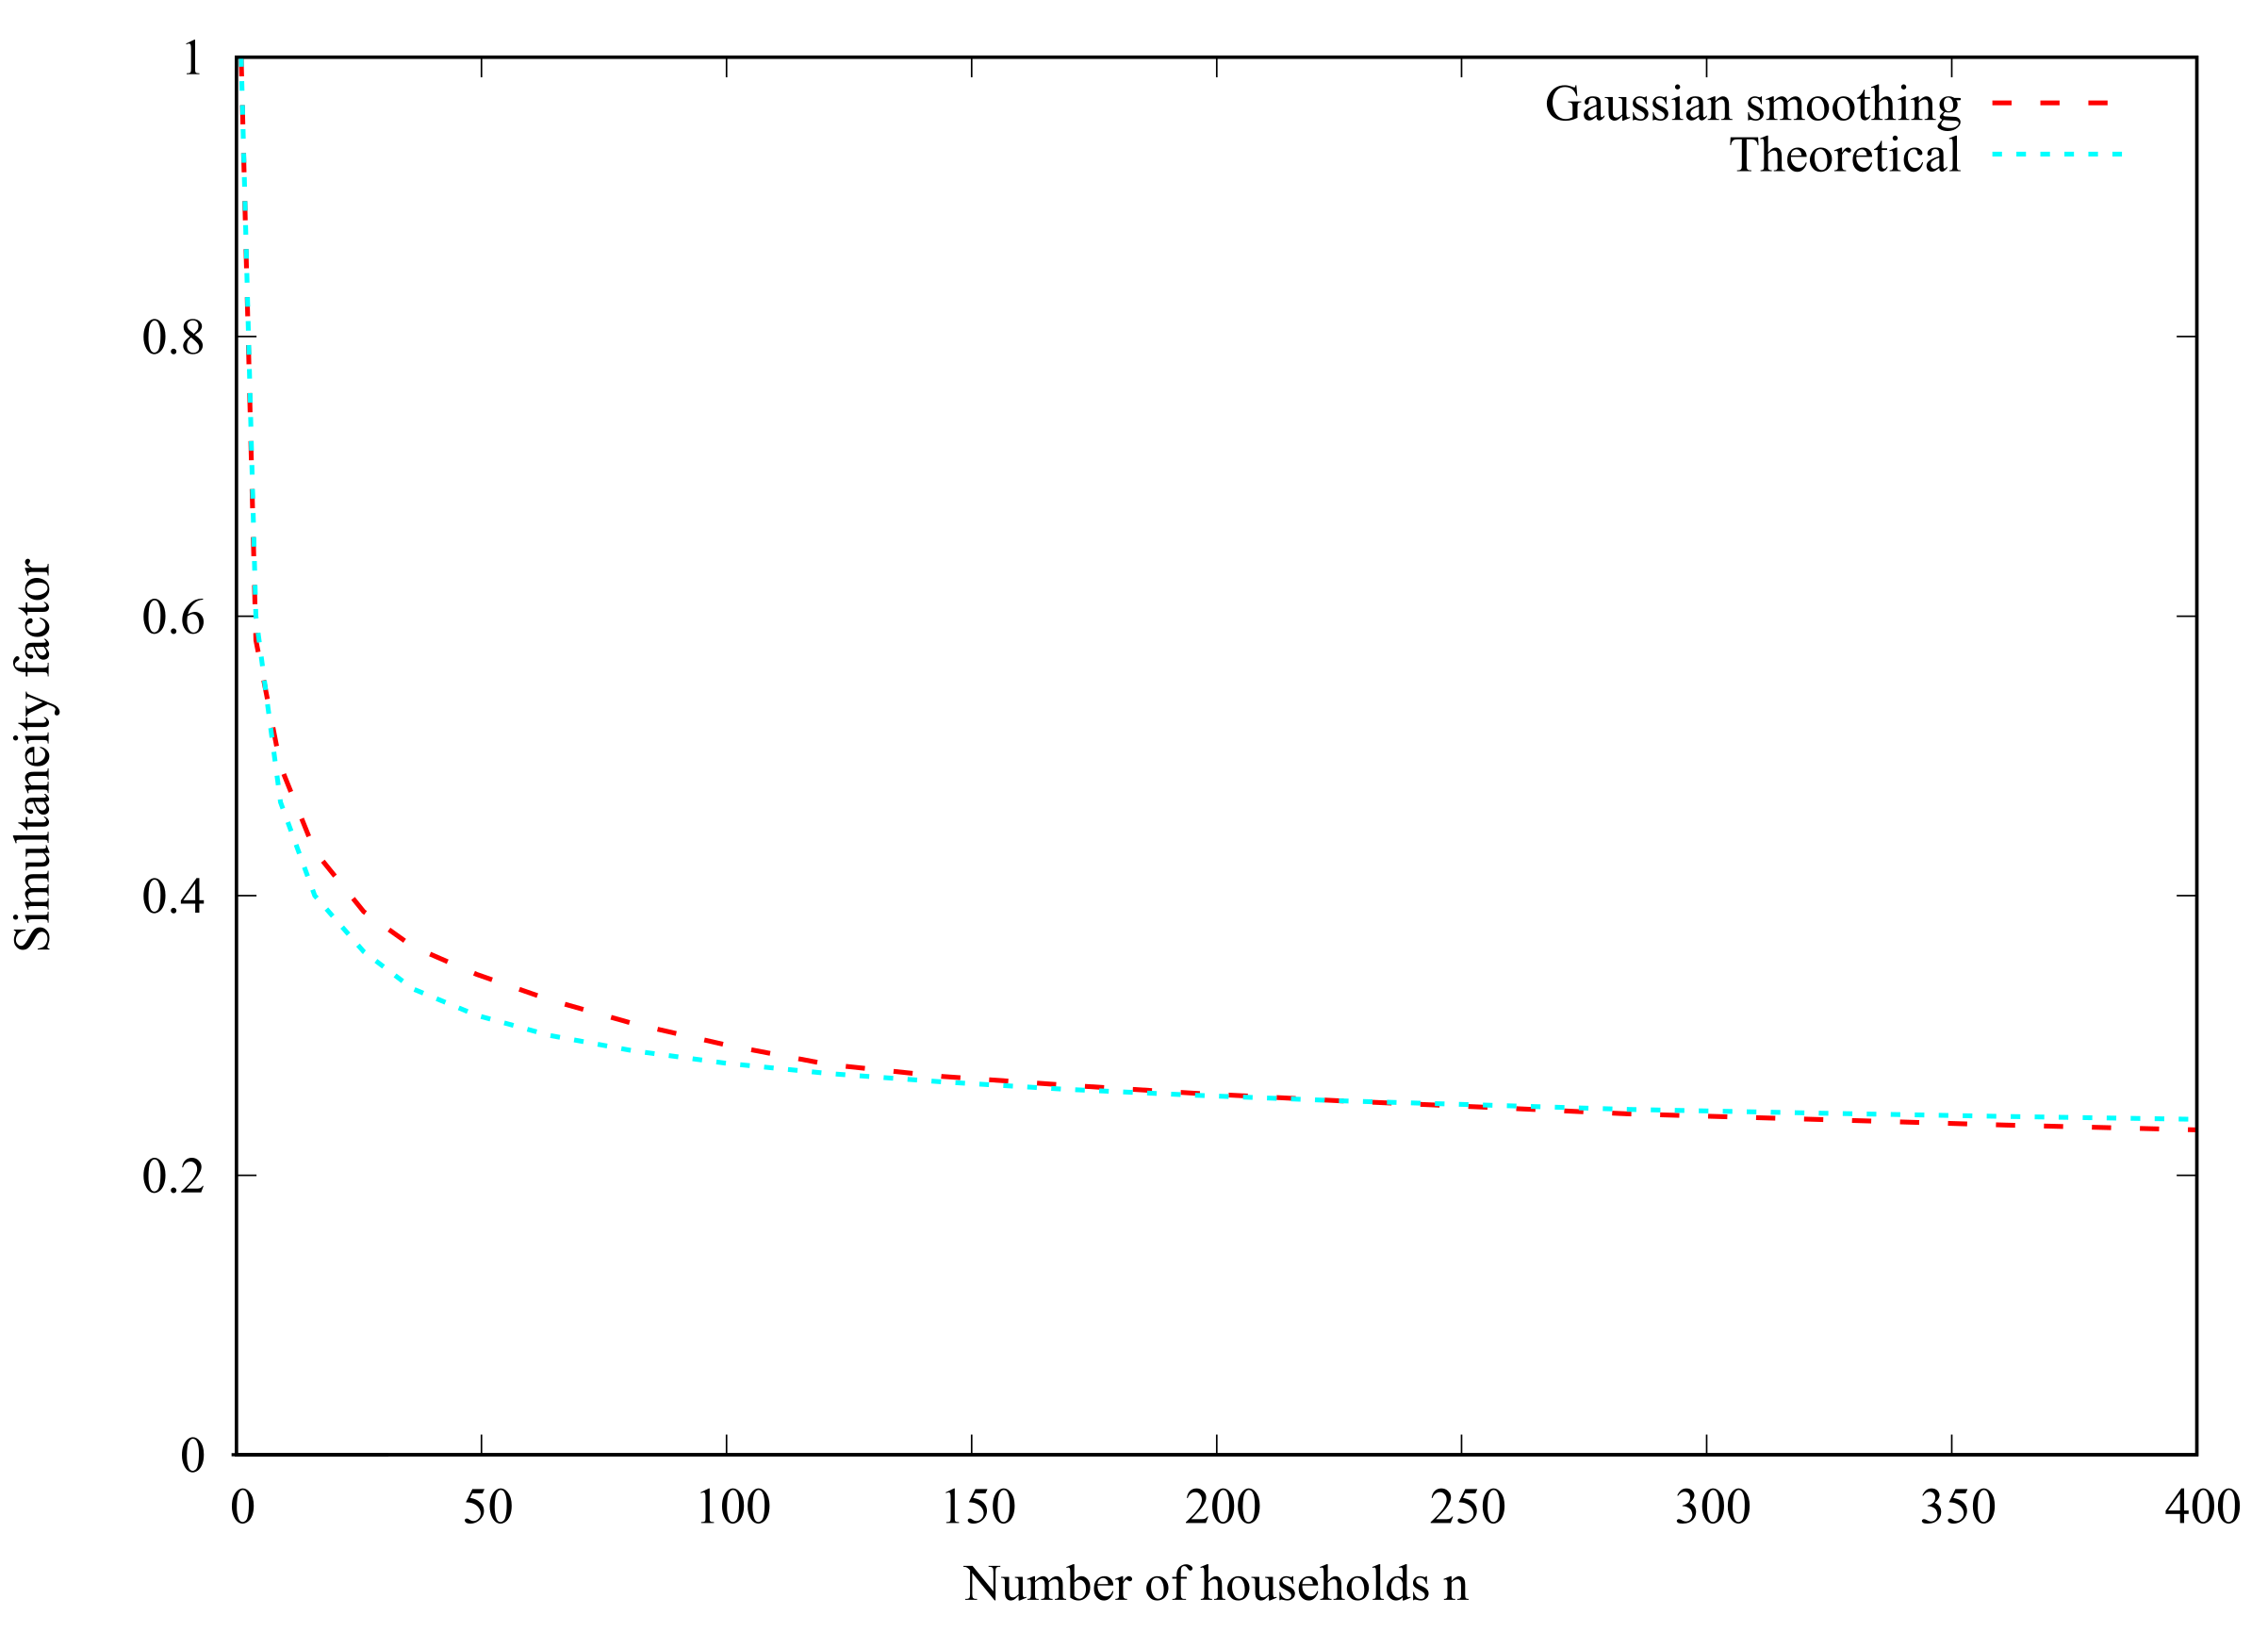
The maximum power peak of the aggregated residual load profile is usually lower than the sum of the maximum power peaks of the individual residual load profiles. The ratio of these two quantities is referred to as the simultaneity factor, g, which is a function of the number of profiles n that are aggregated, . In other words, the simultaneity factor quantifies by how much the aggregated profile is smoother than the non-aggregated profile. In the literature, there are numerous (partly contradictory) theoretical and empirical derivations of the functional dependency of . In the following, we refer to [25], according to which the n-dependency of the simultaneity factor is given by Equation (5).
Applying , Figure 3 demonstrates that the applied Gaussian smoothing is indeed in asymptotical accordance with the theoretical functional dependency; see Appendix A for further details. For the distribution network level, we use , formally corresponding to households per node.
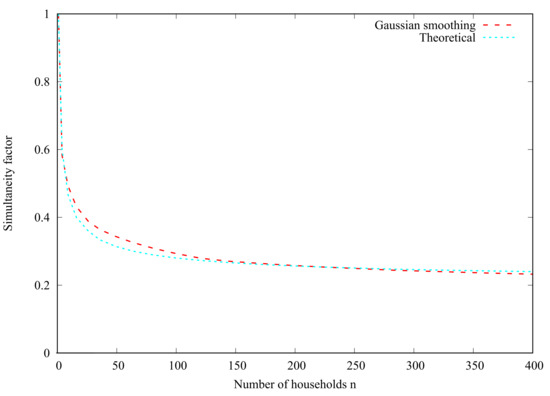
Figure 3.
Comparison of simultaneity factors resulting from Gaussian smoothing and theoretical values with .
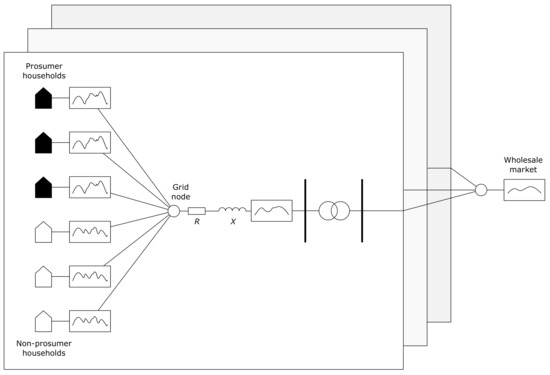
Figure 2.
Schematic sketch of distribution network analysis. Sharp single-household load and production profiles from prosuming and consuming households result in smoothed residual load profiles on the distribution network node, taking into account simultaneity effects. Electrical energy is then further transferred via transformers to the transmission grid. Total supply and demand within the wholesale market zone exhibit further profile-smoothing portfolio effects.
2.1.3. Network Charges
In this study, we evaluate the effect of two different network cost allocation schemes: volumetric (network consumption based) network charges (VNC) and peak-coincident network capacity utilization charges (CNC). For the construction of the VNC, we apply the same approach as detailed in [2]. This is, the absolute amount of annualized grid infrastructure and operation cost is allocated to the end customers per energy withdrawn from the grid; see Equation (6).
In this study, we have explicitly considered the effect of prosumer SC, which increases the specific volumetric network costs as a consequence of a reduced network cost allocation base. Technically speaking, the value for in Table 2 refers to a setting of 25% prosumer penetration ratio and market-compatible battery operation (operation mode 3). For other combinations of prosumer shares and battery operation modes, the specific network costs are adjusted such that the total network cost refinancing sum remains unchanged; see [2] for further details. For the technical realization of the CNC in this study we refer to [18], who suggest taking into consideration the top 30 highest (residual) load peaks. As suggested in their paper, the CNC are calculated ex-post on the basis of a historic network load time series; see Equation (7). This approach is reasonable in that such anticipated peak situations (rather than actual peaks) guide (long-term) network investments. The reason for using the top 30 (instead of the single) highest demand peaks is to reduce the randomness in the application of the allocation mechanism to a certain extent; see [18] for a detailed discussion.

Table 2.
Summary of used variables and parameters for network charge modelling.
Moreover, the peak capacity charges are complemented by an additional fixed charge per customer. This is due to the fact that a network cost refinancing which is purely based on peak-coincident capacity charges could necessitate excessively high network charges. Fixed network charges per customer are thus added to compensate for the residuum between total network costs and refinancing carried out through capacity charges. Variable description and parameter setting is provided in Table 2.
2.1.4. System Modelling
This study determines the total system (wholesale market) costs by using a fundamental linear optimization model of the European electricity market, the European Electricity Market Model, E2M2; see [26] for a detailed overview. E2M2 is a combined (mid-/long-term) investment and unit commitment model. The dual variable of the demand coverage restriction can be interpreted as the wholesale market price. The model has hourly temporal resolution, which is appropriate when system costs are solely of interest, as is the case with this study; see [27]. In [2], there is a detailed description of the model structure and parameter settings which are used in this paper, including the cost vector and the decision variable vector x. The residual load as an aggregation of all prosumer and consumer households enters the system model, as an (from a system perspective) exogenous time series; see Equation (8).
For the profile aggregation at system level, indicated by the double bars in the equation above, the study applies the same methodology, Gaussian smoothing, as detailed in Section 2.1.2. This paper uses for smoothing at the wholesale market level. By leaving all system parameters unchanged, the total system cost function is reduced to an implicit function of the aggregated prosumer and consumer load ; see Equation (9).
Subsequently, the annualized total system costs are minimized, as shown in Equation (10).
The system model realistically depicts several constraints as characteristic features of the electricity market. The most important of these are load coverage, system adequacy, and the depiction of RES investment paths. A detailed discussion of these features is shown in [2].
- Load coverage: This is the fundamental model restriction, guaranteeing that total demand is covered by production for every model hour. Hereby, demand can be covered either directly through power plant production (including variable RES), or indirectly, via discharging of storages (including distributed battery storages). Moreover, electricity transmission between regions is a third contribution to fulfill this restriction;
- System adequacy: This restriction guarantees the security of supply within every model hour in that the total capacity of dispatchable power plants, weighted by their respective operational reliabilities , matches the maximum electric load in the model year. The operational reliabilities for variable RES are assumed to be zero in this paper;
- Investment paths: RES investment paths are provided as model-exogenous input. The rationale behind this restriction is that in this study we are not primarily interested in a global optimization of the energy system including RES investment capacities, but rather analyze different operational modes of distributed flexibilities (batteries) under a given power plant structure.
The number of households (N = 40 million) and the annual electricity demand (500 TWh) are loosely informed by the German market size. The power plant structure is dominated by RES: 180 GW PV, 60 GW wind offshore, and 100 GW wind onshore, loosely based on the 2050 values of a 95% decarbonization scenario; see [2] for further details.
2.2. Operation Mode 2
The principal analysis steps for operation mode 2 are the same as presented above for operation mode 1. However, this time the actual battery operation mode is adjusted to reduce the peak-coincident network utilization. At this point, the battery operation is formulated as a linear optimization problem, with the prosumer SC as an objective function being maximized, as shown in Equation (11).
For the model, the technical characteristics of the battery are represented as linear restrictions, congruent to the formulation in Appendix A with variable definition and parameter setting provided by Table 1 and Table 3; see Algorithm 1.
| Algorithm 1. Battery operation mode 2. |
|

Table 3.
Summary of the used variables and parameters for prosumer battery storage operation (battery operation mode 2).
At this point, one determines the lowest value possible for an upper boundary b that restricts the residual load at the distribution network node while still leaving the optimization problem solvable. This upper bound can be found using interval nesting. In turn, the corresponding resulting prosumer residual load serves as input for the subsequent analyses of network utilization and system costs, as described in detail for operation mode 1. By construction, battery operation mode 2 maximizes the prosumer SC while reducing the peak-coincident network capacity utilization as much as possible. One could thus argue that this operation mode represents an improvement to the prosumer heuristic of operation mode 1, which accounts for a prosumer response to a regulatory framework which is based on peak-coincident network capacity charges.
2.3. Operation Mode 3
Next, operation mode 3 differs from the other operation modes in that this time, the prosumer battery serves as a full flexibility option in the wholesale market, reacting to the real-time wholesale market price signal. For operation modes 1 and 2 we determine the aggregated residual load of the prosumer and consumer households as system model-exogenous time series. For operation mode 3, instead, we begin the analysis with the minimization of total system costs, leaving the battery operation as a degree of freedom for the system. This way, the battery operation and the corresponding prosumer residual load are model endogenous results of the system optimization. Next, the distribution network capacity utilization is determined in a similar way to that described in Section 2.1.2. Moving from the wholesale market level to the distribution network level, we need to convert the residual load profiles of prosumers and consumers into sharper versions. This is virtually the reverse operation to the Gaussian smoothing, for which Equation (5) is applied. After this analysis step, we can evaluate the peak-coincident network capacity utilization as well as prosumer and consumer FCOE.
2.4. Consideration of Widespread e-Mobility
To understand the effects of widespread e-mobility, we perform the analyses as described in Section 2.1, Section 2.2 and Section 2.3; however, these analyses are performed under the consideration of additional electric load originating from widespread e-mobility. To do so, the original electric load time series is added by an electric charging time series, as provided in [28]. As e-mobility constitutes both a source of electricity demand and flexibility, a smart charging control is assumed. In other words, the applied charging time series itself is an optimization result under consideration of price incentives and greenhouse gas (GHG) emission targets. The additional annual electricity demand for e-mobility is assumed to be 2000 kWh per household. The maximum momentary charging capacity (quarter hour average) is assumed to be 3.7 kW per household. The parametric assumptions are based on [28]. The assumed maximum charging capacity is based on a typical wallbox for home use; however, higher charging capacities could well become standard in the future. We would like to point out that we do not intend to make a forecast for future e-mobility charging needs, but would rather like to show the general effects resulting from increasing sector integration. Note also that the additional electric load could be representative of all kinds of additional electricity demand resulting from increasing sector integration, i.e., electrification of heat and mobility sectors.
3. Results
3.1. Global Perspective: System Effects
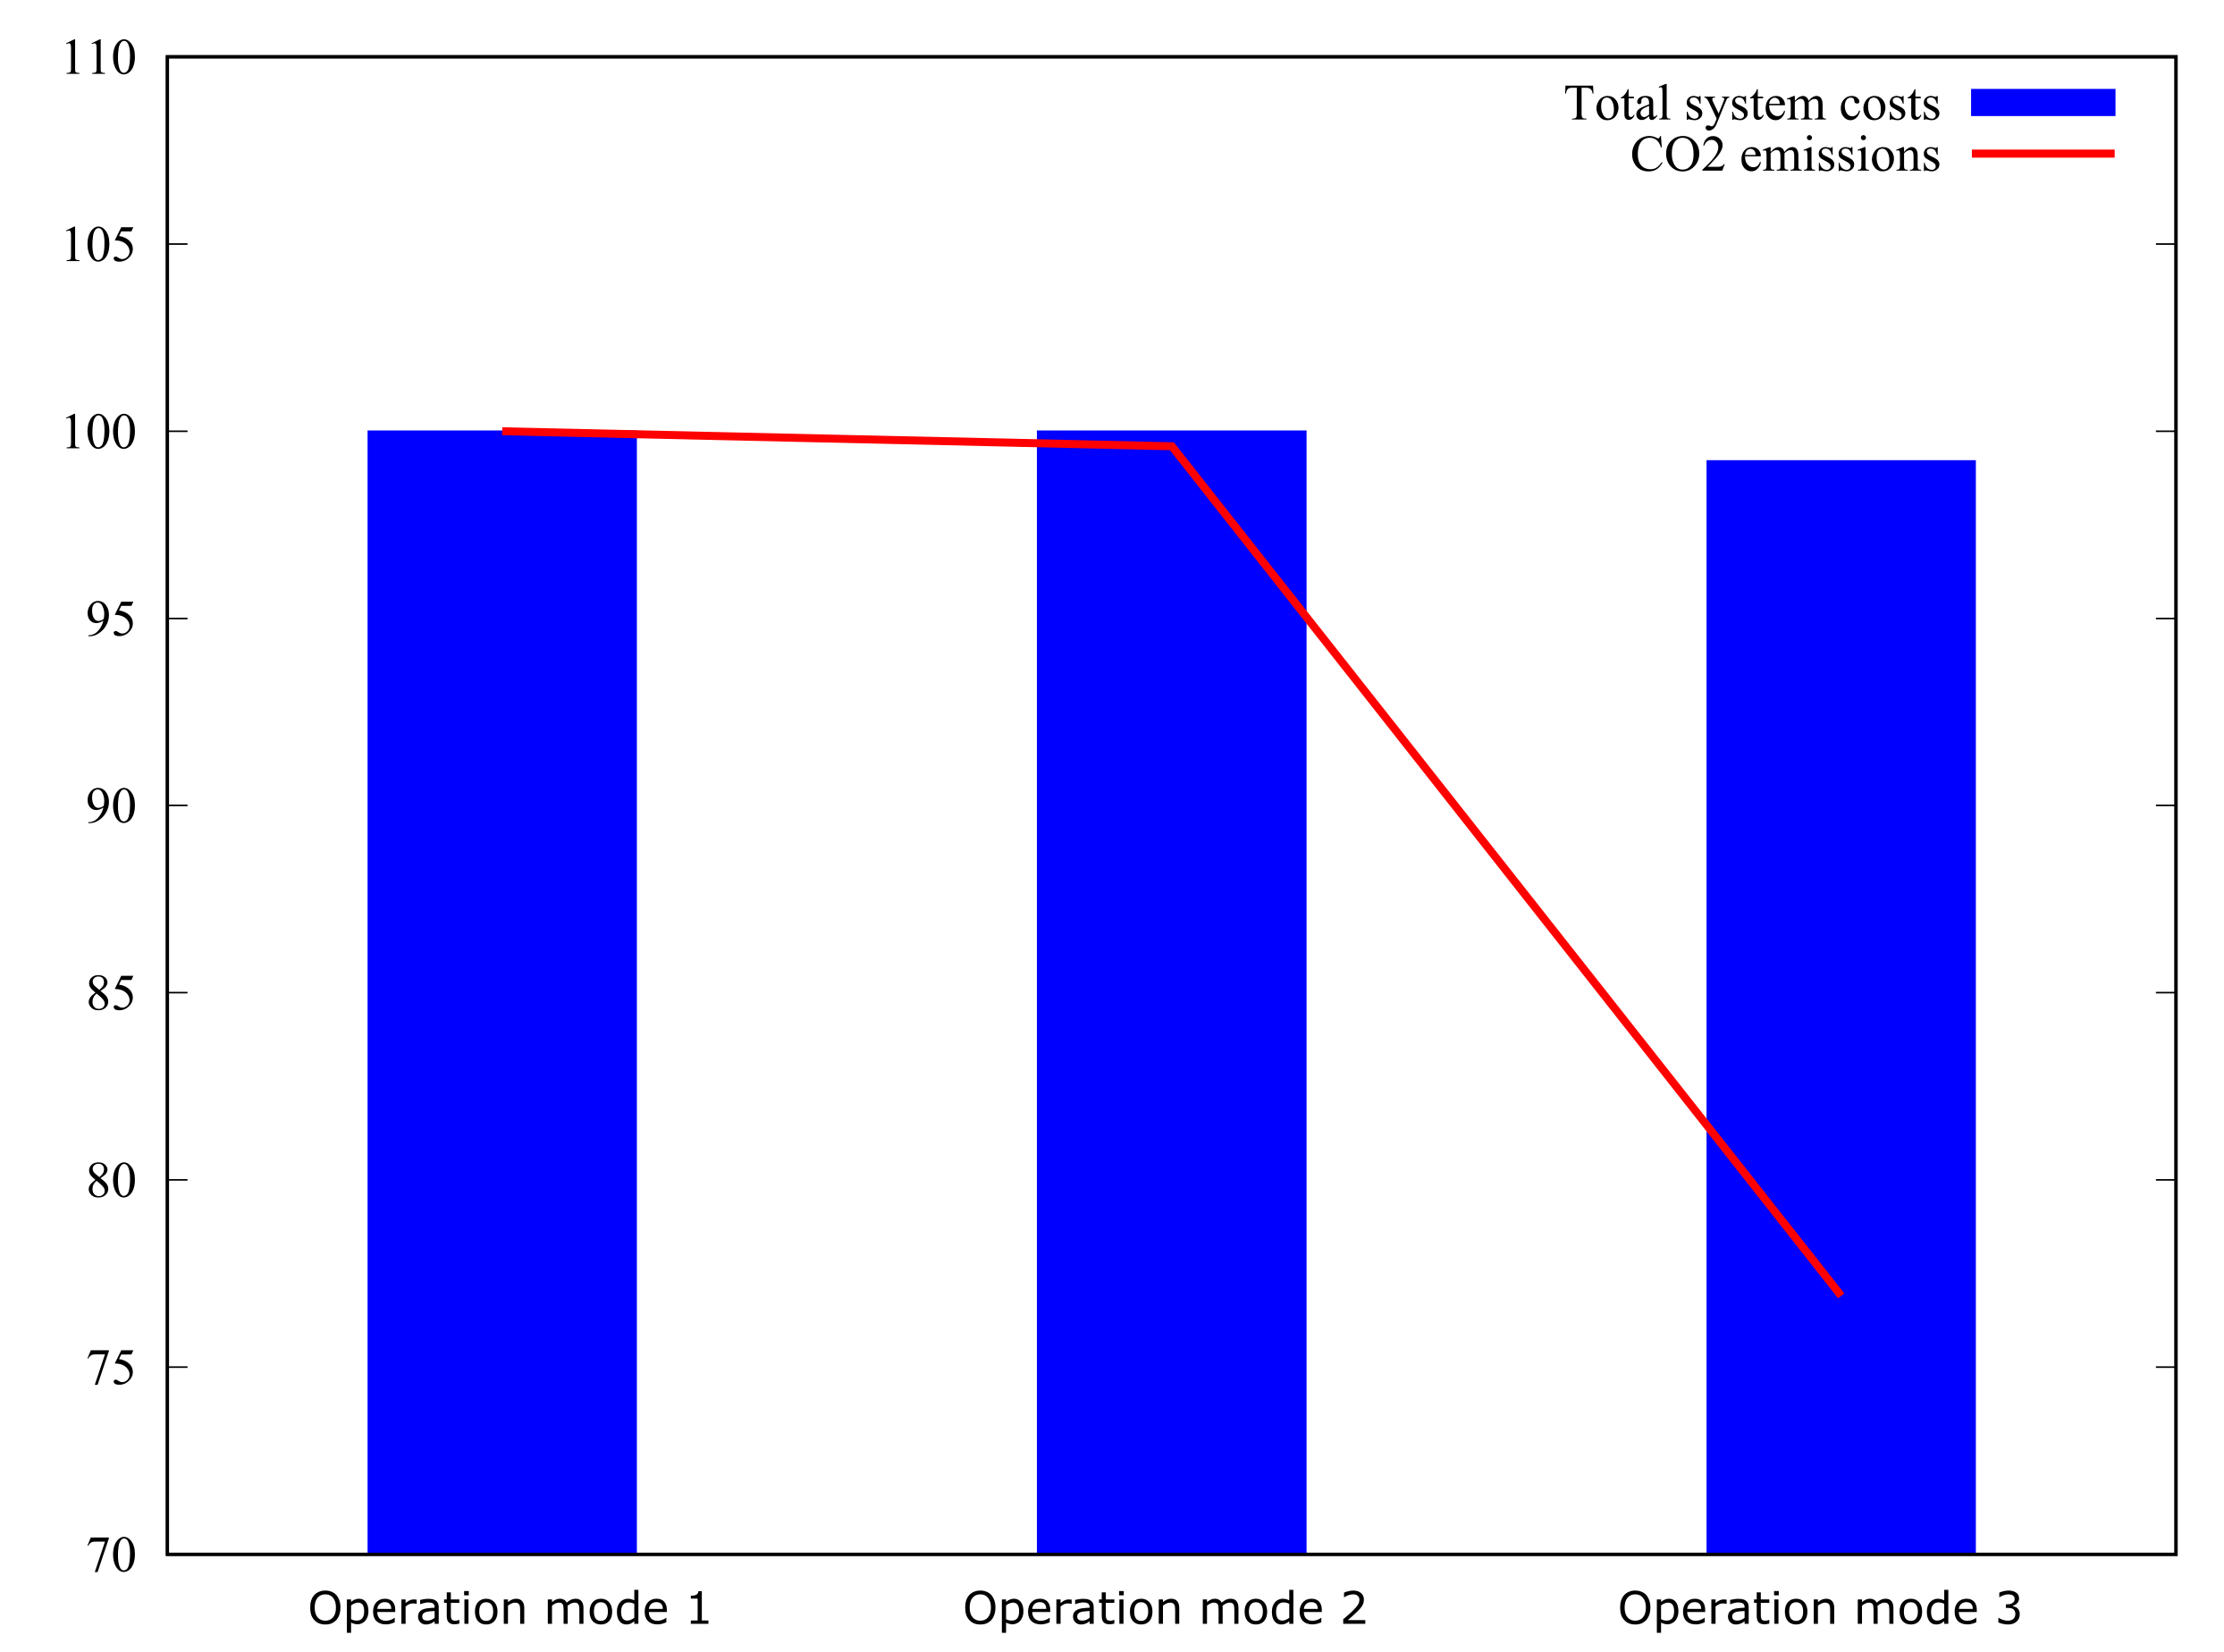
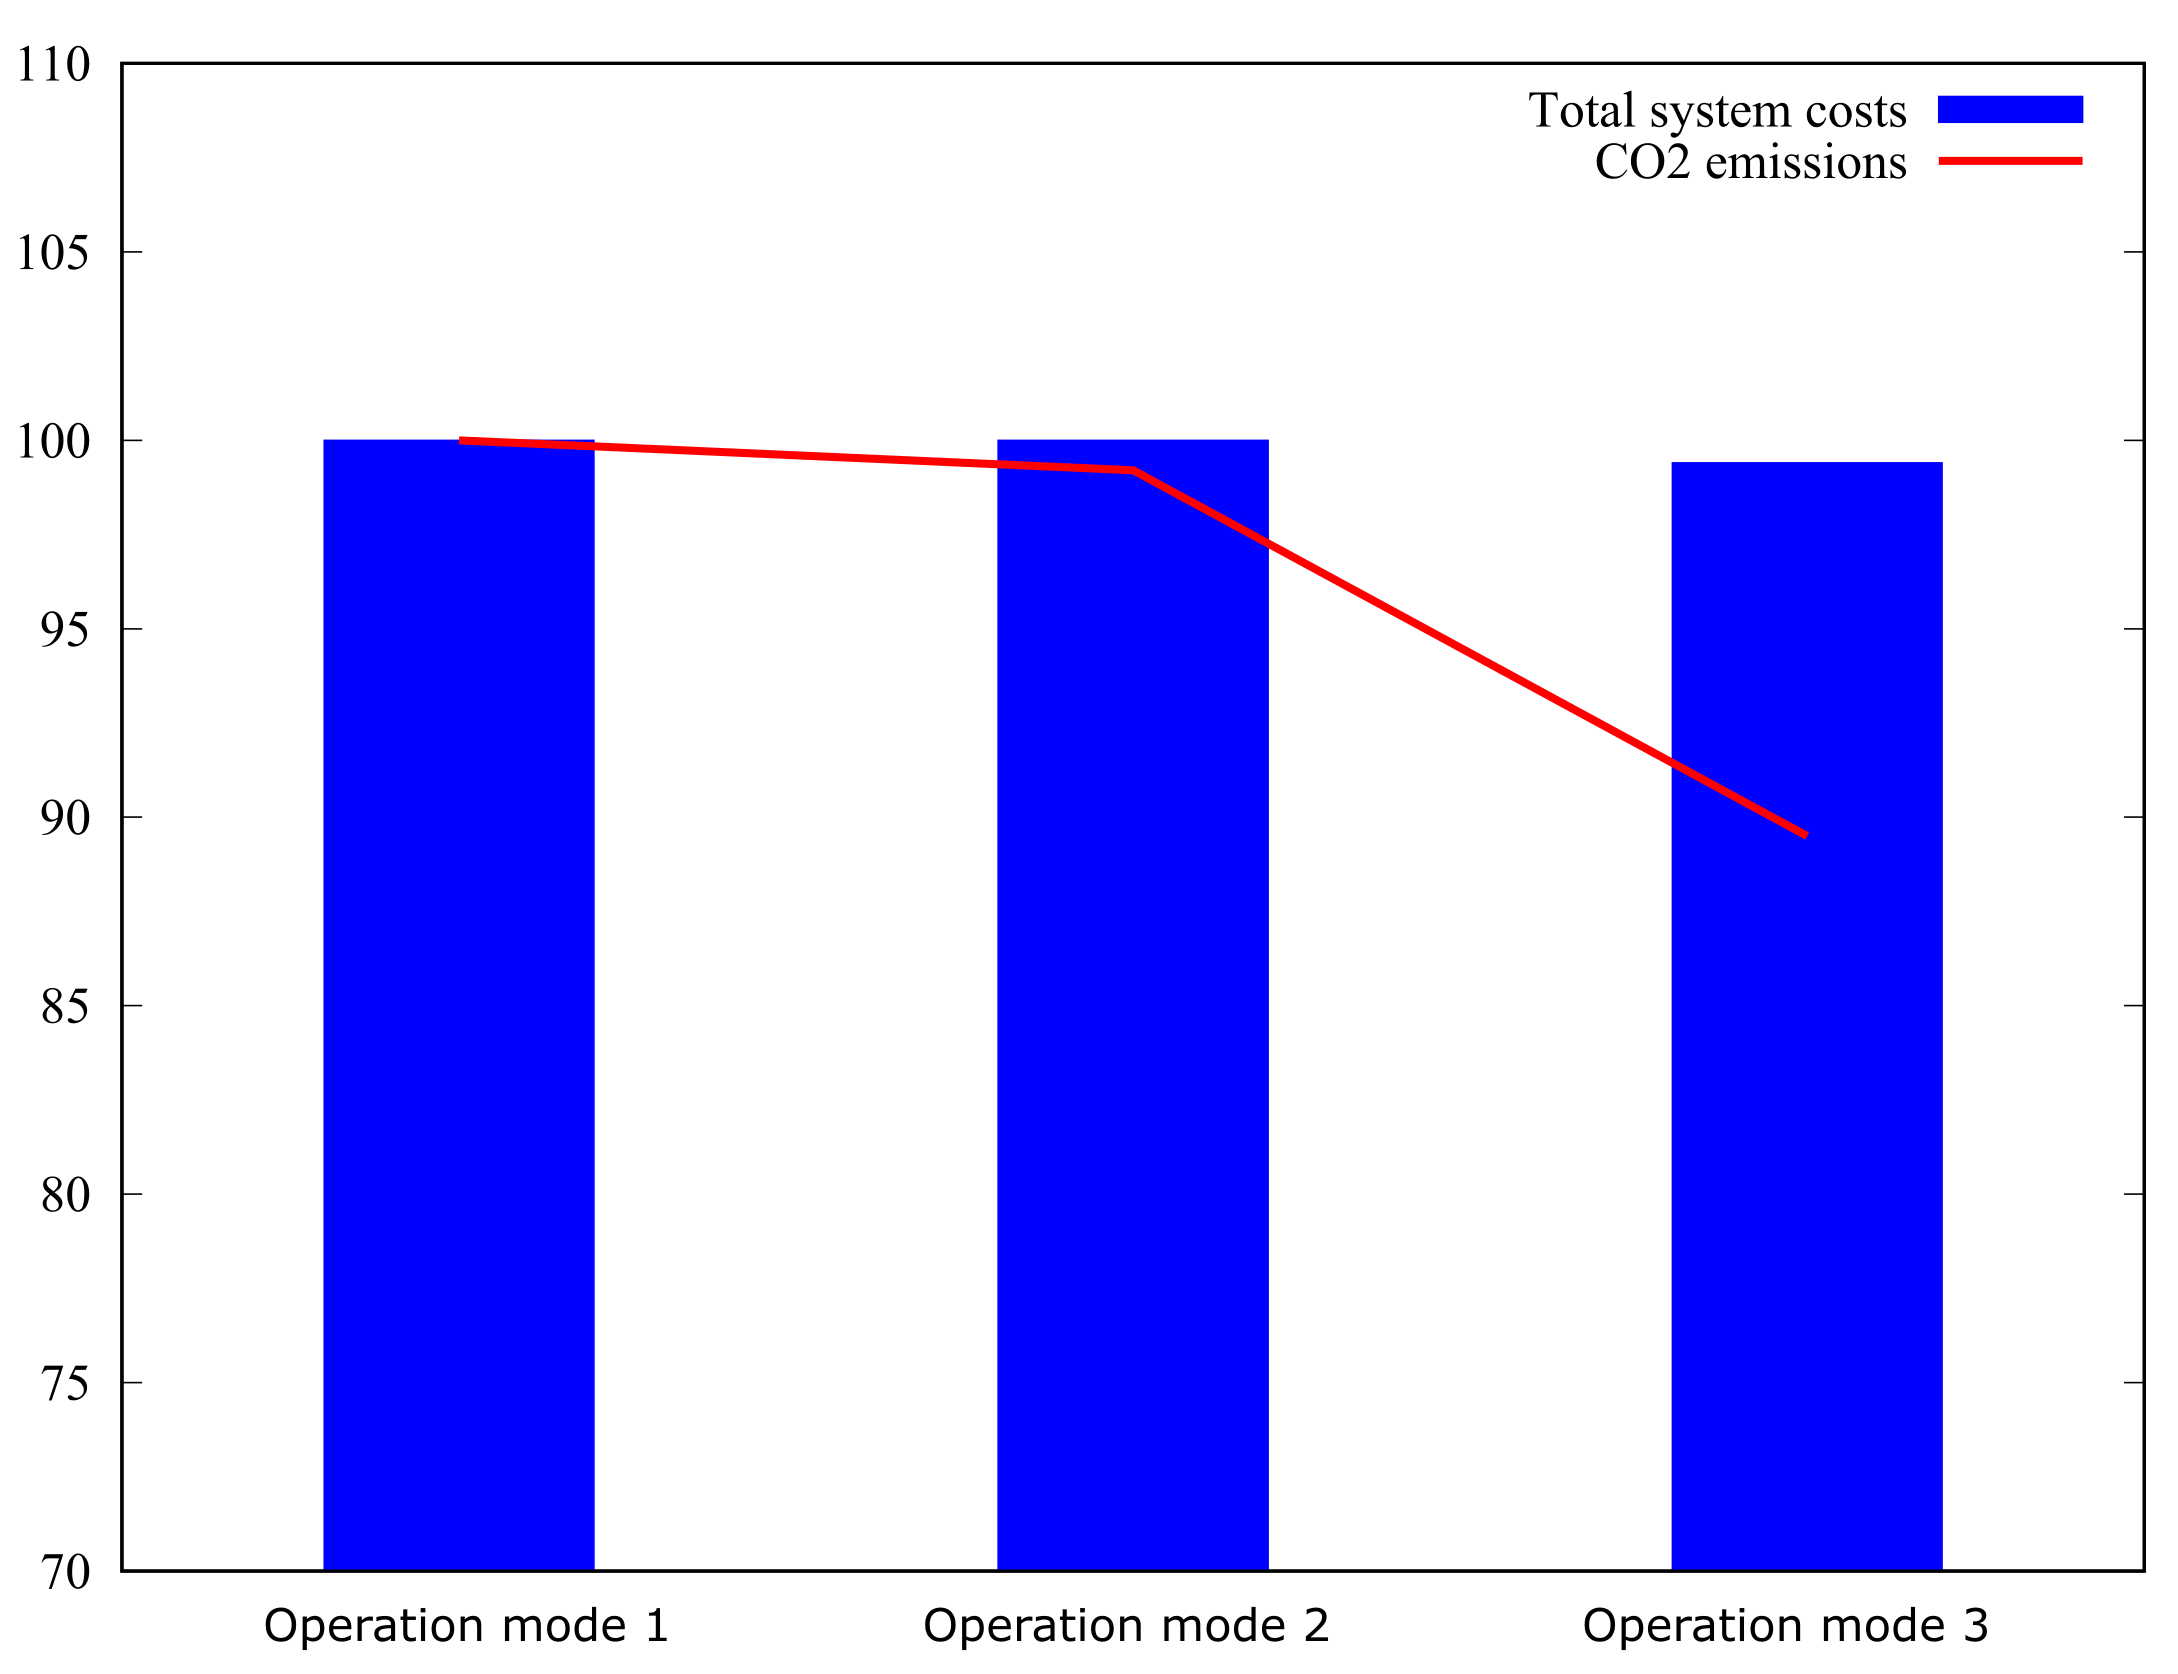
As illustrated by Figure 4, the total system costs are highest for operation mode 1 (chronological charging of battery) and lowest for operation mode 3 (market-beneficial battery operation) (The following results section is partly taken from [1] and significantly complemented by additional results, including a variation analysis of the prosumer penetration ratio and consideration of widespread e-mobility). The relative system cost delta is 0.8%, corresponding to ca. 400 MN EUR p.a. with a system cost base of roughly 50 BN EUR p.a. The specific values refer to a setting of 50% prosumer penetration ratio; the general tendencies, however, remain unaltered for all other prosumer penetration ratios. The system cost effect is based on the fact that a flexible battery operation (as in operation mode 3) enables an overall better RES integration than in the case of a predetermined battery operation, as in operation mode 1. This fact leads to overall lower fuel and CO2 costs in the system. For a more detailed discussion, one may read [2].
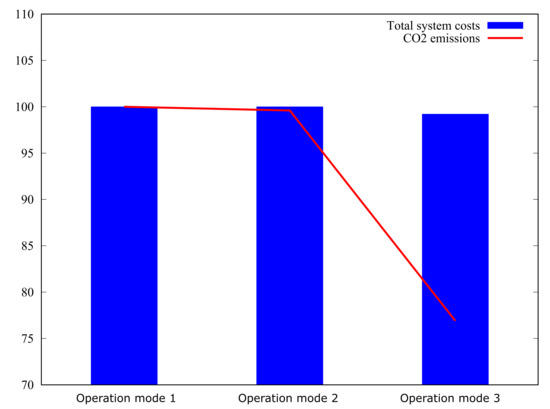
Figure 4.
Annualized total system costs and CO2 emissions, normalized in % of respective values for battery operation mode 1, by battery operation mode, for 50% prosumer penetration ratio.
Interestingly, battery operation mode 2 leads to nearly the same total system cost optimum compared to battery operation mode 1 for all three analyzed prosumer penetration ratios (25%, 50%, 75%). This indicates that the rationale behind battery operation mode 2 to release stress on the distribution grid is not per se congruent to a market-beneficial battery operation. Additionally, the different battery operation modes show even stronger differences in their CO2 emissions. The underlying cause is the same as that of the total system cost decrease: better overall RES integration, especially for operation mode 3, leading to a reduction of the unit commitment of dispatchable, CO2-intensive power plants (gas turbines). In case that the overall GHG emissions are limited by a fixed Emissions Trading System (ETS) cap, there would not be an overall CO2 emissions difference between the three battery operation modes. Instead, battery operation mode 3 could achieve the same CO2 targets with less overall RES capacity installed compared to operation modes 1 and 2. A summary of the results at the system level including all three considered prosumer penetration ratios is provided by Table 4.

Table 4.
Summary of system effects.
3.2. Local Perspective: Network Capacity Utilization
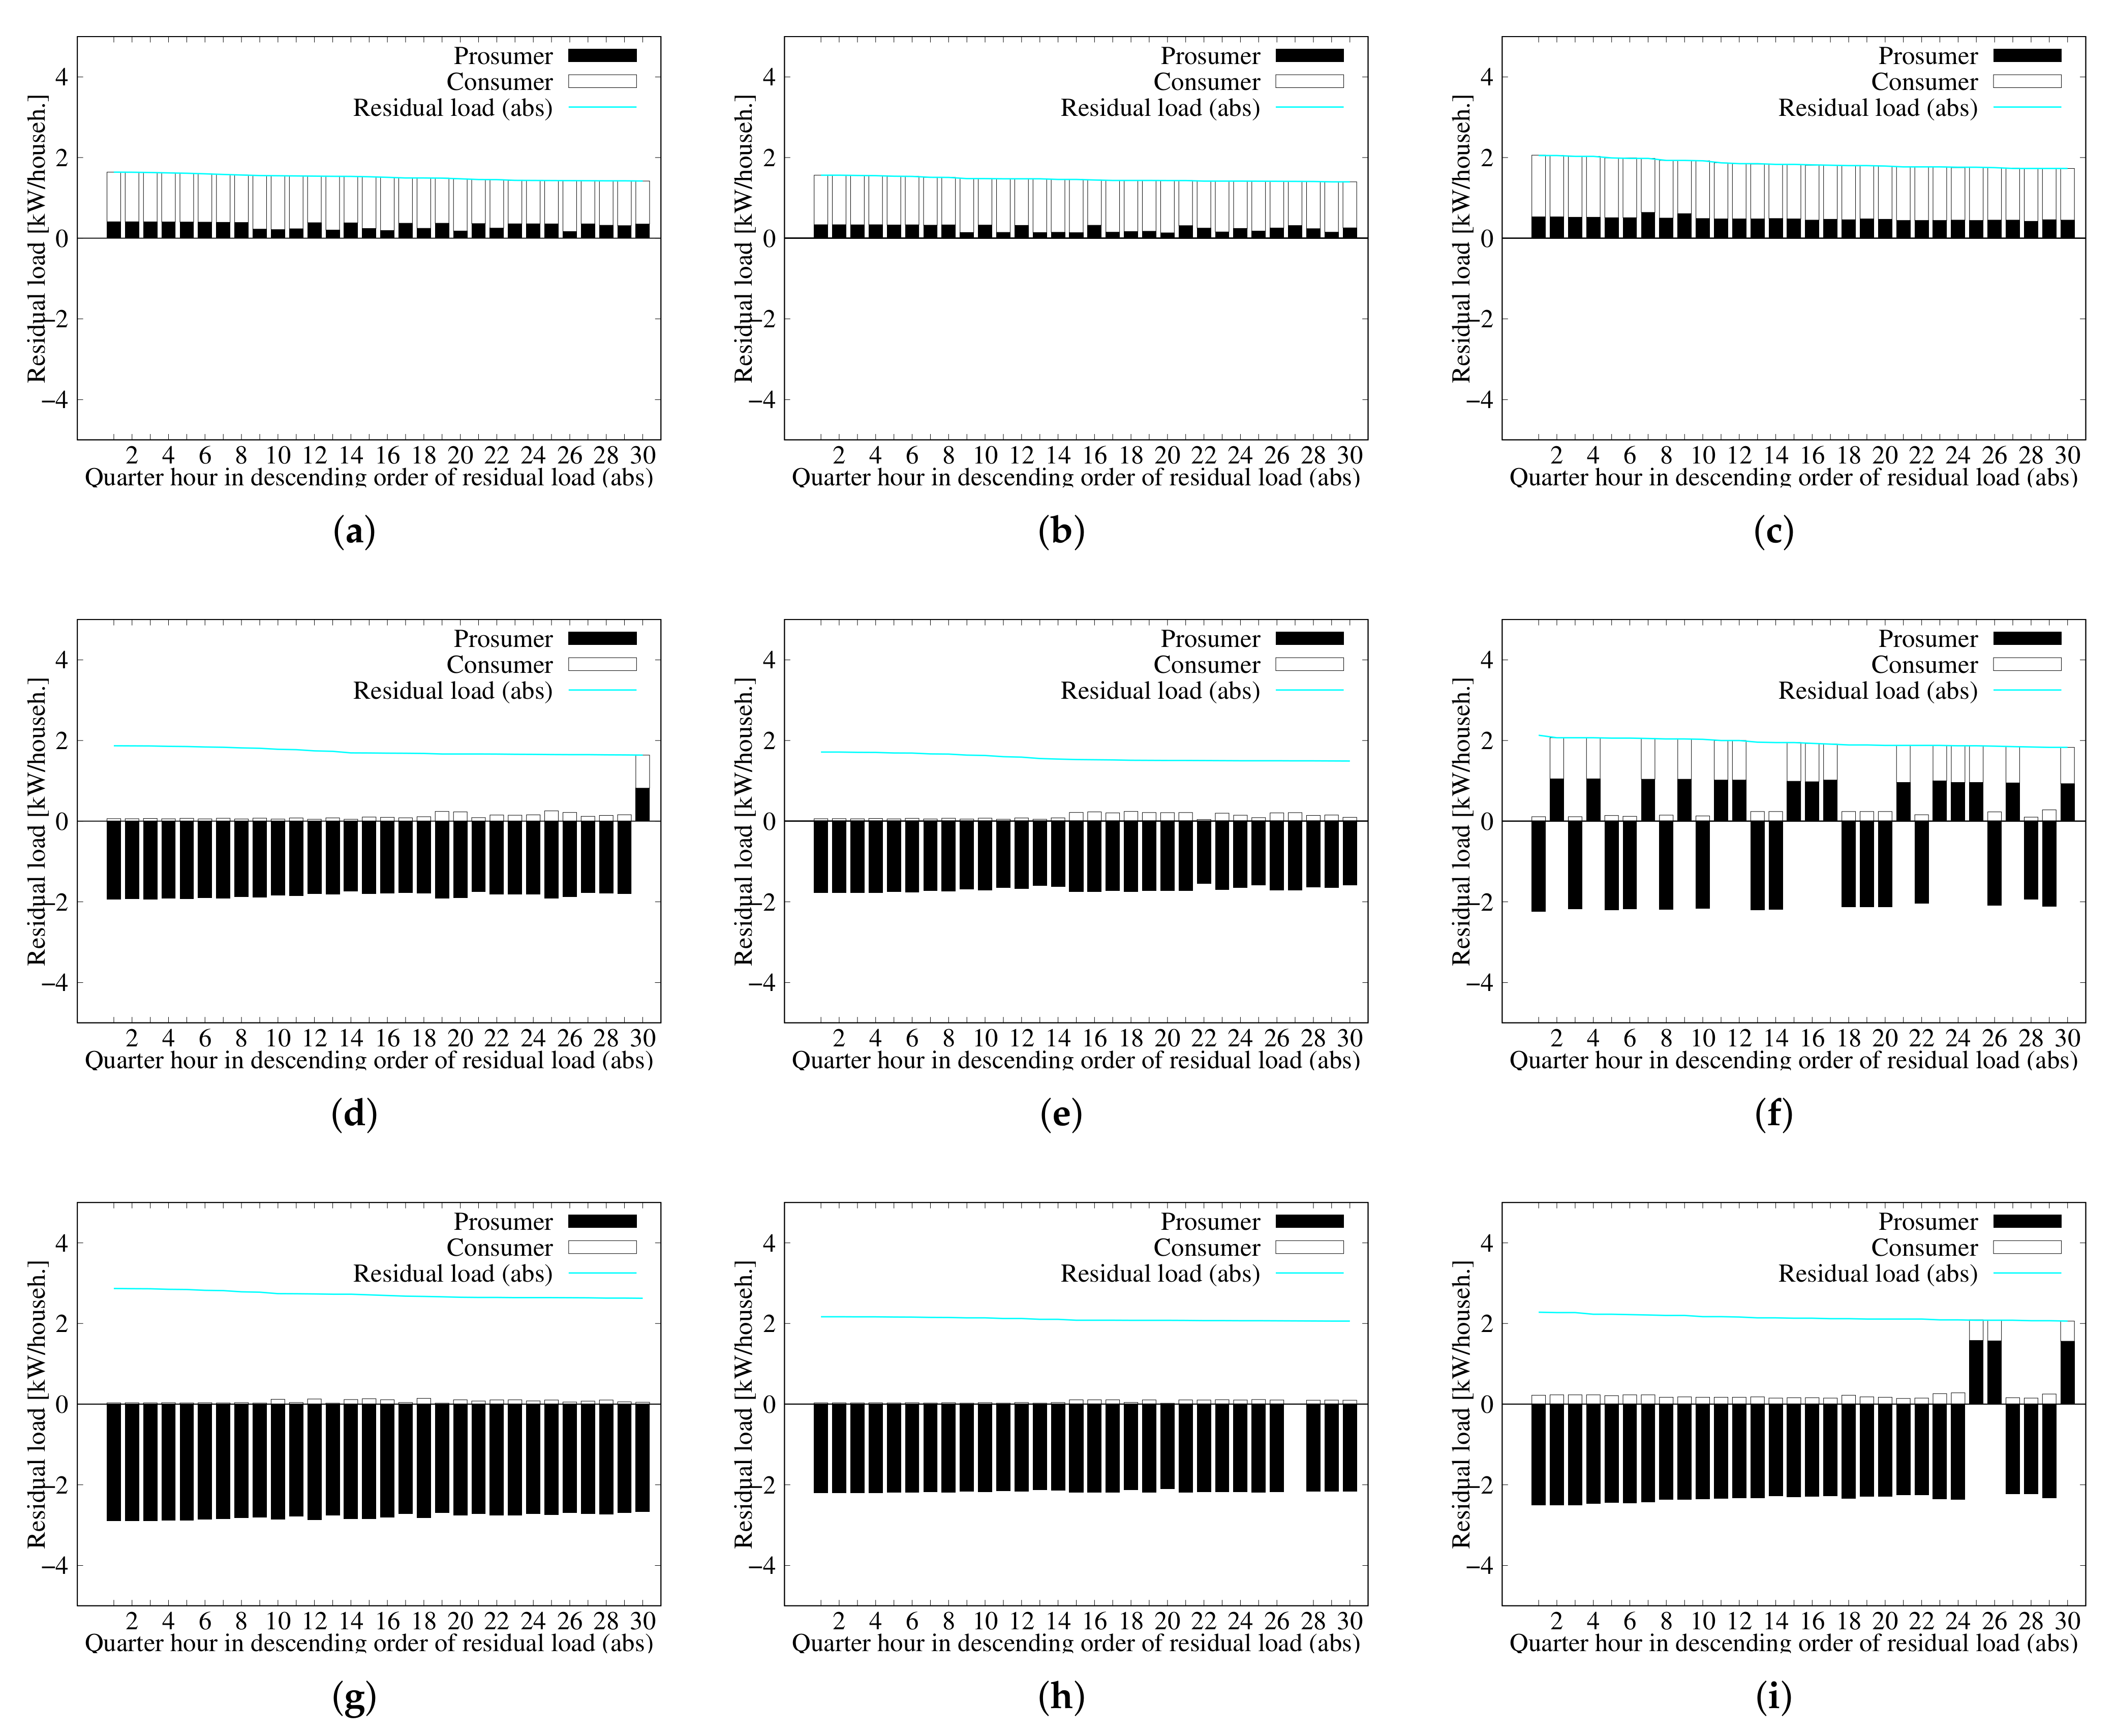
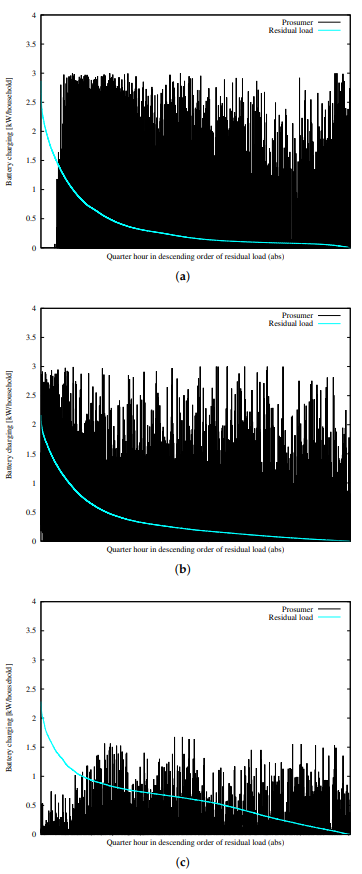
To evaluate the effects at the distribution network level, this study quantifies the situations of maximum residual load on the distribution network node for each of the battery operation modes 1, 2, and 3 and three different prosumer penetration ratios (25%, 50%, 75%) as indicators for the thermal stress on the network node; see Figure 5. The figure shows the top 30 highest residual load peaks in descending order. For low (25%) and medium (50%) prosumer share (“low”, “medium”, and “high” refer to our scenario framework and are by no means value statements with regards to the expected future prosumer penetration ratios), the thermal stress situations are generally induced by load peaks, with the exception of the market-oriented battery operation mode 3 at 50% prosumer share. In this case, load and feed-in peaks contribute in equal parts to the network stress. For high prosumer shares (75%), the network stress is dominated by feed-in peaks, irrespective of the actual battery operation mode, even though for battery operation mode 3 at least 10% of the 30 highest residual load peaks is attributed to load peaks. By construction, the network-oriented battery operation mode 2 leads to the lowest maximum residual load peaks for all three prosumer shares. For low prosumer shares (25%), the prosumer-centric battery operation mode 1 leads to lower residual load peaks than battery operation mode 3, whereas for high prosumer shares (75%), battery operation mode 1 results in the overall highest residual load peaks. Compared to a grid-oriented battery operation, for a 75% prosumer penetration ratio, battery operation mode 1 results in a 29% higher capacity utilization on the top 30 average (2.72 vs. 2.11 kW per household) and in a 32% higher capacity utilization for the single highest residual load peak in the year (2.87 vs. 2.17 kW per household). This becomes more obvious when looking at Figure 6, which shows the annual residual load duration curves (cyan) and the corresponding momentary battery charging (black) for a 75% prosumer penetration ratio. For battery operation mode 1, one can clearly see that the situations of highest residual loads (which are dominated by feed-in peaks) occur in combination with zero battery charging. These situations typically correspond to feed-in peaks around noon, when the prosumer battery is already fully charged according to the chronological charging heuristic, and prosumer load is low. In contrast, for the network-oriented battery operation mode 2, there is a more balanced battery charging throughout the day, which helps compensate for the highest feed-in peaks, at least to some extent. A summary of results is provided by Table 5.
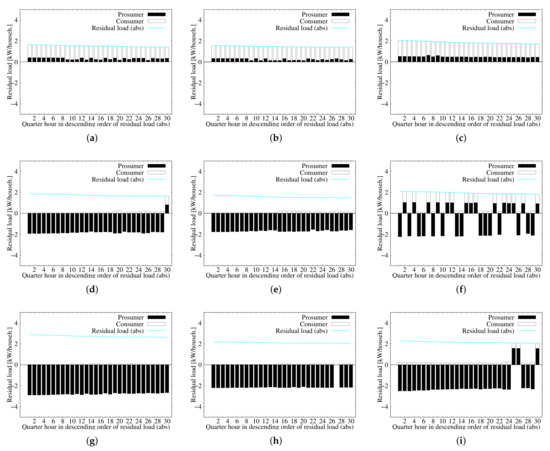
Figure 5.
Residual loads at node, per household [kW] and in descending order of the absolute value of the residual load. All figures are for a distribution network of households, i.e., . (a) Battery mode 1 at a 25% pros. penetration; (b) Battery mode 2 at a 25% pros. penetration; (c) Battery mode 3 at a 25% pros. penetration; (d) Battery mode 1 at a 50% pros. penetration; (e) Battery mode 2 at a 50% pros. penetration; (f) Battery mode 3 at a 50% pros. penetration; (g) Battery mode 1 at a 75% pros. penetration; (h) Battery mode 2 at a 75% pros. penetration; (i) Battery mode 3 at a 75% pros. penetration.
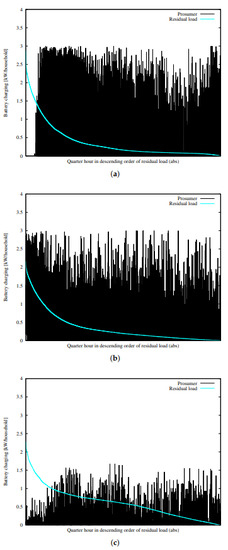
Figure 6.
Annual residual load duration curves (absolute values; cyan) and battery charging (black); by battery operation mode); for 75% prosumer penetration ratio. (a) Battery operation mode 1; (b) Battery operation mode 2; (c) Battery operation mode 3.

Table 5.
Summary of grid-level effects.
3.3. Individual Perspective: End Customer Effects
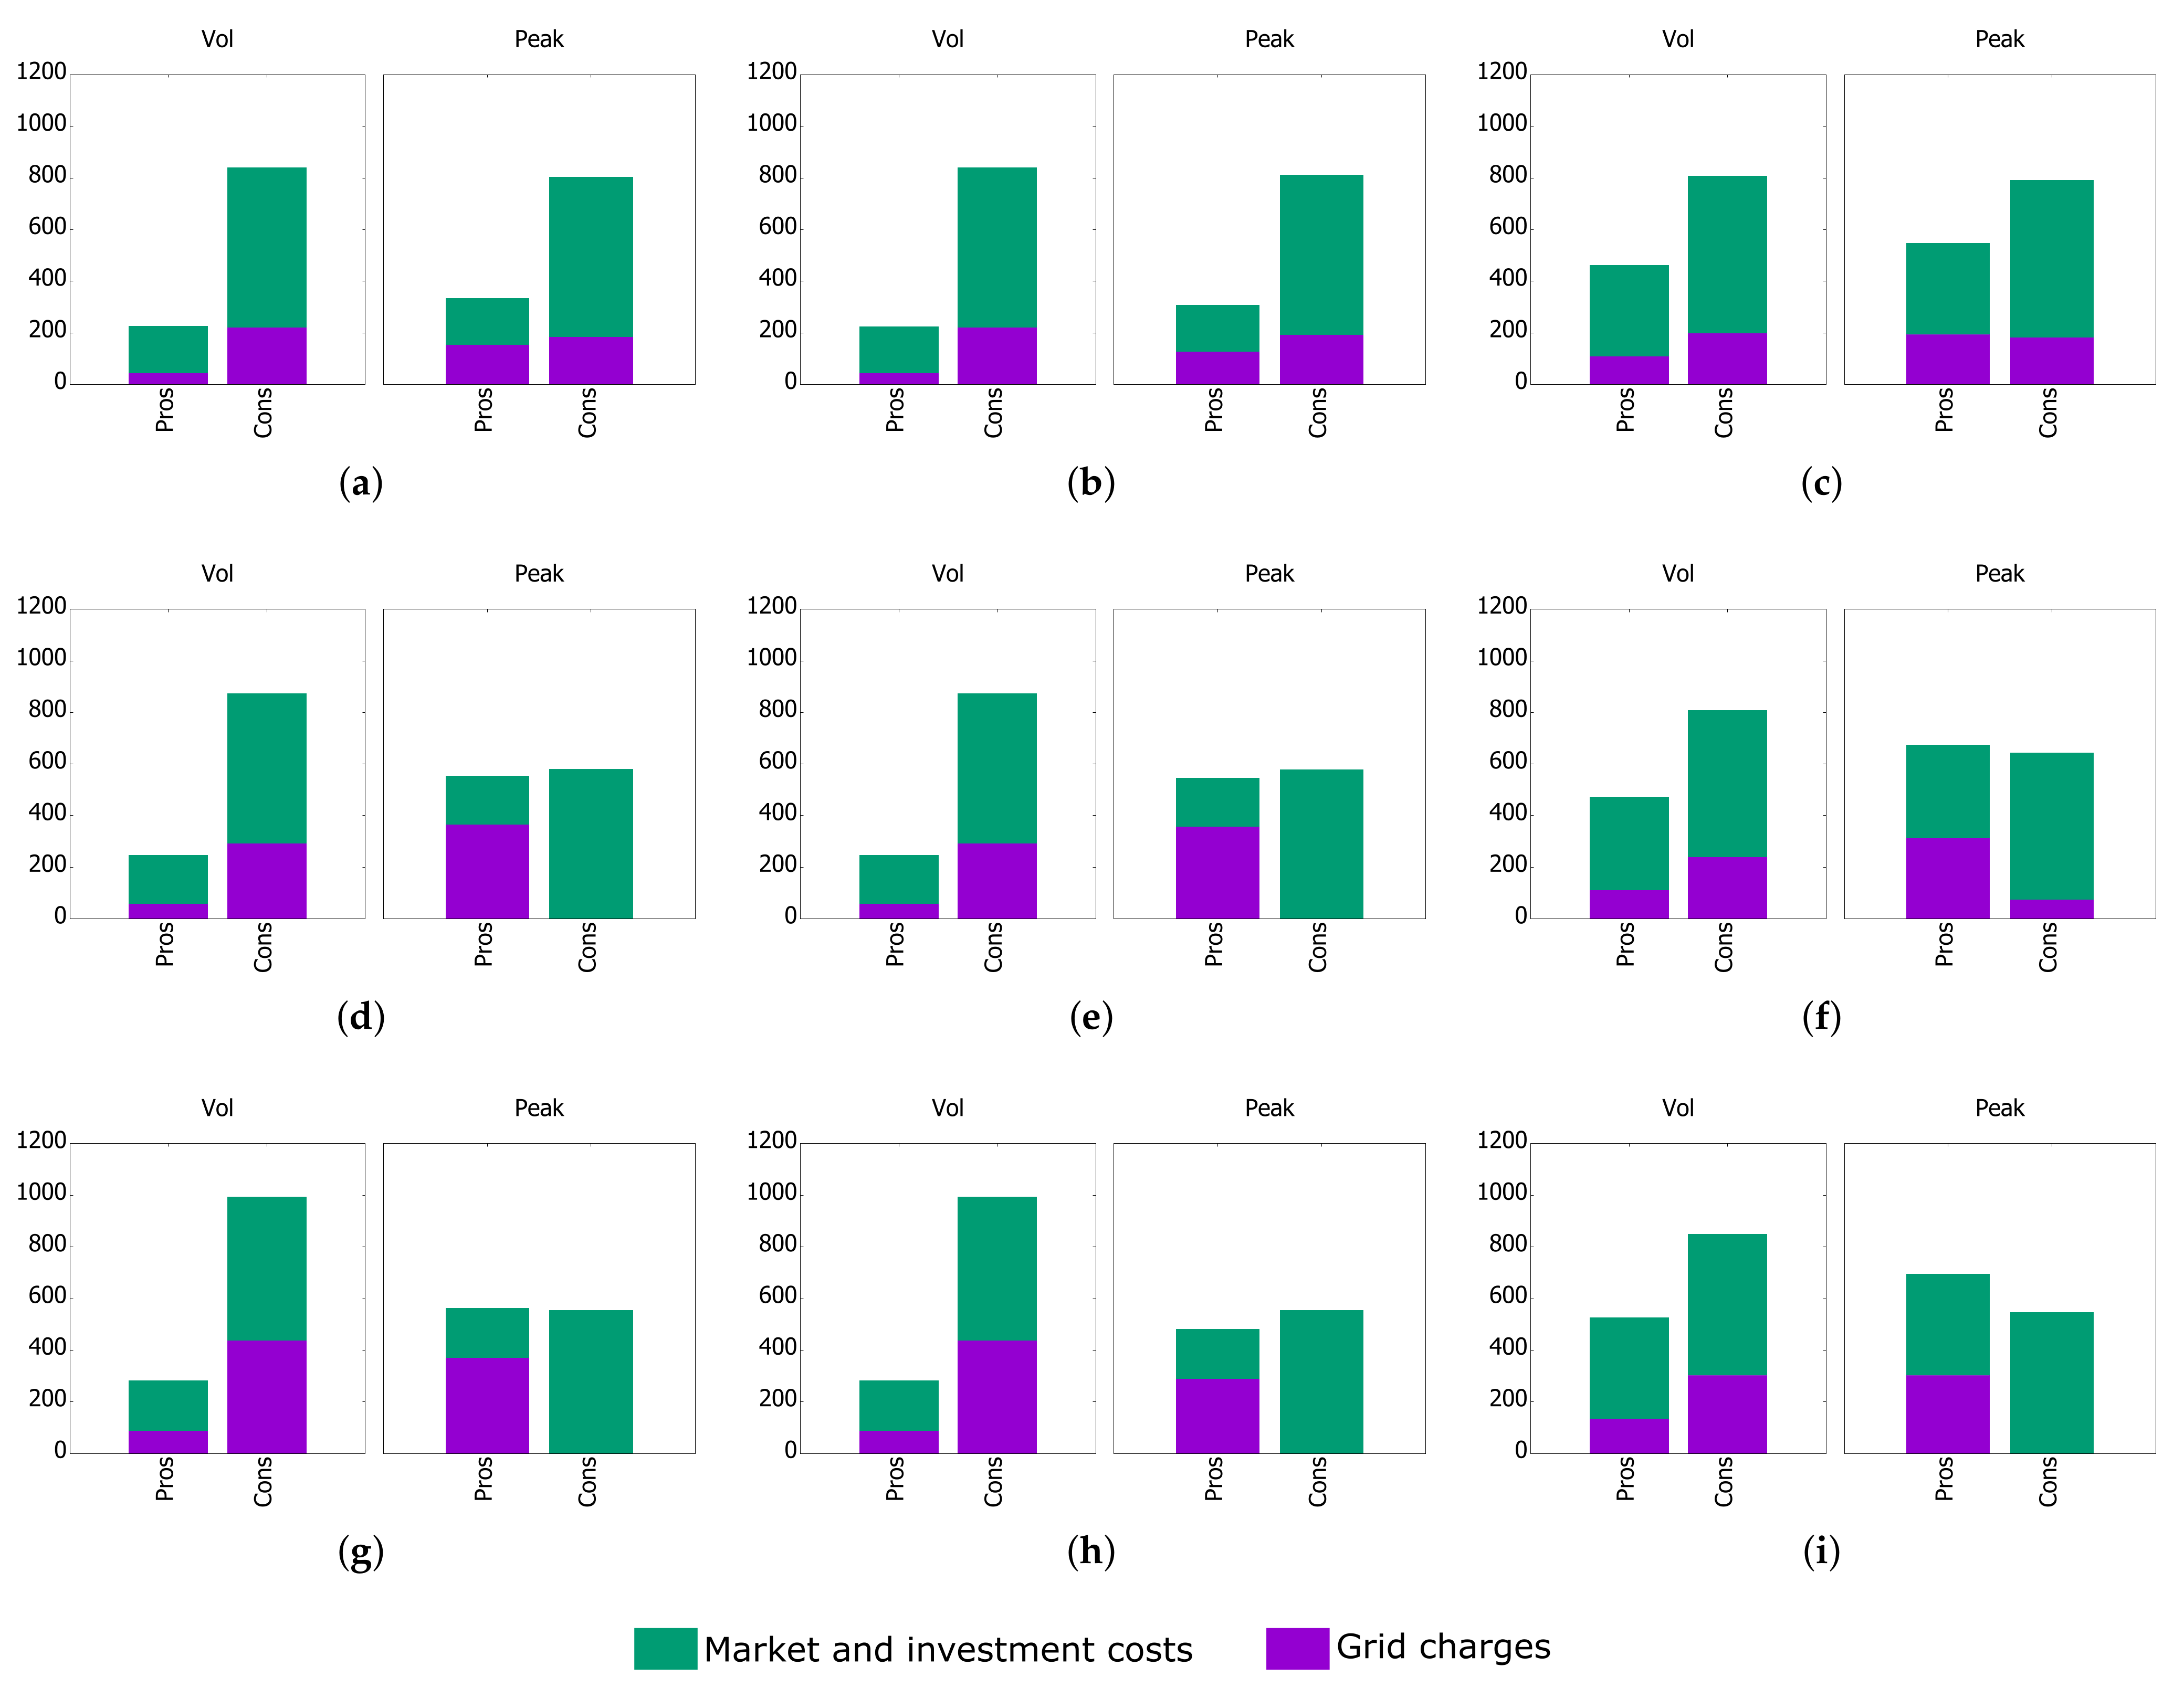
The analysis of prosumer and consumer FCOE helps identify which battery operation mode is favorable to prosumers and consumers, respectively, distinguishing two different network cost allocation schemes. Figure 7 depicts the normalized prosumer and consumer FCOE (normalization base: 800 EUR p.a.) for the three battery operation modes and three different prosumer penetration ratios (25%, 50%, 75%). On the left side of each subfigure (a–i), the FCOE are evaluated for volumetric network charges (VNC). On the right side of the subfigure (a–i), the FCOE are evaluated for peak capacity charges (CNC). Each figure also shows which part of the FCOE is attributed to network charges (violet) and which part is attributed to investment and market costs (green). The figure depicts a couple of interesting results: first, investments in distributed PV and battery systems are economically viable both under volumetric and peak capacity network charges, in principle, i.e., prosumer FCOE are lower than consumer FCOE. This is generally true for all battery operating modes with the exception of operating mode 3 in combination with peak capacity charges at medium (50%) and high (75%) prosumer penetration ratios. Second, one can clearly see that peak capacity charges generally tend to reduce the FCOE gap between prosumers and consumers (and even reverse it for operation mode 3 at medium and high prosumer penetration ratios). The essentially larger gaps between prosumer and consumer FCOE under volumetric network charges are a direct result of the fact that volumetric network charges enable prosumers to more strongly reduce their shares of refinancing grid infrastructure and operation costs through high SC; see also other studies such as [7,12]. However, high SC does not per se reduce network charges for prosumers in case of peak capacity charges, as charging is based on peak capacity utilization rather than actual energy volume withdrawn from the public network. Third, one can see that from a prosumer perspective, the market-beneficial battery operation (operation mode 3) is neither favorable for volumetric nor peak capacity network charges, i.e., prosumer FCOE are highest for battery operation mode 3, independent of the network cost allocation scheme and the prosumer penetration ratio. This is a direct consequence of the generally significantly lower achievable prosumer SC ratios in case of a market-oriented battery operation. In this study, the SC ratios decrease from 51% for battery operation modes 1 and 2 to 29–35% for battery operation mode 3. This demonstrates that further adjustments of the regulatory framework are needed to incentivize market-beneficial battery operation. As a consistency check, one can see that for peak capacity charges, the network-beneficial battery (operation mode 2) is favorable to the prosumer. Elsewhere, for volumetric network charges, chronological charging of the battery (operation mode 1) guarantees the lowest FCOE for the prosumer. A summary of results is provided by Table 6 and Table 7.
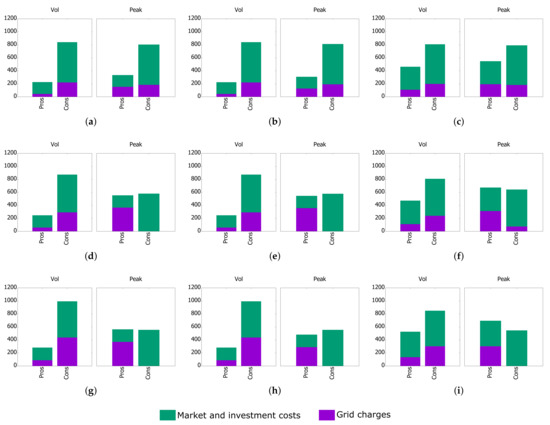
Figure 7.
FCOEs for prosuming and consuming households [EUR/a] for different battery operation modes (1/2/3), network cost allocation schemes (vol/peak), and prosumer penetration ratios (25%, 50%, 75%). (a) Battery mode 1 at a 25% pros. penetration; (b) Battery mode 2 at a 25% pros. penetration; (c) Battery mode 3 at a 25% pros. penetration; (d) Battery mode 1 at a 50% pros. penetration; (e) Battery mode 2 at a 50% pros. penetration; (f) Battery mode 3 at a 50% pros. penetration; (g) Battery mode 1 at a 75% pros. penetration; (h) Battery mode 2 at a 75% pros. penetration; (i) Battery mode 3 at a 75% pros. penetration.

Table 6.
Summary of end customer effects for volumetric grid charges.

Table 7.
Summary of end customer effects for peak capacity charges.
As illustrated in Figure 7, in the case of peak-coincident capacity charges, only prosumers pay network charges for medium (50%) and high (75%) prosumer penetration ratios. This is a direct consequence of the corresponding network utilization, which is (nearly) fully induced by prosumer feed-in peaks; see Figure 5. Consecutively, the specific CNC times the number of prosuming households excels the needed network refinancing sum; therefore, no additional fixed charge per customer is required, which would have been paid by prosumers and consumers. Consequently, in these cases, only prosumers pay network charges whereas consumers are entirely disburdened.
3.4. Effects of Widespread e-Mobility
In this subsection, we present the results at the system, network, and individual household levels under consideration of widespread e-mobility. Figure 8, which shows total system costs and CO2 emissions as a function of the battery operation mode, displays a very similar pattern as in the case without e-mobility (Figure 4). Market-oriented battery operation results both in the lowest total system costs and lowest overall CO2 emissions. However, widespread e-mobility reduces the relative CO2 reduction for battery operation mode 3, compared to a setting without e-mobility (10.5% vs. 23.1% for a 50% prosumer penetration ratio). This is a direct consequence of an overall increased electricity demand resulting in better RES integration options for all three battery operation modes, and consequently reducing the deltas between battery operation modes 1, 2 and battery operation mode 3.
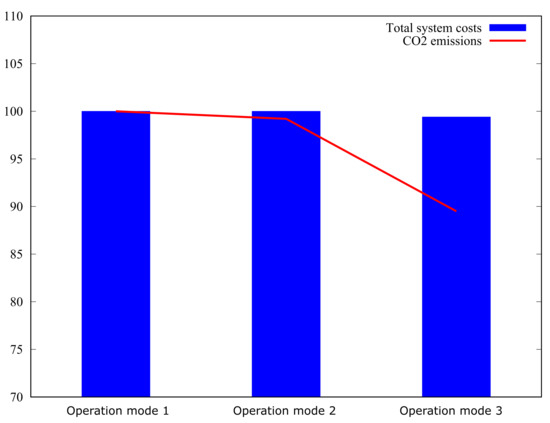
Figure 8.
Annualized total system costs and CO2 emissions, normalized in % of respective values for battery operation mode 1 by battery operation mode for a 50% prosumer penetration ratio under consideration of widespread e-mobility.
In case of widespread e-mobility, the situations of maximum network capacity utilization are load-driven, irrespective of the battery operation mode; see Figure 9. This is in contrast to Figure 5, where the corresponding situations are induced by feed-in peaks in a setting without e-mobility for medium and high prosumer shares. Moreover, the absolute value of the maximum residual load peaks increases significantly under consideration of e-mobility, from around 2 kW per household to around 3 kW per household, corresponding to a relative increase of approximately 50%. In view of the maximum feed-in peaks in Figure 5, which are lower than 3 kW per household for all three considered prosumer penetration ratios, one can conclude that with widespread e-mobility, the thermal stress will be predominantly induced by load peaks, irrespective of the actual prosumer share. As in the setting without e-mobility, Figure 9 demonstrates that battery operation mode 2 leads to the overall lowest maximum network capacity utilization (2.79 kW vs. 3.04 kW for battery operation mode 1 and 3.02 kW for battery operation mode 2). This corresponds to a maximum peak load reduction of 8% compared to battery operation mode 1, which matches the relative reduction for a setting without e-mobility (1.71 kW vs. 1.87 kW); see Table 5. This demonstrates that a grid-oriented battery operation can, in principle, efficiently release the distribution network both in a feed-in and a load-dominated setting.

Figure 9.
Residual loads at the node, per household [kW] and in descending order of the absolute value of the residual load. All figures are for a distribution network of households, i.e., . For a 50% prosumer penetration ratio under consideration of widespread e-mobility. (a) Battery mode 1, with e-mobility; (b) Battery mode 2, with e-mobility; (c) Battery mode 3, with e-mobility.
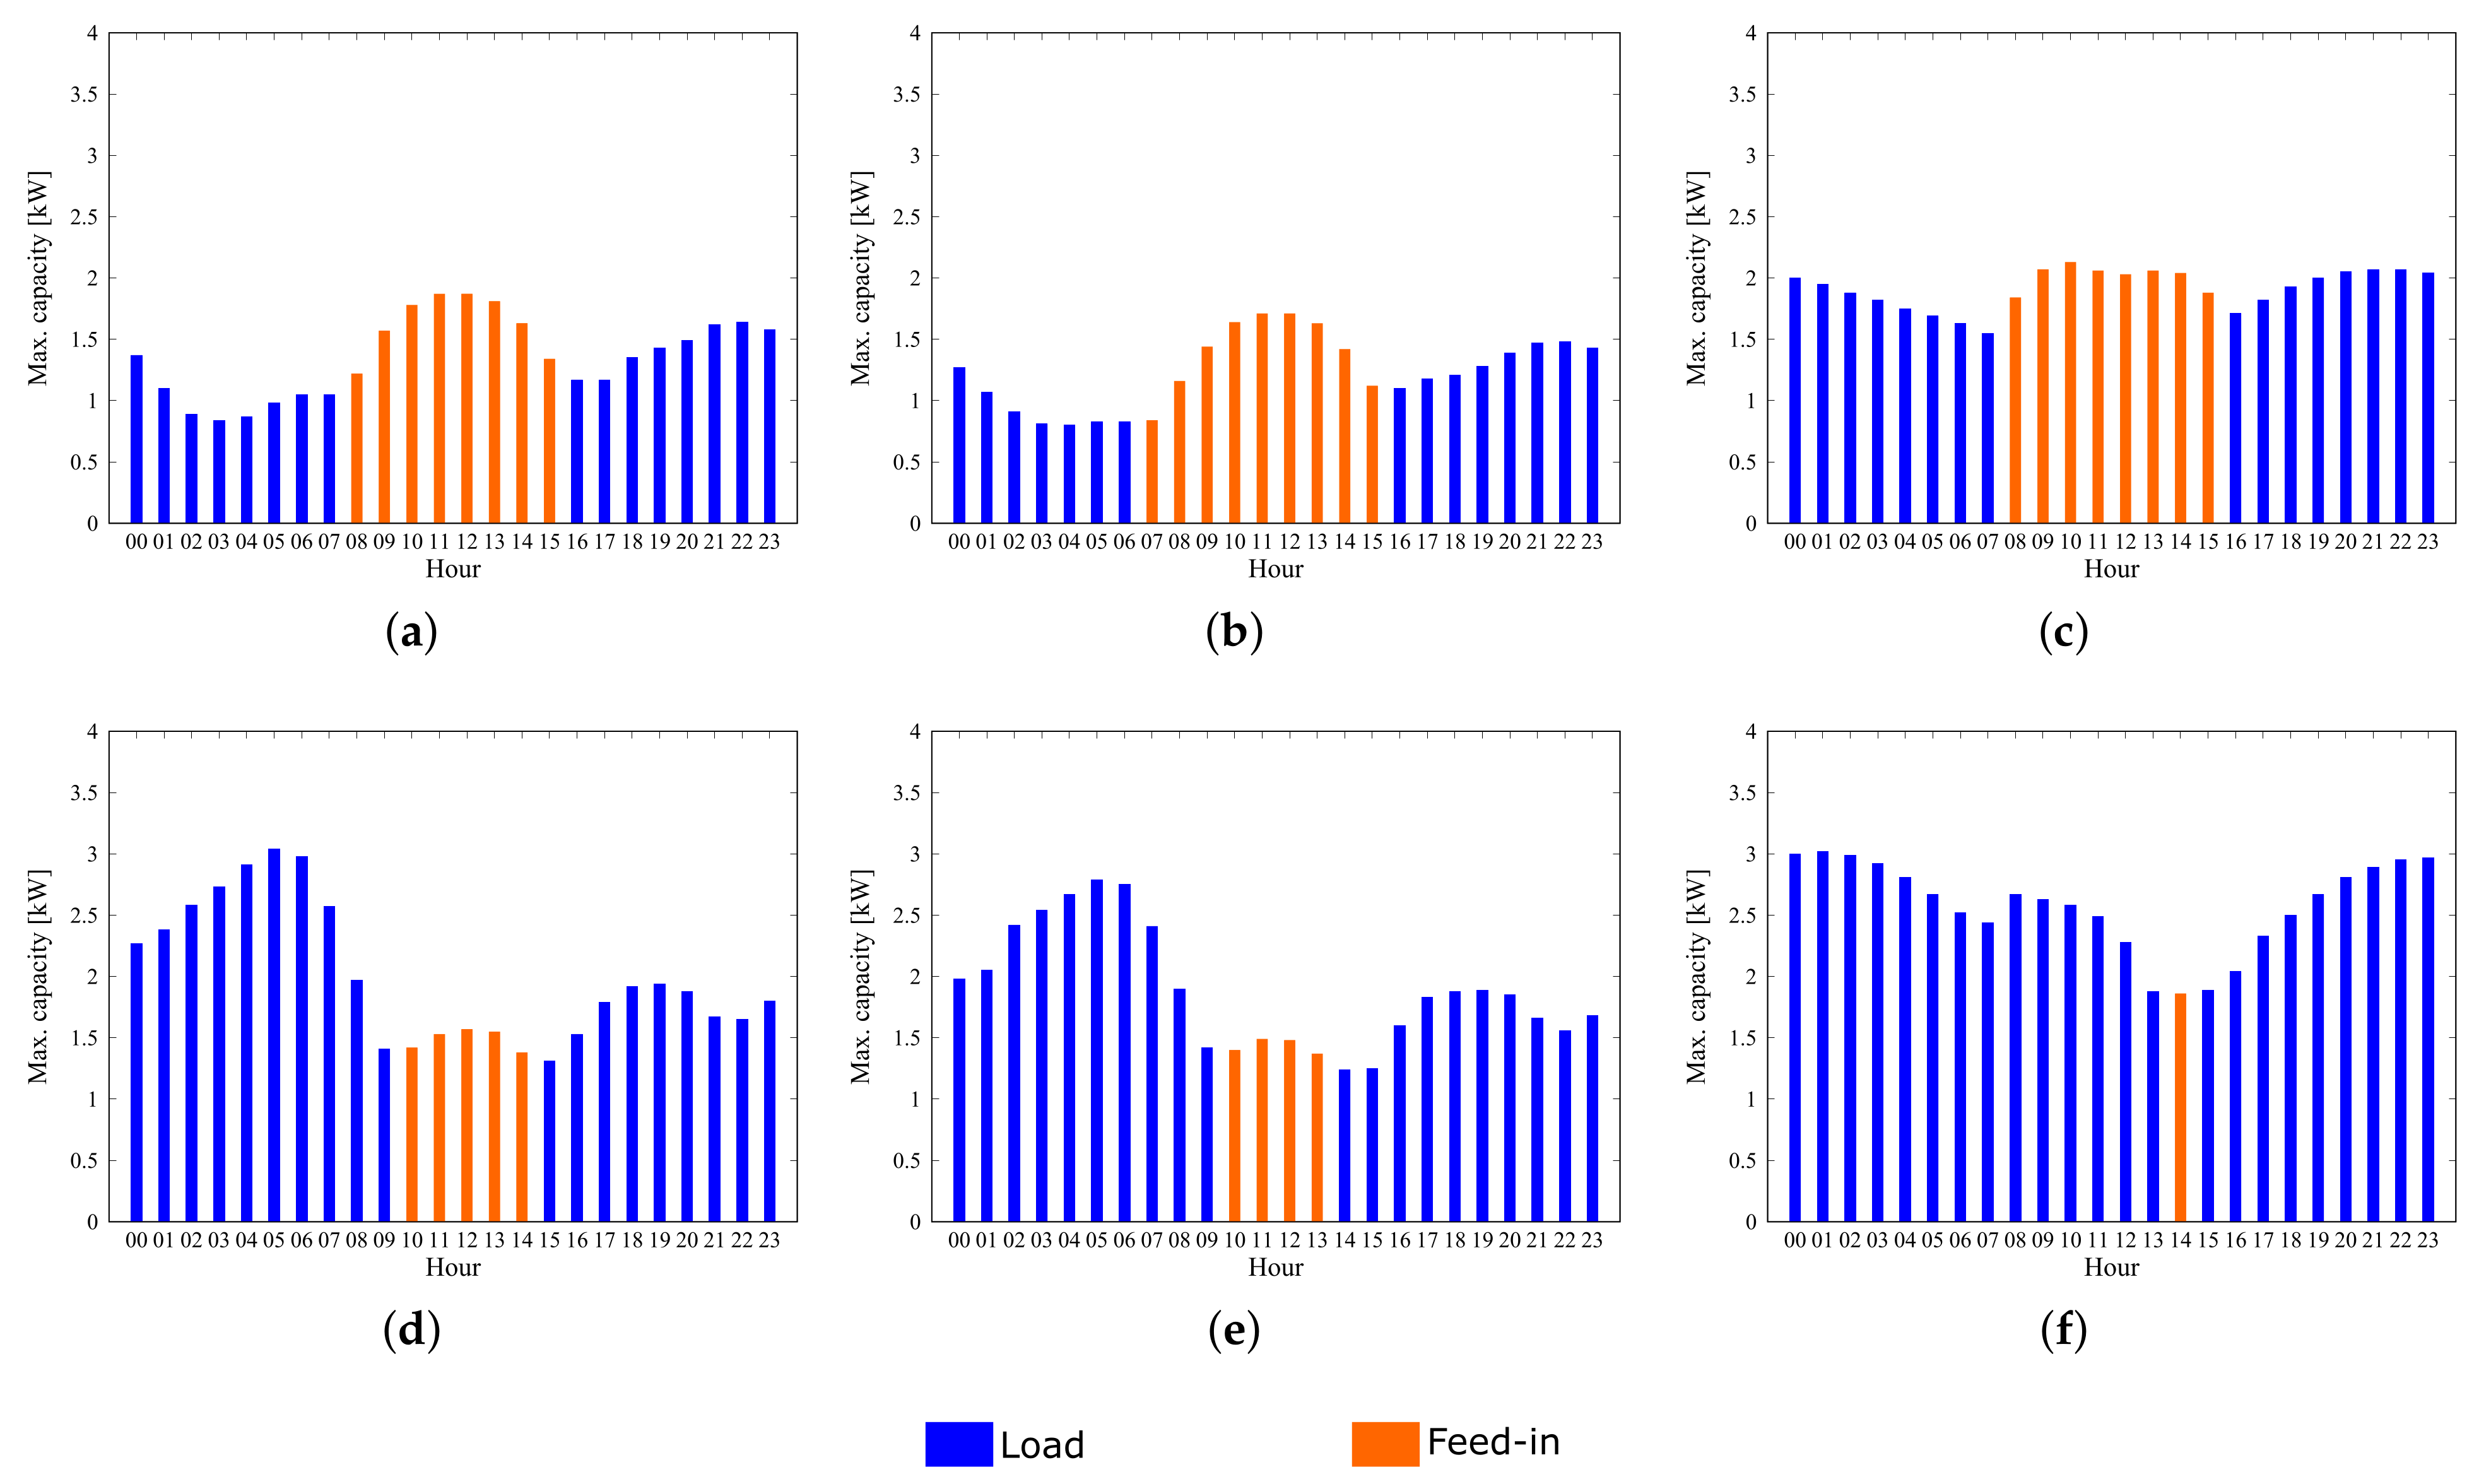
Figure 10 further reveals the effect of widespread e-mobility at the distribution network level by depicting the maximum residual load peak on the network node within a year for each hour of the day; see Equation (12). Here, represents a selected hour h of the day.
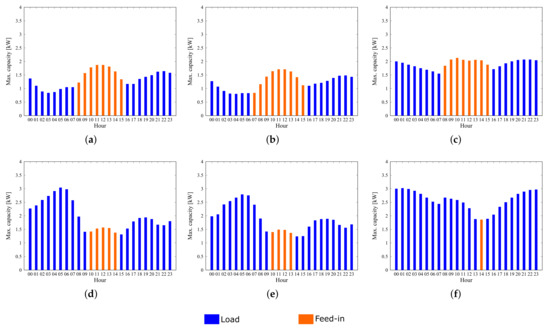
Figure 10.
Maximum residual load per hour in a year, per household [kW]. All figures for a distribution network of households, i.e., . For a 50% prosumer penetration ratio, second line under consideration of widespread e-mobility. (a) Battery mode 1, without e-mobility; (b) Battery mode 2, without e-mobility; (c) Battery mode 3, without e-mobility; (d) Battery mode 1, with e-mobility; (e) Battery mode 2, with e-mobility; (f) Battery mode 3, with e-mobility.
For a setting without e-mobility, the situations of maximum thermal stress are induced by feed-in peaks around noon (orange, first line of Figure 10a–c, whereas under consideration of e-mobility, the situations of maximum thermal stress are induced by load peaks in the night (blue, second line of Figure 10d–f, when the electric vehicles are charged. Feed-in peaks still occur during noon times but play a minor role compared to the load peaks. In this context it is questionable whether general PV peak shaving, which is part of some of today’s regulatory frameworks, will remain a reasonable instrument for distribution network release in the future.
Figure 11 depicts prosumer and consumer FCOE under consideration of widespread e-mobility. In principle, this figure resembles the situation depicted in Figure 7; however, the gaps between prosumer and consumer FCOE tend to be even larger in the case of widespread e-mobility. This is the expected result, as with e-mobility, the annual electricity demand per household increases and so do the electricity supply costs. This primarily affects the consuming households, who do not have cost mitigation options through SC. Meanwhile, prosumers can even increase their SC ratios (59% for battery operation modes 1 and 2 and 46% for battery operation mode 3). Even though one can clearly see that capacity-based network charges mitigate the FCOE gaps even in case of widespread e-mobility, they cannot be sufficient in order to eliminate these inequalities entirely. This, again, highlights that further regulatory instruments would be needed in order to share the burdens between different stakeholder groups, such as prosumers and consumers, more fairly.

Figure 11.
FCOEs for prosuming and consuming households [EUR/a] for different battery operation modes (1/2/3), network cost allocation schemes (vol/peak), and 50% prosumer penetration ratio under consideration of widespread e-mobility. (a) Battery mode 1 with e-mobility; (b) Battery mode 2 with e-mobility; (c) Battery mode 3 with e-mobility.
4. Discussion
Overall, this manuscript evaluates the impact of prosumer behavior at the individual level (electricity bill), local level (distribution network stress), and the system level (total system costs) (The following discussion section is taken from [1] and slightly adapted and complemented). Volumetric network charges tend to favor battery operation modes that are neither grid- nor market-oriented. Such battery operation modes can result in significantly higher thermal stress on the distribution network nodes. Moreover, these modes can cause overall higher system costs and CO2 emissions due to an overall reduced RES integration capacity. Moreover, volumetric network charges can amplify the gap between prosumer and consumer household electricity bills. These inequalities could be mitigated by capacity-based network charges, which could help redistribute the burdens that originate form refinancing network operation and infrastructure costs between prosumers and consumers. Moreover, peak capacity charges could constitute an incentive for different battery operation modes. Besides reducing potentially significant inequalities between prosumer and consumer electricity bills, such grid-oriented battery operation modes could release the distribution network for settings of predominantly negative residual load peaks as well as for settings of predominantly positive residual load peaks. However, grid-oriented battery operation modes do not, per se, result in corresponding positive market effects. On the contrary, this paper suggests that there are conflicting objectives between network-oriented and market-oriented battery operation. In this study, market-oriented battery operation displays optimal RES integration, resulting in the lowest system costs and CO2 emissions. Explicit consideration of widespread e-mobility results in the same basic picture, which at the same time is an important indication of the stability of the results in view of parametric uncertainties (profile effects). Individual inequality effects, in particular, could be even increased by e-mobility as the advantage of prosumer SC is leveraged through increasing electrification of further end uses. We would like to emphasize that the analysis is in parts highly stylized and exhibits several limitations that require further research. Most prominently, a more detailed disaggregation of household groups and corresponding profiles, as well as explicit load flow calculations, could be performed in further research.
Author Contributions
Conceptualization, C.S.; methodology, C.S.; software, C.S.; validation, C.S.; formal analysis, C.S.; data curation, C.S.; writing—original draft preparation, C.S.; writing—review and editing, N.K. and K.H.; visualization, C.S.; supervision, N.K. and K.H. All authors have read and agreed to the published version of the manuscript.
Funding
This research received no external funding.
Data Availability Statement
The data presented in this study are available on request from the corresponding author.
Conflicts of Interest
The authors declare no conflict of interest.
Abbreviations
The following abbreviations are used in this manuscript:
| CNC | (Peak-coincident) network capacity charges |
| ETS | Emissions Trading System |
| FCOE | Full costs of electricity |
| GHG | Greenhouse gas |
| LCOE | Levelized cost of electricity |
| PV | Photovoltaic |
| RES | Renewable energy sources |
| SC | Self-consumption |
| VNC | Volumetric network charges |
Appendix A
| Algorithm A1. Battery operation mode 1. |
|
Appendix B
We demonstrate that our approach is in (asymptotical) accordance with the theoretical functional n-dependency. The core idea is to generate n profiles from a sharp input profile by means of shifting the residual load profile values at every time step to the left and right (in temporal dimension), with shift probabilities weighted by a Gaussian normal distribution; see Equation (4). Mathematically, this means convolving the original, sharp profile with a Gaussian function.
Now we transfer this formulation to the discrete case and switch from the continuous time parameter t to discrete time steps m, applying . For given and , we shift from until . Moreover, we apply the series expansion of the exponential function, leading to Equation (A1).
Finally, assume that represents the x-coordinate of the extremum of the smoothed sum profile. Note, however, that actually is a function of n. For the applied profiles in this study, however, we can check that indeed remains relatively constant for . Hence
Note that for the trivial calse the simultaneity factor is 1 (as it should be). For any larger n, the simultaneity factor decreases with towards its limit ; see Equation (A3).
References
- Schick, C.; Klempp, N.; Hufendiek, K. Impact of network charge mechanisms on consumers, prosumers, and the energy system. In Proceedings of the 1st IAEE Online Conference, Online, 7–9 June 2021. [Google Scholar]
- Schick, C.; Klempp, N.; Hufendiek, K. Role and impact of prosumers in a sector-integrated energy system with high renewable shares. IEEE Trans. Power Syst. 2020. [Google Scholar] [CrossRef]
- Orasch, W.; Taus, H.; Auer, H.; Weißensteiner, L.; Sardi, K.; Krommydas, T.; Christ, F.; Heyder, B.; Davidson, S.; Ove, W.; et al. Regulatory Framework for RES-E System Integration in Europe—Description and Analysis of Different European Practices: Promoting Grid-Related Incentives for Large-Scale RES-E Integration into the Different European Electricity Systems; GreenNet-Incentives; European Commission: Brussels, Belgium, 2008. [Google Scholar]
- Pan, J.; Teklu, Y.; Rahman, S.; Jun, K. Review of usage-based transmission cost allocation methods under open access. IEEE Trans. Power Syst. 2000, 15, 1218–1224. [Google Scholar] [CrossRef]
- Soares, T.; Pereira, F.; Morais, H.; Vale, Z. Cost allocation model for distribution networks considering high penetration of distributed energy resources. Electr. Power Syst. Res. 2015, 124, 120–132. [Google Scholar] [CrossRef] [Green Version]
- Rubio-Oderiz, F.J.; Perez-Arriaga, I.J. Marginal pricing of transmission services: A comparative analysis of network cost allocation methods. IEEE Trans. Power Syst. 2000, 15, 448–454. [Google Scholar] [CrossRef] [Green Version]
- Eid, C.; Reneses Guillén, J.; Frías Marín, P.; Hakvoort, R. The economic effect of electricity net-metering with solar PV: Consequences for network cost recovery, cross subsidies and policy objectives. Energy Policy 2014, 75, 244–254. [Google Scholar] [CrossRef]
- Baroche, T.; Pinson, P.; Le Latimier, R.G.; Ahmed, H.B. Exogenous Cost Allocation in Peer-to-Peer Electricity Markets. IEEE Trans. Power Syst. 2019, 34, 2553–2564. [Google Scholar] [CrossRef] [Green Version]
- Nojeng, S.; Hassan, M.Y.; Said, D.M.; Abdullah, M.P.; Hussin, F. Improving the MW-Mile Method Using the Power Factor-Based Approach for Pricing the Transmission Services. IEEE Trans. Power Syst. 2014, 29, 2042–2048. [Google Scholar] [CrossRef]
- Sotkiewicz, P.M.; Vignolo, J.M. Allocation of Fixed Costs in Distribution Networks with Distributed Generation. IEEE Trans. Power Syst. 2006, 21, 639–652. [Google Scholar] [CrossRef]
- De Oliveira-De Jesus, P.M.; Ponce de Leao, M.T.; Yusta, J.M.; Khodr, H.M.; Urdaneta, A.J. Uniform Marginal Pricing for the Remuneration of Distribution Networks. IEEE Trans. Power Syst. 2005, 20, 1302–1310. [Google Scholar] [CrossRef]
- Picciariello, A.; Vergara, C.; Reneses, J.; Frías, P.; Söder, L. Electricity distribution tariffs and distributed generation: Quantifying cross-subsidies from consumers to prosumers. Util. Policy 2015, 37, 23–33. [Google Scholar] [CrossRef] [Green Version]
- Schittekatte, T.; Momber, I.; Meeus, L. Future-proof tariff design: Recovering sunk grid costs in a world where consumers are pushing back. Energy Econ. 2018, 70, 484–498. [Google Scholar] [CrossRef] [Green Version]
- Haque, M.M.; Wolfs, P. A review of high PV penetrations in LV distribution networks: Present status, impacts and mitigation measures. Renew. Sustain. Energy Rev. 2016, 62, 1195–1208. [Google Scholar] [CrossRef]
- Katiraei, F.; Aguero, J. Solar PV Integration Challenges. IEEE Power Energy Mag. 2011, 9, 62–71. [Google Scholar] [CrossRef]
- Nousdilis, A.I.; Papagiannis, G.K.; Christoforidis, G.C. Investigating the impact of decentralized energy storage systems in active low-voltage distribution networks. In Proceedings of the 2017 52nd International Universities Power Engineering Conference (UPEC), Heraklion, Greece, 28–31 August 2017; pp. 1–6. [Google Scholar] [CrossRef]
- Yan, R.; Saha, T.K. Investigation of Voltage Stability for Residential Customers Due to High Photovoltaic Penetrations. IEEE Trans. Power Syst. 2012, 27, 651–662. [Google Scholar] [CrossRef]
- Perez-Arriaga, I.J.; Knittel, C. Utility of the Future: An MIT Energy Initiative Response to an Industry in Transition; MIT Energy Initiative: Cambridge, MA, USA, 2016. [Google Scholar]
- Jasiński, J.; Kozakiewicz, M.; Sołtysik, M. The Effectiveness of Energy Cooperatives Operating on the Capacity Market. Energies 2021, 14, 3226. [Google Scholar] [CrossRef]
- McKenna, R.; Merkel, E.; Fichtner, W. Energy autonomy in residential buildings: A techno-economic model-based analysis of the scale effects. Appl. Energy 2017, 189, 800–815. [Google Scholar] [CrossRef] [Green Version]
- Weinand, J.M.; Scheller, F.; McKenna, R. Reviewing energy system modelling of decentralized energy autonomy. Energy 2020, 203, 117817. [Google Scholar] [CrossRef]
- Toradmal, A.; Kemmler, T.; Thomas, B. Boosting the share of onsite PV-electricity utilization by optimized scheduling of a heat pump using buildings thermal inertia. Appl. Therm. Eng. 2018, 137, 248–258. [Google Scholar] [CrossRef]
- Schulz, M.; Kemmler, T.; Kumm, J.; Hufendiek, K.; Thomas, B. A More Realistic Heat Pump Control Approach by Application of an Integrated Two-Part Control. Energies 2020, 13, 2752. [Google Scholar] [CrossRef]
- Kerber, G. Aufnahmefähigkeit von Niederspannungsverteilnetzen für die Einspeisung aus Photovoltaikkleinanlagen (Capacity of Low Voltage Distribution Networks Due to Power Generation of Small Photovoltaic Power Plants). Ph.D. Thesis, Technische Universität München, München, Germany, 2011. [Google Scholar]
- Rusck, S. The simultaneous demand in distribution network supplying domestic consumers. ASEA J. 1956, 10, 59–61. [Google Scholar]
- Sun, N. Modellgestützte Untersuchung des Elektrizitätsmarktes: Kraftwerkseinsatzplanung und -investitionen (Model-based investigation of the electricity market: Unit commitment and power plant investments). Ph.D. Thesis, Universität Stuttgart, Stuttgart, Germany, 2013. [Google Scholar] [CrossRef]
- Deane, J.P.; Drayton, G.; Gallachóir, B.P.Ó. The impact of sub-hourly modelling in power systems with significant levels of renewable generation. Appl. Energy 2014, 113, 152–158. [Google Scholar] [CrossRef]
- Schulz, M.; Hufendiek, K. Discussing the Actual Impact of Optimizing Cost and GHG Emission Minimal Charging of Electric Vehicles in Distributed Energy Systems. Energies 2021, 14, 786. [Google Scholar] [CrossRef]
Publisher’s Note: MDPI stays neutral with regard to jurisdictional claims in published maps and institutional affiliations. |
© 2021 by the authors. Licensee MDPI, Basel, Switzerland. This article is an open access article distributed under the terms and conditions of the Creative Commons Attribution (CC BY) license (https://creativecommons.org/licenses/by/4.0/).

