Article

Numerical Simulation of Combustion of Natural Gas Mixed with Hydrogen in Gas Boilers

1
School of Petroleum Engineering, Yangtze University, Wuhan 430100, China
2
Measurement Science and Standards, National Research Council Canada, Building M-9, 1200 Montreal Road, Ottawa, ON K1A OR6, Canada
3
Tianyuan Holding Group Co., Ltd., Wuhan 430062, China
4
Faculty of Engineering and Applied Science, Clean Energy Technologies Research Institute (CETRI), University of Regina, Regina, SK S4S 0A2, Canada
*
Authors to whom correspondence should be addressed.
Energies 2021, 14(21), 6883; https://doi.org/10.3390/en14216883
Submission received: 21 September 2021 / Revised: 13 October 2021 / Accepted: 15 October 2021 / Published: 20 October 2021

Abstract

:
Hydrogen mixed natural gas for combustion can improve combustion characteristics and reduce carbon emission, which has important engineering application value. A casing swirl burner model is adopted to numerically simulate and research the natural gas hydrogen mixing technology for combustion in gas boilers in this paper. Under the condition of conventional air atmosphere and constant air excess coefficient, the six working conditions for hydrogen mixing proportion into natural gas are designed to explore the combustion characteristics and the laws of pollution emissions. The temperature distributions, composition, and emission of combustion flue gas under various working conditions are analyzed and compared. Further investigation is also conducted for the variation laws of NOx and soot generation. The results show that when the boiler heating power is constant, hydrogen mixing will increase the combustion temperature, accelerate the combustion rate, reduce flue gas and CO2 emission, increase the generation of water vapor, and inhibit the generation of NOx and soot. Under the premise of meeting the fuel interchangeability, it is concluded that the optimal hydrogen mixing volume fraction of gas boilers is 24.7%.

1. Introduction

In recent years, with the rapid development in economy and society, the world’s energy demand is increasing, and the energy structure is changing. According to the BP 2020 [1], the overall growth of primary energy consumption has slowed down, but renewable energy consumption has increased significantly. In addition to that, the development of the natural gas industry has also increased steadily. Natural gas will account for 18% of China’s primary energy consumption by 2050 [2]. As important renewable energy, hydrogen energy is being jointly promoted by the global trend of clean and low-carbon energy and the progress of the hydrogen energy technology. Due to the large-scale use of hydrogen energy, global CO2 emission will be reduced by 20% by 2050 [3]. At present, the development and construction of the natural gas pipeline network have experienced a maturity, and it is feasible to mix hydrogen in it for utilization, and the energy storage is huge. Melaina [4] indicated that risk increases slightly when 50% hydrogen is mixed in the gas transmission pipeline but increases significantly when the gas is mixed with more than 50% hydrogen. Polman [5] et al. analyzed the risk of hydrogen mixing in pipelines and found that under the premise of effective supervision, there is no risk of explosion when the volume fraction of hydrogen mixed in gas pipelines is less than 25%. Melaina [4] et al. proposed through research that when hydrogen is mixed with a relatively low concentration (5–30% by volume) into the existing natural gas pipeline network, it will not greatly increase the risk of mixed gas utilization in the end-user equipment. Hu [6] et al. studied the laminar combustion speed of hydrogen mixed low-calorific value gas and showed that increasing the mixing ratio of hydrogen will accelerate the combustion speed of laminar flames and increase flame instability. Leng Xianyin [7] et al. studied the effect of hydrogen mixing in a precombustion chamber high-power medium speed natural gas engine on combustion and emission and concluded that a 10% hydrogen mixing ratio is the most suitable for engines. Zhao Rui [8] studied the effect of mixing hydrogen into marine natural gas engine fuel on combustion characteristics and emissions and found that hydrogen mixing can significantly reduce CO emissions but has a limited impact on NOx emissions. Wang Jinhua [9] et al. found that hydrogen mixing accelerates the chemical reaction rate of combustion and reduces the content of unburned hydrocarbons in methane through the methane–hydrogen–air laminar flame rate experiment.
Presently, the research on hydrogen-mixed combustion mainly targets engines. Related research has reached preliminary conclusions on some issues, such as hydrogen-mixed combustion will increase the flame combustion rate and reduce CO and CO2 emissions. The research on the influence of hydrogen-mixed combustion on NOx emissions has not yet reached a unified conclusion, and the mechanism of hydrogen-mixed combustion on soot emissions needs to be further studied. In this work, the casing swirl burner model is adopted, and the numerical simulation of natural gas hydrogen mixing combustion under a boiler working condition is designed. The mechanism of hydrogen doping on combustion characteristics and the formation and distribution of pollutants are analyzed.

2. Numerical Simulation

2.1. Establishment of Model

The research model adopts the casing swirl burner commonly used in gas boilers in the literature [10]. The inner diameter of the fuel and the oxidizer pipes are 16 and 30 mm, respectively, and the total length of the fuel nozzle is 160 mm. The simplified model section diagrams are shown in Figure 1. The ANSYS 14.0 was used for numerical calculation in this paper. The grid is divided into a structured network to ensure the quality of the grid. The grid is set from dense to sparse outward from the entrance and axis to ensure accuracy and simplify calculations. A grid with 42,200 grid cells, 84,985 grid faces, and 42,786 nodes is selected for simulation, as shown in Figure 2, and the details of fuel inlet encryption are shown in Figure 3. The grid quality is well checked and verified by grid independence, which meets the calculation accuracy requirements.

2.2. Numerical Solution Method Settings

In this model, the standard k-epsilon turbulence model is used to simulate the turbulent gas-phase flow. In addition, the P-1 radiation heat transfer model is selected, and the eddy-dissipation concept model is used to simulate the interaction between turbulence and chemical reaction dynamics. The probability density function (PDF) transport equation is also used in this model to predict the generation of NOx. The single-step Khan and Greeves model is used to predict the formation of soot. The pressure-based separation solver is selected. The implicit format of linearized discrete equations is adopted. The momentum equation, turbulent kinetic energy equation, and turbulent dissipation rate equation use the first-order upwind scheme, and other governing equations use the second-order upwind scheme. The pressure–velocity coupling is solved by the SIMPLE algorithm.

2.3. Model Rationality Verification

To verify the rationality of the model, the same operating conditions were used as in the literature [11] (fuel: 300 K, a mixture of C5H12 and air with a composition of 1:1, flow rate 20.76 kg/h; oxidizer: 300 K, air atmosphere, flow 221.11 kg/h). By comparing the axial CO2 mole fraction distribution of the two, as shown in Figure 4, the changes are basically the same and the fit is good, so the rationality of the model can be guaranteed.

2.4. Fuel Interchangeability Analysis

The combustion properties of fuel are related to its components, and the mixing of hydrogen will affect the properties of the gas. In order to determine that all the indicators of methane mixed with hydrogen can meet the standards of industrial gas, the Wobbe index and the calorific value of gas are selected for calculation. The yellow flame coefficient is checked according to the GB-T13611-2018 Classification and Basic Characteristics of Urban Gas [11].
The calorific value of gas is calculated as:
H   =   1 100 H 1 f 1 + H 2 f 2 + H 3 f 3 + H n f n   =   1 100 r = 1 n H r f r
where H is the calorific value of fuel gas (high calorific value Hs and low calorific value Hi), MJ/m3, Hr is the calorific value of the r combustible component in fuel gas, MJ/m3, and fr is the volume fraction of the r combustible component in fuel gas, %.
The Wobbe index, also known as the interchangeability factor, measures the interchangeability of gaseous fuels. The calculation formula is as follows:
W   =   H d
where W is the Wobbe index (high Wobbe index Ws and low Wobbe index Wi), H is the calorific value of gas, MJ•m−3, and d is the density of gas relative to air.
The yellow flame coefficient of natural gas shall not be greater than 210, and it is calculated as follows:
I Y   =   1 0.4187 f O 2 H s r = 1 n y r f r d
where IY is the yellow flame coefficient of gas, yr is the yellow flame coefficient of the r component in gas, fr is the volume fraction of the r component in gas, %; fO2 is the volume fraction of oxygen in gas, %, and Hs is the high calorific value of gas, MJ/m3.
The gas source of the selected natural gas mixed with hydrogen adopts the measurement data of West–East natural gas transmission [12], and its gas is 12 T natural gas standard. The range of the high Wobbe index should be 45.67–54.78 MJ/m3, the calorific value range of gas should be 31.97–43.57 MJ/m3, and the yellow flame coefficient should be less than 210. By calculating the high Wobbe index and calorific value of gas under various hydrogen blending ratio conditions and checking the yellow flame coefficient, the hydrogen blending ratio meeting the interchangeability conditions is obtained. The calculation results are shown in Figure 5, Figure 6 and Figure 7.
According to the calculation, when Rf is 0–0.382 and 0.997–1.0, the high Wobbe index of mixed gas meets the specification requirements. When Rf is 0–0.247, the high calorific value of the mixed gas meets the specification requirements. Under each hydrogen mixing ratio of 0–1, the yellow flame coefficient of the mixed gas meets the specification requirements. Thus, the proportion of mixed hydrogen is 0–0.25 for simulation.

2.5. Boundary Conditions and Calculation Conditions

The fuel inlet and oxidant inlet are set as the velocity inlet. The combustion outlet boundary is set as the pressure outlet, and the temperature of each boundary condition is set as 300 K. The turbulence definition method based on turbulence intensity and hydraulic diameter is selected, and the turbulence intensity at the fuel inlet and oxidant inlet is 10%, and that at the combustion outlet is 5%. The setting of each parameter is shown in Table 1.
The boiler is set to run under the condition of 200 KW heat load, thermal efficiency of 0.9, and air excess coefficient α of 1.1. The fuel gas is composed of natural gas mixed with hydrogen in the proportion of 0–0.25. After calculation, six sets of working conditions are determined, as shown in Table 2.

3. Simulation Results and Analysis

3.1. Analysis of Combustion Temperature Field

In this work, three working conditions with hydrogen blending ratios of Rf = 0, Rf = 0.1, and Rf = 0.25 are selected, and the nephogram of the overall combustion area and high-temperature zone are shown in Figure 8 and Figure 9. It can be seen from the figures that the combustion temperature distribution under working conditions with a hydrogen blending ratio of 0–0.25 is roughly the same. The high-temperature area is in the axial direction, and the range becomes larger with the increase in hydrogen blending ratio. Figure 10 shows the axial temperature distribution of each working condition. It can be seen from the figure that with the increase in hydrogen blending ratio, the combustion temperature gradually increases, the peak temperature increases, and the position of the peak area is advanced.

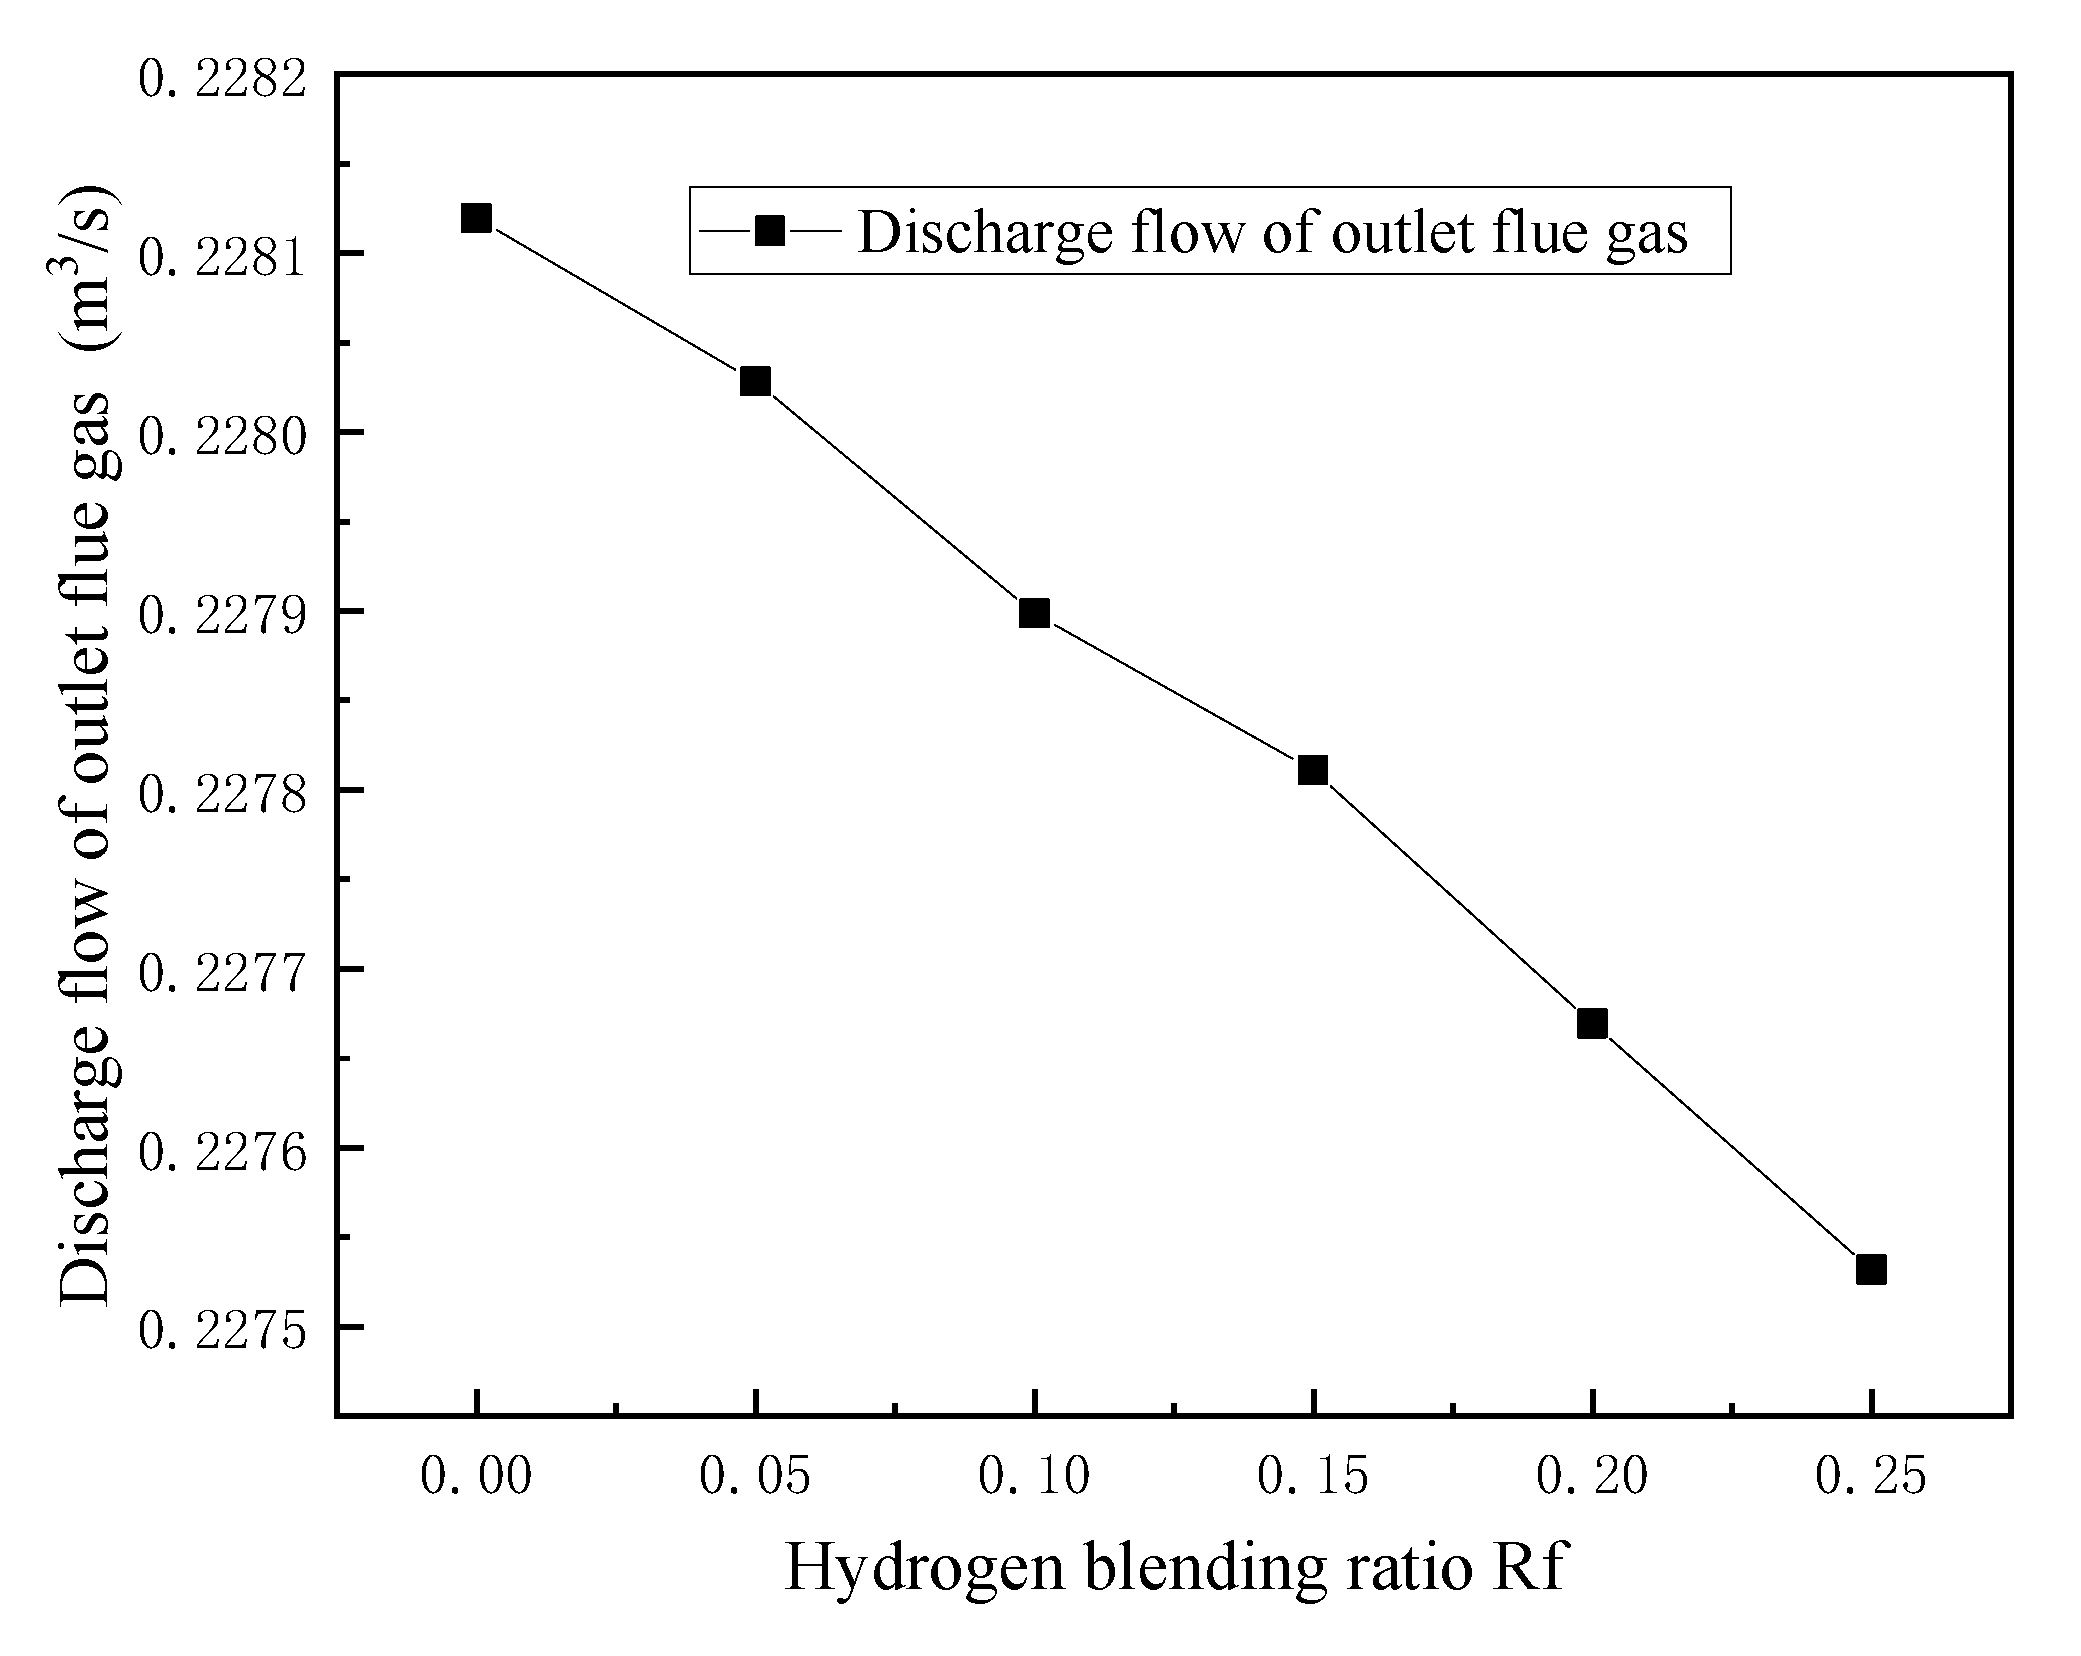
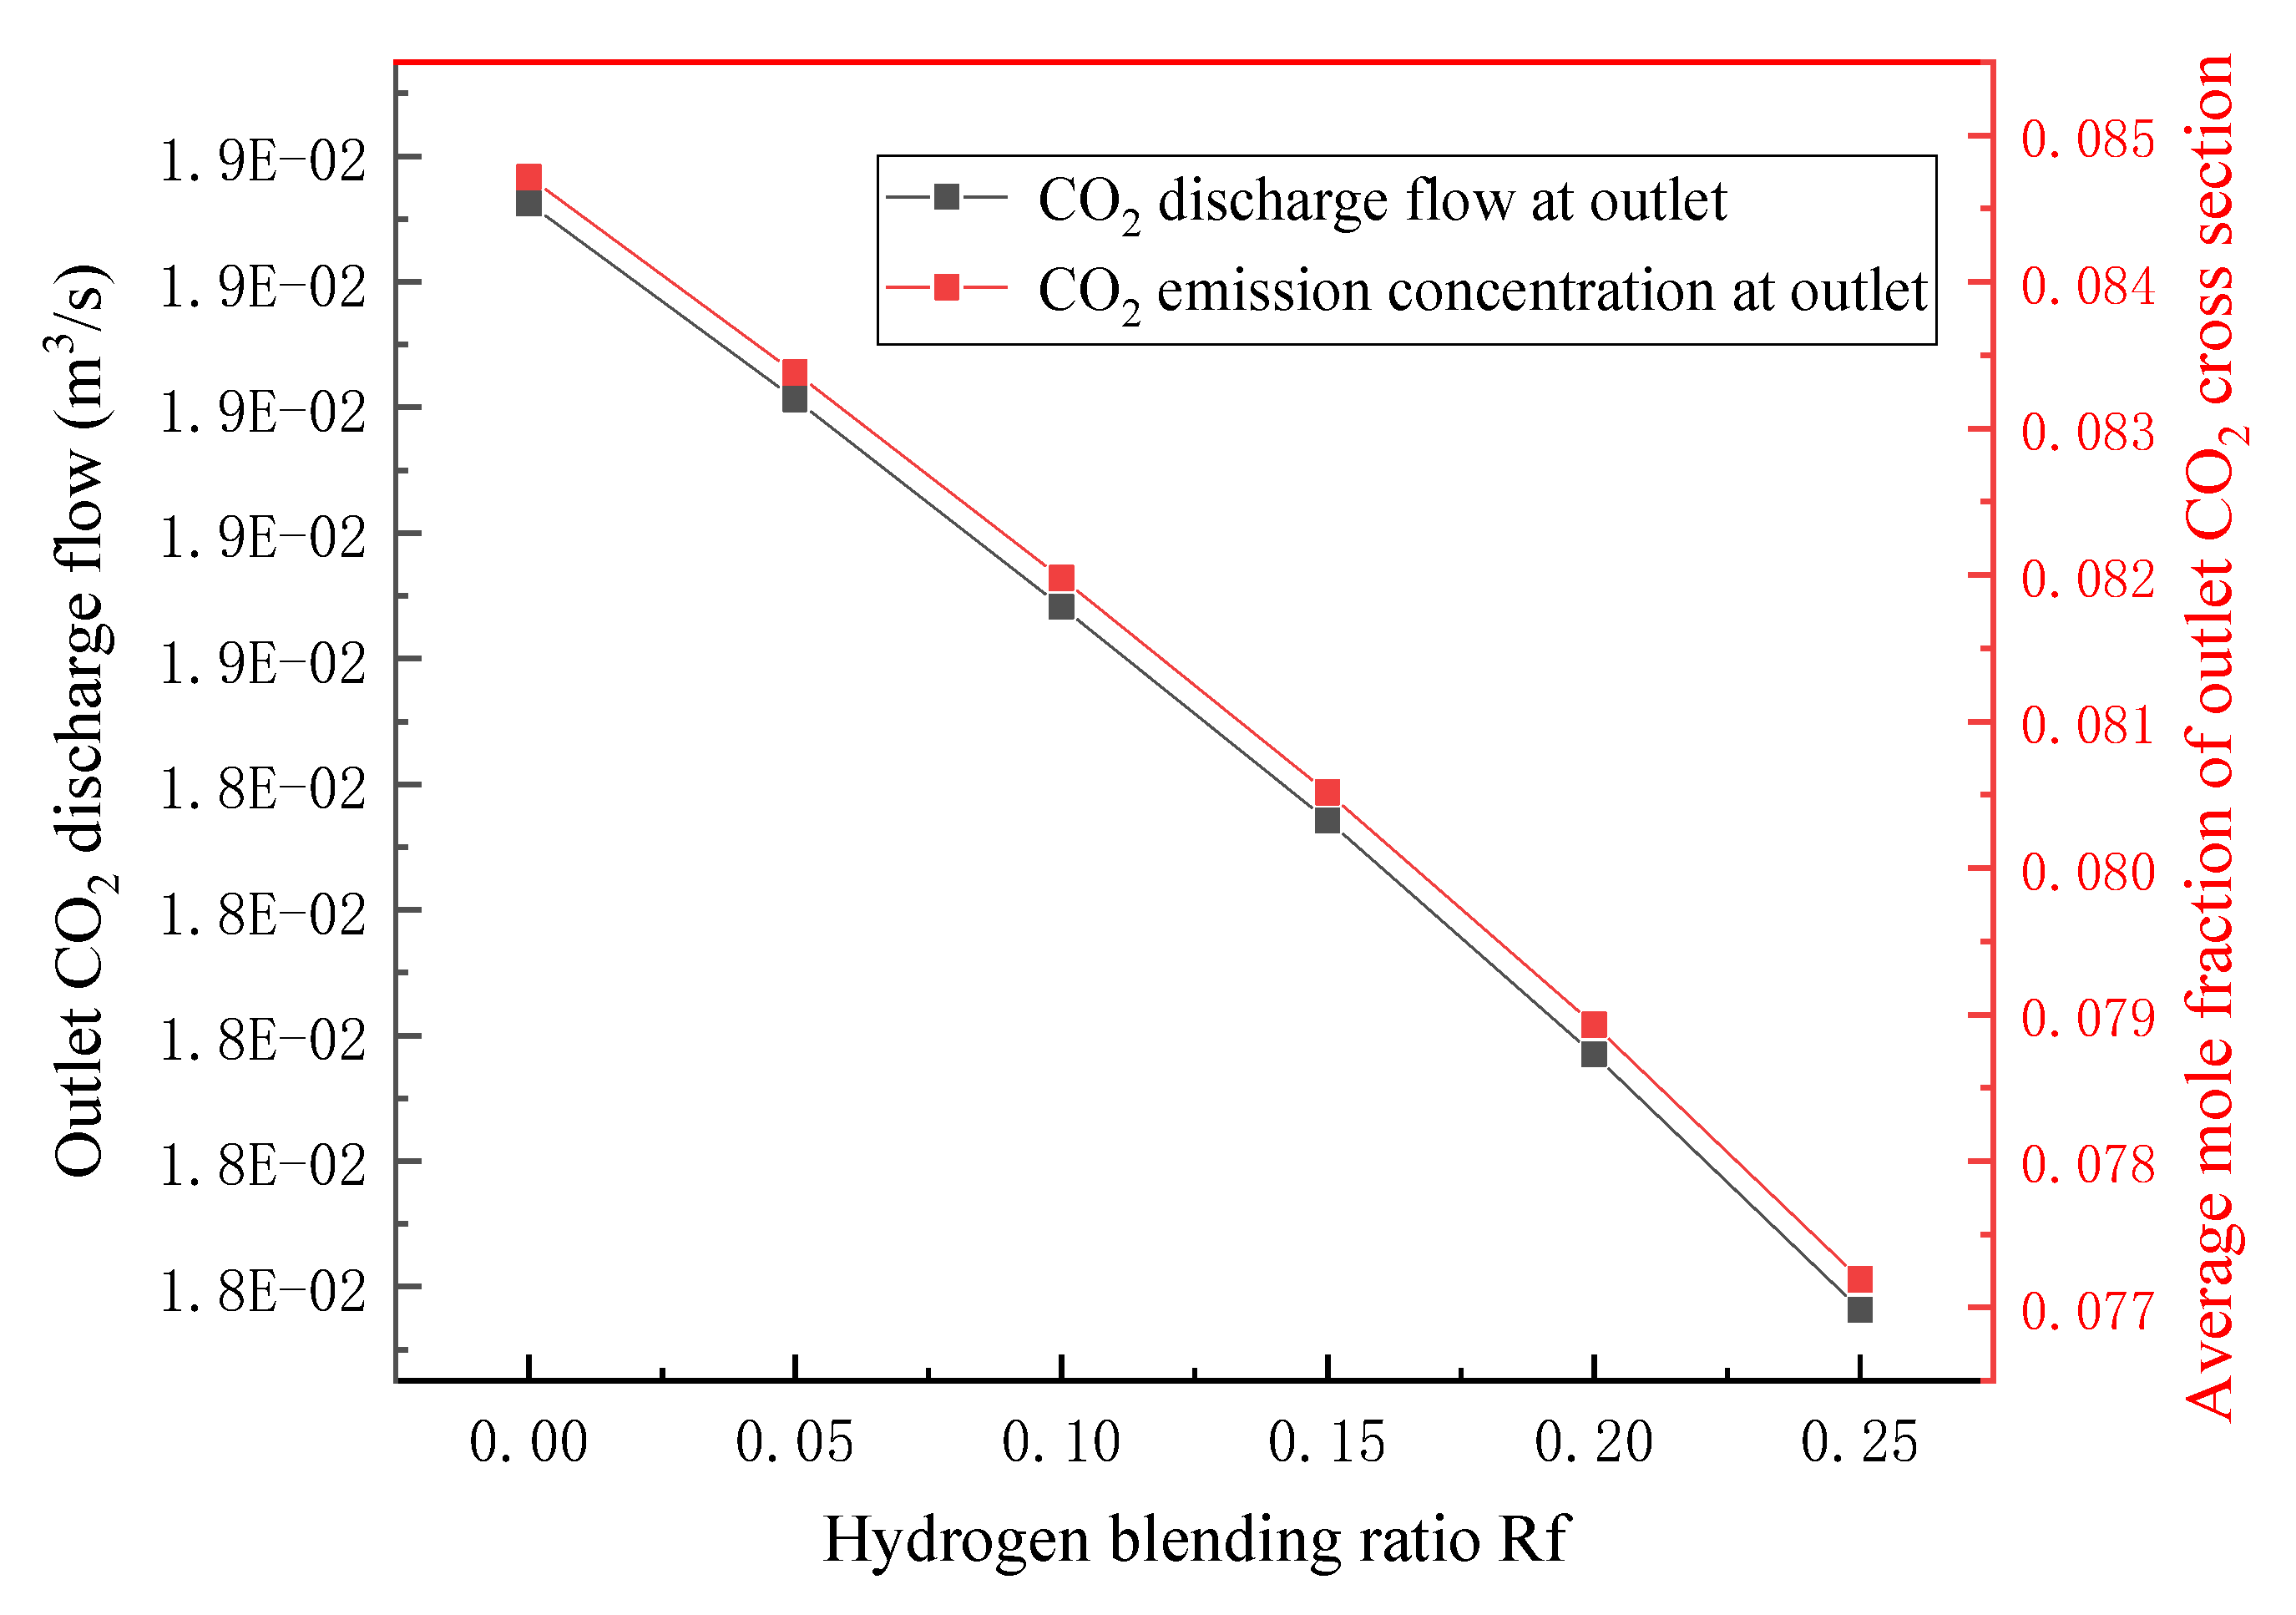
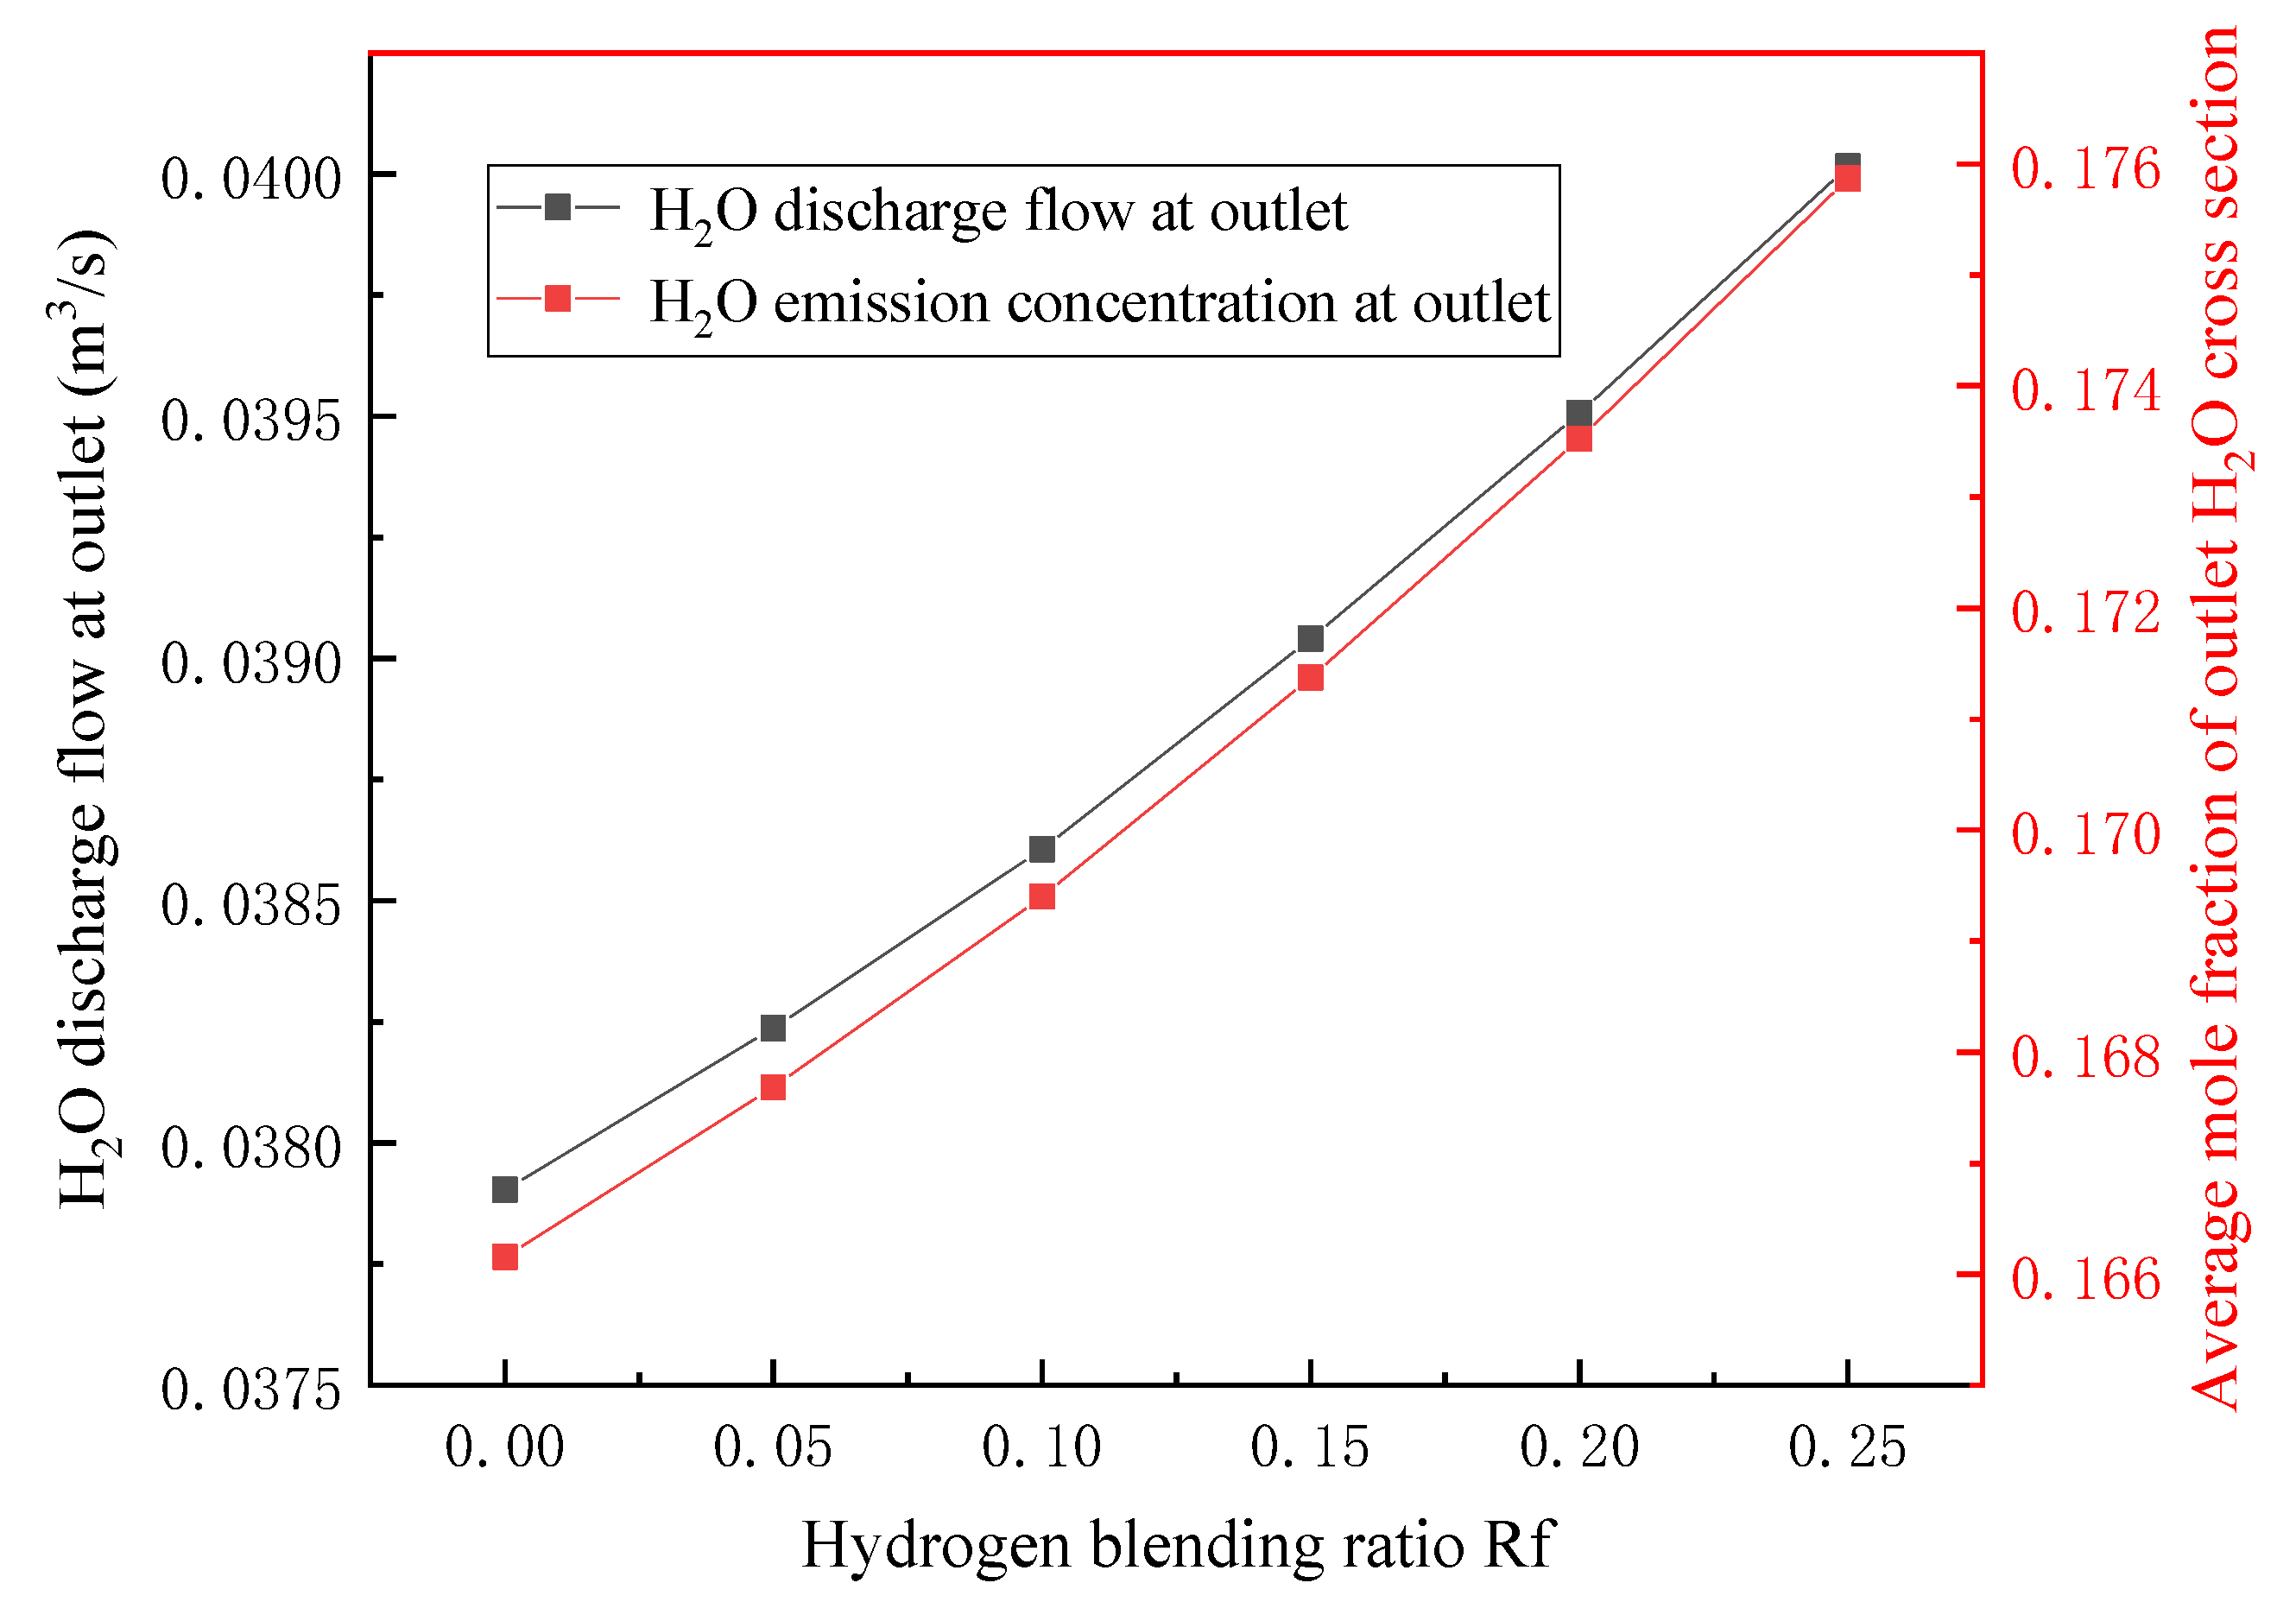
3.2. Flue Gas Analysis

The discharge flow of the main components CO2, H2O, and N2 of flue gas are calculated according to Formula (4).
Q i   =   χ i   ×   Q 0
where i represents the components CO2, H2O, and N2, Qi is the discharge flow of each flue gas component, m3/s, χi is the mole fraction of each flue gas component, and Q0 represents the total flue gas flow, m3/s.
Figure 11 shows the outlet flue gas flow under various working conditions. The discharge flow of each component is compared with the change of discharge concentration, as shown in Figure 12, Figure 13 and Figure 14, respectively. Per the figure, the total amount of the flue gas produced decreases with an increase in the hydrogen mixing ratio under the condition of keeping the calorific value of the boiler and excess air factor constant. The reason is that the addition of hydrogen improves upon the composition of fuel gas, reduces the carbon content of fuel gas, and makes the combustion products cleaner. It can be seen that the application of hydrogen-mixed combustion in gas boilers can effectively reduce carbon emissions.

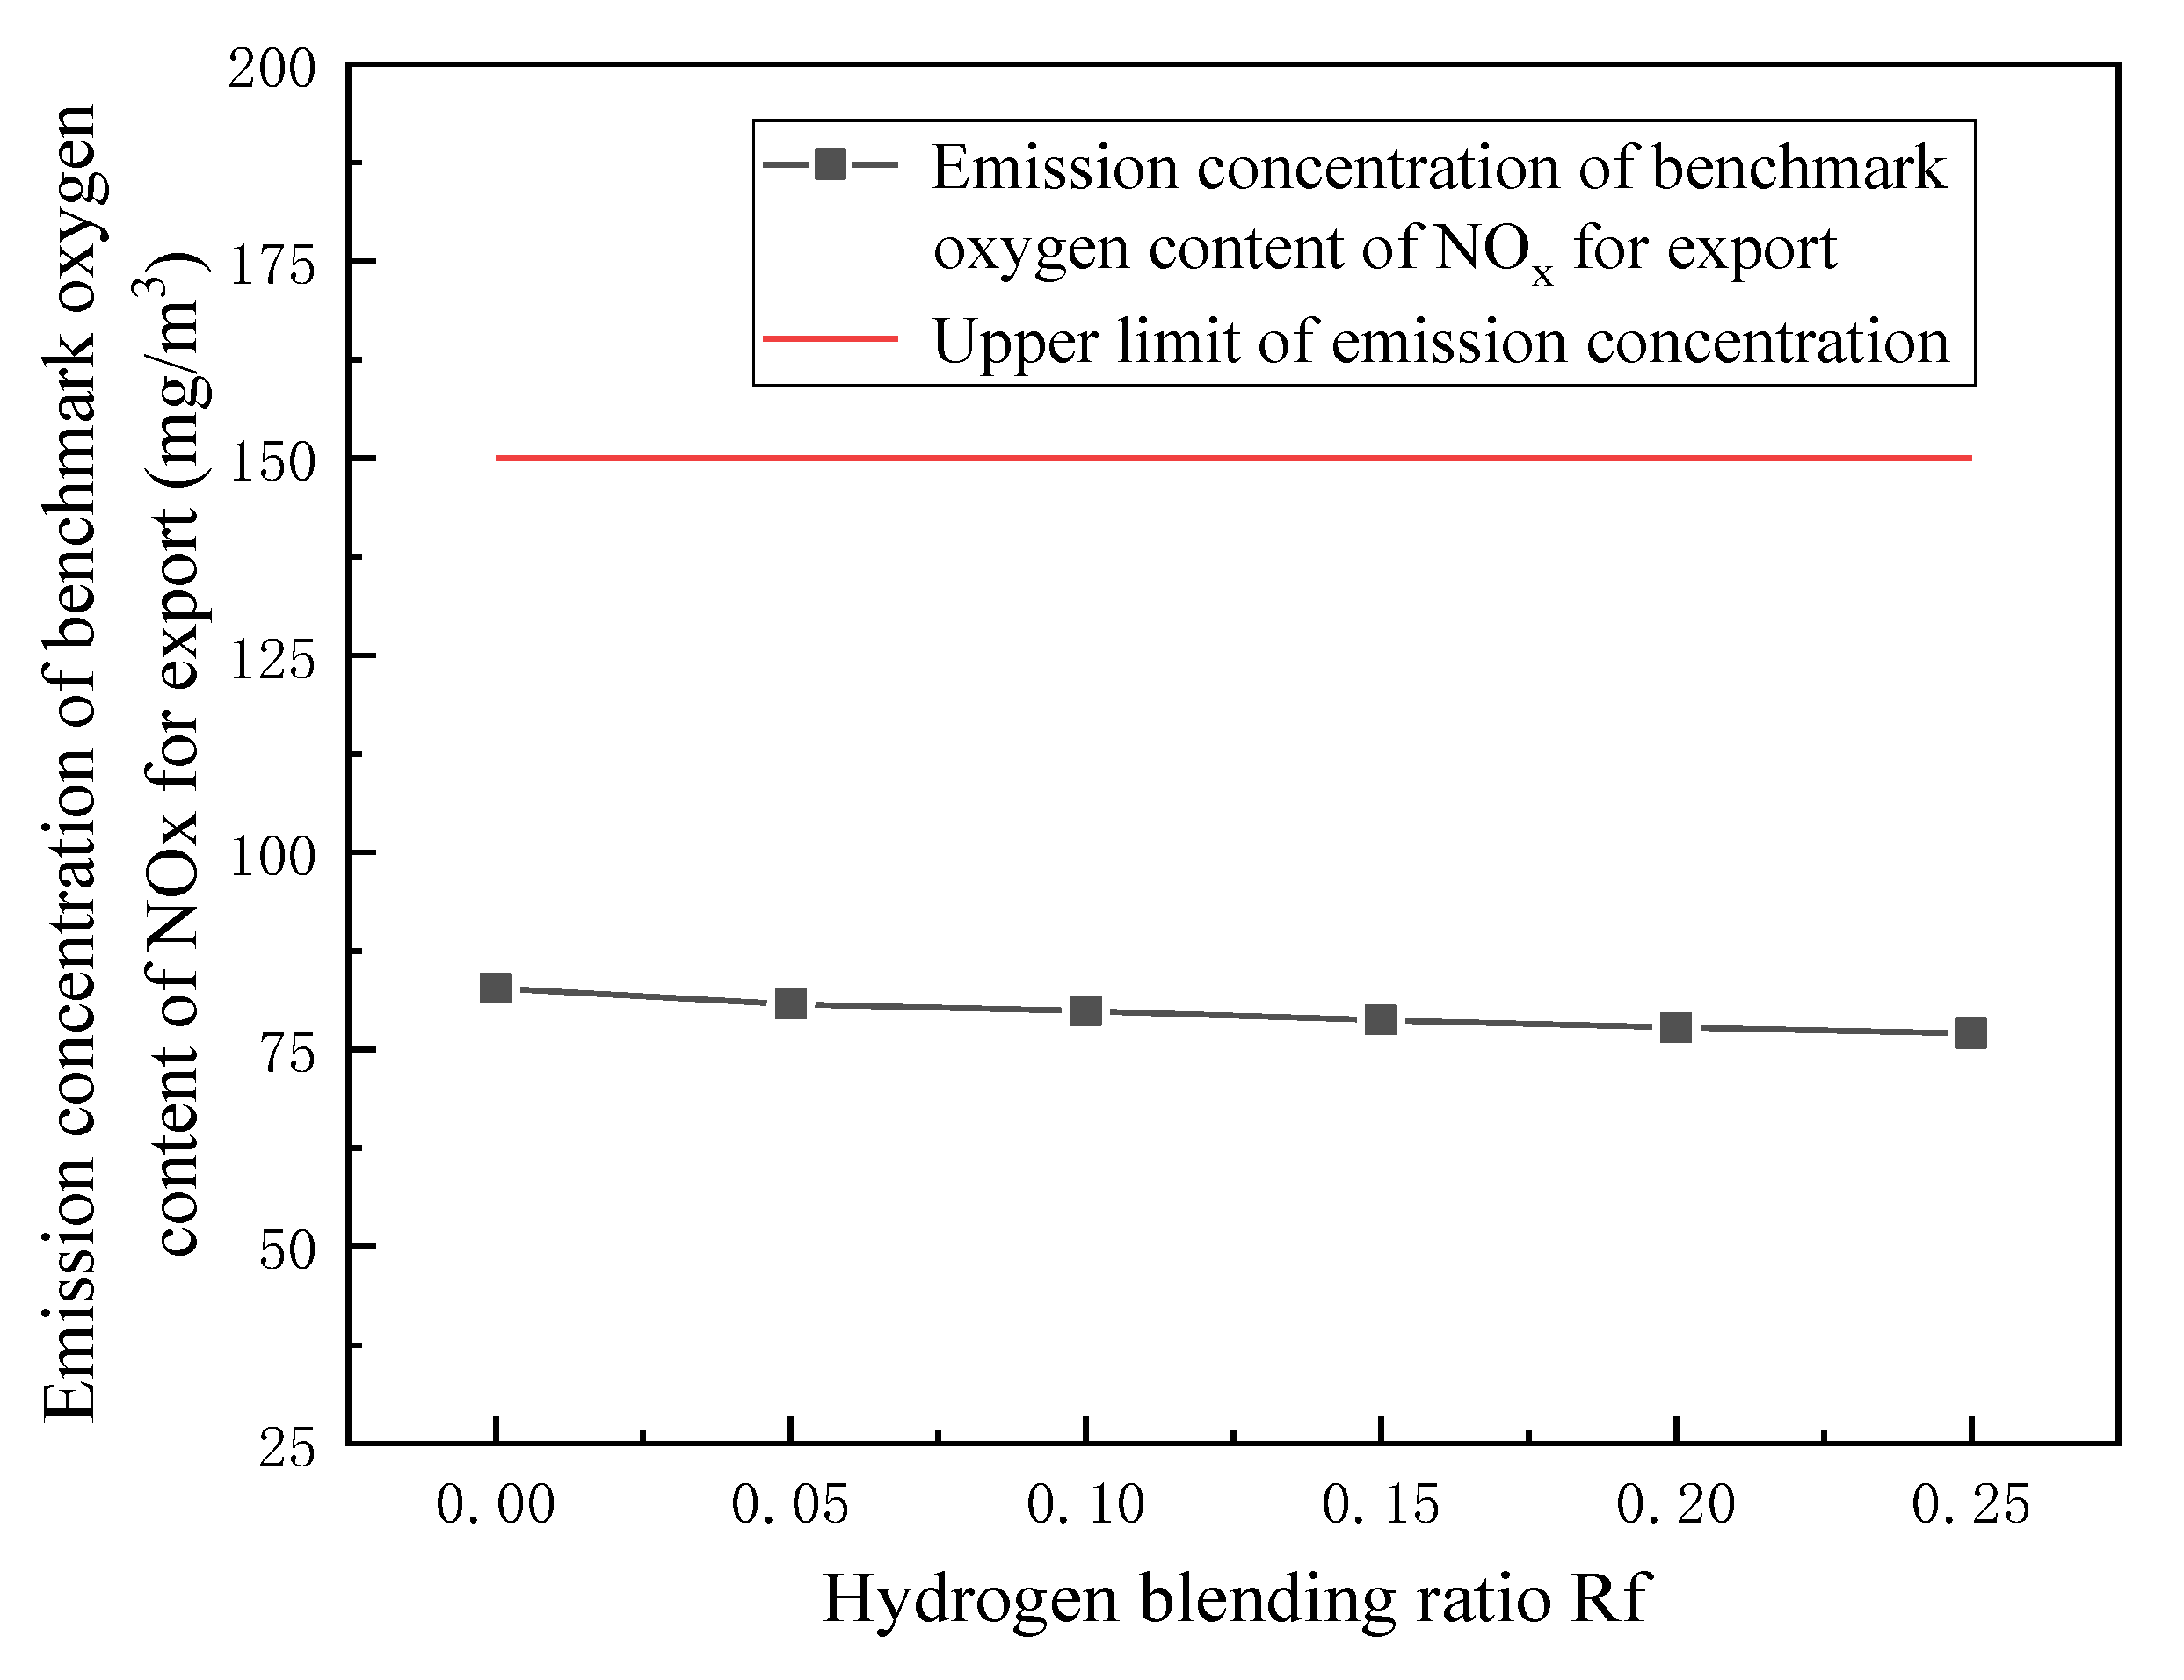
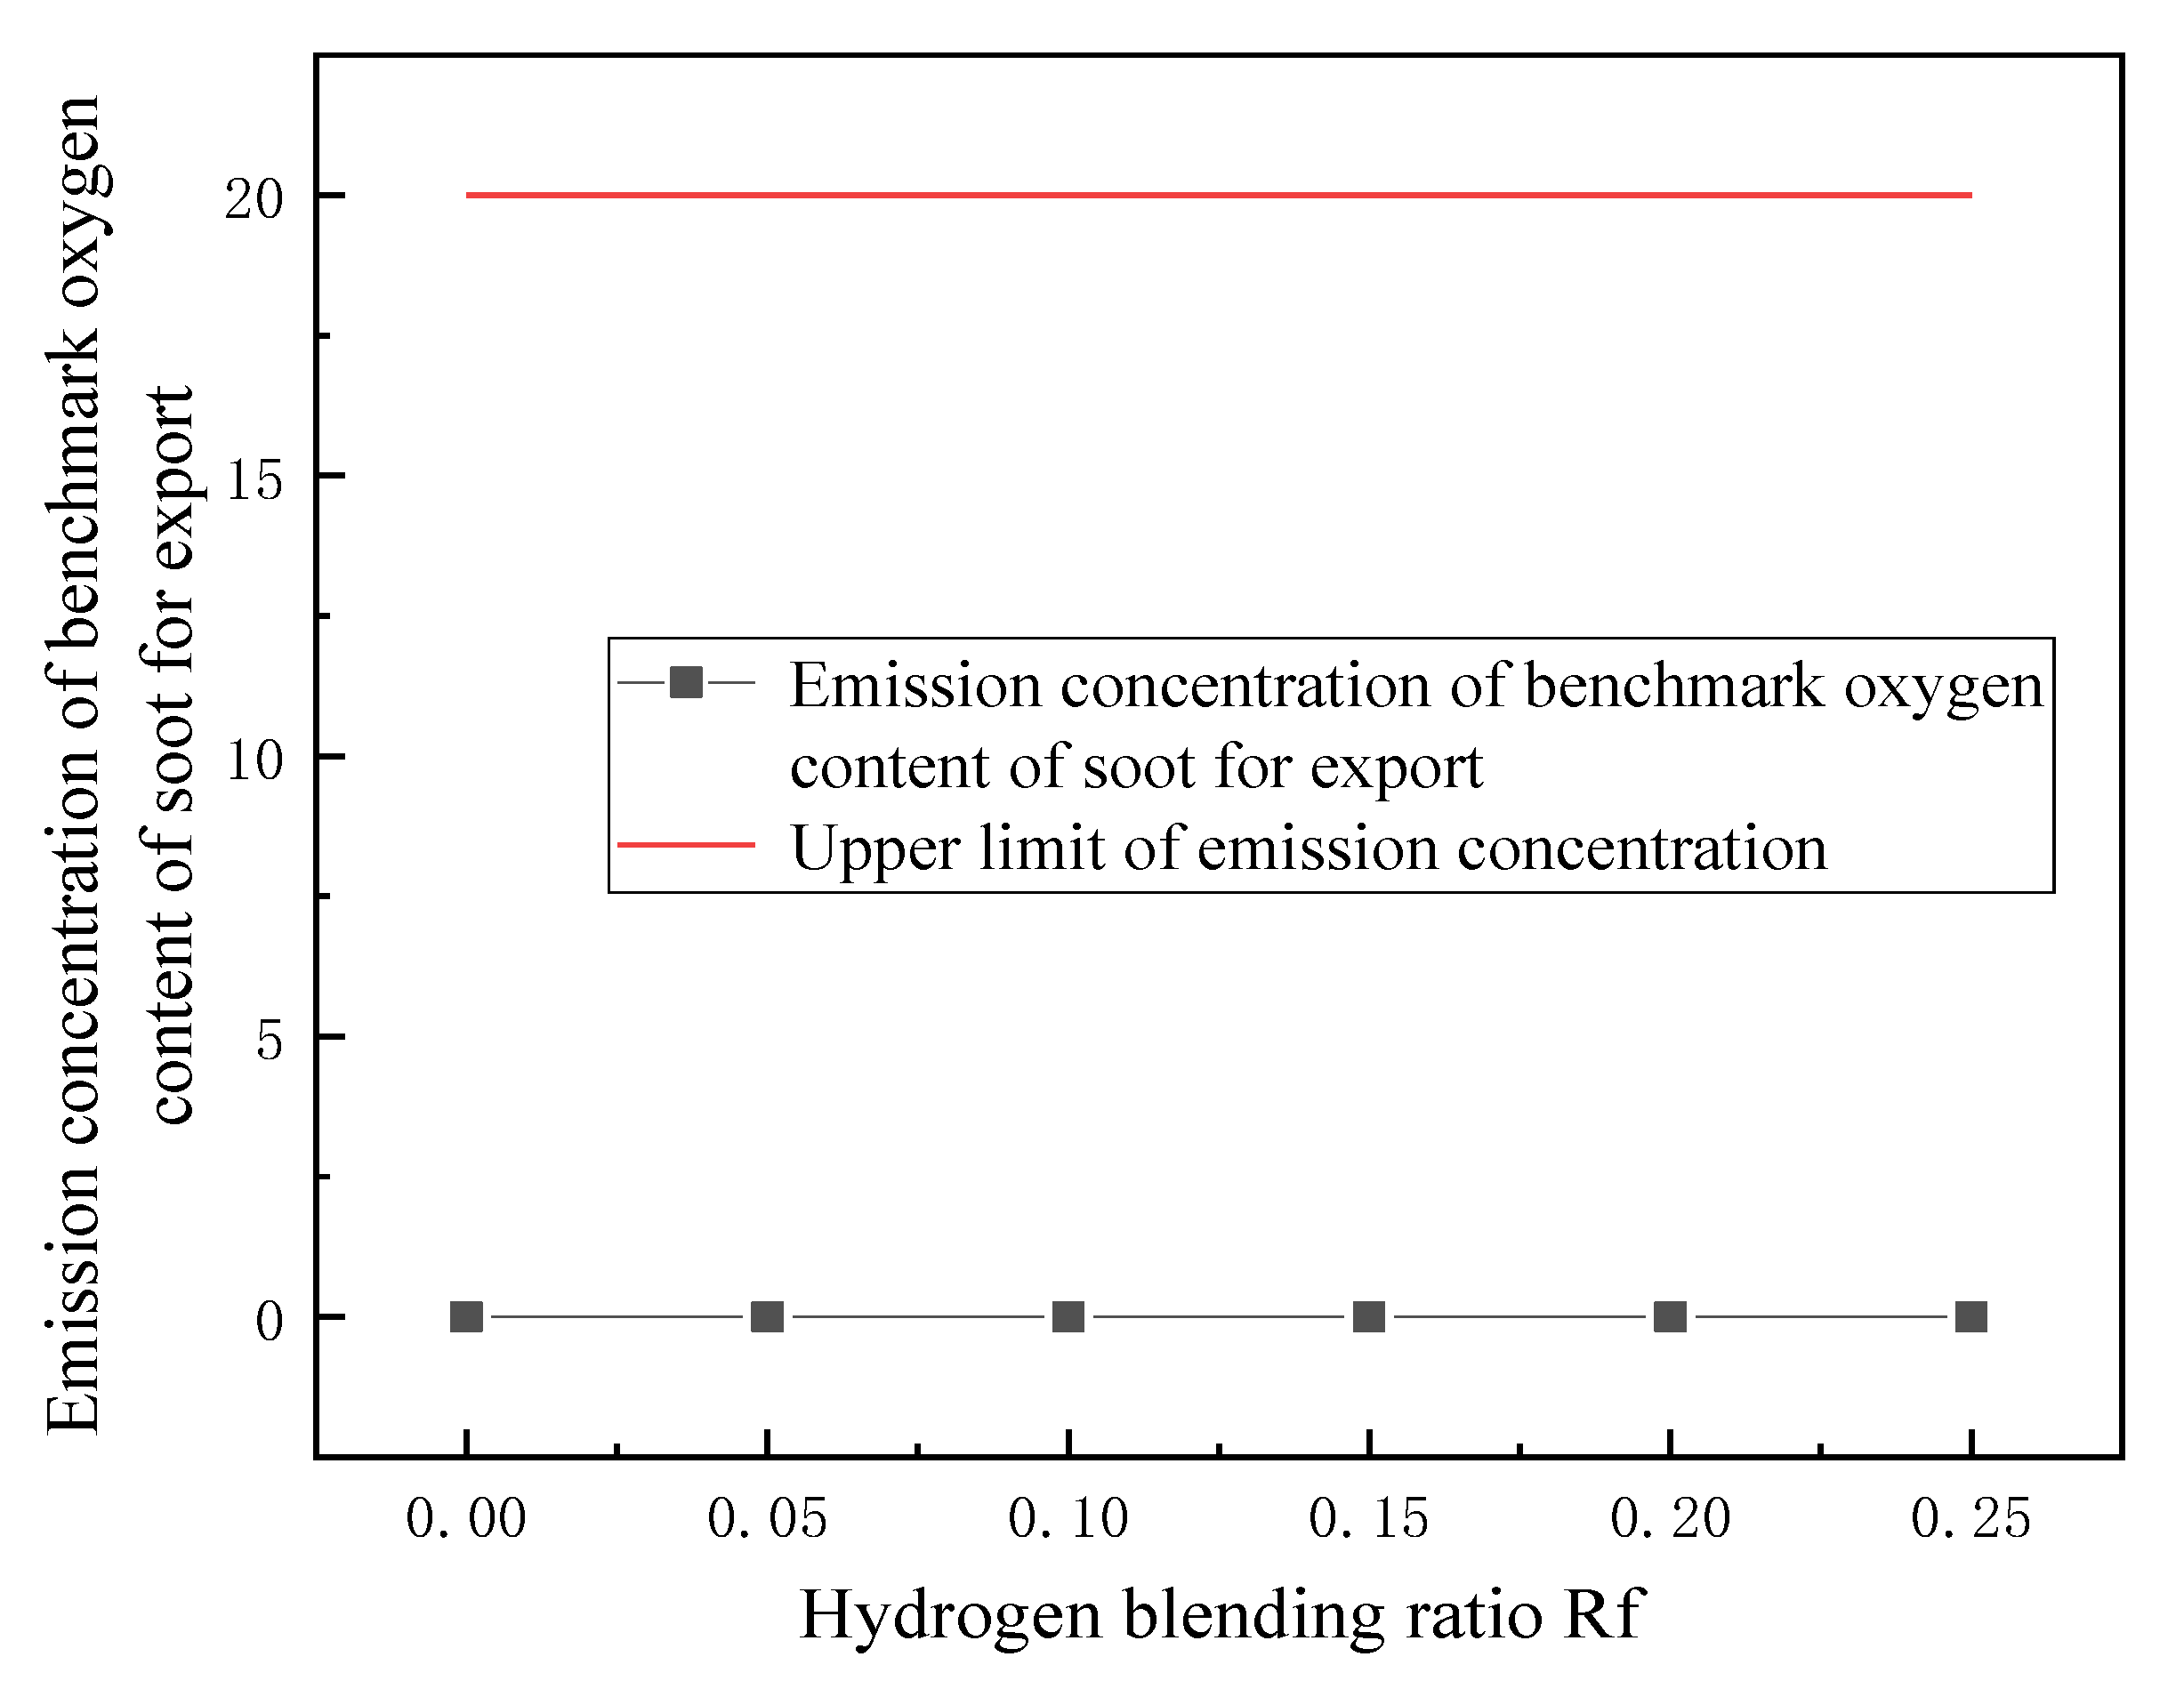
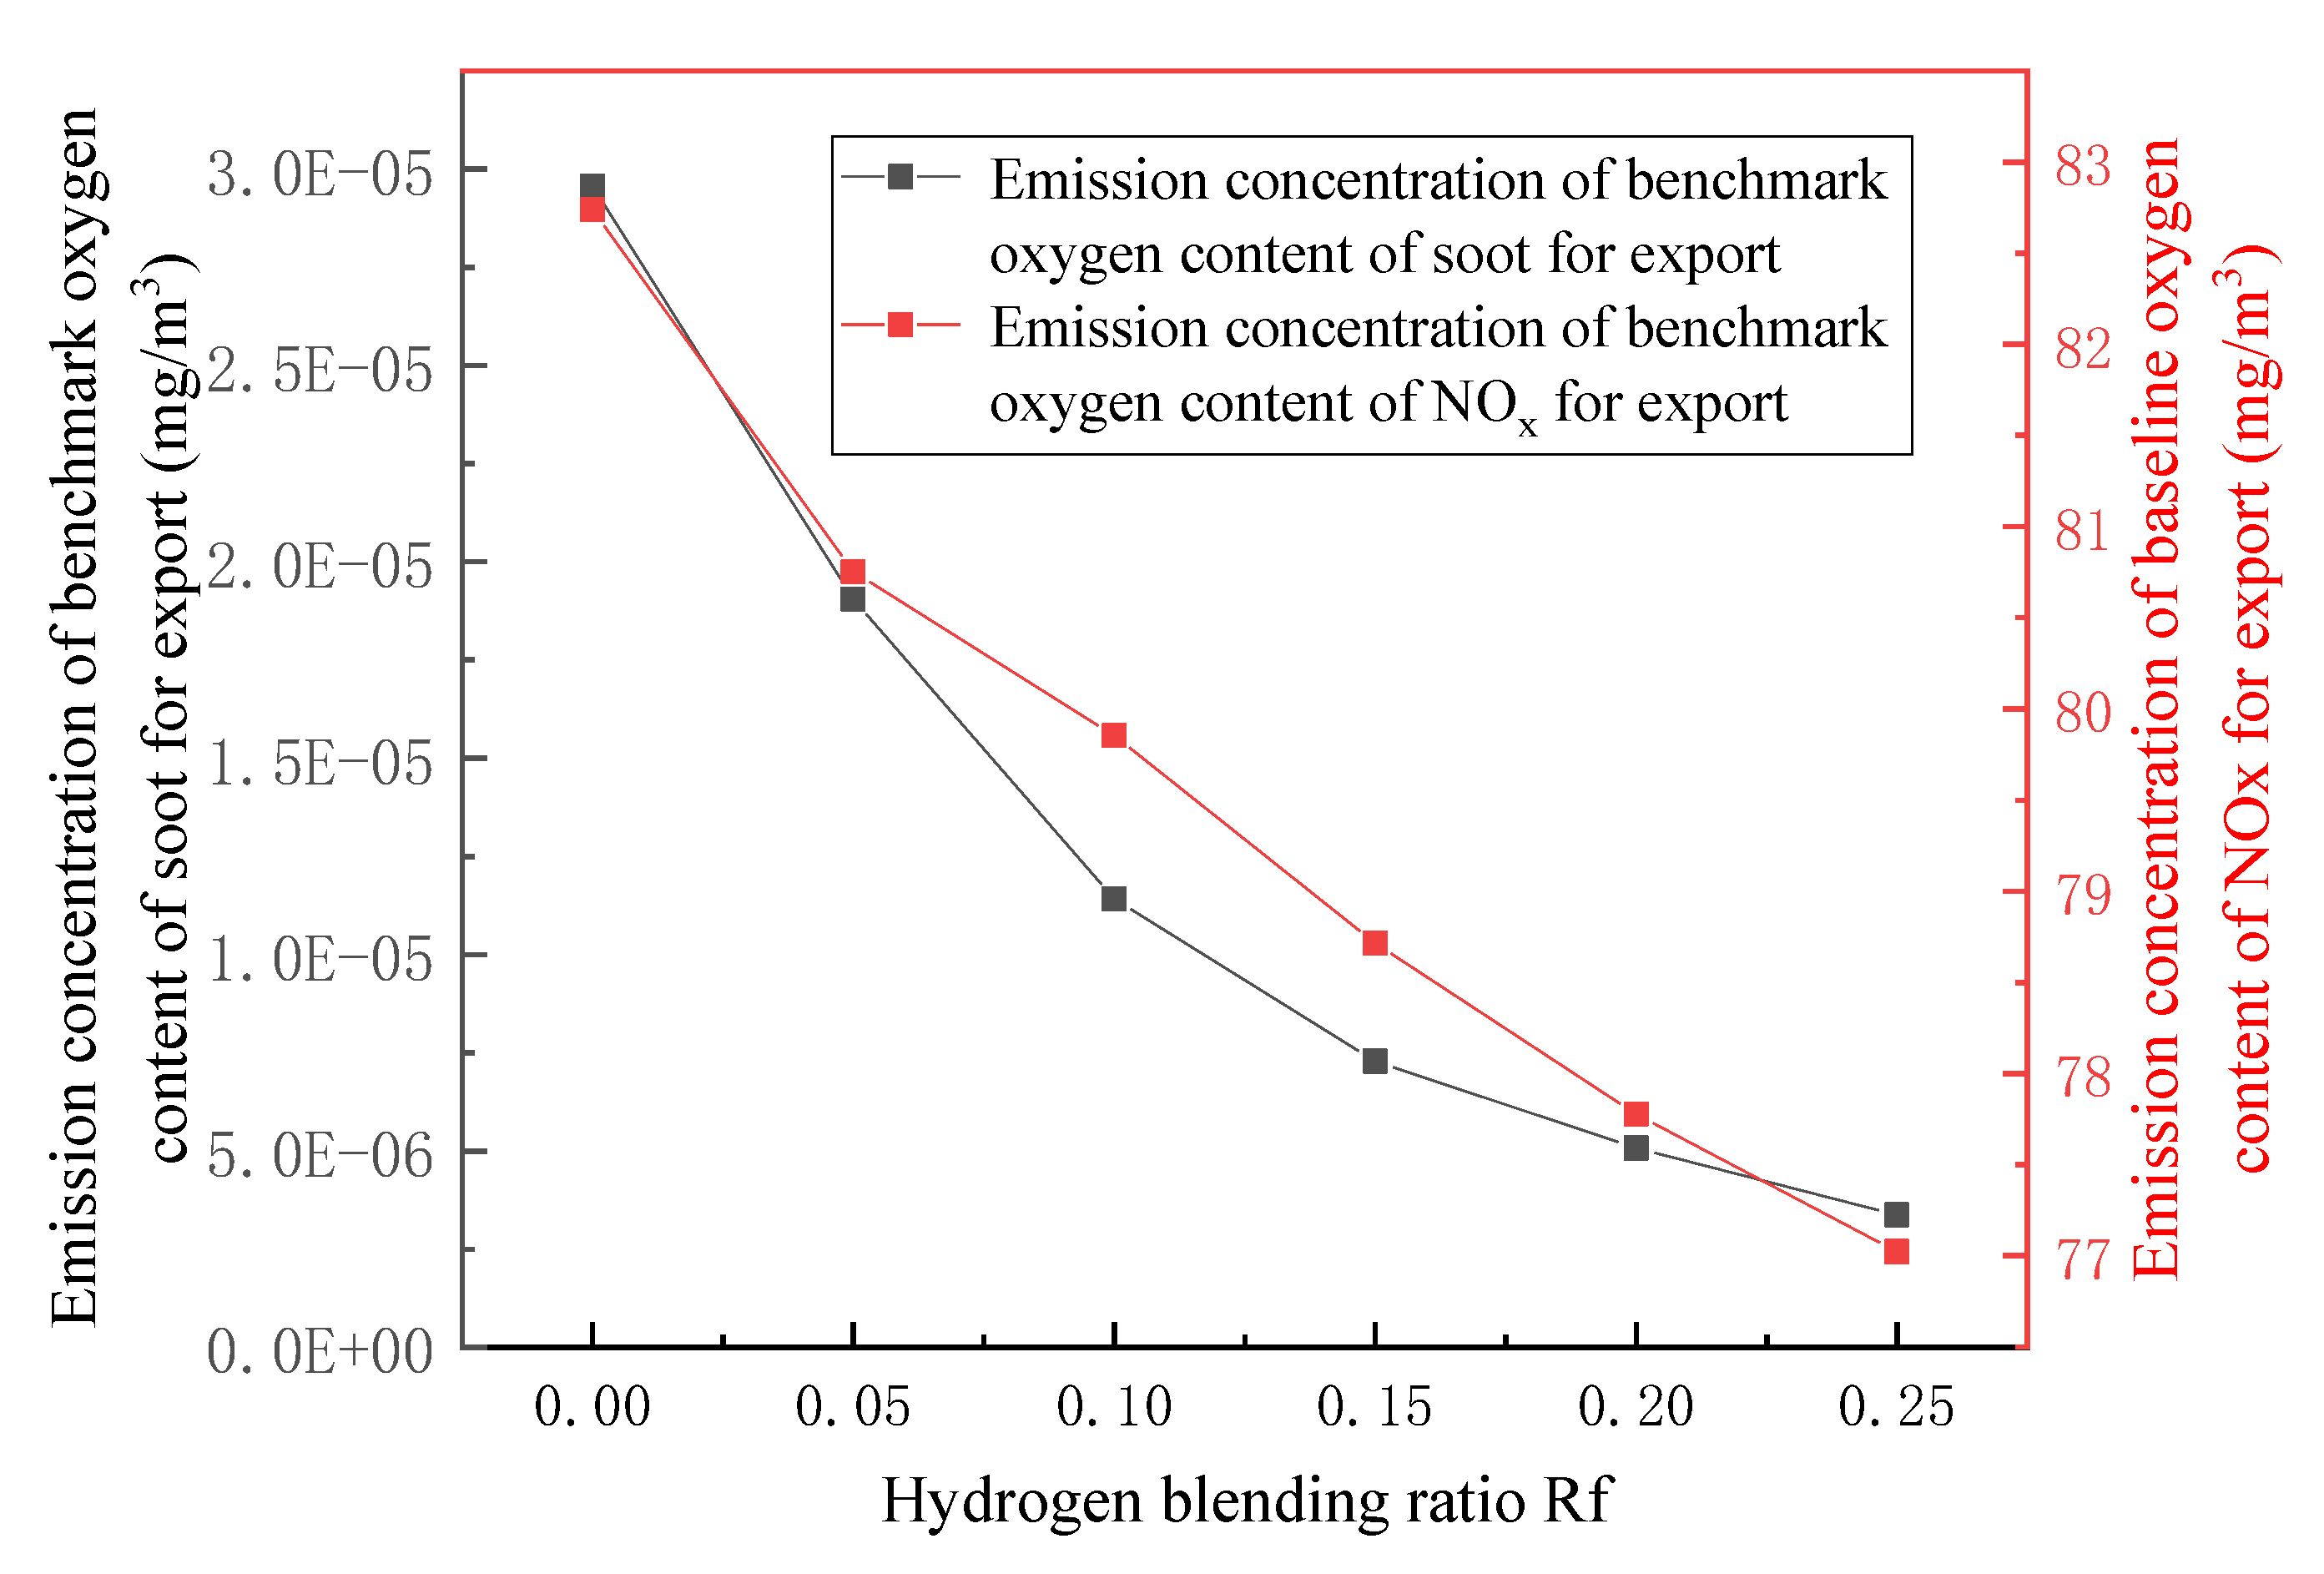
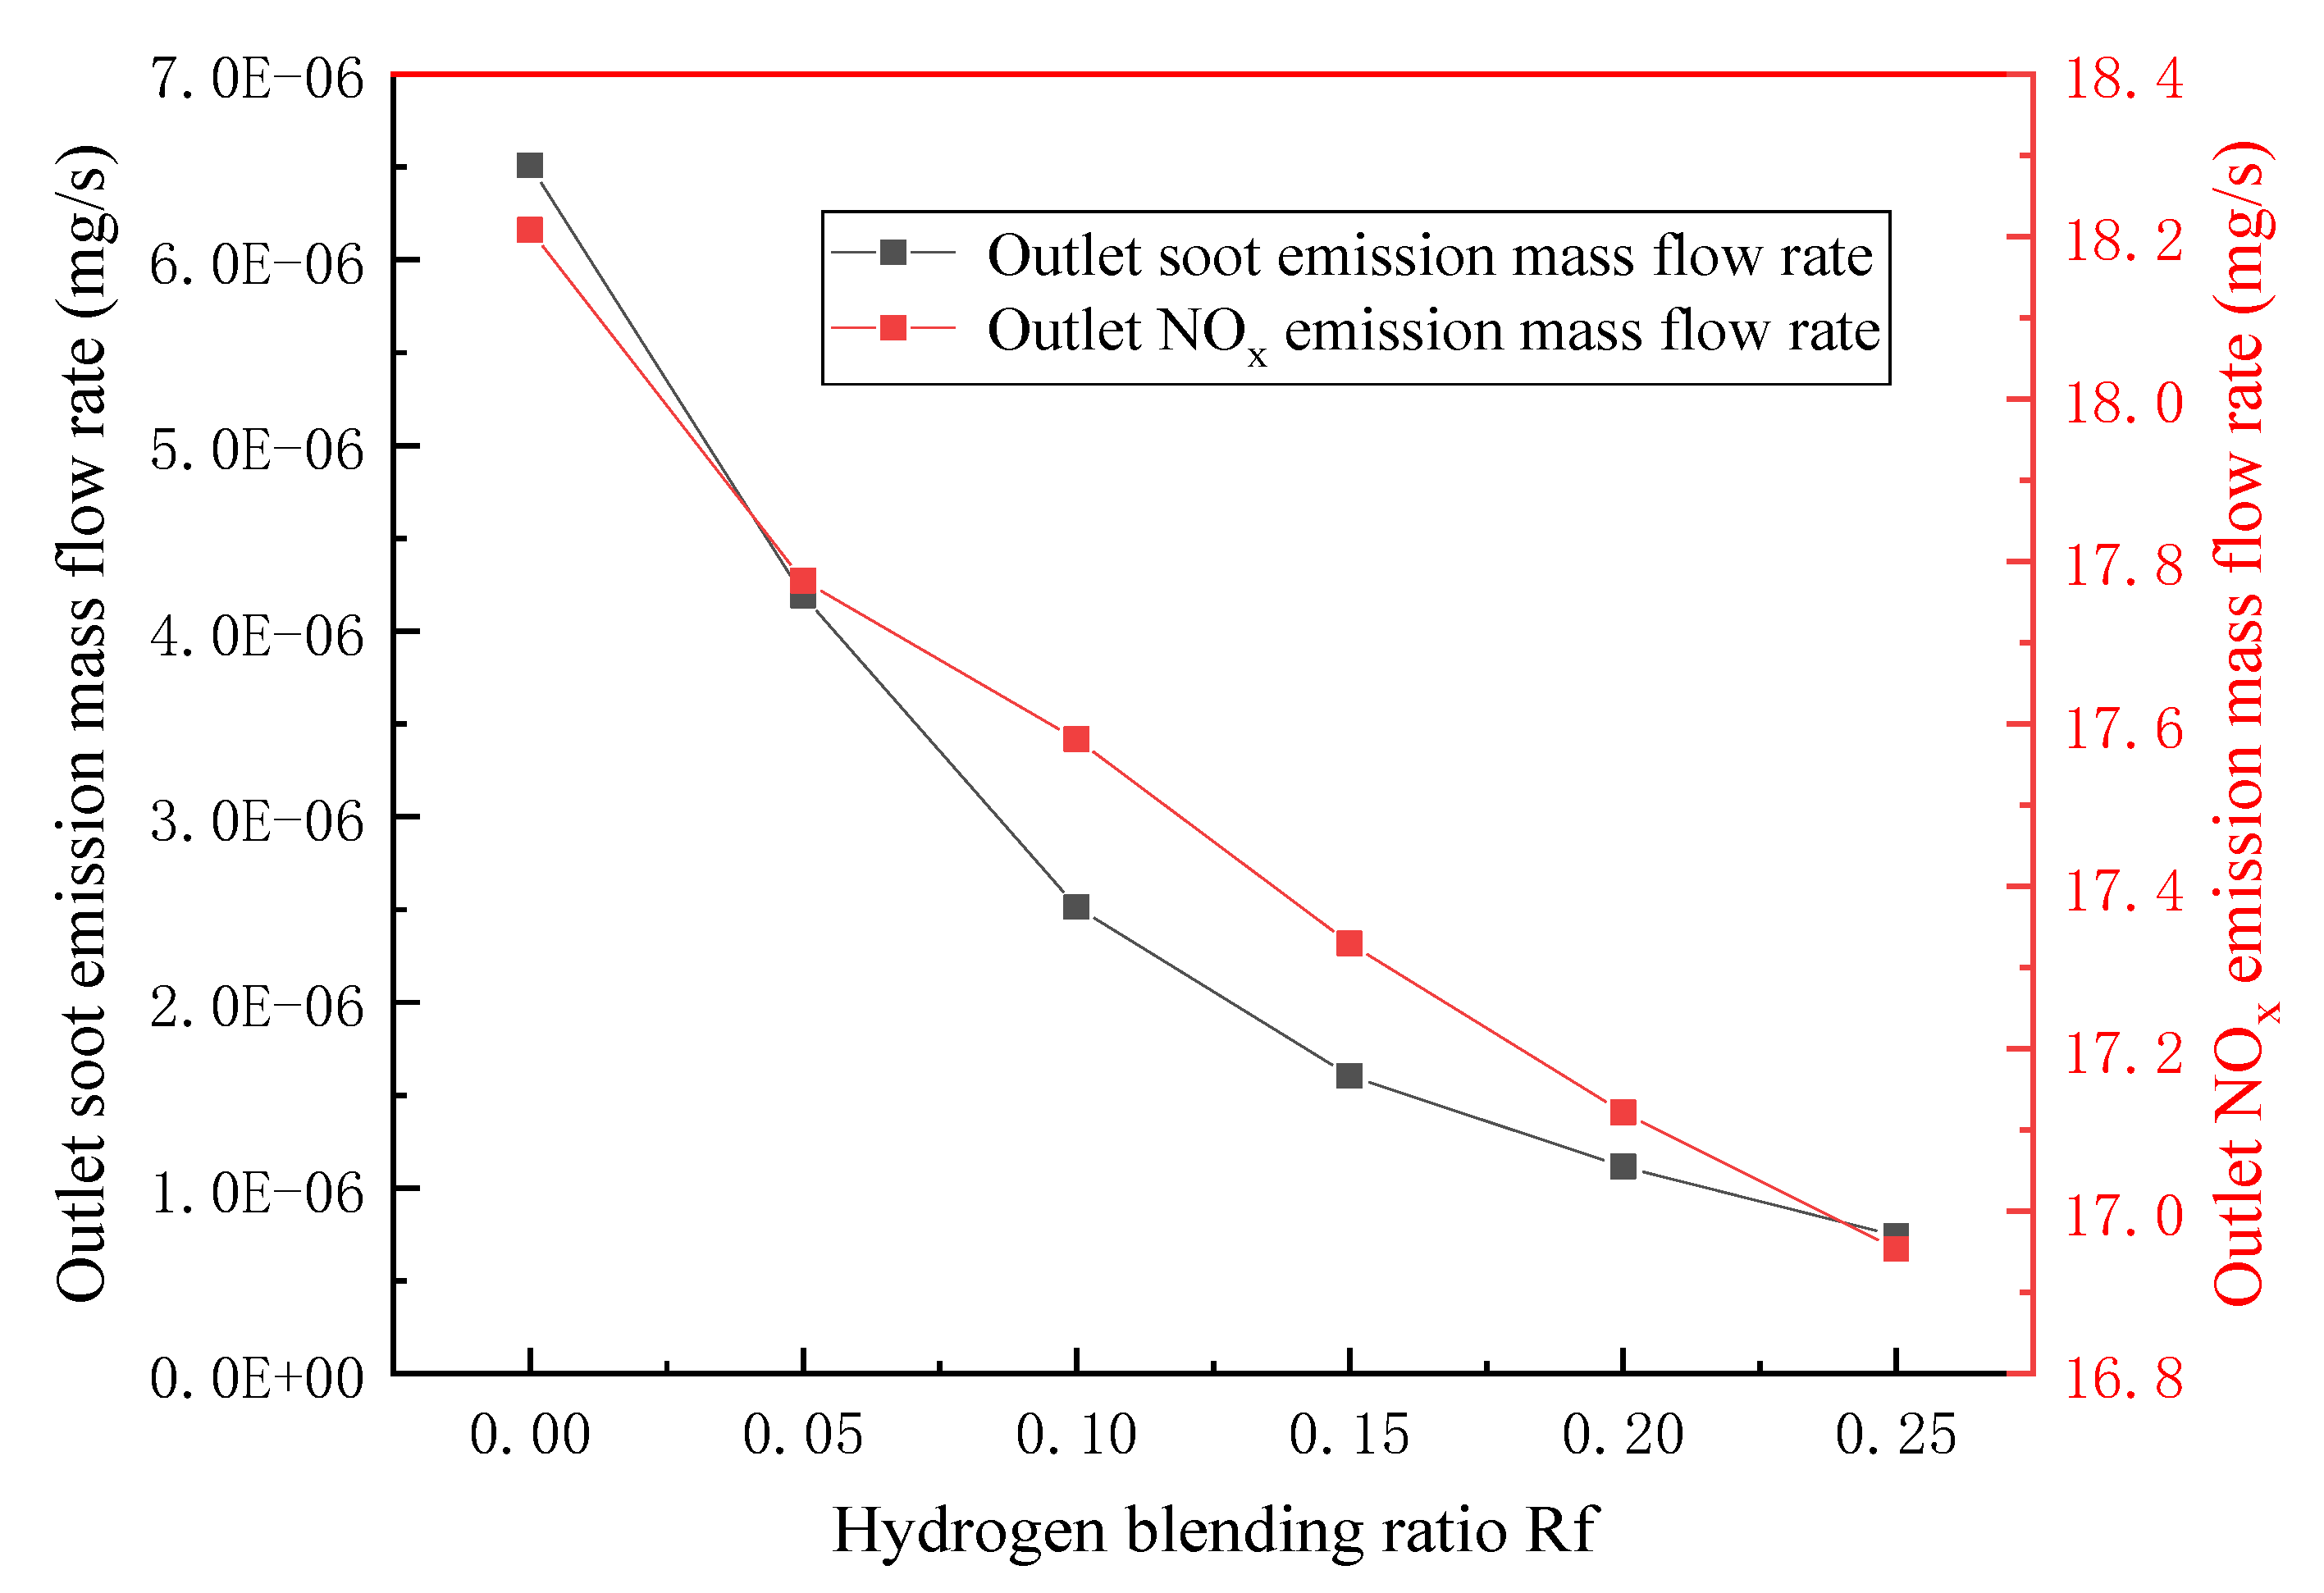
3.3. Emission Detection of Combustion Pollutants

For the detection of pollutant soot and NOx emissions, the area-weighted average method is used to measure the outlet soot and NOx emission concentration. Since the excess air factor is set to 1.1 in this simulation, the excess oxidant will dilute the emission concentration of the pollutants. Therefore, to avoid the error caused by the impact on the actual emission concentration, the conversion method of baseline oxygen content emission concentration of air pollutants (Equation (5)) is adopted to check the results.
ρ   =   ρ   ×   21 ϕ O 2 21 ϕ O 2
where ρ is the emission concentration of the standard oxygen content of pollutants, mg·m−3; ρ’ is the measured pollutant emission concentration, mg·m−3; φ is the measured oxygen content, %; and φ’ is the standard oxygen content (3.5% for gas boilers).
According to the relevant regulations of the special emission limits for boiler pollutants in key areas [13], the emission of soot particles from gas-fired boilers must not exceed 20 mg·m−3, and the emission of NOx must not exceed 150 mg·m−3. The calculation results are shown in Figure 15 and Figure 16. It can be seen from the figure that the NOx and soot are generated under the working condition that the designed hydrogen mixing ratio Rf value is 0–0.25 and meets the emission standard. Figure 17 shows in detail that the baseline oxygen emission concentration of NOx and soot are affected by the change of the hydrogen blending ratio. In addition to that, the emission concentration of the benchmark oxygen content of NOx and soot decreases with the increase in the hydrogen mixing ratio.
Since the increase in the hydrogen blending ratio affects the emission of flue gas, the change in the total pollutant emission shall also be analyzed and measured by the mass flow rate of discharged pollutants, mg·s−1, as shown in Figure 18. It can be seen from the figure that the total emission of NOx and soot decreases with the increase in the hydrogen blending ratio. The analysis of the reason can focus on the composition of soot. According to the literature [14], the specific heat capacity of water vapor is greater than that of CO2 and N2, which are the main flue gas components. Due to the influence of hydrogen blending, the generation of CO2 and N2 decreases, and the generation of H2O increases, affecting the change of specific heat capacity in the combustion area. The mass-weighted integral method is used for the entire area, as shown in Equation (3), to obtain the change of specific heat capacity at constant pressure in the combustion area under various hydrogen blending ratio conditions, as also shown in Figure 19.
ϕ c ρ c d V ρ c d V   =   i = 1 n c ϕ c i ρ c i V i i = 1 n c ρ c i V i
where φ is the universal variable, Vi is the volume infinitesimal element, and ρc is the component density. It can be seen from the figure that with the increase in hydrogen blending ratio, the average constant pressure-specific heat capacity of the combustion area increases, which will increase the heat absorbed by the flue gas. Due to the constant total heat release in the boiler combustion area, the heat used for thermal NOx and soot generation is reduced, and the generation of NOx and soot is inhibited. On the other hand, according to the research, the addition of water vapor can effectively inhibit the generation of soot [15] and reduce NOx emission [16]. Due to the increase in H2O concentration and generation in the flue gas, it will also inhibit the generation of NOx and soot.

4. Conclusions

Hydrogen energy is being promoted by the global trend of clean and low-carbon energy. Hydrogen mixed natural gas for combustion can improve combustion characteristics and reduce carbon emission, which has important engineering application value. This paper numerically researched the combustion characteristics and pollution emissions for the casing swirl burner model in natural gas boilers. The boiler heating power is kept constant at 200 kW, and six hydrogen mixing proportion working conditions are designed to explore the combustion characteristics and pollution emissions for a mixture of natural gas and hydrogen. Under a conventional air atmosphere and a constant air excess coefficient, the temperature contour, axial temperature variation curves, compositions, and emission values for combustion flue gas under various working conditions are analyzed and compared. Additionally, the variation laws of NOx and soot emission are also analyzed. The following conclusions are made:
(1)
In terms of combustion characteristics, with the increase in hydrogen ratio, the combustion temperature in the furnace increases, the peak temperature position is advanced, and the combustion rate of the gas is accelerated.
(2)
In terms of flue gas detection, with the increase in hydrogen mixing ratio, the total flue gas emission decreases together with the emission concentration and emission of CO2 and N2 in the main flue gas components, while the emission concentration and emission of H2O increase. Additionally, the concentration and emission of pollutants NOx and soot in the flue gas are also reduced. Hydrogen-doped combustion can effectively inhibit the generation of NOx and soot by increasing the specific heat capacity of flue gas and the generation of water vapor.
(3)
Based on the requirement of fuel interchangeability, the optimal hydrogen mixing volume fraction of the gas-fired boiler is 24.7%.

Author Contributions

Conceptualization, Y.X. and K.W.; methodology, K.W.; software, X.H.; formal analysis, Y.X.; investigation, Y.X.; resources, Y.Z.; data curation, F.Z.; writing—original draft preparation, F.Z.; writing—review and editing, P.T. and S.A.T.; visualization, K.W.; supervision, Y.Z.; project administration, X.H.; funding acquisition, X.H. All authors have read and agreed to the published version of the manuscript.

Funding

National Natural Science Foundation of China (51974033), the National Overseas Study Foundation of China (201708420106), the Yangtze Youth Talents Fund (No. 2015cqt01).

Institutional Review Board Statement

Not applicable.

Informed Consent Statement

Not applicable.

Data Availability Statement

Not applicable.

Acknowledgments

The authors acknowledge the financial support of the National Natural Science Foundation of China (51974033), the National Overseas Study Foundation of China (201708420106), the Yangtze Youth Talents Fund (No. 2015cqt01), the Leading Talents of Yangtze Talent Plan, and the Natural Science and Engineering Research Council of Canada.

Conflicts of Interest

The authors declare no conflict of interest.

References

  1. BP. Statistical Review of World Energy 2020; BP: London, UK, 2020. [Google Scholar]
  2. Pan, J.P.; Yang, L.L.; Wang, L.X.; Lou, Y.; Wang, S.Y. Strategy on the development of natural gas resources in China under the new situation. Int. Pet. Econ. 2017, 25, 12–18. [Google Scholar]
  3. Xin, Y.; Zhang, Y.; Xue, P.; Wang, K.; Adu, E.; Tontiwachwuthikul, P. The Optimization and Thermodynamic and Economic Estimation Analysis for CO2 Compression-liquefaction Process of CCUS System Using LNG Cold Energy. Energy 2021, 236, 121–376. [Google Scholar] [CrossRef]
  4. Melaina, M.W.; Antonia, O.; Penev, M. Blending Hydrogen into Natural Gas Pipeline Networks: A Review of Key Issues; Technical Report; National Renewable Energy Laboratory: Golden, CO, USA, 2013. [Google Scholar]
  5. Haines, M.R.; Polman, E.A.; Laat, J. Reduction of CO2 Emissions by Adding Hydrogen to Natural Gas; International Energy Agency: Apeldoorn, The Netherlands,, 2005. [Google Scholar]
  6. Hu, Z.Q.; Zhang, X. Study on laminar combustion characteristic of low calorific value gas blended with hydrogen in a constant volume combustion bomb. Int. J. Hydrogen Energy 2019, 44, 487–493. [Google Scholar] [CrossRef]
  7. Leng, Y.X.; Ge, Q.Q.; He, Z.X.; He, D.Z.; Long, W.Q. Numerical study on the combustion and emission characteristics of a pre-chamber engine fueled with hydrogen enriched compressed natural gas. Trans. Csice 2021, 39, 26–33. [Google Scholar]
  8. Zhao, R.; Xu, L.P.; Feng, S.Q.; Li, C.X.; Yao, L.; Hu, S.P.; Wang, Z.C. Effects of hydrogen addition in fuel of marine LNG fueled engines on combustion and emissions. J. Propuls. Technol. 2020, 41, 2549–2557. [Google Scholar]
  9. Wang, J.H.; Huang, Z.H.; Mao, H.Y. Kinetic simulation of CH4-H2-O2-Ar laminar premixed flame chemical reaction. In Proceedings of the 2008 Combustion Academic Conference of Chinese Society of Engineering Thermophysics, Xi’an, China, 25 October 2008. [Google Scholar]
  10. Wei, J. Study on the Combustion Mechanism and Characteristics of Light Hydrocarbon Mixed Gas [D]; Xi’an Shiyou University: Xi’an, China, 2019. [Google Scholar]
  11. Standardization Administration of the People’s Republic of China. Classification and Basic Characteristics of Urban Gas: GB-T13611-2018; China Quality and Standards Press: Beijing, China, 2018; p. 3. [Google Scholar]
  12. Ren, J.H. The Study of Numerical Simulation of Combustion and Heat Transfer in the WNS Gas-Fired Boiler; Beijing Institute of Petrochemical Technology: Beijing, China, 2015; p. 17. [Google Scholar]
  13. General Administration of Quality Supervision. Inspection and Quarantine. Emission Standard of Air Pollutants for Coal-Burning Oil-Burning Gas-Fired Boiler: GB 13271-2014; China Environmental Science Press: Beijing, China, 2014; Volume 3. [Google Scholar]
  14. Liu, G.Q.; Ma, L.X.; Liu, J. Chemical and Chemical Engineering Physical Property Data Manual, Inorganic Volume; Chemical Industry Press: Beijing, China, 2002; pp. 112–119. [Google Scholar]
  15. Zhu, Q.H.; Niu, Y.; Chen, X.F. Impact of water vapor on the soot formation in the laminar methane/air diffusion flame. J. Saf. Environ. 2017, 17, 174–177. [Google Scholar]
  16. Le Cong, T.; Dagaut, P. Experimental and detailed modeling study of the effect of water vapor on the kinetics of combustion of hydrogen and natural gas, impact on NOx. Energy Fuel 2009, 23, 725–734. [Google Scholar] [CrossRef]
Figure 1. Diagram profile of simplified model of casing swirl burner.
Energies 14 06883 g001
Figure 2. Gridding graph.
Energies 14 06883 g002
Figure 3. Details of the grid at the nozzle.
Energies 14 06883 g003
Figure 4. Comparison of axial mole fraction distribution of CO2.
Energies 14 06883 g004
Figure 5. Calculation of high Wobbe index of mixture.
Energies 14 06883 g005
Figure 6. Calculation of high calorific value of mixture.
Energies 14 06883 g006
Figure 7. Calculation of yellow flame coefficient of mixture.
Energies 14 06883 g007
Figure 8. Combustion temperature nephogram of three hydrogen mixing ratio conditions.
Energies 14 06883 g008
Figure 9. Temperature nephogram of high-temperature region under three hydrogen mixing ratio conditions.
Energies 14 06883 g009
Figure 10. Axial temperature distribution.
Energies 14 06883 g010
Figure 11. Discharge flow of outlet flue gas.
Energies 14 06883 g011
Figure 12. Emission concentration and discharge flow of CO2 at outlet.
Energies 14 06883 g012
Figure 13. Emission concentration and discharge flow of H2O at outlet.
Energies 14 06883 g013
Figure 14. Emission concentration and discharge flow of N2 at outlet.
Energies 14 06883 g014
Figure 15. Emission concentration and limit standard of oxygen content of NOx for export.
Energies 14 06883 g015
Figure 16. Emission concentration and limit standard of oxygen content of soot for export.
Energies 14 06883 g016
Figure 17. Variation of benchmark oxygen emission concentration of NOx and soot.
Energies 14 06883 g017
Figure 18. Changes of total emissions of NOx and soot.
Energies 14 06883 g018
Figure 19. Average specific heat capacity at constant pressure in the combustion zone.
Energies 14 06883 g019
Table 1. Boundary conditions.
NameTypeTemperature/KTurbulent Intensity/%Hydraulic Diameter/m
Fuel inletVelocity inlet300100.016
Air inletVelocity inlet300100.012
OutletPressure outlet30050.5
WallWall300
Table 2. Calculation working condition.
Hydrogen Blending Ratio (Rf)FuelOxidizer
ComponentFlow Rate (m/s)ComponentFlow Rate (m/s)
0100% natural gas0% H231.87Air atmosphere151.07
0.0595% natural gas5% H233.04150.69
0.190% natural gas10% H234.29150.28
0.1585% natural gas15% H235.65149.83
0.280% natural gas20% H237.11149.35
0.2575% natural gas25% H238.70148.83
Publisher’s Note: MDPI stays neutral with regard to jurisdictional claims in published maps and institutional affiliations.

