Article

Effect of Localized Temperature Difference on Hydrogen Fermentation

1
Department of Smart-City Engineering, Inha University, 100 Inharo, Michuhol-gu, Incheon 22212, Korea
2
Department of Environmental Health, Daejeon Health Institute of Technology, 21 Chungjeong-ro, Dong-gu, Daejeon 34504, Korea
3
Department of Civil and Environmental Engineering, Kongju National University, Cheonan, Chungnam 31080, Korea
*
Author to whom correspondence should be addressed.
Energies 2021, 14(21), 6885; https://doi.org/10.3390/en14216885
Submission received: 21 September 2021 / Revised: 10 October 2021 / Accepted: 19 October 2021 / Published: 20 October 2021
(This article belongs to the Special Issue Sustainable Management of Waste for Renewable Energy Resources)

Abstract

:
In a lab-scale bioreactor system, (20 L of effective volume in our study) controlling a constant temperature inside bioreactor with a total volume 25 L is a simple process, whereas it is a complicated process in the actual full-scale system. There might exist a localized temperature difference inside the reactor, affecting bioenergy yield. In the present work, the temperature at the middle layer of bioreactor was controlled at 35 °C, while the temperature at top and bottom of bioreactor was controlled at 35 ± 0.1, ±1.5, ±3.0, and ±5.0 °C. The H2 yield of 1.50 mol H2/mol hexoseadded was achieved at ±0.1 and ±1.5 °C, while it dropped to 1.27 and 0.98 mol H2/mol hexoseadded at ±3.0 and ±5.0 °C, respectively, with an increased lactate production. Then, the reactor with automatic agitation speed control was operated. The agitation speed was 10 rpm (for 22 h) under small temperature difference (<±1.5 °C), while it increased to 100 rpm (for 2 h) when the temperature difference between top and bottom of reactor became larger than ±1.5 °C. Such an operation strategy helped to save 28% of energy requirement for agitation while producing a similar amount of H2. This work contributes to facilitating the upscaling of the dark fermentation process, where appropriate agitation speed can be controlled based on the temperature difference inside the reactor.

Graphical Abstract

1. Introduction

The development of hydrogen (H2) production technology has gained significant attention due to its high energy content (142 kJ/g) and its cleaner nature on combustion [1,2,3]. At present, the commercial production of H2 is achieved via coal gasification, gas reforming, etc., which are not sustainable and environmentally benign due to the depletion of the fossil fuels and the generation of greenhouse gaseous emissions [4,5]. On the other hand, water splitting technology and biologically mediated ways could provide a sustainable way of producing H2 [6,7]. Among various bio-H2 production routes, the production of green hydrogen by use of organic wastes as feedstock has a huge potential to become an important source of hydrogen in the future if operating under ambient temperature and pressure conditions. Dark fermentative H2 production (in short “dark fermentation”), in particular, is considered an environmentally friendly and practically suitable process for commercial bio-H2 production, due to its high production rate, simple operation, and handling of various organic wastes [8,9,10,11,12].
There are various factors, such as pH, temperature, substrate types and lactic acid contamination can affect the H2 fermentation performance [13,14,15,16]. Among them, temperature is a critical operational factor, since it influences the microbial growth, enzymatic activity, and population dynamics [17,18]. H2 production in the dark fermentation process is conducted with various temperature regimes from mesophilic to hyper-thermophilic conditions. It has been reported that keeping a constant temperature in an appropriate range of 35–40 °C is important in mesophilic H2 fermentation, whereas fluctuations in temperature beyond the optimal range negatively affected the performance [18]. The detailed heterogenous temperature profile was not reported, but it can reach up to 2–5 °C in the full-scale anaerobic digester [19].
The agitation intensity is reported to enhance the bioenergy yield by providing a sufficient environment for the nutrient transfer to the microorganisms, heat transfer, and release of the produced biogas from the digestate mixture [20]. However, the energy consumption for the agitation intensity is reported to be up to 50% of the overall energy input of the wastewater treatment process [21]. The application of intermittent and short mixing strategy was considered as an alternative option over continuous stirring to cut down the energy cost and even to improve the biogas yield [22]. Although several strategies were employed previously to study the impact of mixing in the wastewater treatment process, there is no rule of thumb regarding the agitation or recycling intensity required for stable reactor operation. Besides, the temperature variations inside the bioreactor (top, middle, and bottom) layer are a crucial factor to be considered for applying the agitation intensity for better mixing and reducing the energy input of the wastewater treatment process. Moreover, the information about the agitation intensity on dark fermentation was rarely reported [23]. To the author’s knowledge, the effects of localized temperature differences inside the bioreactor on H2 production have never been reported.
Based on the above, the aim of this study was to investigate the effect of localized temperature difference (±1.5 to ±5 °C) inside the reactor on dark fermentation. The temperature difference was generated by using water jackets to maintain a different temperature continuously, as shown in the schematic diagram (Figure 1). Furthermore, flux balance analysis (FBA) was employed to understand the mechanism for enhancement. The energy demand for agitation was also assessed using the operational strategy of stirring speed control responding to the temperature gap.

2. Materials and Methods

2.1. Inoculum and Substrate

The inoculum for H2 fermentation was collected from an anaerobic digester in a local wastewater treatment plant in Korea. The pH, and volatile suspended solids (VSS) concentration of the sludge were 7.5, and 25.0 g/L, respectively. The sludge was filtered through a 2.0 mm sieve to remove large particles, and then heat-treated at 90 °C for 20 min to inactive methanogenic activity [24]. Glucose was used as a substrate and the concentration was adjusted to 10 g chemical oxygen demand (COD)/L. Nutrients were supplied according to COD:N:P:Fe ratio of 100:5:1:0.33 by using NH4Cl, KH2PO4, FeCl2·4H2O. To minimize the effects of trace metal deficiency, various trace metals were added as follows (in mg·L−1): Na2MoO4 4H2O, 5; H3BO3, 50, MnCl2 4H2O, 50; ZnCl2, 50; CuCl2, 30; NiCl2 6H2O, 92; CoCl2 6H2O, 50; Na2SeO3, 50) [25].

2.2. Experiment

Batch experiments were conducted using a completely stirred tank reactor with a working volume of 20 L (200 mm ID), controlled at 35 ± 0.1 °C (Figure 1). The heat-treated sludge was inoculated in the reactor at a VSS concentration of 10.0 g/L. After seeding with media and substrate addition, the reactor was purged by N2 gas (99.99%) for 10 min to establish an anaerobic condition. The pH inside the reactor was controlled at 6.0 ± 0.1 using a pH sensor (APH-200VD, South Korea), pH controller (samsnK.com-96pH(ORP)-L4, South Korea). The temperature was measured by temperature sensor (TC-V, range (−)50–300 °C, accuracy ±3%, South Korea) and maintained by a water bath circulator equipped with built-in water jacket. Experiments were conducted to investigate the effects of localized temperature difference in a stirred tank reactor on dark fermentation: control (35 ± 0.1 °C), E1 (35 ± 1.5 °C), E2 (35 ± 3.0 °C), E3 (35 ± 5.0 °C). The temperature variation was generated by using water jackets (CW10G) filled with cool and hot water at certain degrees to maintain a different temperature. For example, in the case of E3, the temperature of the bottom part of the reactor was adjusted to 30 °C, the middle part was 35 °C, and the top part was 40 °C, by circulating cool water (10 °C) at the bottom, and hot water (42 °C) at the top at the pumping rate of 10 L/min. In addition, the E4 experiment was performed to compare the energy required for agitation speed. The agitation speed was 10 rpm under small temperature difference (<±1.5 °C) (for 22 h), while it was increased to 100 rpm (for 2 h) when the temperature gap between top and bottom of reactor became larger than ±1.5 °C. When the temperature cross over was more than 36.5 °C, the sensor activates stirring to 100 rpm. To rotate the broth, a 6 W AC induction speed control motor (Brand: SPG Motor, Model: S6I06GB-V12) was used. The power consumption was measured using a digital power meter. At the end of the experiment, samples were taken from the top, middle, and bottom of the reactor to analyze carbohydrates and organic acids.

2.3. Analysis

The concentrations of VSS and COD were measured according to Standard Methods [26]. We settled the sludge for 1 day, and then after pretreatment, such as heating evaporates most of the water present in the sludge. The glucose concentration was measured by the colorimetric method, as previously described [27]. The amount of produced biogas from the reactor was determined by water displacement method and was adjusted to the standard conditions of temperature (0 °C) and pressure (760 mmHg) (STP). The H2 and CO2 content in the biogas was measured by gas chromatography (GC, Gow Mac series 580) equipped with a thermal conductivity detector (TCD) using mole-sieve 5A and porapack Q (80/100 mesh) as a separation column. N2 gas (99.99%) was used as a carrier gas with a flow rate of 30 mL/min and the temperatures of injector, detector, and column were kept at 70, 50, and 80 °C, respectively.
Liquid samples obtained from the reactor were diluted 10 times with distilled water and filtered through 0.2 um pore size syringe filter to analyze soluble carbohydrate, and organic acids. Organic acids such as lactate, formate, acetate, propionate, and butyrate were analyzed by a high-performance liquid chromatograph (HPLC) (LC-20A series, SHIMADZU Co.) with an ultraviolet (215 nm) detector (UV1000, SHIMADZU) and an Aminex fast acid analysis column (HPX-87H, Bio-Rad Lab.). The mobile phase was 0.005 M H2SO4 applied at a 0.6 mL/min flow rate and the temperatures of detector, oven, and column were 40, 35, and 90 °C, respectively. The flux balance analysis (FBA) model, previously developed by Chaganti et al. [28], was applied for experimental data analysis. The steps we followed for FBA, and the utilized abbreviations were the same as those stated in previous studies [28,29]. The goal of applying FBA was to investigate whether the reutilization of H2 for acetate production, i.e., acetogenic H2 consumption, varies among batches or not. FBA basically considers that acetate can be produced from two possible reactions, i.e., (i) acetyl coA, and (ii) H2 reaction with CO2. For FBA calculation, a (30 × 30) matrix was used. The numbers of intracellular, and extracellular reactions were 14, and 16, respectively. For solving the metabolic network linear equations, MetaFluxNet software (Version 1.8.6.2) was adopted. Further details regarding FBA can be found in previous studies [28,29]. The Pearson correlation coefficient was calculated to measure linear correlation between organic acid and H2 production.

3. Results and Discussion

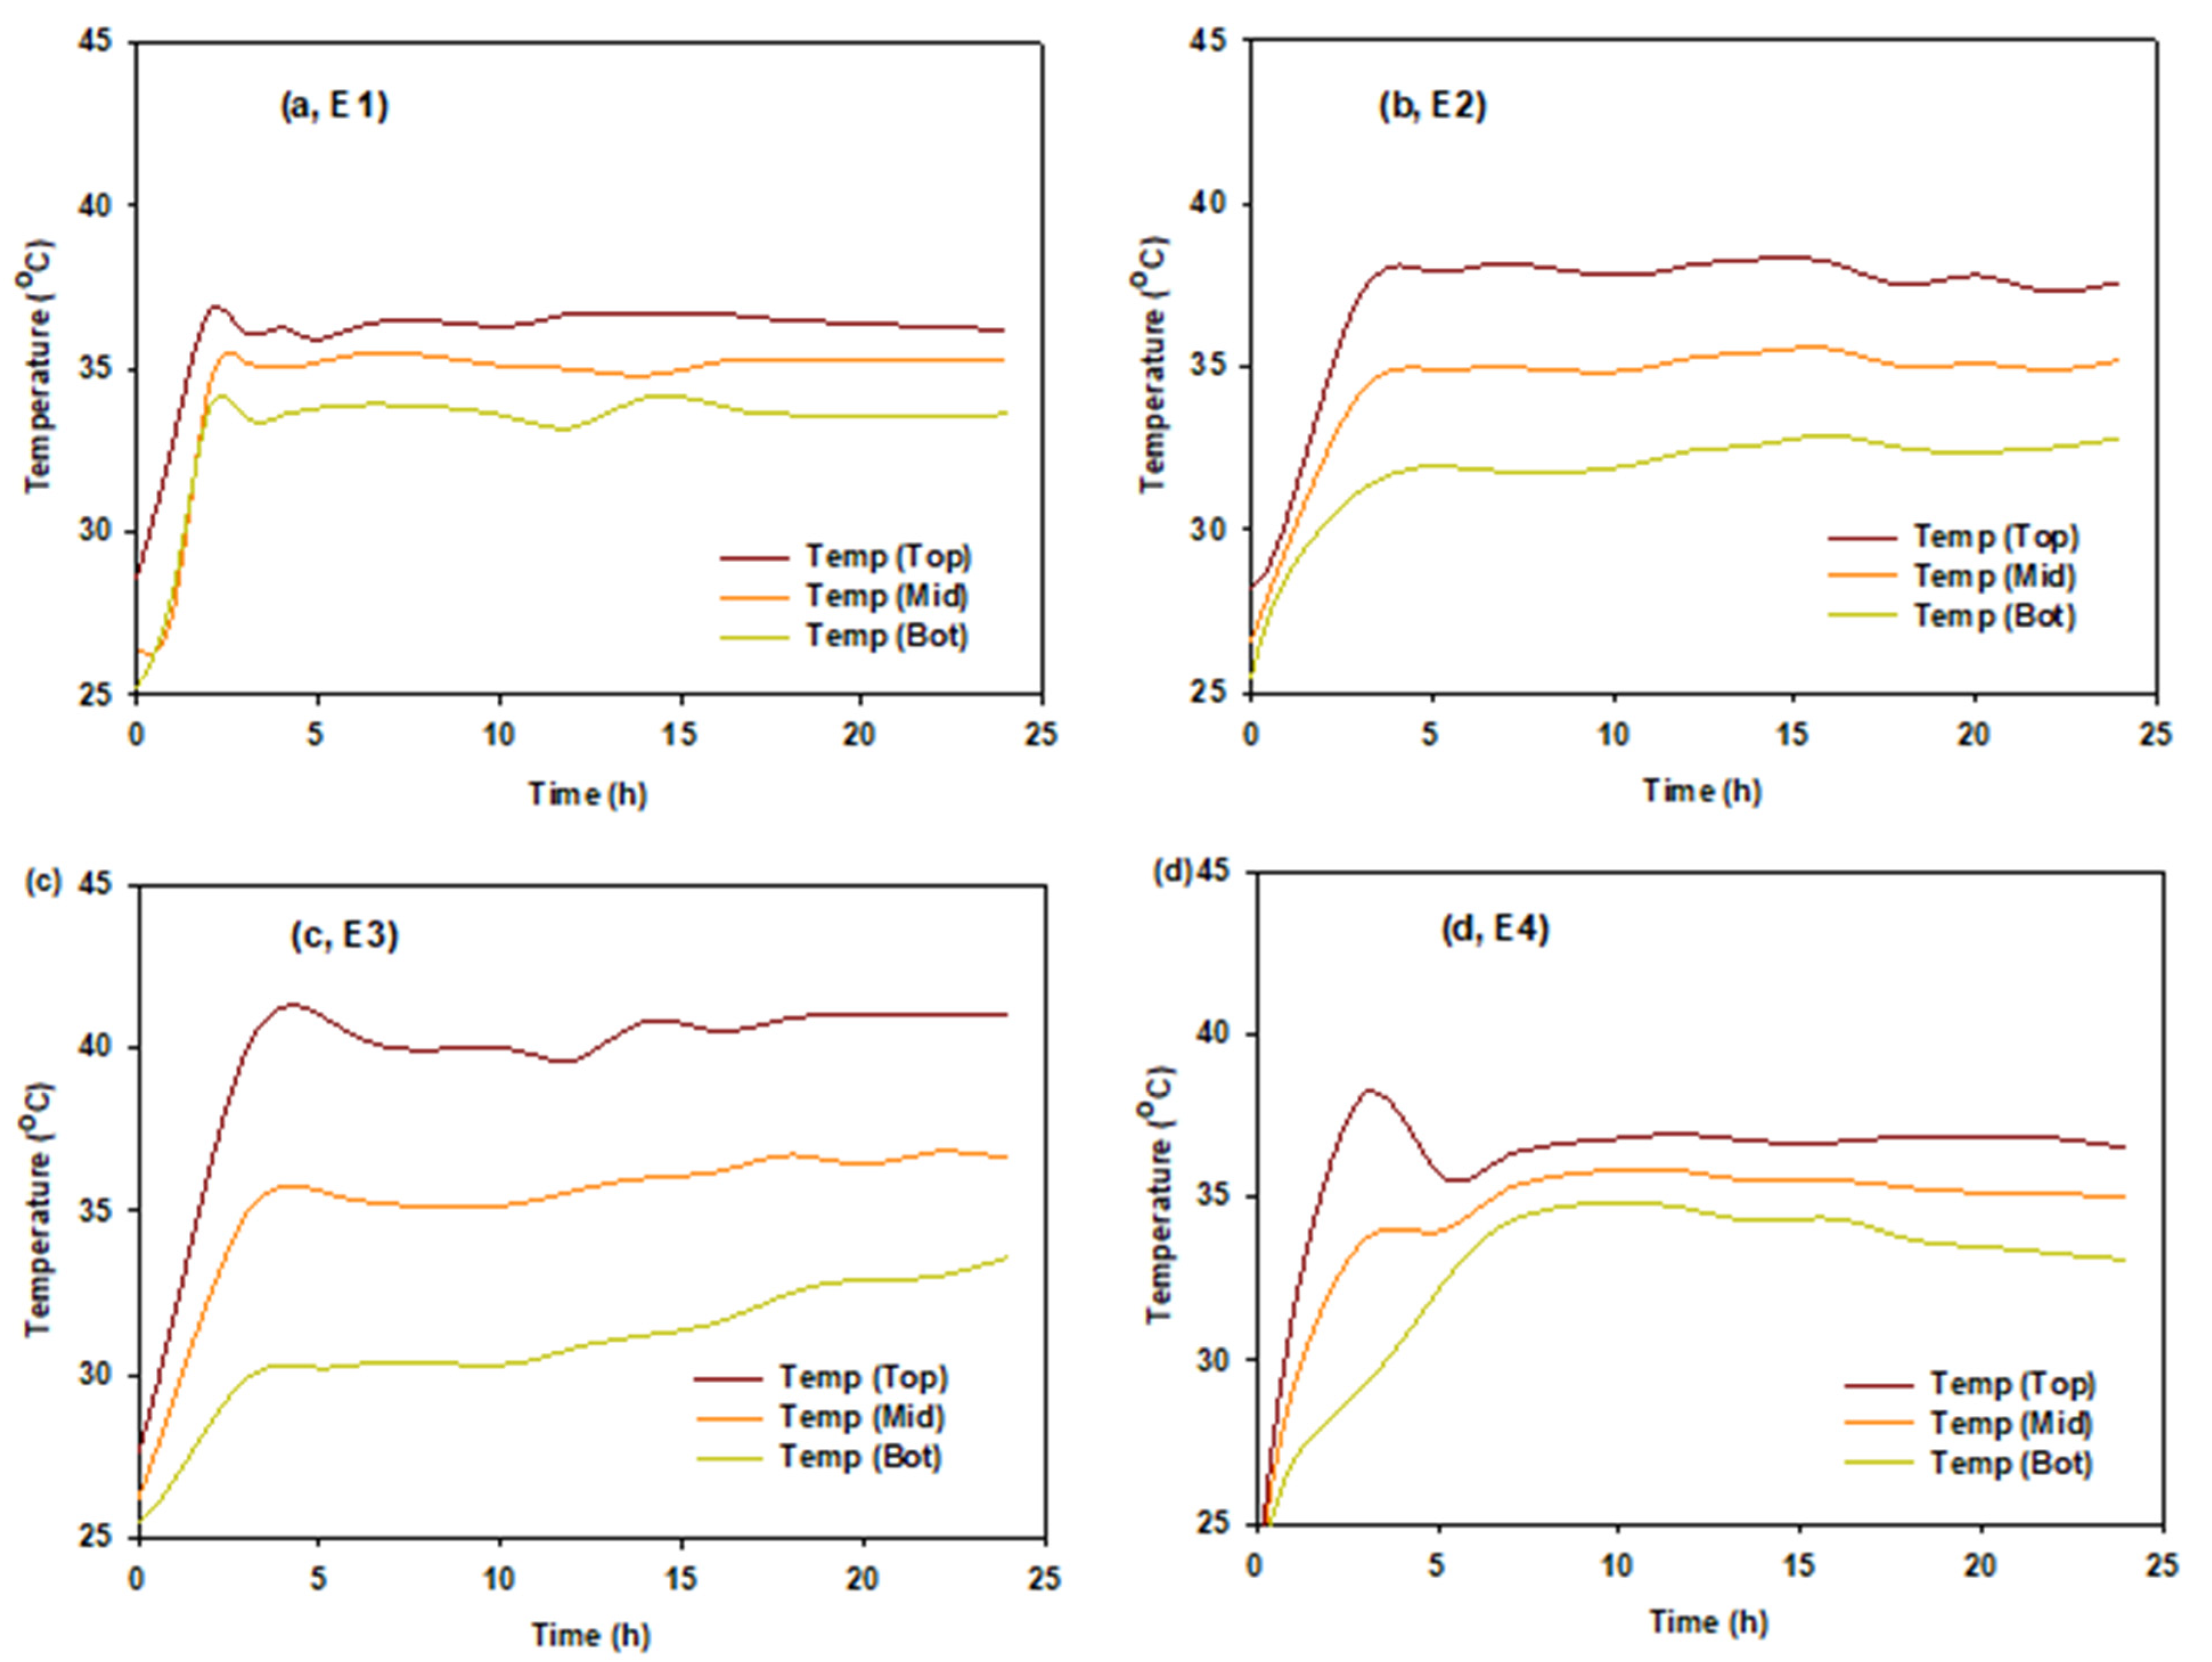
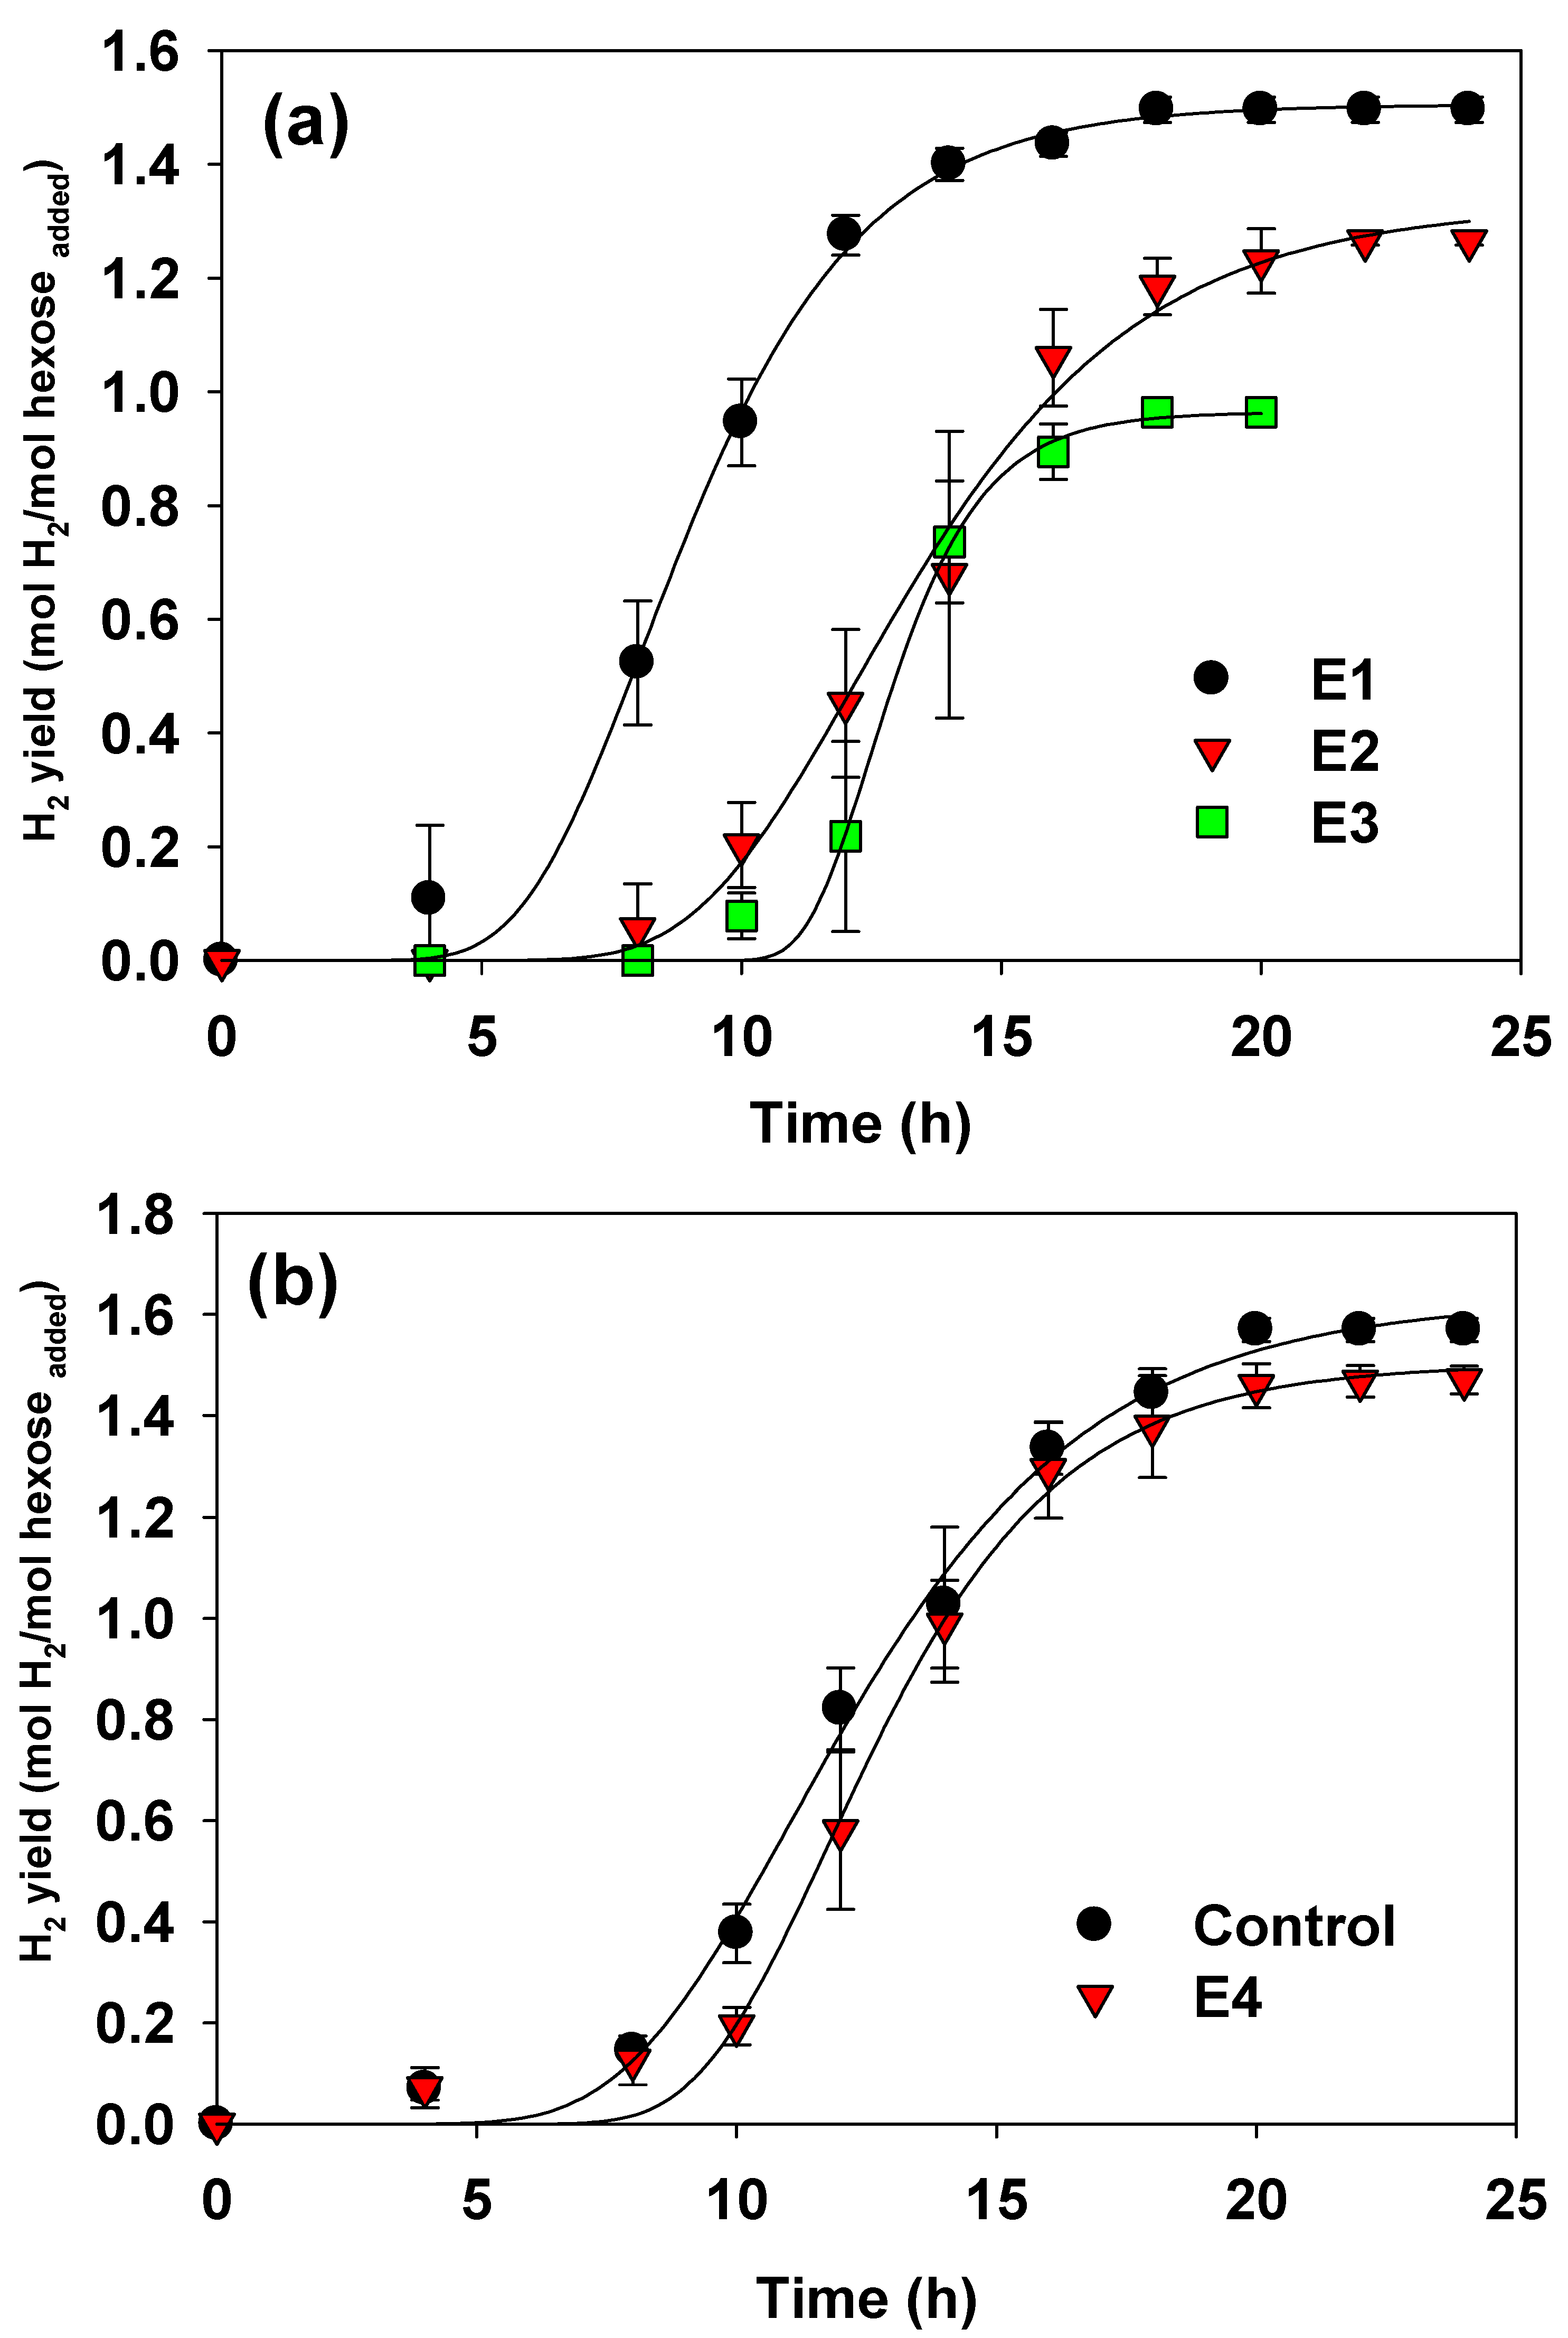
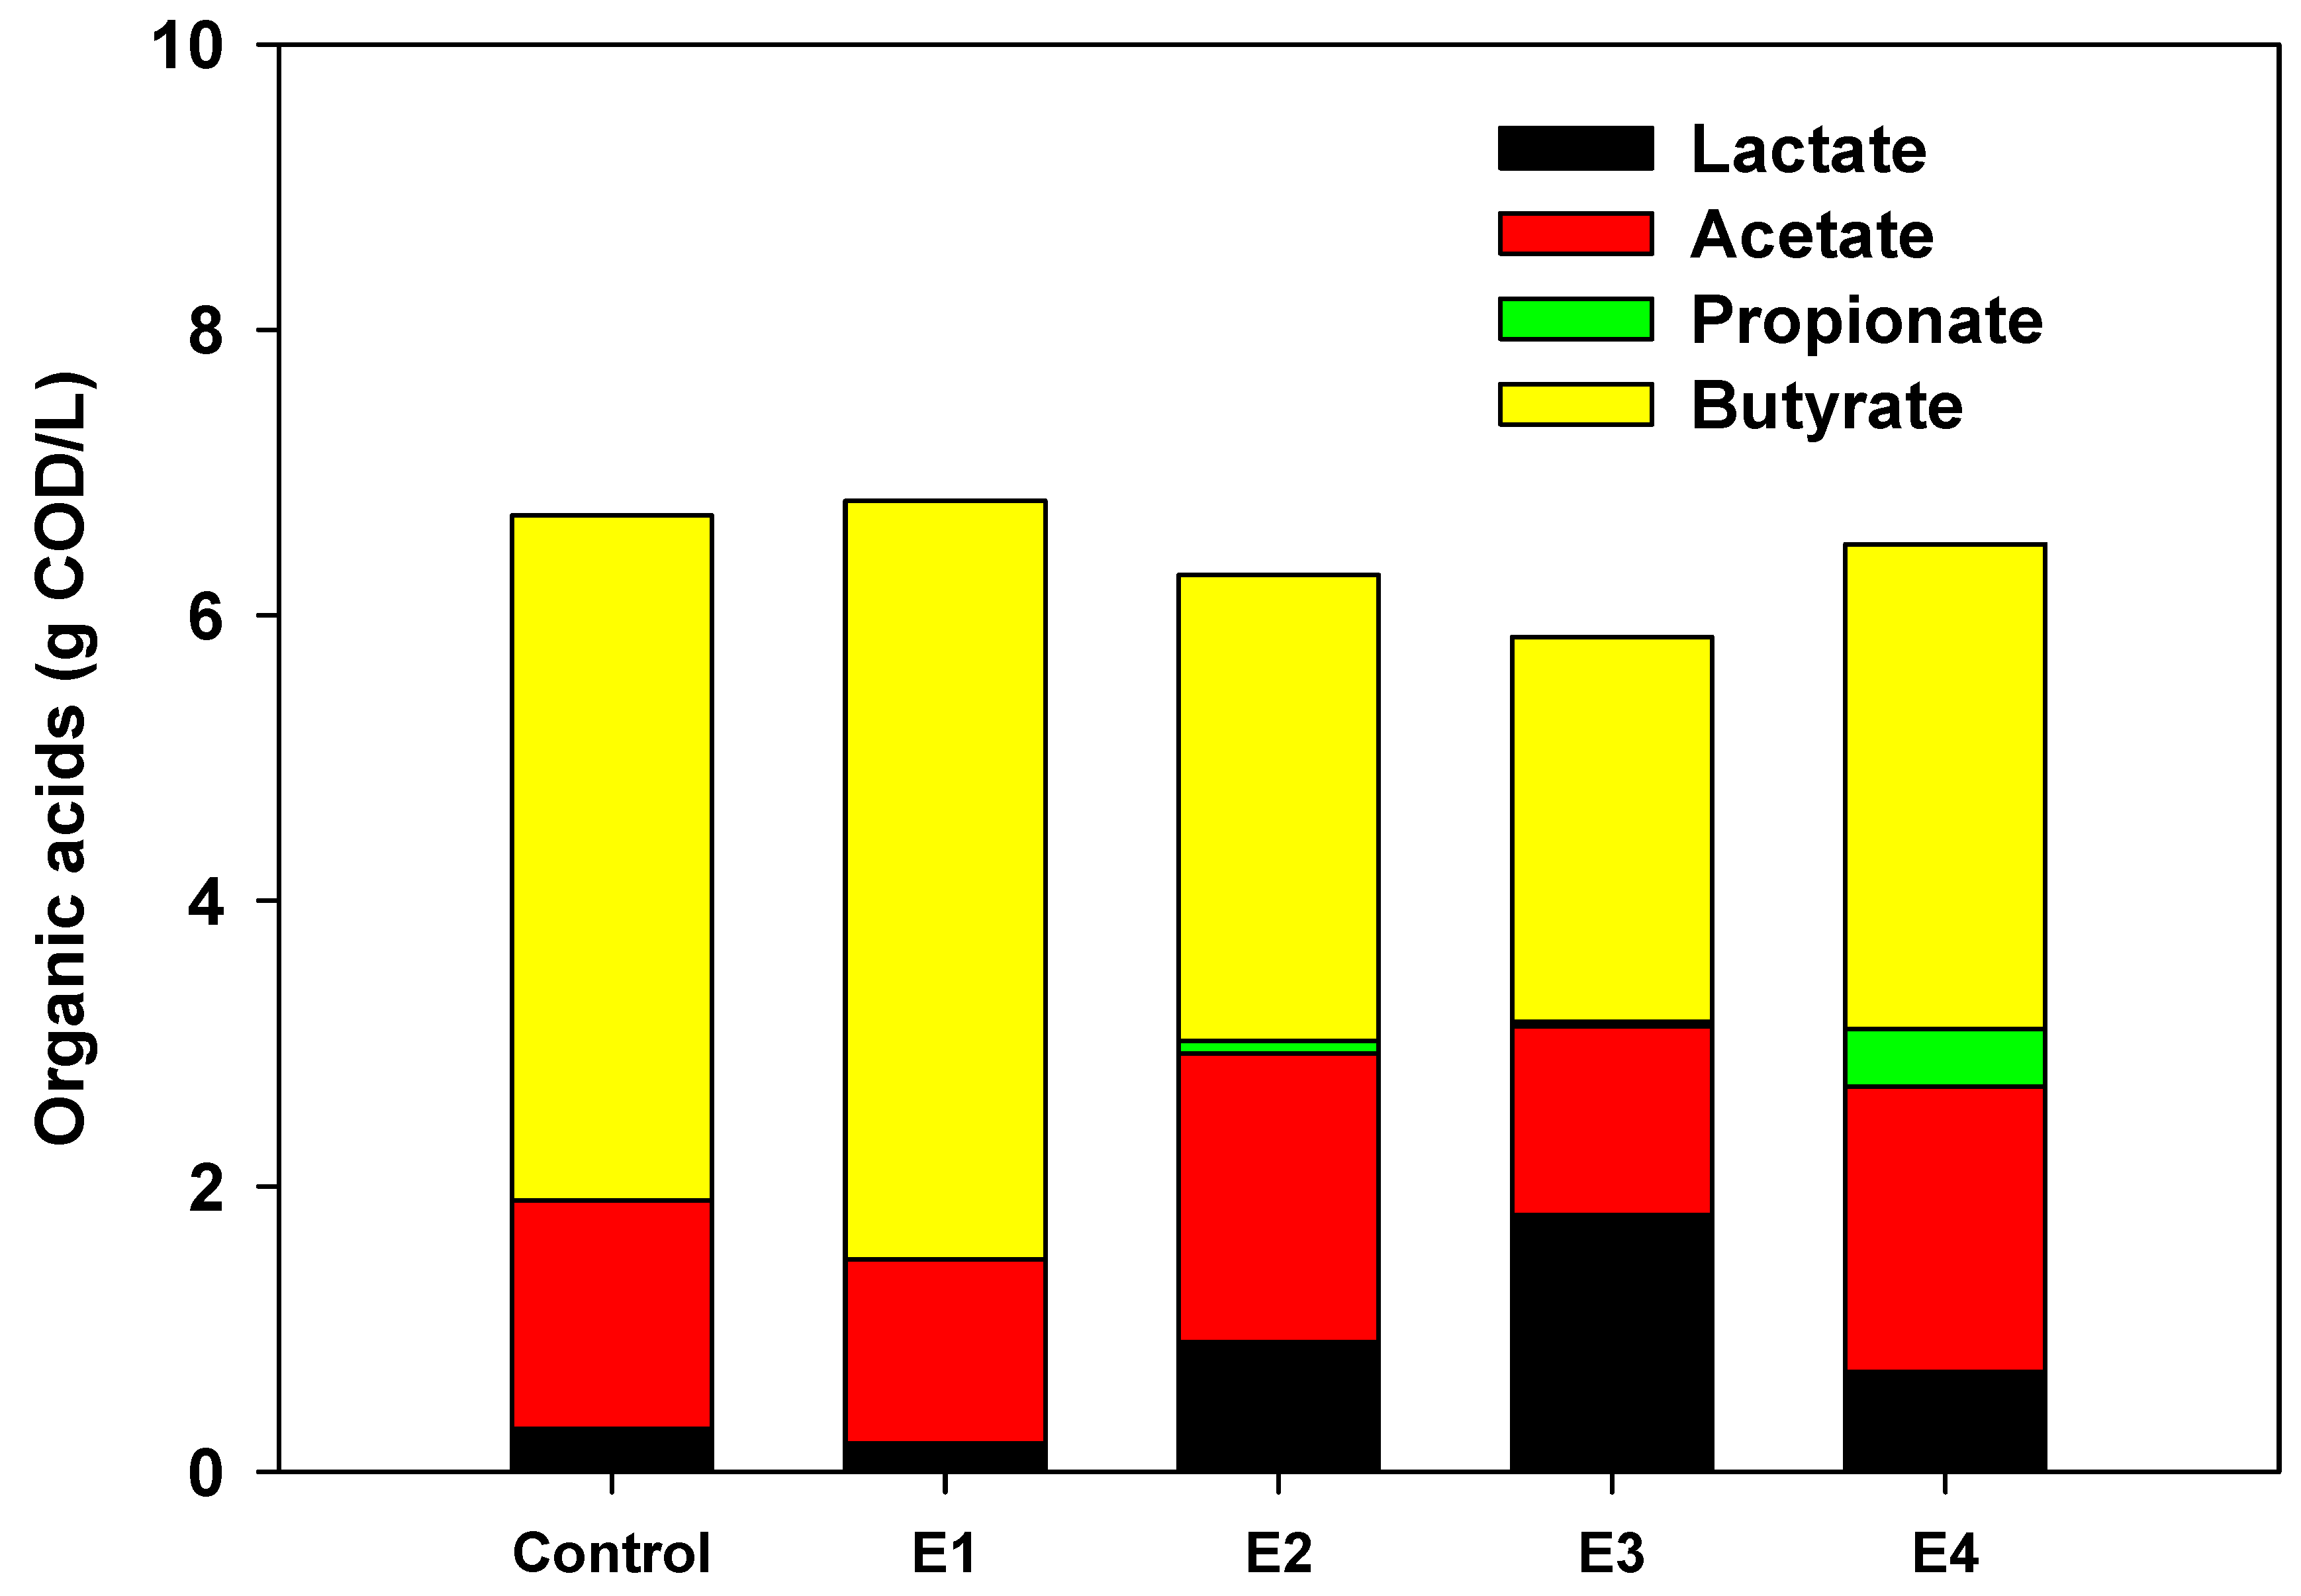
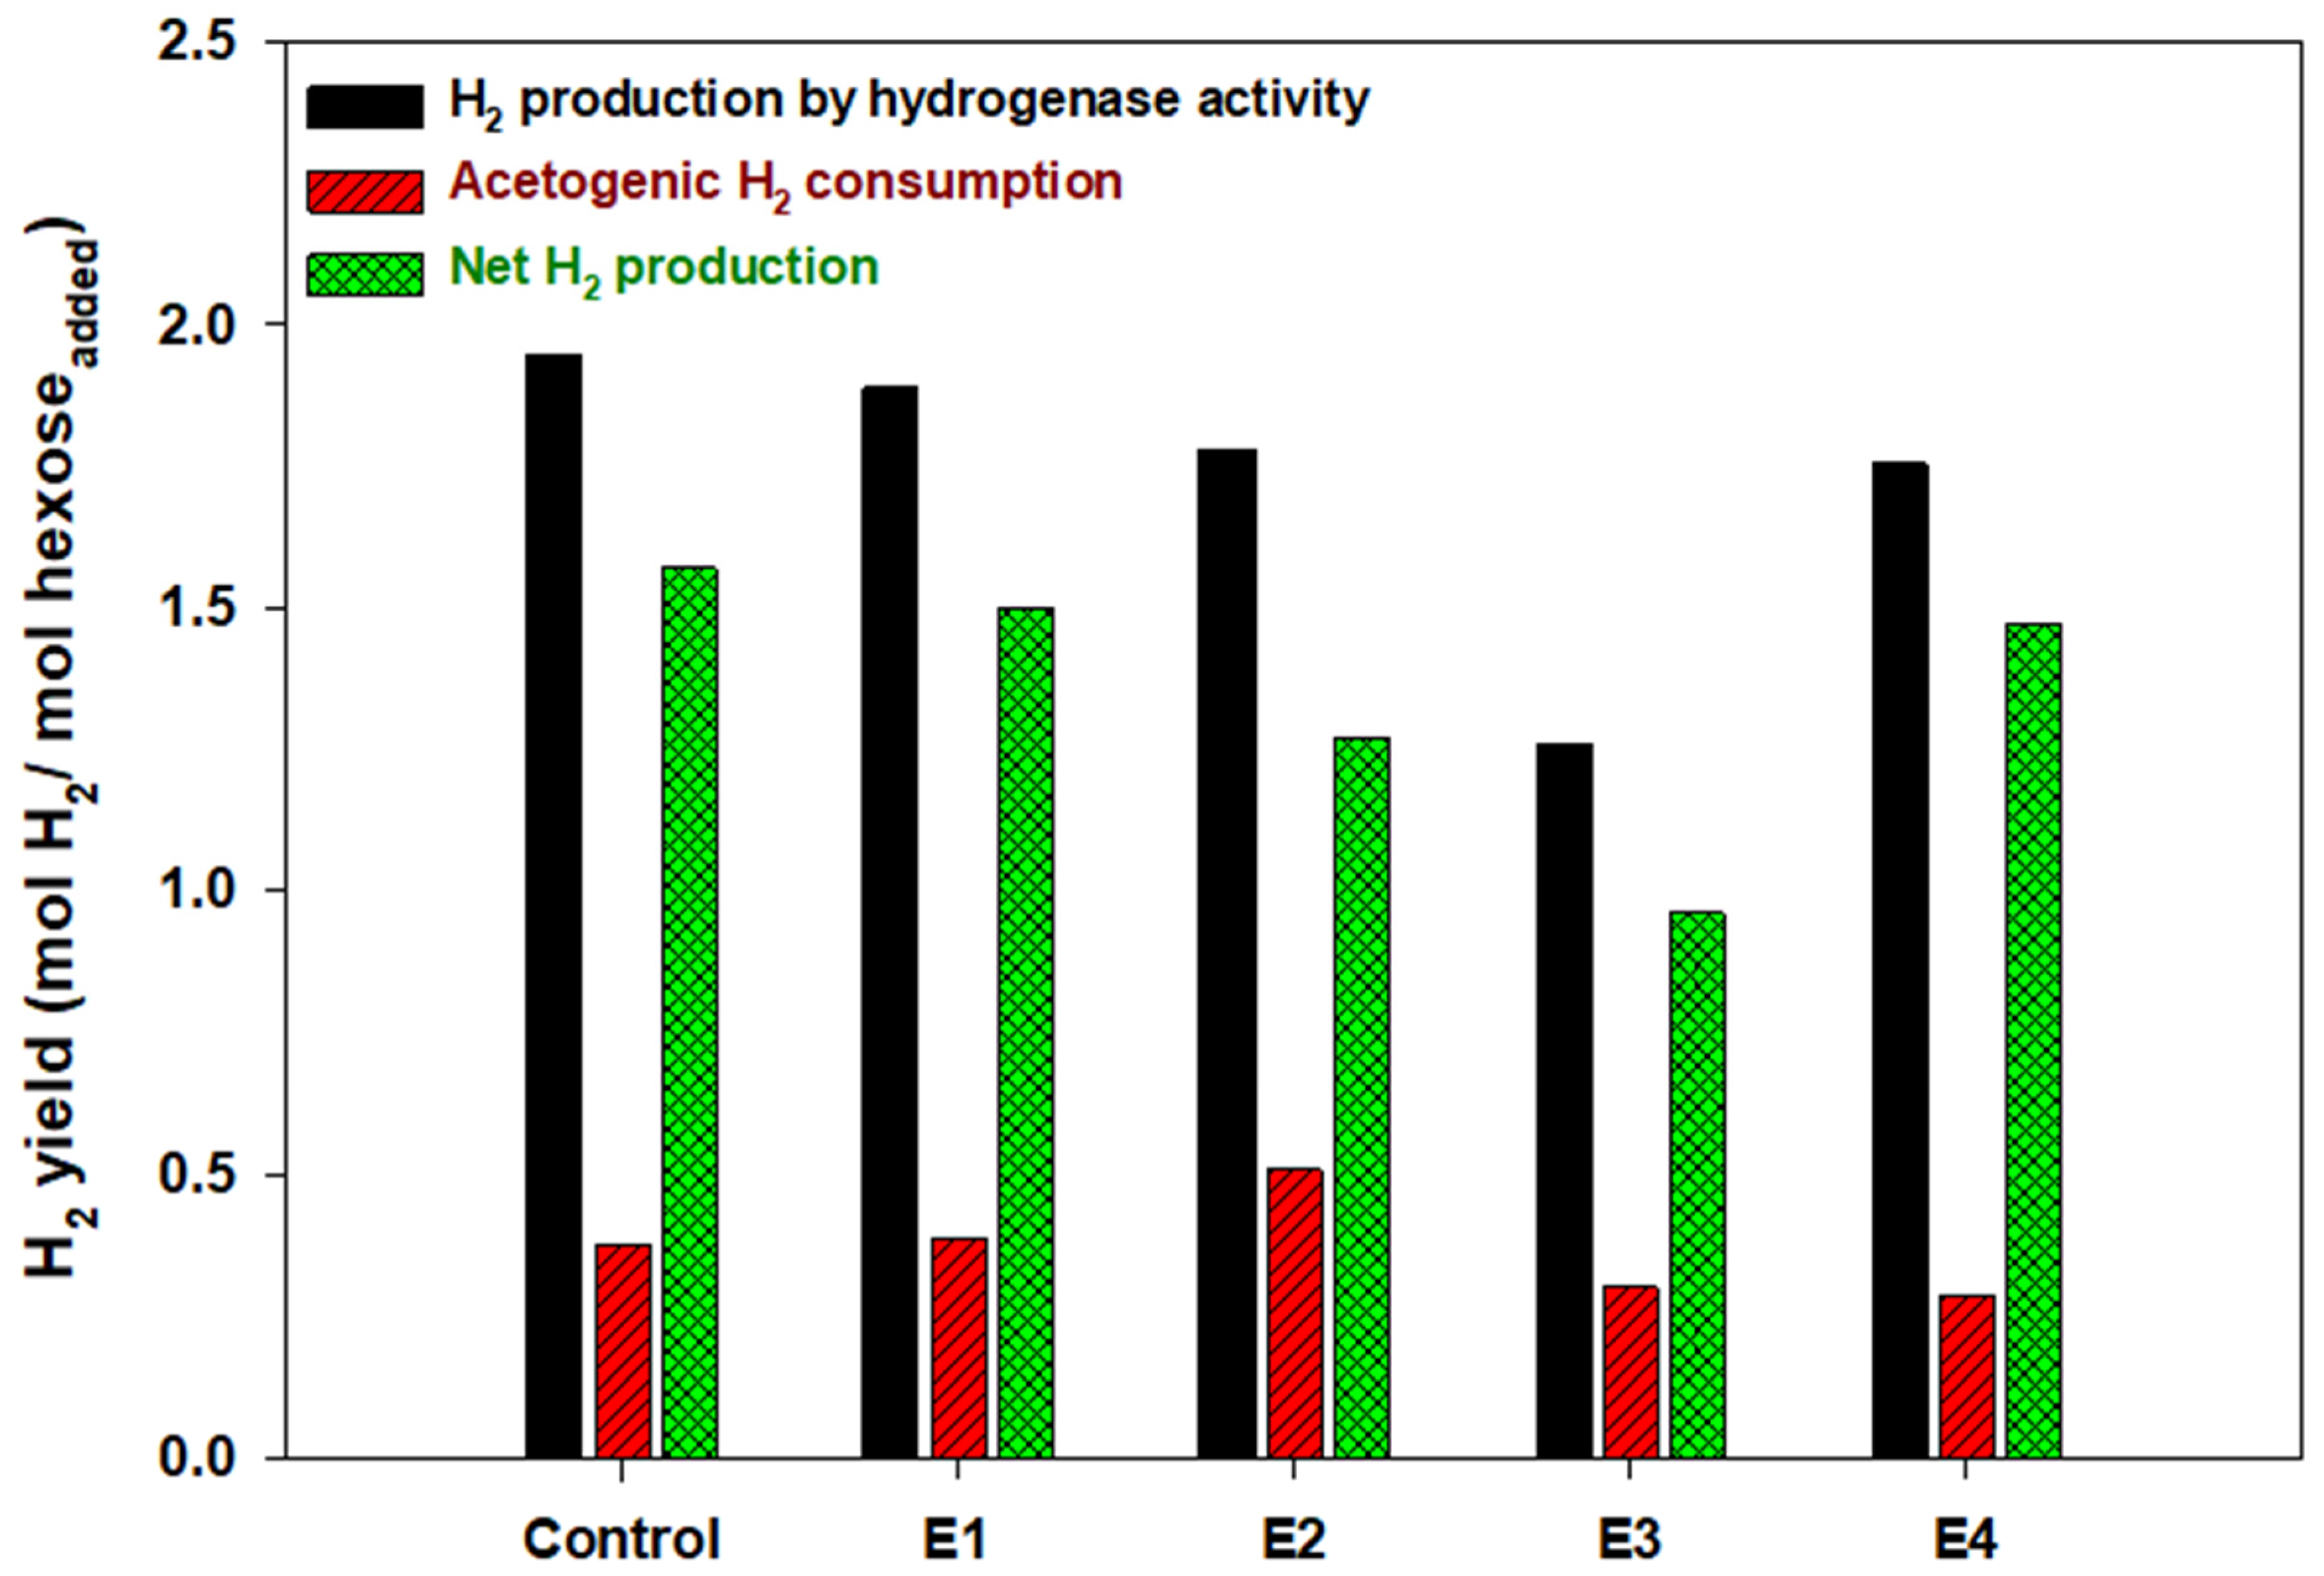
3.1. Fermentation Performance

The temperature variations at the different heights of the bioreactor are depicted in Figure 2. Within 5 h, the temperature at the middle layer became around 35 °C, while the temperature at the top and bottom reached 35 ± 1.5, ±3.0, and ±5 °C, depending on the operational conditions. This indicates that the control of temperature and pumping rate of cool and hot water circulating reactor surface was successful to make localized temperature difference as planned. In addition, pH difference in three parts (top, middle, and bottom) was negligible (data not shown), indicating that 100 rpm agitation speed was enough to provide sufficient mass transfer of soluble matters through the whole region of the bioreactor.
The total amount of H2 production declined as the temperature gap between top and bottom became larger (Figure 2). The H2 yield of 1.50 mol H2/mol hexoseadded was achieved at ±0.1 and ±1.5 °C, while it dropped to 1.27 and 0.98 mol H2/mol hexoseadded at ±3.0 and ±5.0 °C, respectively (Figure 3). The temperature difference inside the bioreactor also affected the substrate removal efficiency and biomass growth. Glucose removal efficiency ranged 83 to 92% where the highest removal was observed in the control (±0.1 °C), and the lowest value was attained at ±5.0 °C. Ranges of removal efficiency and H2 yield are near to the ranges previously stated in literature [30,31]. After fermentation, biomass concentration increased from (initial) 10 g VSS/L to 10.7 g VSS/L at the control (±0.1 °C), whereas at the temperature variations of ±1.5, ±3.0 and ±5.0 °C it increased to 10.4–10.6 g VSS/L. However, the difference in these two parameters did not seem great enough to tell the difference in H2 production performance. This is because those two parameters can vary, while the H2 production performance can be almost the same, and vice versa [32]. Further, the increase in removal efficiency did not always lead to increased H2 productivity [33,34]. In addition, both the removal efficiency and biomass concentration were found to be microbially community dependent [35].
Figure 4 shows the organic acids production profile under various temperature fluctuations. There was a slight difference in the carbohydrate and organic acid concentration in the samples taken from the reactor at the top, middle, and bottom. There was a slight difference (standard deviation <1%) in the carbohydrate and organic acid concentration in the samples taken from the reactor at the top, middle, and bottom. These results implied that the dissolved contents inside the reactor were mixed well during H2 experiment.
The propionate concentration was negligible. The total organic acids production of 6.7 g COD/L was observed at the control experiment (±0.1 °C), and a similar trend of organic acids accumulation was noted at the experimental condition at ±1.5 °C. The organic acids production was dropped to 6.3 and 5.9 g COD/L at ±3.0 and ±5.0 °C. The major organic acids production during the experimental conditions was acetate, butyrate, and lactate, while formate was not detected.
Butyrate was the major dominant metabolic product for all conditions, and higher concentrations of 4.80 and 5.31 g COD/L were observed at control and ±1.5 °C, respectively. On the other hand, it dropped to 3.26 and 2.70 g COD/L at ±3.0 and ±5.0 °C, respectively. The accumulation of lactate was limited at the control 35 ± 0.1 °C and ±1.5 °C, whereas the concentration was higher at ±3.0 and ±5.0 °C. The localized temperature difference inside the reactor could affect organic acids distribution pattern (Figure 4). A maximum lactate accumulation of 1.8 g COD/L was observed at ±5.0 °C. As indicated earlier, the lactate production is not beneficial for H2 production, which is mainly produced by lactic acid bacteria [36,37]. Further, previous study confirmed that the more lactate production, the less H2 that would be generated [38]. The possible suggestion to overcome this problem has been mentioned by culturing lactate utilizing hydrogen producing bacteria (LU-HPB) such as Megasphaera elsedenii [16]. Experimental results were found to match with statistical analysis. In specific, a high positive correlation was observed between H2 yield and HBu generation, (Pearson’s r value of +0.920). On the other hand, H2 yield inversely correlated with HLa production (Pearson’s r value of −0.999).
Energy balance on a COD basis and molar conversion for batches under various localized temperature differences are provided in Table S1 (see Supplementary Material). The considered fractions were acetate, butyrate, propionate, lactate, H2, biomass, and residual glucose content. The fraction of biomass was calculated by the change in VSS content, whereas the molecular formula was assumed to be (C5H7O2N). For all batches, the total sum was higher than 89.6%, referring to the accuracy of analysis. In all batches, the highest portion of energy distribution was assigned to butyrate. On the other hand, residual glucose molar conversion varied among batches, whereas it reached its maximal value of 0.17 mol H2/mol hexoseadded in E3. For further understanding of the H2 production performance, we calculated acetogenic H2 consumption by applying FBA on the obtained experimental data.
FBA is an informative tool for analyzing carbon/electron distribution and understanding the performance of various H2 producing batches [29]. The list of the reactions, adopted for establishing FBA is given in a previous work [28]. Based on FBA results, we could calculate acetogenic H2 consumption, H2 production by hydrogenase activity, and net H2 production. Figure 5 provides a thorough explanation for H2 production from tested batches. Details regarding the calculations can be found in a previous work [29]. Apparently, a correlation between obtained H2 yield values and H2 production by hydrogenase activity can be noticed. Further, E2 had the highest acetogenic H2 consumption of 0.51 mol H2/mol hexoseadded. This can further support H2 yield results. Then, it can be concluded that both acetogenic H2 consumption and lactate generation are enough for explaining the attained H2 production results.

3.2. Energy Reduction by Agitation Speed Control

It was found that the temperature difference at ±1.5 °C had no significant effect on H2 yield, compared to the control (35 ± 0.1 °C). Then, the experiment E4 was performed to compare the energy required for agitation speed during H2 fermentation (Figure 6). The agitation speed was 10 rpm under small temperature difference (<±1.5 °C), while it increased to 100 rpm when the temperature difference between top and bottom of reactor became larger than ±1.5 °C (Figure 2). When the agitation speed increased to 100 rpm, the temperature gap became smaller less than ±1.5 °C after certain time.
The H2 yield of 1.47 mol H2/mol hexoseadded was achieved at E4 condition, which was almost similar to the control condition (1.50 mol H2/mol hexoseadded) (Figure 3b). The economic benefit, in terms of the reduction in energy consumption for operating the agitation speed were compared. The control reactor at a fixed rotation of 100 rpm during the temperature difference needed an energy demand of 510 kJ (5.9 W × 24 h × 3.6), whereas the operational strategy E4 consumed a low energy input of 367 kJ as it was set up like “10 rpm for 22 h and 100 rpm for rest of the 2 h” = {(4.1 W × 22 h + 5.9 W × 2 h) ×3.6}. The net energy gain of 28% has been observed when the rotational speed was reduced from 100 rpm to 10 rpm. Figure 6 depicts the time interval for mixing at different rotations per minute for a day in the case of E4. Srirugsa et al. [39] has reported energy gain of11% when the rotational speed was reduced from “100 rpm for 24 h” mode to “100 rpm for 8 h + 10 rpm for rest 16 h” mode. Moreover, a reduction in mixing speed from 150 rpm to 25 rpm resulted in 83% reduction in equivalent energy consumption, while having same output [40].
In full-scale anaerobic digesters, mixing is not continuous, rather it is intermittent. However, such intermittent mixing was found to be random and irrational. For example, when Zhu et al. [41] reduced the intermittent period from 12 to 4 h, H2 productivity increased by 4%. On the other hand, reducing the intermittent stirring period from 8 to 2 h, sharply lowered H2 productivity by 30% [41]. Therefore, regulating intermittent mixing is a must for avoiding drops in H2 production. For efficient mixing regulation, important parameters can be sensed and then used for deciding the intermittent mixing condition. Herein, we proposed sensing the temperature difference as a tool for regulating intermittent mixing.
The target of lowering agitation speed was reducing the energy demand, without affecting the performance. Our results confirmed that H2 production, under low mixing speed or intermittent mixing, has not been significantly affected by such change in mixing. Energy reduction, acquired in this study, can have significant impact when it is upscaled to industrial level.

4. Conclusions

The total amount of H2 production declined as the localized temperature gap became larger with the increased lactate production. H2 yield decreased from 1.50 to 0.98 mol H2/mol hexoseadded when the gap increased from ±0.1 °C to ±5.0 °C with the lactate concentration increase from 0.2 to 1.8 g COD/L. At ±1.5 °C, a similar H2 yield was attained with the control. Operating the bioreactor with differences in agitation speed responding to the localized temperature gap exhibited a similar H2 yield of 1.47 mol H2/mol hexoseadded. Through this strategy, it was possible to save 28% of energy required in agitation but acquiring same amount of H2. This work emphasized the role of temperature in the fermentation process, and it shows temperature could have been a potential point to control energy consumption through agitation in the optimization process.

Supplementary Materials

The following are available online at https://www.mdpi.com/article/10.3390/en14216885/s1, Table S1: Energy balance on COD basis and molar conversion for batches under various localized temperature differences.

Author Contributions

Conceptualization, D.-H.K.; methodology, M.-K.L.; software, A.M.; validation, S.I.; formal analysis, M.-K.L.; investigation, S.I., A.M. and O.P.; writing—original draft preparation, S.I., M.-K.L., A.M. and O.P.; writing—review and editing, D.-H.K. and K.-H.L.; visualization, M.-K.L. and A.M.; supervision, D.-H.K. and K.-H.L.; project administration, D.-H.K.; funding acquisition, D.-H.K. All authors have read and agreed to the published version of the manuscript.

Funding

This research was funded by INHA UNIVERSITY, grant number (INHA-65523-01).

Institutional Review Board Statement

Not applicable.

Informed Consent Statement

Not applicable.

Data Availability Statement

Not applicable.

Conflicts of Interest

The authors declare no conflict of interest.

References

  1. Cieciura-Włoch, W.; Binczarski, M.; Tomaszewska, J.; Borowski, S.; Domański, J.; Dziugan, P.; Witońska, I. The use of acidic hydrolysates after furfural production from sugar waste biomass as a fermentation medium in the biotechnological production of hydrogen. Energies 2019, 12, 3222. [Google Scholar] [CrossRef] [Green Version]
  2. Prapinagsorn, W.; Sittijunda, S.; Reungsang, A. Co-digestion of napier grass and its silage with cow dung for methane production. Energies 2017, 10, 1654. [Google Scholar] [CrossRef] [Green Version]
  3. Kieckhäfer, K.; Quante, G.; Müller, C.; Spengler, T.S.; Lossau, M.; Jonas, W. Simulation-based analysis of the potential of alternative fuels towards reducing CO2 emissions from aviation. Energies 2018, 11, 186. [Google Scholar] [CrossRef] [Green Version]
  4. López Ortiz, A.; Meléndez Zaragoza, M.J.; Collins-Martínez, V. Hydrogen production research in Mexico: A review. Int. J. Hydrog. Energy 2016, 41, 23363–23379. [Google Scholar] [CrossRef]
  5. Da Silva Veras, T.; Mozer, T.S.; da Costa Rubim Messeder dos Santos, D.; da Silva César, A. Hydrogen: Trends, production and characterization of the main process worldwide. Int. J. Hydrog. Energy 2017, 42, 2018–2033. [Google Scholar] [CrossRef]
  6. Islam, M.S.; Guo, C.; Liu, C.Z. Enhanced hydrogen and volatile fatty acid production from sweet sorghum stalks by two-steps dark fermentation with dilute acid treatment in between. Int. J. Hydrog. Energy 2018, 43, 659–666. [Google Scholar] [CrossRef]
  7. Salem, A.H.; Brunstermann, R.; Mietzel, T.; Widmann, R. Effect of pre-treatment and hydraulic retention time on biohydrogen production from organic wastes. Int. J. Hydrog. Energy 2018, 43, 4856–4865. [Google Scholar] [CrossRef]
  8. Boodhun, B.S.F.; Mudhoo, A.; Kumar, G.; Kim, S.H.; Lin, C.Y. Research perspectives on constraints, prospects and opportunities in biohydrogen production. Int. J. Hydrog. Energy 2017, 42, 27471–27481. [Google Scholar] [CrossRef]
  9. Wong, Y.M.; Wu, T.Y.; Juan, J.C. A review of sustainable hydrogen production using seed sludge via dark fermentation. Renew. Sustain. Energy Rev. 2014, 34, 471–482. [Google Scholar] [CrossRef]
  10. Ghimire, A.; Frunzo, L.; Pirozzi, F.; Trably, E.; Escudie, R.; Lens, P.N.L.; Esposito, G. A review on dark fermentative biohydrogen production from organic biomass: Process parameters and use of by-products. Appl. Energy 2015, 144, 73–95. [Google Scholar] [CrossRef]
  11. Urbaniec, K.; Bakker, R.R. Biomass residues as raw material for dark hydrogen fermentation—A review. Int. J. Hydrog. Energy 2015, 40, 3648–3658. [Google Scholar] [CrossRef]
  12. Sivagurunathan, P.; Kumar, G.; Bakonyi, P.; Kim, S.H.; Kobayashi, T.; Xu, K.Q.; Lakner, G.; Tóth, G.; Nemestóthy, N.; Bélafi-Bakó, K. A critical review on issues and overcoming strategies for the enhancement of dark fermentative hydrogen production in continuous systems. Int. J. Hydrog. Energy 2016, 41, 3820–3836. [Google Scholar] [CrossRef]
  13. Kumar, G.; Sivagurunathan, P.; Pugazhendhi, A.; Thi, N.B.D.; Zhen, G.; Chandrasekhar, K.; Kadier, A. A comprehensive overview on light independent fermentative hydrogen production from wastewater feedstock and possible integrative options. Energy Convers. Manag. 2017, 141, 390–402. [Google Scholar] [CrossRef]
  14. Dareioti, M.A.; Vavouraki, A.I.; Tsigkou, K.; Zafiri, C.; Kornaros, M. Dark fermentation of sweet sorghum stalks, cheese whey and cow manure mixture: Effect of PH, pretreatment and organic load. Processes 2021, 9, 1017. [Google Scholar] [CrossRef]
  15. Jiang, F.; Peng, Z.; Li, H.; Li, J.; Wang, S. Effect of hydraulic retention time on anaerobic baffled reactor operation: Enhanced biohydrogen production and enrichment of hydrogen-producing acetogens. Process 2020, 8, 339. [Google Scholar] [CrossRef] [Green Version]
  16. Ohnishi, A.; Hasegawa, Y.; Fujimoto, N.; Suzuki, M. Biohydrogen production by mixed culture of megasphaera elsdenii with lactic acid bacteria as lactate-driven dark fermentation. Bioresour. Technol. 2021, 343, 126076. [Google Scholar] [CrossRef]
  17. Lee, K.S.; Lin, P.J.; Chang, J.S. Temperature effects on biohydrogen production in a granular sludge bed induced by activated carbon carriers. Int. J. Hydrog. Energy 2006, 31, 465–472. [Google Scholar] [CrossRef]
  18. Wang, J.; Wan, W. Effect of temperature on fermentative hydrogen production by mixed cultures. Int. J. Hydrog. Energy 2008, 33, 5392–5397. [Google Scholar] [CrossRef]
  19. Özgür, E.; Uyar, B.; Öztürk, Y.; Yücel, M.; Gündüz, U.; Eroǧlu, I. Biohydrogen production by Rhodobacter capsulatus on acetate at fluctuating temperatures. Resour. Conserv. Recycl. 2010, 54, 310–314. [Google Scholar] [CrossRef]
  20. Kress, P.; Nägele, H.J.; Oechsner, H.; Ruile, S. Effect of agitation time on nutrient distribution in full-scale CSTR biogas digesters. Bioresour. Technol. 2018, 247, 1–6. [Google Scholar] [CrossRef]
  21. Lemmer, A.; Naegele, H.J.; Sondermann, J. How efficient are agitators in biogas digesters? Determination of the efficiency of submersible motor mixers and incline agitators by measuring nutrient distribution in full-scale agricultural biogas digesters. Energies 2013, 6, 6255–6273. [Google Scholar] [CrossRef] [Green Version]
  22. Kaparaju, P.; Buendia, I.; Ellegaard, L.; Angelidaki, I. Effects of mixing on methane production during thermophilic anaerobic digestion of manure: Lab-scale and pilot-scale studies. Bioresour. Technol. 2008, 99, 4919–4928. [Google Scholar] [CrossRef] [PubMed]
  23. Lin, P.J.; Chang, J.S.; Yang, L.H.; Lin, C.Y.; Wu, S.Y.; Lee, K.S. Enhancing the performance of pilot-scale fermentative hydrogen production by proper combinations of HRT and substrate concentration. Int. J. Hydrog. Energy 2011, 36, 14289–14294. [Google Scholar] [CrossRef]
  24. Jung, K.W.; Kim, D.H.; Shin, H.S. A simple method to reduce the start-up period in a H2-producing UASB reactor. Int. J. Hydrog. Energy 2017, 36, 1466–1473. [Google Scholar] [CrossRef]
  25. Angelidaki, I.; Sanders, W. Assessment of the anaerobic biodegradability of macropollutants. Rev. Environ. Sci. Biotechnol. 2004, 3, 117–129. [Google Scholar] [CrossRef]
  26. APHA. Standard Methods For the Examination of Water and Wastewater, 21st ed.; Amer Public Health Assn: Washington, DC, USA, 2005. [Google Scholar]
  27. DuBois, M.; Gilles, K.A.; Hamilton, J.K.; Rebers, P.A.; Smith, F. Colorimetric method for determination of sugars and related substances. Anal. Chem. 1956, 28, 350–356. [Google Scholar] [CrossRef]
  28. Chaganti, S.R.; Kim, D.-H.; Lalman, J.A. Flux balance analysis of mixed anaerobic microbial communities: Effects of linoleic acid (LA) and pH on biohydrogen production. Int. J. Hydrog. Energy 2011, 36, 14141–14152. [Google Scholar] [CrossRef]
  29. Lalman, J.A.; Chaganti, S.R.; Moon, C.; Kim, D.-H. Elucidating acetogenic H2 consumption in dark fermentation using flux balance analysis. Bioresour. Technol. 2013, 146, 775–778. [Google Scholar] [CrossRef]
  30. Mostafa, A.; El-Dissouky, A.; Fawzy, A.; Farghaly, A.; Peu, P.; Dabert, P.; Le Roux, S.; Tawfik, A. Magnetite/graphene oxide nano-composite for enhancement of hydrogen production from gelatinaceous wastewater. Bioresour. Technol. 2016, 216, 520–528. [Google Scholar] [CrossRef] [PubMed]
  31. Mostafa, A.; Im, S.; Song, Y.-C.; Park, J.-H.; Kim, S.-H.; Lim, K.-H.; Kim, D.-H. Unravelling the enhancement of biohydrogen production via adding magnetite nanoparticles and applying electrical energy input. Int. J. Hydrog. Energy 2021. [Google Scholar] [CrossRef]
  32. Kumar, G.; Park, J.; Kim, M.; Kim, D.-H.; Kim, S. Hydrogen fermentation of different galactose compositions during various hydraulic retention times (HRTs). Int. J. Hydrog. Energy 2014, 39, 20625–20631. [Google Scholar] [CrossRef]
  33. Kim, D.-H.; Kim, S.; Kim, K.; Shin, H. Experience of a pilot-scale hydrogen-producing anaerobic sequencing batch reactor (ASBR) treating food waste. Int. J. Hydrog. Energy 2010, 35, 1590–1594. [Google Scholar] [CrossRef]
  34. Jung, K.W.; Kim, D.-H.; Kim, S.H.; Shin, H.S. Bioreactor design for continuous dark fermentative hydrogen production. Bioresour. Technol. 2011, 102, 8612–8620. [Google Scholar] [CrossRef] [PubMed]
  35. Kim, D.-H.; Han, S.K.; Kim, S.H.; Shin, H.S. Effect of gas sparging on continuous fermentative hydrogen production. Int. J. Hydrog. Energy 2006, 31, 2158–2169. [Google Scholar] [CrossRef]
  36. Bundhoo, M.A.Z.; Mohee, R. Inhibition of dark fermentative bio-hydrogen production: A review. Int. J. Hydrog. Energy 2016, 41, 6713–6733. [Google Scholar] [CrossRef]
  37. Gomes, S.D.; Fuess, L.T.; Mañunga, T.; De Lima Gomes, P.C.F.; Zaiat, M. Bacteriocins of lactic acid bacteria as a hindering factor for biohydrogen production from cassava flour wastewater in a continuous multiple tube reactor. Int. J. Hydrog. Energy 2016, 41, 8120–8131. [Google Scholar] [CrossRef] [Green Version]
  38. Manish, S.; Venkatesh, K.V.; Banerjee, R. Metabolic flux analysis of biological hydrogen production by Escherichia coli. Int. J. Hydrog. Energy 2007, 32, 3820–3830. [Google Scholar] [CrossRef]
  39. Srirugsa, T.; Prasertsan, S.; Theppaya, T.; Leevijit, T.; Prasertsan, P. Appropriate mixing speeds of Rushton turbine for biohydrogen production from palm oil mill effluent in a continuous stirred tank reactor. Energy 2019, 179, 823–830. [Google Scholar] [CrossRef]
  40. Lindmark, J.; Eriksson, P.; Thorin, E. The effects of different mixing intensities during anaerobic digestion of the organic fraction of municipal solid waste. Waste Manag. 2014, 34, 1391–1397. [Google Scholar] [CrossRef]
  41. Zhu, S.; Zhang, Z.; Zhang, H.; Jing, Y.; Li, Y.; Zhang, Q. Rheological properties of corn stover hydrolysate and photo-fermentation bio-hydrogen producing capacity under intermittent stirring. Int. J. Hydrog. Energy 2020, 45, 3721–3728. [Google Scholar] [CrossRef]
Figure 1. A schematic diagram of bioreactor system used in this study.
Energies 14 06885 g001
Figure 2. The change of temperature at top, middle, and bottom layer of reactor planned to deviate at (a) E1 (35 ± 1.5 °C), (b) E2 (35 ± 3.0 °C), (c) E3 (35 ± 5.0 °C), and (d) E4 (35 ± 1.5 °C) during H2 fermentation.
Energies 14 06885 g002
Figure 3. Cumulative H2 yield for (a) E1 (35 ± 1.5 °C), E2 (35 ± 3.0 °C), E3 (35 ± 5.0 °C), (b) control (35 ± 0.1 °C), and E4 (35 ± 1.5 °C) batches.
Energies 14 06885 g003
Figure 4. Organic acids profile for control (35 ± 0.1 °C), E1 (35 ± 1.5 °C), E2 (35 ± 3.0 °C), E3 (35 ± 5.0 °C), and E4 (35 ± 1.5 °C) batches.
Energies 14 06885 g004
Figure 5. A thorough explanation for H2 production from control (35 ± 0.1 °C), E1 (35 ± 1.5 °C), E2 (35 ± 3.0 °C), E3 (35 ± 5.0 °C), and E4 (35 ± 1.5 °C) batches, using flux balance analysis.
Energies 14 06885 g005
Figure 6. The change in agitation speed during dark fermentation (the agitation speed was 10 rpm under small temperature difference (<±1.5 °C), while it increased to 100 rpm when the temperature gap between top and bottom of reactor became larger than ±1.5 °C).
Energies 14 06885 g006
Publisher’s Note: MDPI stays neutral with regard to jurisdictional claims in published maps and institutional affiliations.

