
Numerical Simulation of an Out-Vessel Loss of Coolant from the Breeder Primary Loop Due to Large Rupture of Tubes in a Primary Heat Exchanger in the DEMO WCLL Concept

 , ,
, ,
Abstract
:1. Introduction
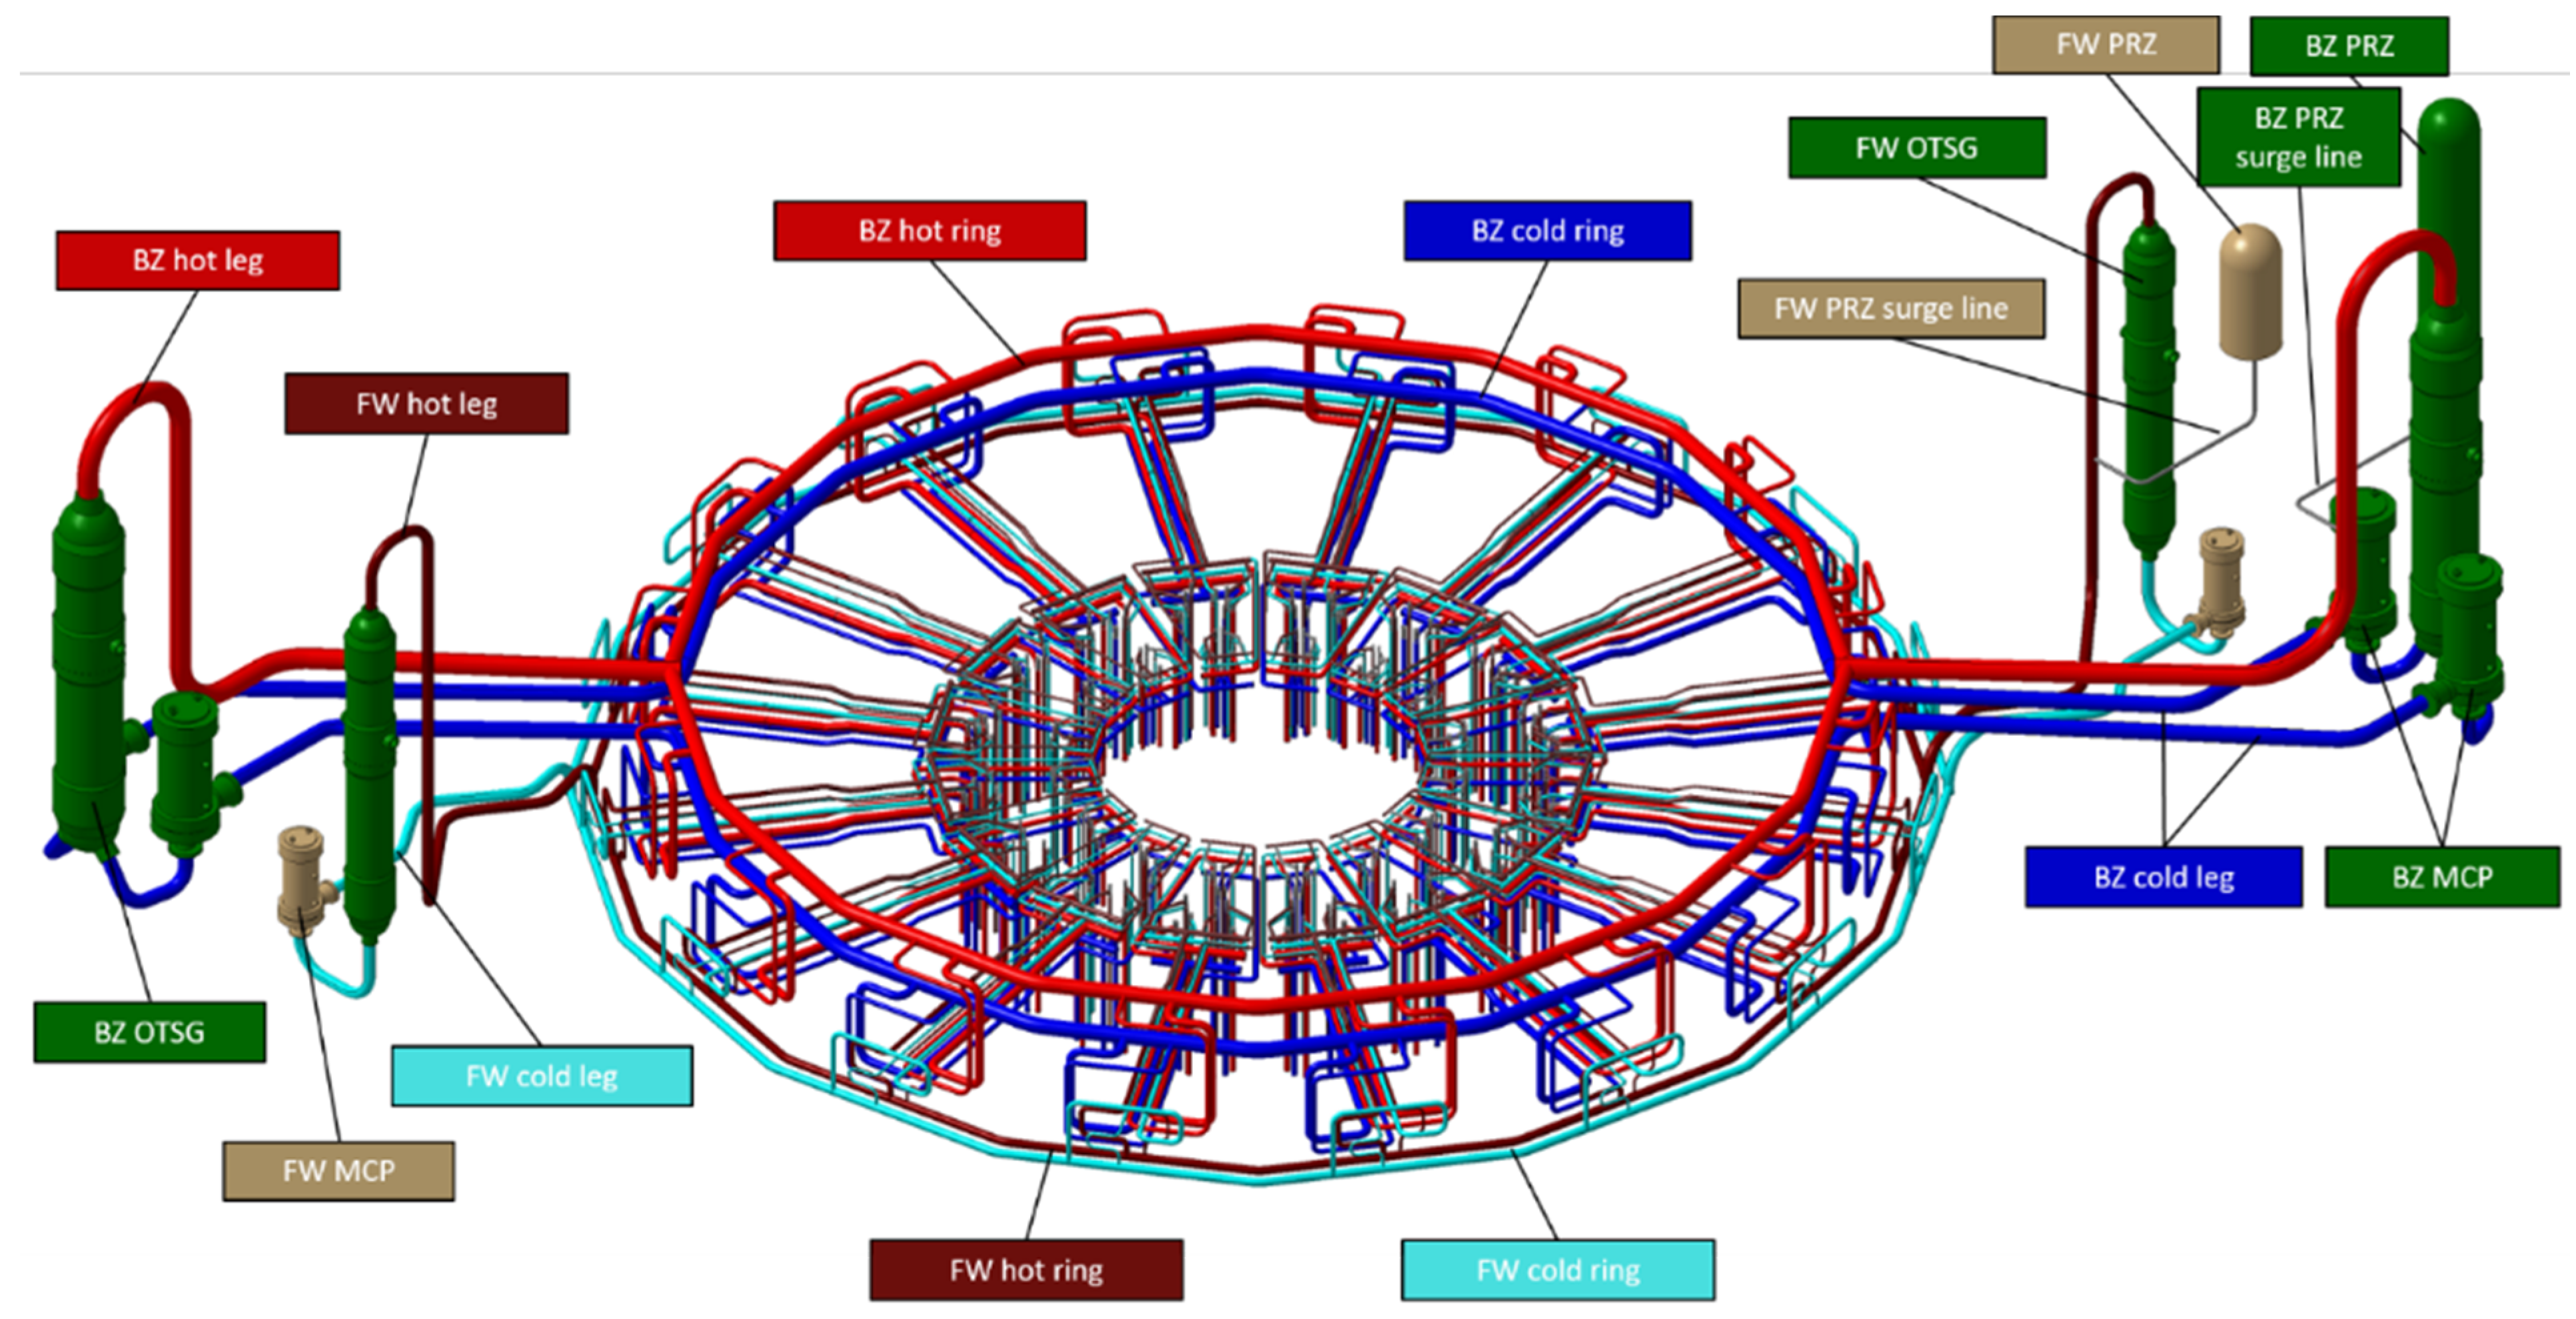
2. DEMO WCLL-BB PHTS System
2.1. General Parameters and Power Data
- The BZ primary system (BZ PHTS);
- The FW primary system (FW PHTS).
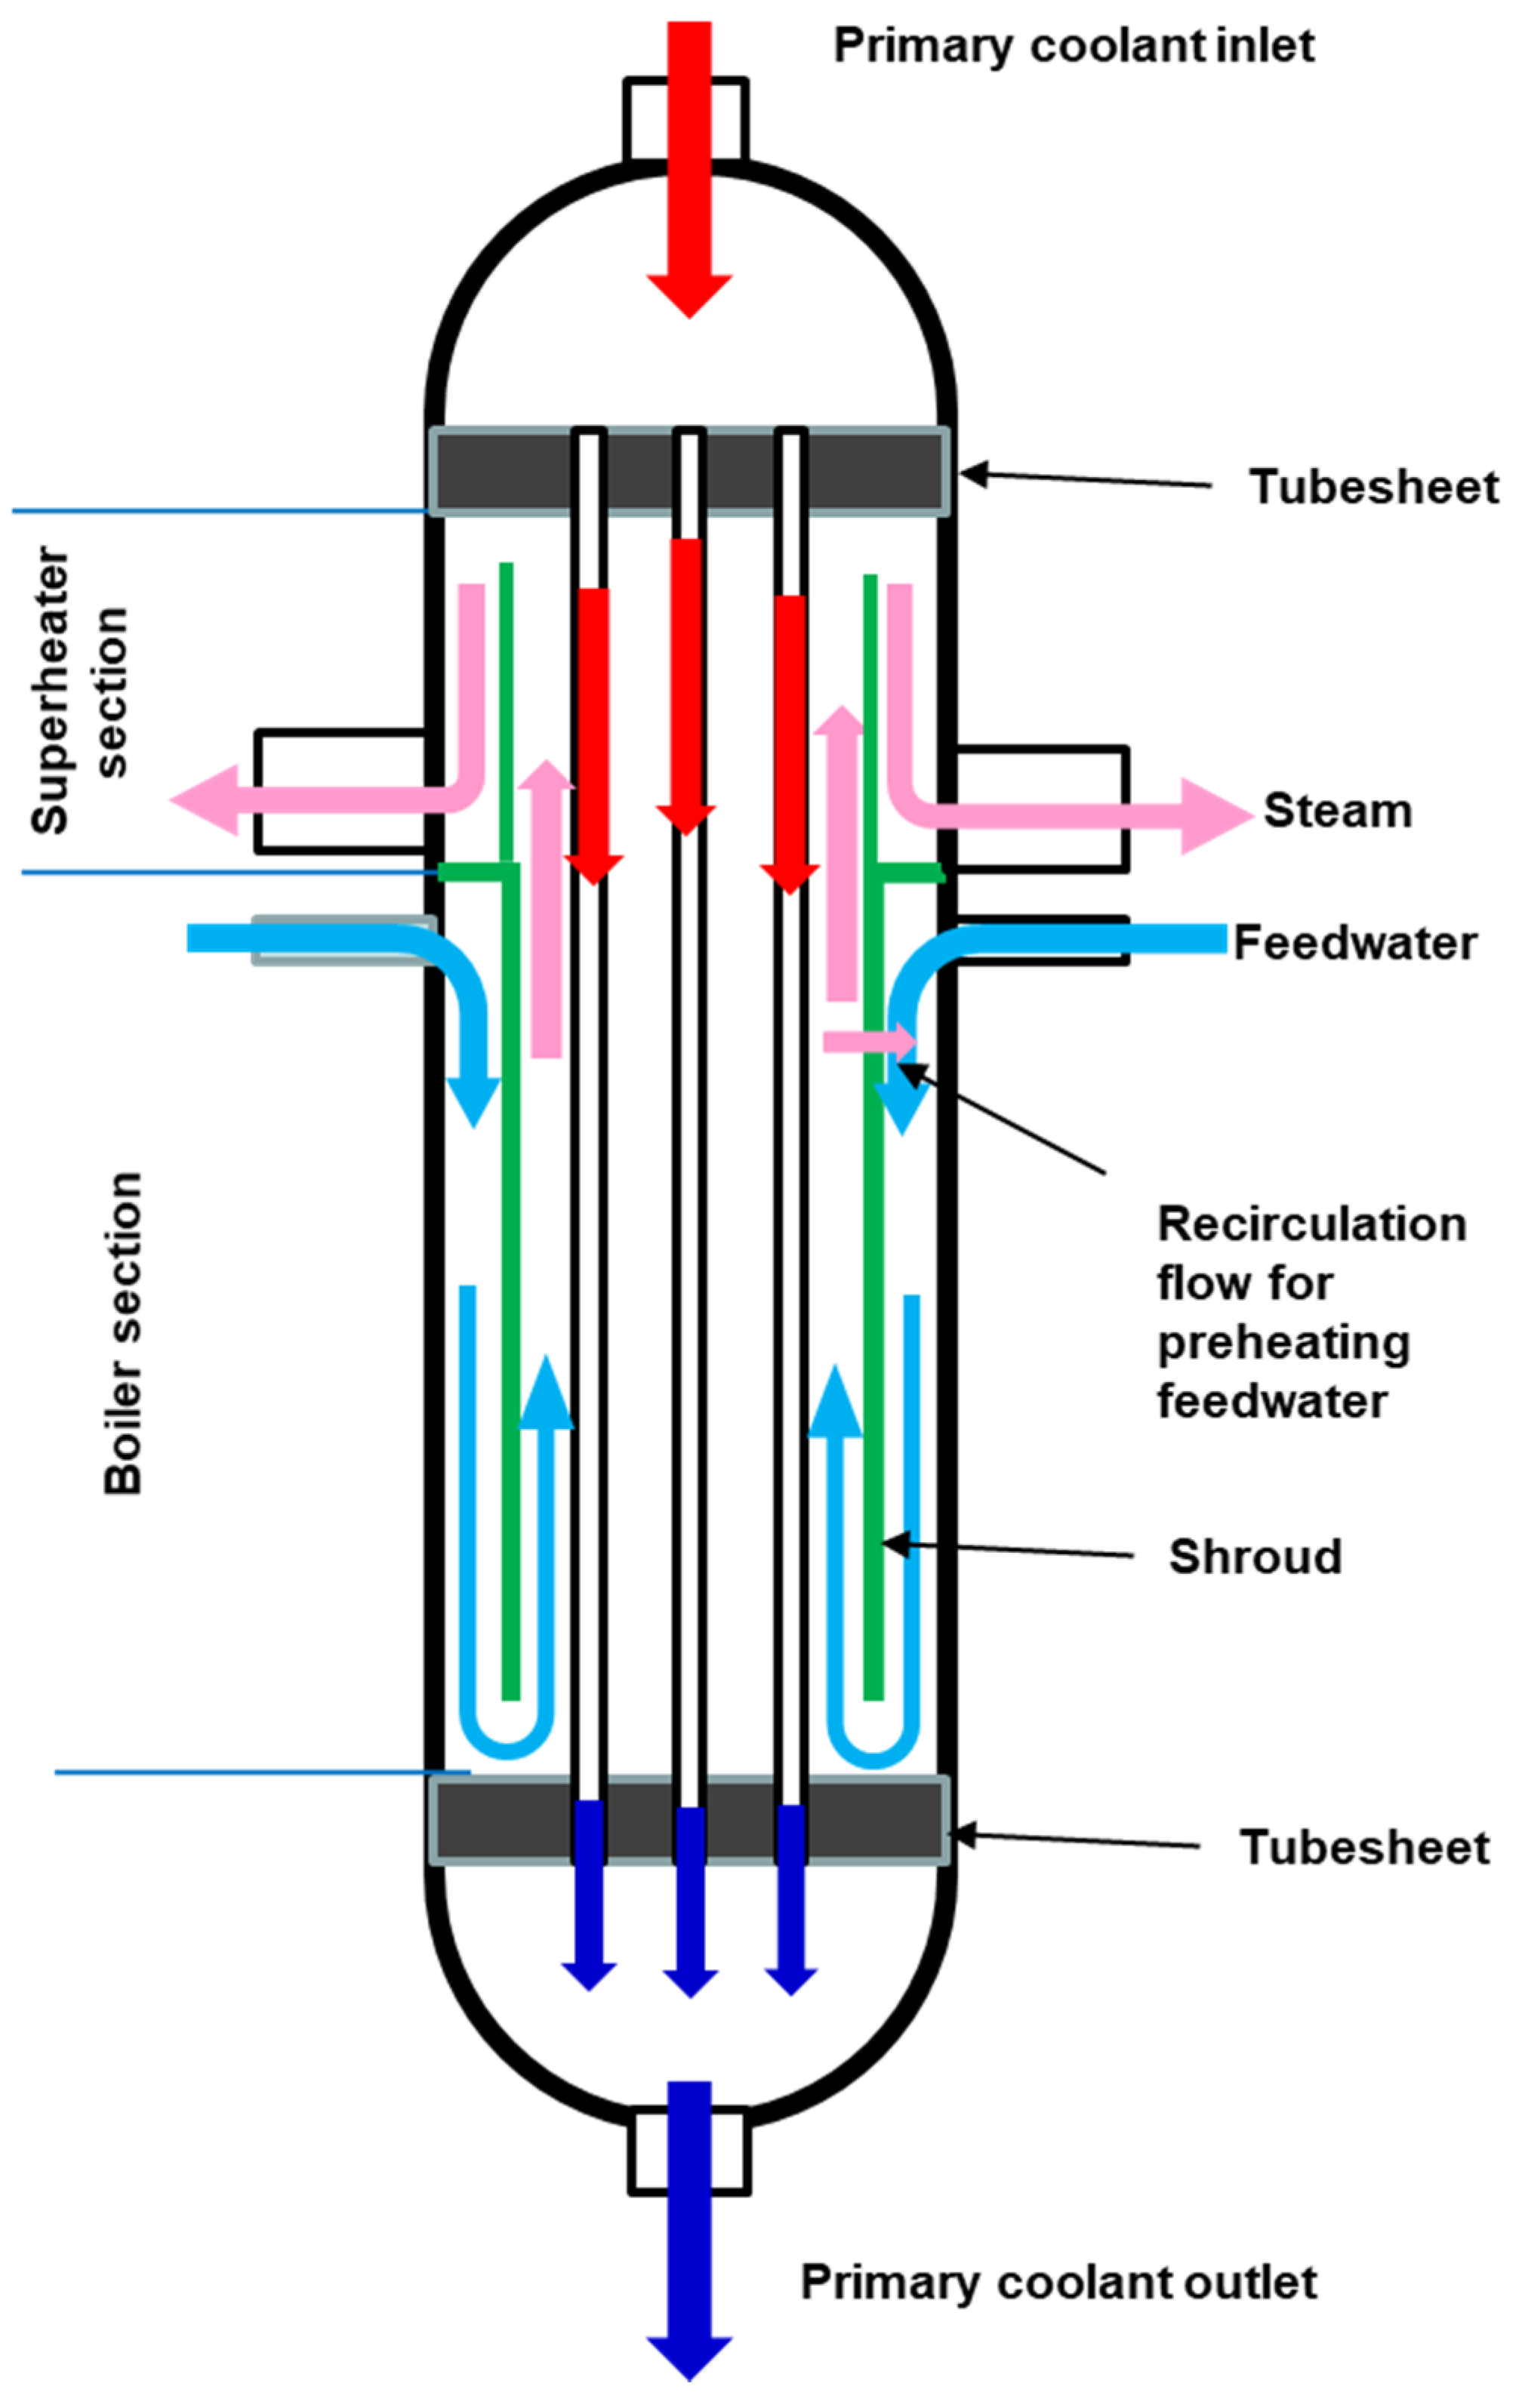
2.2. BZ Once through Steam Generator
2.3. BB and PHTS Integration
3. Postulated Accidental Scenario
4. Nodalization of the WCLL-PHTS
4.1. Boundary Conditions
4.2. Decay Heat
5. Numerical Analyses
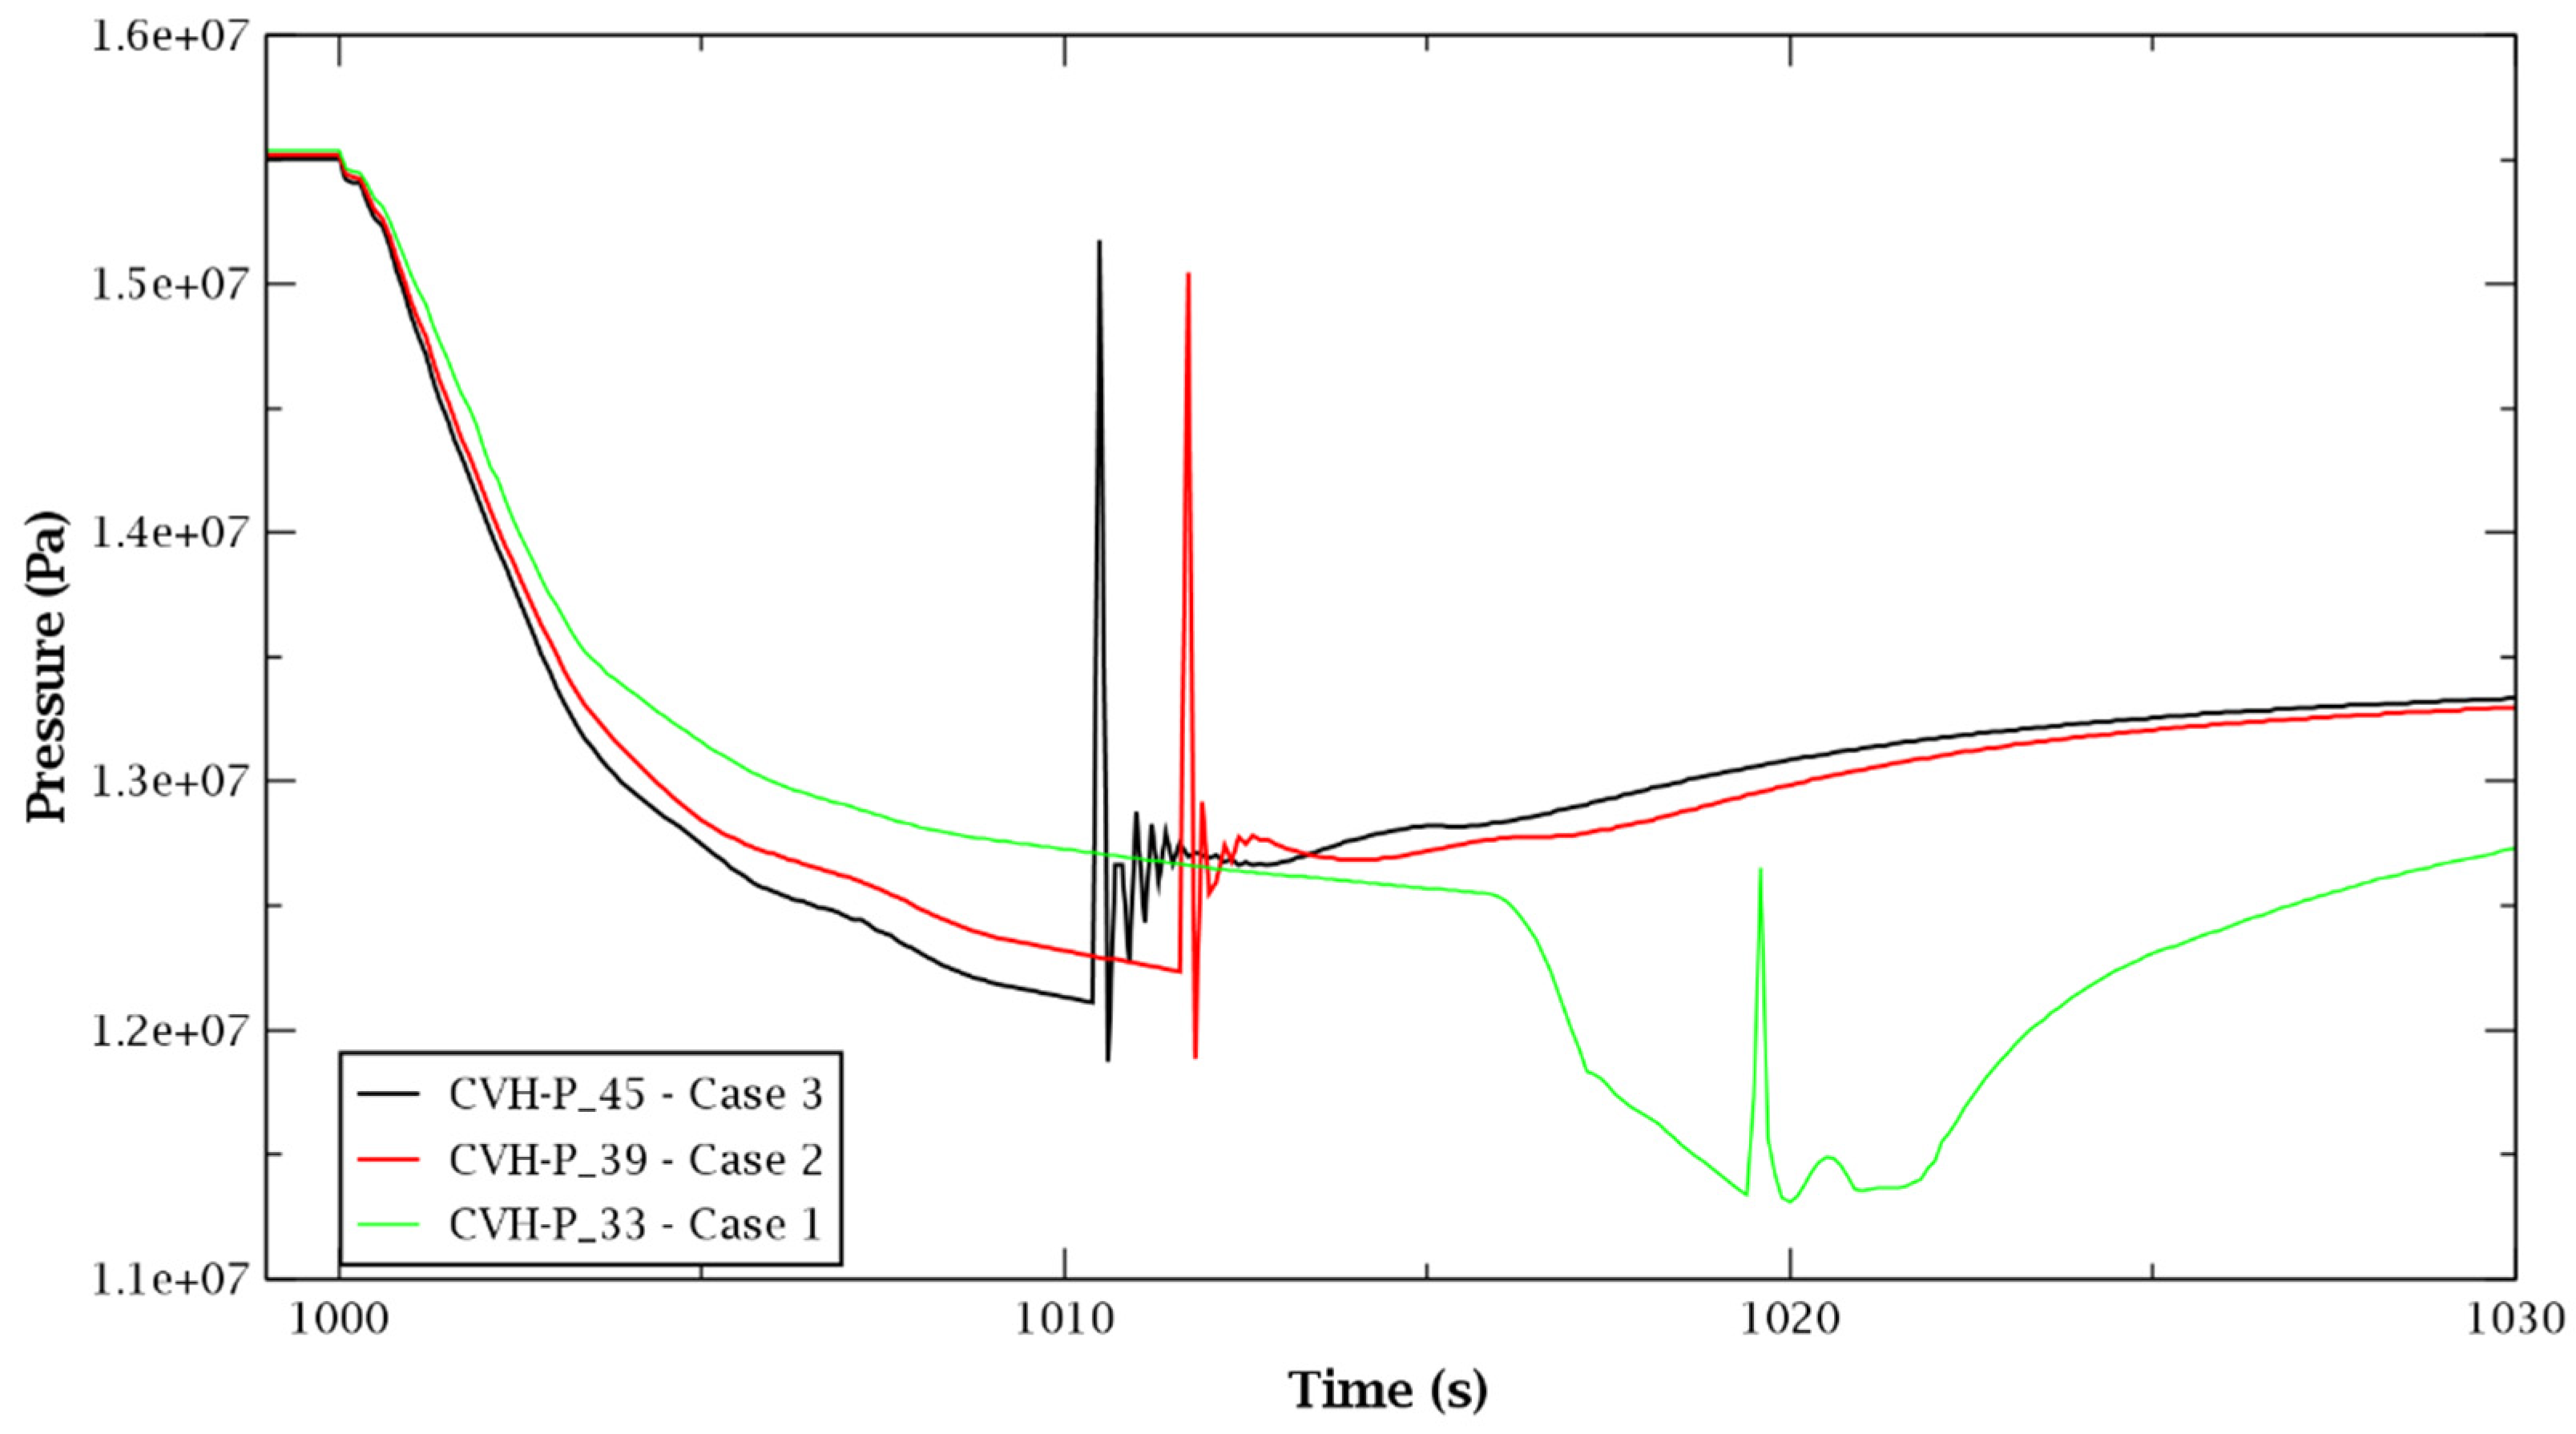
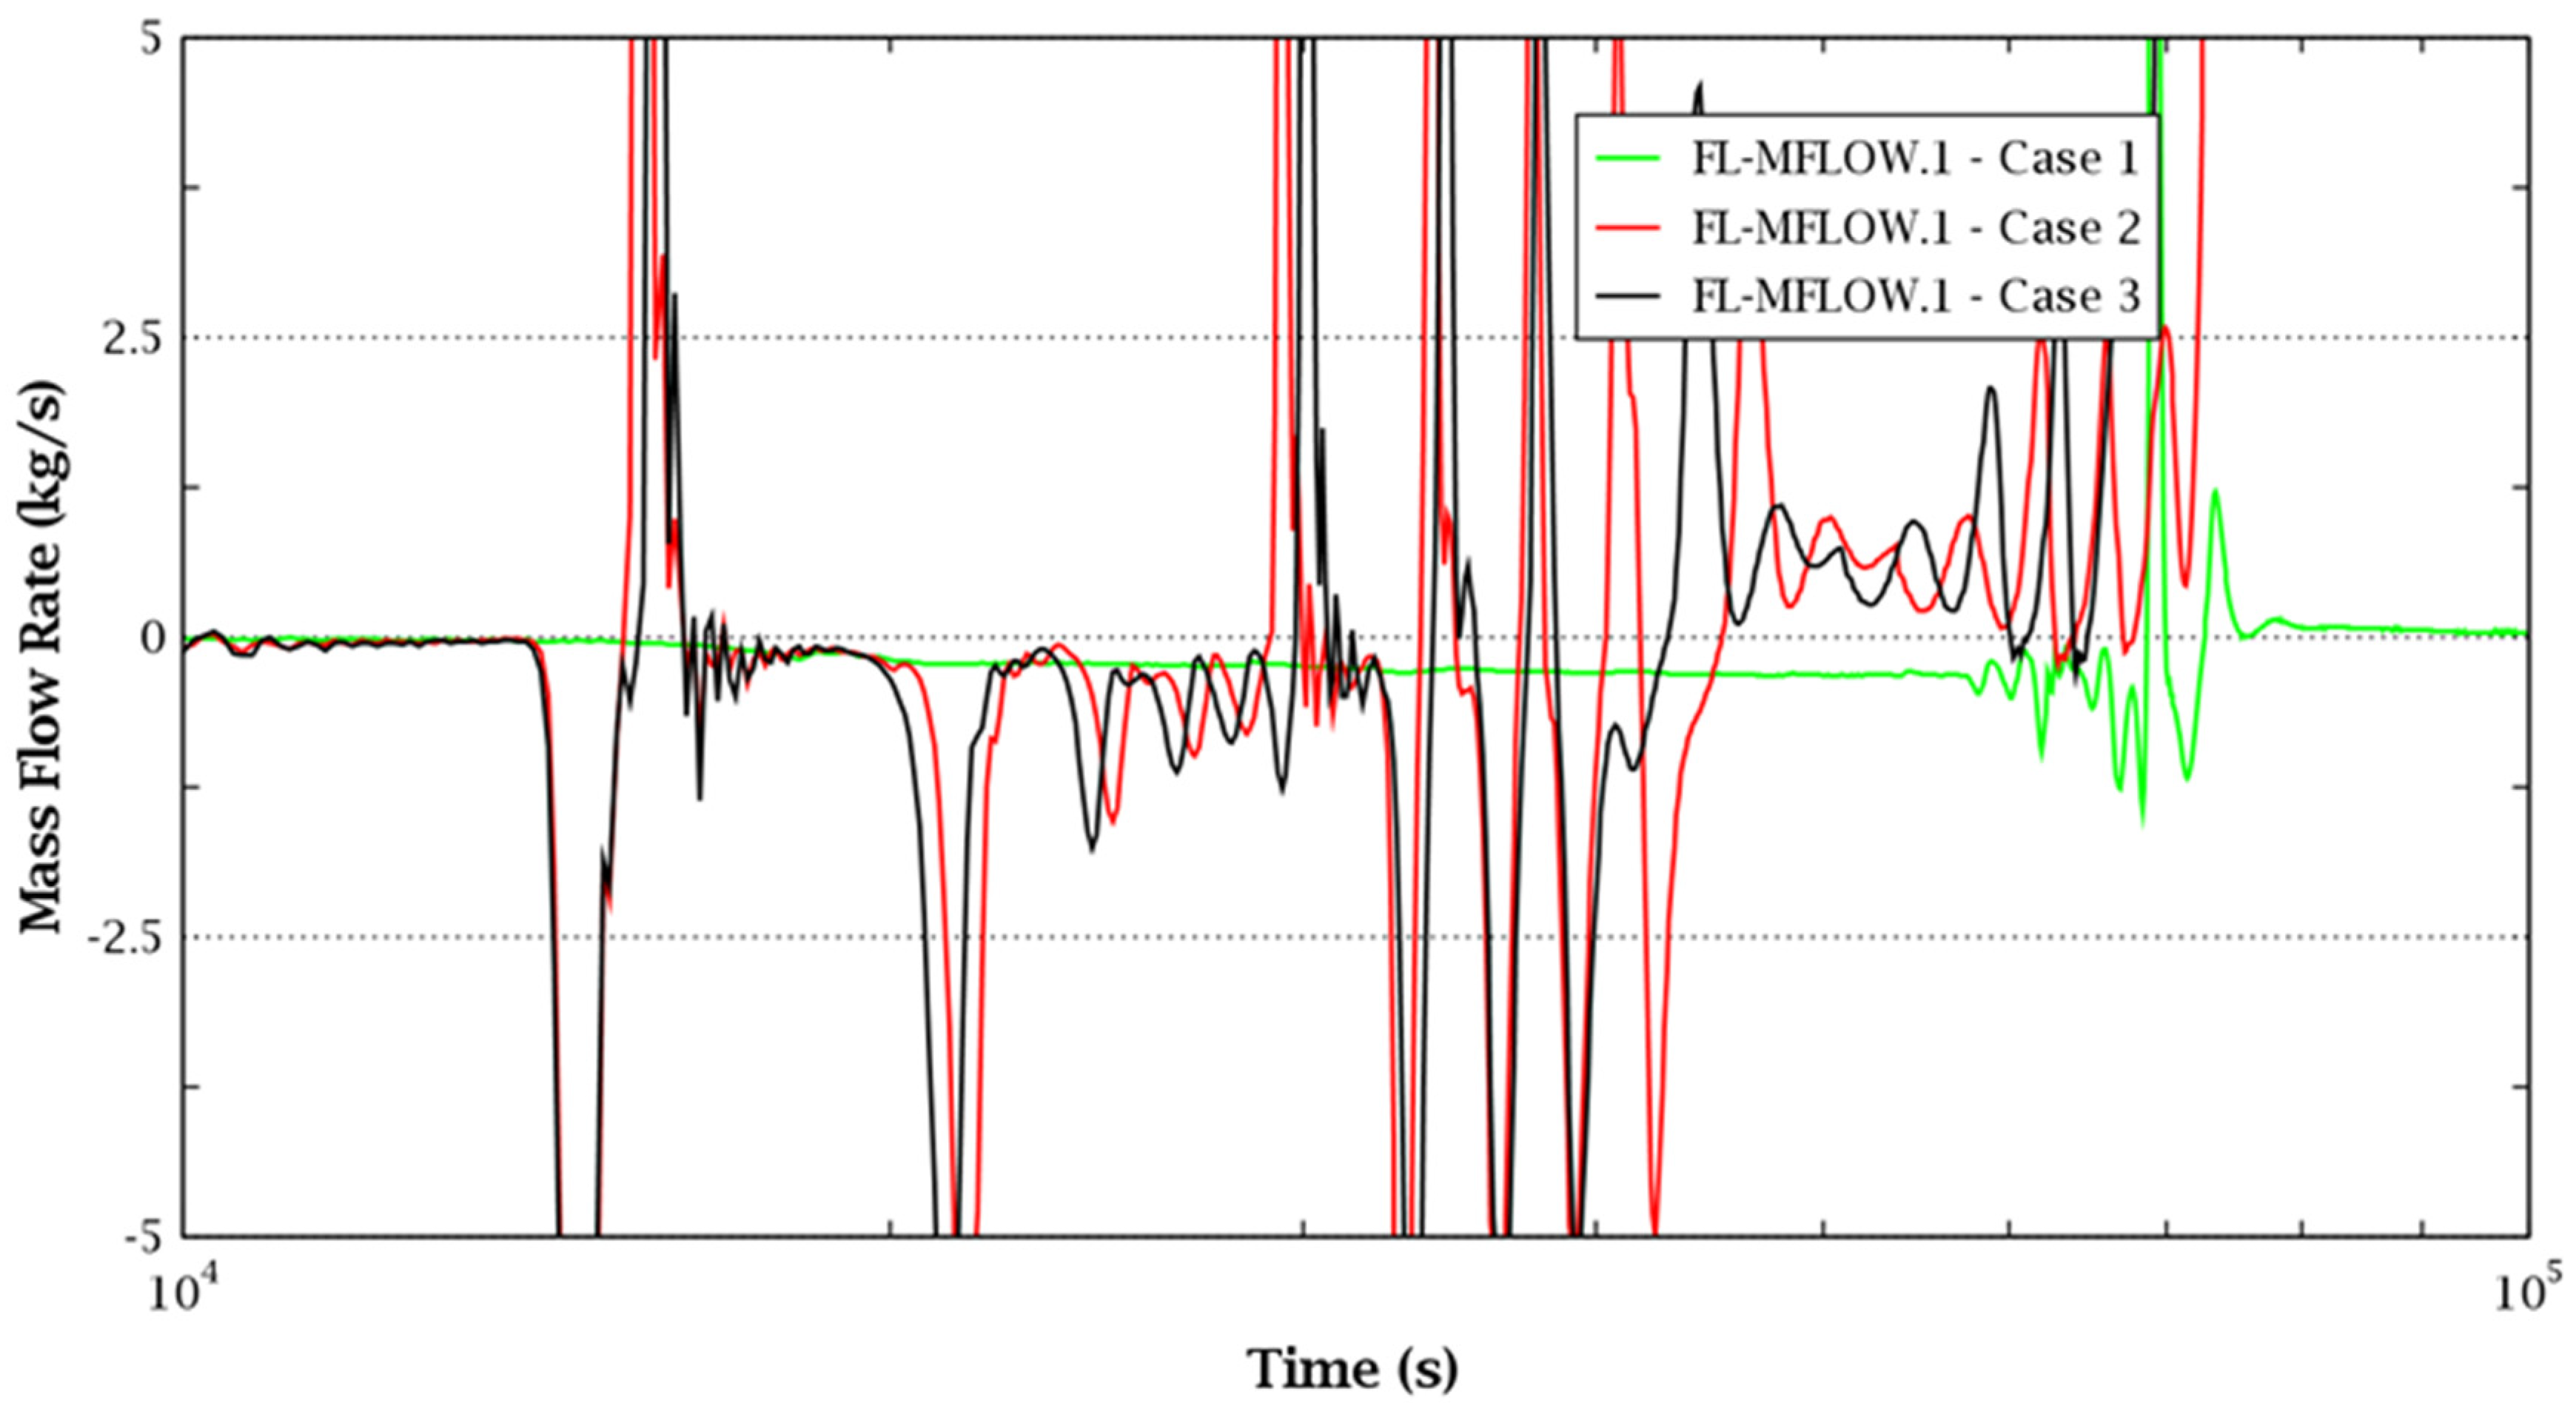
5.1. Pressure Evolution
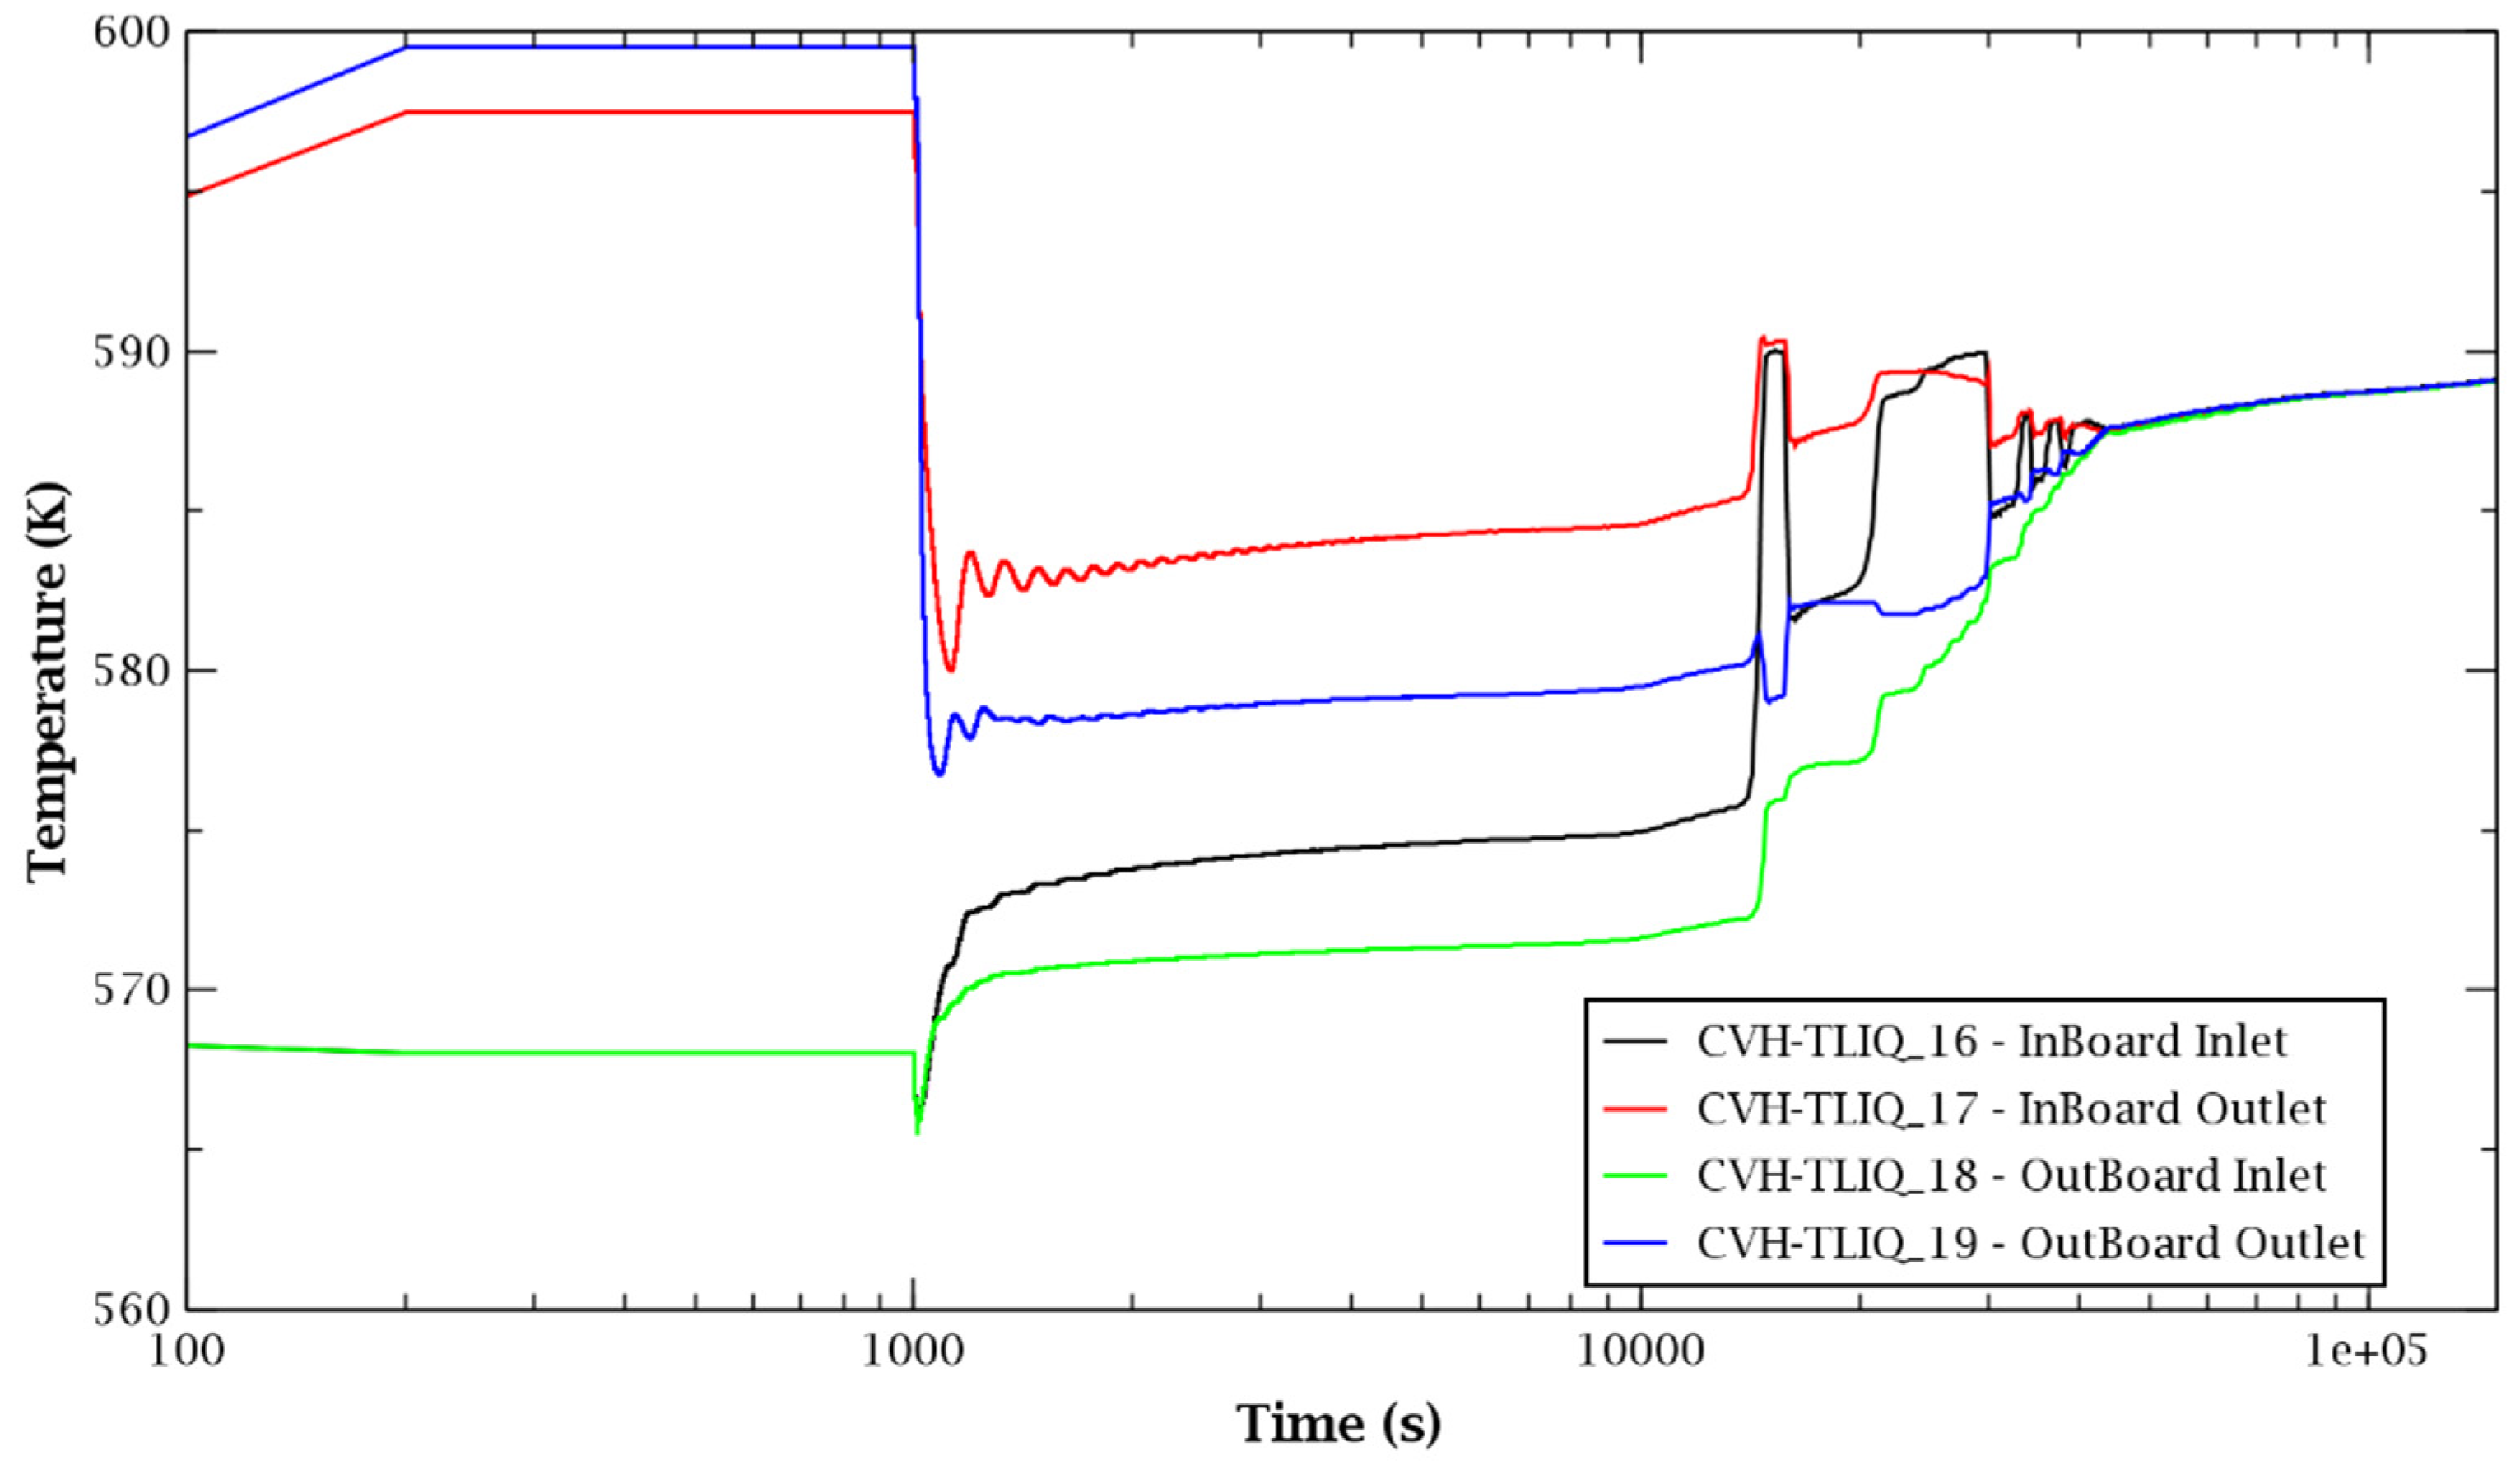
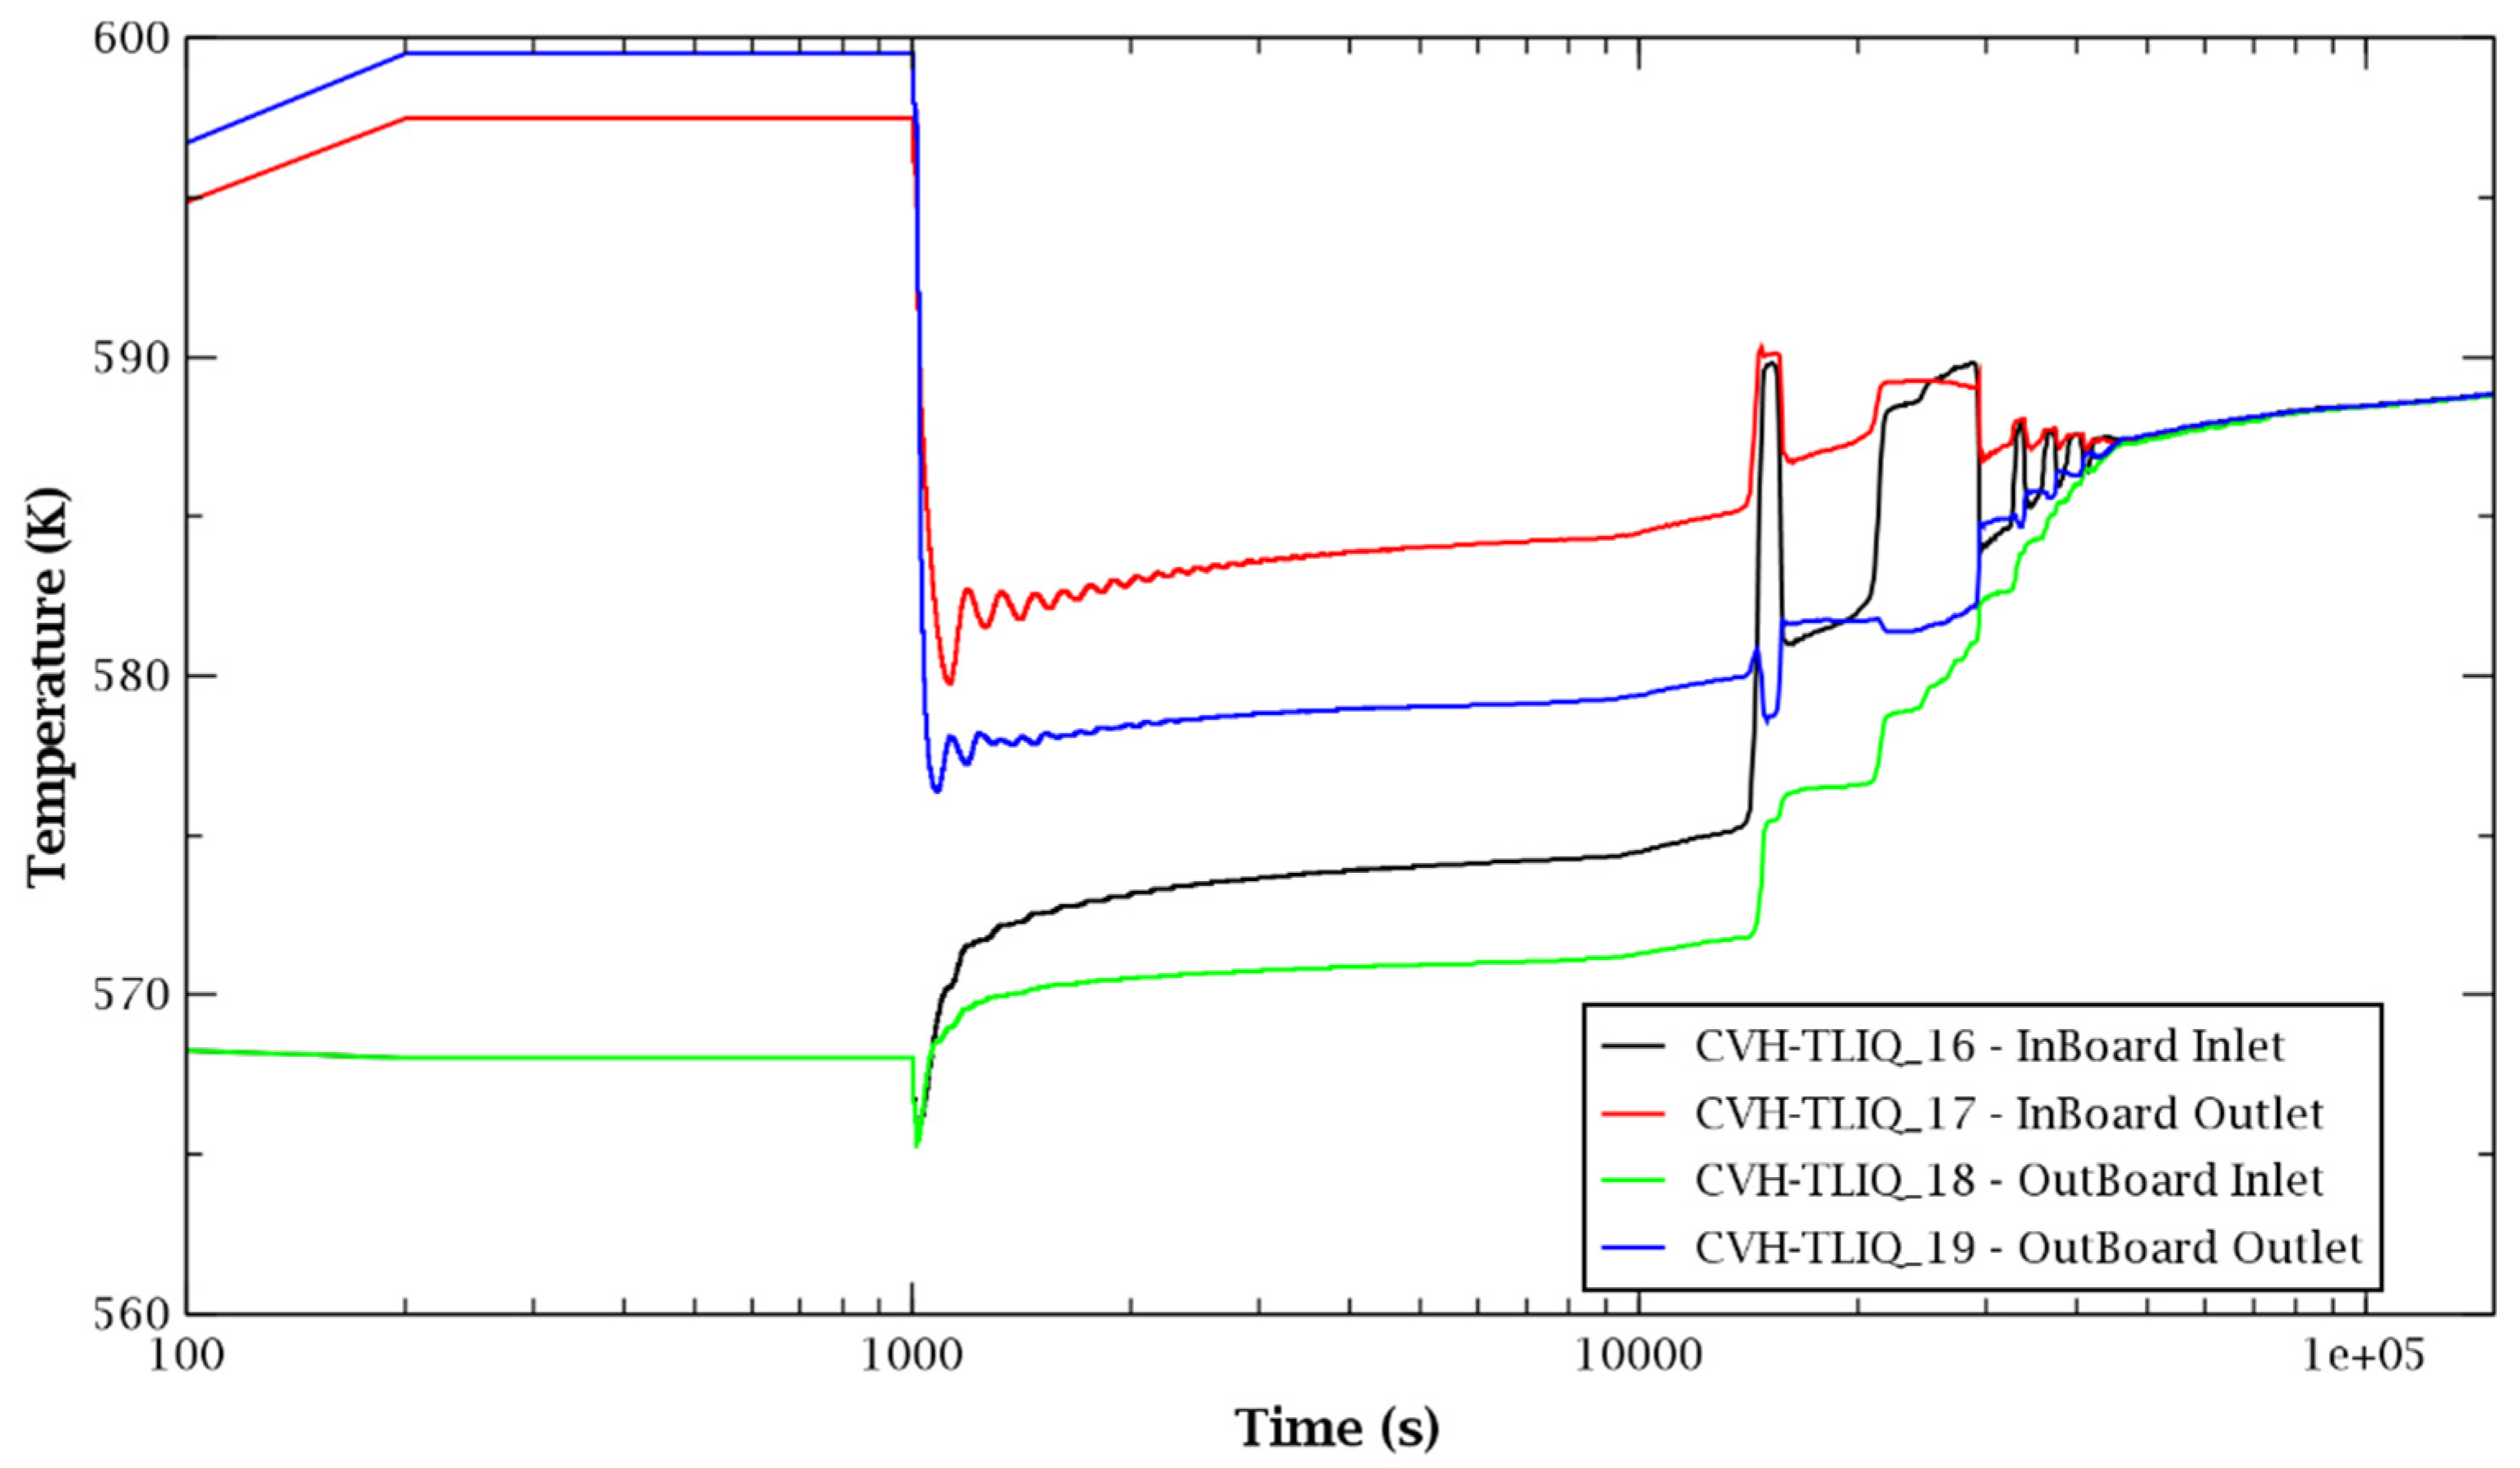
5.2. Temperature Evolution in the BB
6. Conclusions
Author Contributions
Funding
Acknowledgments
Conflicts of Interest
Abbreviations
| ACP | Activate corrosion product |
| BB | Breeder blanket |
| BC | Boundary condition |
| BOP | Balance of plant |
| BSS | Back supporting structure |
| BZ | Breeder zone |
| CAD | Computer=aided design |
| CVH | Control volume hydrodynamics |
| DHR | Decay heat removal |
| DCD | Direct coupling design |
| DEMO | DEMOnstration power plant |
| FL | Flow path |
| FPS | Fast plasma shutdown |
| FW | First wall |
| HT package | Heat structure package |
| IB | Inboard |
| LOCA | Loss of coolant accident |
| OB | Outboard |
| OTSG | Once through steam generator |
| PCS | Power conversion system |
| PHTS | Primary heat transport system |
| PbLi | Lead–lithium |
| PRZ | Pressurizer |
| VV | Vacuum vessel |
| VVPSS | Vacuum vessel pressure suppression system |
| WCLL | Water-cooled lithium lead |
| WPSAE | Work Package Safety and Environment |
References
- Federici, G.; Bachmann, C.; Barucca, L.; Biel, W.; Boccaccini, L.; Brown, R.; Bustreo, C.; Ciattaglia, S.; Cismondi, F.; Coleman, M.; et al. DEMO design activity in Europe: Progress and updates. Fusion Eng. Des. 2018, 136, 729–741. [Google Scholar] [CrossRef]
- Barucca, L.; Bubelis, E.; Ciattaglia, S.; D’Alessandro, A.; Del Nevo, A.; Giannetti, F.; Hering, W.; Lorusso, P.; Martelli, E.; Moscato, I.; et al. Pre-conceptual design of EU DEMO balance of plant systems: Objectives and challenges. Fusion Eng. Des. 2021, 169, 112504. [Google Scholar] [CrossRef]
- Narcisi, V.; Ciurluini, C.; Giannetti, F.; Del Nevo, A. WCLL BB Phts Ddd (Direct Coupling Option with Small ESS). 2020. Report No.: IDM Ref. EFDA_D_2NURWJ. Available online: https://idm.euro-fusion.org/ (accessed on 13 October 2021).
- Del Nevo, A.; Arena, P.; Caruso, G.; Chiovaro, P.; Di Maio, P.A.; Eboli, M.; Edemetti, F.; Forgione, N.; Forte, R.; Froio, A.; et al. Recent progress in developing a feasible and integrated conceptual design of the WCLL BB in EUROfusion project. Fusion Eng. Des. 2019, 146, 1805–1809. [Google Scholar] [CrossRef] [Green Version]
- Zaupa, M.; Palma, M.D.; Del Nevo, A.; Moscato, I.; Tarallo, A.; Barucca, L. Preliminary Thermo-Mechanical Design of the Once Through Steam Generator and Molten Salt Intermediate Heat Exchanger for EU DEMO. IEEE Trans. Plasma Sci. 2020, 48, 1726–1732. [Google Scholar] [CrossRef]
- Martelli, E.; Giannetti, F.; Ciurluini, C.; Caruso, G.; Del Nevo, A. Thermal-hydraulic modeling and analyses of the water-cooled EU DEMO using RELAP5 system code. Fusion Eng. Des. 2019, 146, 1121–1125. [Google Scholar] [CrossRef]
- Ciurluini, C.; Giannetti, F.; Martelli, E.; Del Nevo, A.; Barucca, L.; Caruso, G. Analysis of the thermal-hydraulic behavior of the EU-DEMO WCLL breeding blanket cooling systems during a loss of flow accident. Fusion Eng. Des. 2021, 164, 112206. [Google Scholar] [CrossRef]
- Merrill, B.; Moore, R.; Polkinghorne, S.; Petti, D. Modifications to the MELCOR code for application in fusion accident analyses. Fusion Eng. Des. 2000, 51–52, 555–563. [Google Scholar] [CrossRef]
- Merrill, B.J. Recent Updates to the MELCOR 1.8. 2 Code for ITER Applications; Idaho National Laboratory (INL): Idaho Falls, ID, USA, 2007. [Google Scholar]
- Merrill, B.J.; Humrickhouse, P.; Moore, R.L. A recent version of MELCOR for fusion safety applications. Fusion Eng. Des. 2010, 85, 1479–1483. [Google Scholar] [CrossRef]
- D’Ovidio, G.; Martín-Fuertes, F. Accident analysis with MELCOR-fusion code for DONES lithium loop and accelerator. Fusion Eng. Des. 2019, 146, 473–477. [Google Scholar] [CrossRef]
- Grief, A.; Owen, S.; Murgatroyd, J.; Panayotov, D.; Merrill, B.; Humrickhouse, P.; Saunders, C. Qualification of MELCOR and RELAP5 models for EU HCLL TBS accident analyses. Fusion Eng. Des. 2017, 124, 1165–1170. [Google Scholar] [CrossRef]
- Panayotov, D.; Grief, A.; Merrill, B.J.; Humrickhouse, P.; Trow, M.; Dillistone, M.; Murgatroyd, J.T.; Owen, S.; Poitevin, Y.; Peers, K.; et al. Methodology for accident analyses of fusion breeder blankets and its application to helium-cooled pebble bed blanket. Fusion Eng. Des. 2015, 109–111, 1574–1580. [Google Scholar] [CrossRef]
- Nakamura, M.; Tobita, K.; Someya, Y.; Utoh, H.; Sakamoto, Y.; Gulden, W. Safety research on fusion DEMO in Japan: Toward development of safety strategy of a water-cooled DEMO. Fusion Eng. Des. 2016, 109–111, 1417–1421. [Google Scholar] [CrossRef]
- Pescarini, M.; Mascari, F.; Mostacci, D.; De Rosa, F.; Lombardo, C.; Giannetti, F. Analysis of unmitigated large break loss of coolant accidents using MELCOR code. J. Phys. Conf. Ser. 2017, 923, 012009. [Google Scholar] [CrossRef] [Green Version]
- D’Onorio, M.; Giannetti, F.; Porfiri, M.T.; Caruso, G. Preliminary safety analysis of an in-vessel LOCA for the EU-DEMO WCLL blanket concept. Fusion Eng. Des. 2020, 155, 111560. [Google Scholar] [CrossRef]
- D’Onorio, M.; Giannetti, F.; Porfiri, M.T.; Caruso, G. Preliminary sensitivity analysis for an ex-vessel LOCA without plasma shutdown for the EU DEMO WCLL blanket concept. Fusion Eng. Des. 2020, 158, 111745. [Google Scholar] [CrossRef]
- Narcisi, V.; Giannetti, F.; Del Nevo, A. WCLL BB PHTS Architecture Description & BOM (Direct Coupling Option with Small ESS). Report No.: IDM Ref. EFDA_D_2PC2N9. Available online: https://idm.euro-fusion.org/ (accessed on 13 October 2021).
- Tarallo, A. WCLL BB PHTS CAD Model Description (Direct Coupling Option with Small ESS). Report No.: IDM Ref. EFDA_D_2P9QFM. 2020. Available online: https://idm.euro-fusion.org/ (accessed on 13 October 2021).
- Tarallo, A. WCLL BB PHTS Drawings (Direct Coupling Option with Small ESS). Report No.: IDM Ref. EFDA_D_2P95DT. 2020. Available online: https://idm.euro-fusion.org/ (accessed on 13 October 2021).
- Tarallo, A. Preliminary Mechanical Design and Verification of WCLL BB PHTS Once through Steam Generator (OTSG). Report No.: IDM Ref EFDA_D_2MT7PL. 2020. Available online: https://idm.euro-fusion.org/ (accessed on 13 October 2021).
- Tarallo, A. WCLL OTSG CAD Model. Report No.: IDM Ref. UID 2NJQM8. 2020. Available online: https://idm.euro-fusion.org/ (accessed on 13 October 2021).
- Catanzaro, I.; Arena, P.; Basile, S.; Bongiovì, G.; Chiovaro, P.; Del Nevo, A.; Di Maio, P.A.; Forte, R.; Maione, I.A.; Vallone, E. Structural assessment of the EU-DEMO WCLL Central Outboard Blanket segment under normal and off-normal operating conditions. Fusion Eng. Des. 2021, 167, 112350. [Google Scholar] [CrossRef]
- Porfiri, M.T.; Mazzini, G. DEMO BB Safety Data List (SDL). Report No.: IDM Ref. EFDA_D_2MF8KU. 2018. Available online: https://idm.euro-fusion.org/ (accessed on 13 October 2021).


| Description | Units | Parameters |
|---|---|---|
| Typology of coolant | Water | |
| Pressure | MPa | 15.5 |
| Temperature range | °C | 295–328 |
| Coolant density (average) | kg/m3 | 701.3 |
| Design pressure | MPa | 17.8 |
| Design temperature | °C | 345 |
| Total flow rate | kg/s | 9936.0 |
| FW flow rate Inboard (IB) blanket Outboard (OB) blanket | kg/s | 17.8 35.5 |
| BZ flow rate IB blanket OB blanket | kg/s | 48.2 127.5 |
| Description | Unit | WCLL 2018 Design |
|---|---|---|
| Total nuclear heating | MW | 1650.3 |
| Total FW Heat Flux | MW | 272.7 |
| Neutron Wall Load | MW | 167.0 |
| Total FW power | MW | 439.8 |
| Total BZ power | MW | 1483.2 |
| Total power | MW | 1923.2 |
| Description | Power (MW) | Mass Flow Rate (kg/s) | ||||
|---|---|---|---|---|---|---|
| ---- | Total | FW | BZ | Total | FW | BZ |
| IB segment | 12.780 | 3.449 | 9.331 | 66.0 | 17.8 | 48.2 |
| IB sector | 25.560 | 6.898 | 18.662 | 132.0 | 35.6 | 96.4 |
| Total IB sectors (16) | 409.960 | 110.368 | 298.592 | 2112.0 | 569.6 | 1542.4 |
| OB segment | 31.545 | 6.867 | 24.678 | 163.0 | 35.5 | 127.5 |
| OB sector | 94.635 | 20.601 | 74.034 | 489.0 | 106.5 | 382.5 |
| Total OB sectors (16) | 1514.160 | 329.616 | 1184.54 | 7824. | 1704. | 6120. |
| Total reactor | 1923.120 | 439.984 | 1483.136 | 9936.0 | 2273.6 | 7662.4 |
| WCLL DCD BOP BB PHTS Design and Operating Parameters | BZ | FW |
|---|---|---|
| General | ||
| Thermal power (MW) | 1483 | 439.8 |
| Operating pressure (MPa) | 15.5 | 15.5 |
| Reactor vessel inlet temperature (°C) | 295 | 295 |
| Reactor vessel outlet temperature (°C) | 328 | 328 |
| Overall volume (m3) | ~563 | ~159 |
| Overall PHTS piping length (km) | ~3.2 | ~3.7 |
| Number of loops | 2 | 2 |
| Loop data | ||
| Piping length (km) | ~1.25 | ~1.52 |
| Hot/cold manifolds per loop and size | 8/8 DN-150, DN-200, DN-350 | 8/8 DN-100, DN-125, DN-200 |
| Hot/cold legs per loop and size | 1/2 DN-850, DN-650 | 1/1 DN-500, DN-500 |
| Hot/cold ring header per loop and size | 1/2 DN-650 | 1/1 DN-350 |
| Pump | ||
| Number of pumps per loop | 2 | 1 |
| Type | Centrifugal, vertical single-stage (RSR) | Centrifugal, vertical single-stage (RSR) |
| Effective pump power to coolant (MW) | 3.03 | 1.79 |
| Pressurizer | ||
| Number of units | 1 | 1 |
| Total volume (m3) | 101.4 | 32.5 |
| Liquid volume (m3) | 44.8 | 16.3 |
| Heat Exchanger (Steam Generator) | ||
| Number of units | 2 | 2 |
| Steam generator power (MWth/unit) | 742 | 219.9 |
| Type | OTSG | OTSG |
| Heat transfer area (m2/unit) | 4903 | 1423 |
| Feedwater temperature (°C) | 238 | 238 |
| Exit steam pressure (MPa) | 6.4 | 6.4 |
| Steam flow per SG (kg/s) | 404 | 119.9 |
| Flow rate per SG (kg/s) | 3831.2 | 1136 |
| SG Power | MWth | 742 |
|---|---|---|
| Primary side pressure | MPa | 15.5 |
| Primary side water Tin | °C | 328 |
| Primary side water Tout | °C | 295 |
| Secondary side pressure | MPa | 6.41 |
| Secondary side water Tin | °C | 238 |
| Secondary side water Tout | °C | 299 |
| No. of tubes | -- | 7569 |
| Tube OD | mm | 15.88 |
| Tube thickness | mm | 0.864 |
| Tube length | m | 12.987 |
| Tubesheet lattice | -- | Square |
| Tubesheet p/D | -- | 1.28 |
| Heat transfer area | m2 | 4903 |
| V water tubes | m3 | 20 |
| Dext vessel | m | 2.9 |
| Description | Pipe Size | OD (mm) | Thick. (mm) | MF Total (kg/s) | v (m/s) | L (m) | L Tot (m) | V (m3) | H2O Mass Inventory (kg) |
|---|---|---|---|---|---|---|---|---|---|
| Inlet IB FW distributor | DN-100 | 114.3 | 8.8 | 35.6 | 6.6 | 17.6 | 281.2 | 2.07 | 1522.21 |
| Inlet IB FW LIBS/RIBS | DN-100 | 114.3 | 8.8 | 17.8 | 3.3 | 5.8 | 186.5 | 1.37 | 1009.43 |
| Outlet IB FW LIBS/RIBS | DN-100 | 114.3 | 8.8 | 17.8 | 3.7 | 6.4 | 203.9 | 1.50 | 984.62 |
| Outlet IB FW collector | DN-100 | 114.3 | 8.8 | 35.6 | 7.4 | 17.6 | 281.2 | 2.07 | 1357.82 |
| Inlet IB BZ distributor | DN-200 | 219.1 | 17.5 | 96.4 | 4.9 | 17.5 | 280.3 | 7.46 | 5500.35 |
| Inlet IB BZ LIBS/RIBS | DN-150 | 168.3 | 12.7 | 48.2 | 4.1 | 4.0 | 128.1 | 2.05 | 1513.83 |
| Outlet IB BZ LIBS/RIBS | DN-150 | 168.3 | 12.7 | 48.2 | 4.6 | 4.7 | 149.1 | 2.39 | 1572.12 |
| Outlet IB BZ collector | DN-200 | 219.1 | 17.5 | 96.4 | 5.5 | 17.5 | 279.9 | 7.45 | 4898.97 |
| Inlet OB FW distributor | DN-200 | 219.1 | 17.5 | 106.5 | 5.4 | 11.3 | 180.8 | 4.81 | 3548.13 |
| Inlet OB FW COBS | DN-125 | 139.7 | 11.0 | 35.5 | 4.4 | 7.9 | 126.4 | 1.38 | 1013.89 |
| Inlet OB FW LOBS/ROBS | DN-125 | 139.7 | 11.0 | 35.5 | 4.4 | 9.2 | 293.9 | 3.20 | 2357.06 |
| Outlet OB FW COBS | DN-125 | 139.7 | 11.0 | 35.5 | 5.0 | 8.3 | 133.1 | 1.45 | 952.47 |
| Outlet OB FW LOBS/ROBS | DN-125 | 139.7 | 11.0 | 35.5 | 5.0 | 9.4 | 301.6 | 3.28 | 2157.42 |
| Outlet OB FW collector | DN-200 | 219.1 | 17.5 | 106.5 | 6.1 | 11.5 | 183.3 | 4.88 | 3208.51 |
| Inlet OB BZ distributor | DN-350 | 355.6 | 28.0 | 382.4 | 7.4 | 10.6 | 170.3 | 12.00 | 8847.80 |
| Inlet OB BZ COBS | DN-200 | 219.1 | 17.5 | 127.5 | 6.5 | 7.0 | 111.5 | 2.97 | 2187.86 |
| Inlet OB BZ LOBS/ROBS | DN-200 | 219.1 | 17.5 | 127.5 | 6.5 | 7.4 | 236.1 | 6.29 | 4633.48 |
| Outlet OB BZ COBS | DN-200 | 219.1 | 17.5 | 127.5 | 7.3 | 7.7 | 122.7 | 3.27 | 2147.62 |
| Outlet OB BZ LOBS/ROBS | DN-200 | 219.1 | 17.5 | 127.5 | 7.3 | 8.4 | 267.9 | 7.13 | 4688.31 |
| Outlet OB BZ collector | DN-350 | 355.6 | 28.0 | 382.4 | 8.2 | 11.0 | 176.3 | 12.43 | 8172.15 |
| Total | 4094.1 | 89.44 | 62,274.06 |
| Parameter | Specification |
|---|---|
| Name of event | LBO3 out-vessel loss of coolant from the breeder primary loop due to large rupture of tubes in a primary HX in WCLL concept |
| Category | Accident |
| Objectives | Show that accidental overpressure in the secondary loop of PHTS will be safely accommodated. Show that post-accident cooling of the decay heat removal system of the VV is sufficient to remove decay heat during the 32 h of the offsite loss of power. Show that radioactive releases, if any, are adequately confined. |
| Scope of analysis | Integrated breeder blanket PHTS thermohydraulic analysis. VV, VVPSS(W) pressure transient analysis if melting occurs due to mitigated plasma disruption. Analysis of ACPs and tritium transport in the containment volumes as a consequence of the plasma disruption, if melting occurs. |
| Acceptance criteria | Maximum Eurofer temperature < 550 °C Confinement integrity: BB module safety assessment pressure < 18 MPa Confinement integrity: VV safety assessment pressure < 200 kPa |
| Parameter | Specification |
|---|---|
| Definition of initiating event | Break in the primary cooling loop side (break size 0.0028 m2, corresponding to the rupture of 9 tubes of the primary side) inside the HX toward the secondary side. |
| Possible transient sequence | Fusion power is terminated by loss of pressure (−20% of operating pressure) in the BB cooling loop inside the HX. The initiating event is followed by a fast plasma shutdown (FPS) actuated 3 s from the low signal, which leads to a mitigated plasma disruption for 5 ms. The disruption could cause failure of the FW cooling pipes in a BB module if temperature melting is reached in FW Eurofer. In such a case, the break flow area to be considered is reported in [SDL19], chapter 2.1. The VV decay heat removal cooling loops will cool down the in-vessel components post accident. Ingress of coolant and radioactive inventories (tritium, dust, and suspended products) will be mobilized. The rupture discs toward the VVPSS(W) open upon reaching the set VV pressure point. Mobilized radioactivity is transported into the VVPSS(W). After the coolant inventory is lost, the FW/breeder blanket modules will be cooled by steam convection and thermal conduction/radiation to the VV. The DV components are accounted for in this analysis as heat structures at the initial temperature and without cooling during the transient. |
| Aggravating failures | None. |
| Loss of power | A loss of offsite power occurs at the same time of the plasma disruption. |
| Parameter | Specification |
|---|---|
| Process system assumptions | VV decay heat removal (DHR) will remove the decay heat. The temperature of the VV is maintained at 40 °C by DHR. |
| Safety systems assumptions | VV pressure limit is 0.2 MPa. VVPSS(W) rupture discs open upon reaching the VV pressure set point. |
| Source term | Tritium, dust in the VV, ACP products in the PHTS, tritium and activated products in the breeder materials and/or purge gas. |
| Parameter | Specification |
|---|---|
| General | The output locations, parameters, and time trace should show the results of safety analyses to support objectives and purposes. The time span should cover until the transients are stabilized. |
| FW temperature | Transient curve for FW and BB module temperature of the failed loop. |
| Confinement response | Pressures and atmosphere temperature in BB cooling loop, HX. Pressures and atmosphere temperature in VV and VVPSS(W) only in case of FW Eurofer structure melting. |
| Cooling system conditions | Water break flow versus time in HX and in VV and VVPSS(W) only in case of FW Eurofer structure melting. Water inventory inside the affected FW/breeder blanket cooling system. |
| Radioactive transport | Transient curves for tritium, dust, and sputtering concentration (airborne, deposited) in VVPSS(W) if FW structure melts. Bookkeeping of mobilized tritium, dust, and sputtering products if FW structure melts. |
| Nodalization CVH | Volume Water (m3) | Height/Length (m) | Section (m2) | Description |
|---|---|---|---|---|
| Primary side | ||||
| 1 | 3.22 | 1.15 | 4.18 | Top hemisphere |
| 2 | 0.72 | 0.61 | 1.18 | Top tubesheet |
| 31–46 | 15.36 | 0.7825 | 1.18 | Shroud tubes primary |
| 4 | 0.72 | 0.61 | 1.18 | Bottom tubesheet |
| 5 | 3.22 | 1.15 | 4.18 | Bottom hemisphere |
| Secondary side | ||||
| 6 | 12.65 | 7.63 | 1.66 | Shell boiler |
| 71–86 | 34.09 | 12.70 | 2.68 | Shroud secondary |
| 8 | 1.81 | 0.30 | 6.03 | Steam chamber |
| 9 | 8.42 | 5.08 | 1.66 | Shell SH |
| Rings and BB | ||||
| 12 | 36.04 | 146.5 | 0.246 | Hot ring |
| 13 | 36.04 | 146.5 | 0.246 | Cold ring |
| 16 | 7.73 | 17.9 | 0.027 | Cold ring distributors IB |
| 18 | 14.67 | 13.1 | 0.07 | Cold ring distributors OB |
| 17 | 7.99 | 18.5 | 0.027 | Hot ring collectors IB |
| 19 | 15.9 | 14.2 | 0.07 | Hot ring collectors OB |
| 14 | 73.7 | 14.7 | - | BB inboard |
| 15 | 121.616 | 12.3 | - | BB outboard |
| Nodalization FL | From CVH | To CVH | From Height (m) | To Height (m) | Section (m2) | Hydraulic Diameter (m) | Length (m) |
|---|---|---|---|---|---|---|---|
| Primary side | |||||||
| FL00100 | 12 | 1 | 4.25 | 16.5272 | 0.4117 | 0.724 | 45 |
| FL00200 | 1 | 2 | 15.3732 | 15.3732 | 1.1818 | 1.2267 | 0 |
| FL00300 | 2 | 31 | 14.7636 | 14.7636 | 1.1818 | 1.2267 | 0 |
| FL03100 TO FL04600 | (31) | (46) | 13.9811 | 13.9491 | 1.1818 | 0.0141 | 0.032 |
| FL00400 | 46 | 4 | 1.7636 | 1.7636 | 1.1818 | 1.2267 | 0 |
| FL00500 | 4 | 5 | 1.154 | 1.154 | 1.1818 | 1.2267 | 0 |
| Secondary side | |||||||
| FL00600 | 10 | 6 | 9 | 9 | 0.198639 | 0.0889 | 0 |
| FL07100 TO FL08600 | (71) | (86) | 13.9491 | 13.9811 | 0.89466 | 0.012636 | 0.032 |
| FL00700 | 6 | 71 | 2.2 | 2.2 | 4.330349 | 0.84579 | 0 |
| FL00800 | 86 | 8 | 14.4636 | 14.4636 | 2.6846 | 0.0279 | 0 |
| Rings and BB | |||||||
| FL01200 | 5 | 13 | 0 | 2 | 0.246 | 0.56 | 23 |
| FL01300 | 13 | 18 | 1.724 | 1.724 | 0.62 | 0.3 | 10.6 |
| FL01400 | 18 | 15 | −7.746 | −7.746 | 0.564 | 0.1841 | 10.6 |
| FL01500 | 15 | 19 | −7.746 | −7.746 | 0.564 | 0.1841 | 10.6 |
| FL01600 | 19 | 12 | 3.784 | 3.784 | 0.62 | 0.3 | 10.6 |
| FL01700 | 13 | 16 | 1.724 | 1.724 | 0.156 | 0.184 | 17.5 |
| FL01800 | 16 | 14 | −4.446 | −4.446 | 0.255 | 0.1429 | 4 |
| FL01900 | 14 | 17 | −4.446 | −4.446 | 0.255 | 0.1429 | 4 |
| FL02000 | 17 | 12 | 3.784 | 3.784 | 0.156 | 0.184 | 17.5 |
| Accident | |||||||
| FL10101 | 33 | 84 | 12.7 | 12.7 | 0.0028 | 0.0141 | 0 |
| FL10102 | 39 | 78 | 7.9 | 7.9 | 0.0028 | 0.0141 | 0 |
| FL10103 | 45 | 72 | 2.2 | 2.2 | 0.0028 | 0.0141 | 0 |
| Entire Reactor | ||||||
|---|---|---|---|---|---|---|
| Name of Zone | Nuclear Heating | Cooling Time | ||||
| MW/m3 | MW/m3 | |||||
| First wall (FW) | 0 s | 1 s | 1 h | 1 day | 1 week | |
| W | 2.18E+01 | 4.95E−01 | 4.93E-01 | 4.63E-01 | 2.27E-01 | 5.66E-03 |
| Eurofer | 7.14E+00 | 1.76E-01 | 1.76E-01 | 1.01E-01 | 1.34E-02 | 6.91E-03 |
| Breeder module (BM) | ||||||
| BM caps and lateral walls | 1.81E+00 | 1.08E-02 | 1.08E-02 | 7.32E-03 | 8.82E-04 | 2.57E-04 |
| BM material mixture | 1.17E+00 | 1.23E-02 | 9.35E-03 | 3.60E-03 | 1.07E-03 | 9.01E-04 |
| BM backwall | 1.06E-01 | 1.50E-03 | 1.50E-03 | 1.02E-03 | 1.20E-04 | 4.24E-05 |
| BM back support/manifold | 5.64E-02 | 4.31E-04 | 4.28E-04 | 2.90E-04 | 3.45E-05 | 1.32E-05 |
| Sum (MW/m3) | 1.65E+03 | 2.21E+01 | 1.91E+01 | 9.68E+00 | 2.26E+00 | 1.25E+00 |
| Rupture Location | Number of Pipes | Rupture Size (m2) | FL Involved | |
|---|---|---|---|---|
| Case 1 | Top OTSG | 9 | 0.0028 | FL10101 |
| Case 2 | Middle OTSG | 9 | 0.0028 | FL10102 |
| Case 3 | Bottom OTSG | 9 | 0.0028 | FL10103 |
| Event | Time (s) | |
|---|---|---|
| Steady state | 0–1000 | |
| Low-pressure signal | Case 1 | 1016.5 |
| Case 2 | 1008.5 | |
| Case 3 | 1007.5 | |
| FPS | Case 1 | 1019.5 |
| Case 2 | 1011.5 | |
| Case 3 | 1010.5 | |
| End of the simulation | 150,000 |
Publisher’s Note: MDPI stays neutral with regard to jurisdictional claims in published maps and institutional affiliations. |
© 2021 by the authors. Licensee MDPI, Basel, Switzerland. This article is an open access article distributed under the terms and conditions of the Creative Commons Attribution (CC BY) license (https://creativecommons.org/licenses/by/4.0/).
Share and Cite
Galleni, F.; Moscardini, M.; Pucciarelli, A.; Porfiri, M.T.; Forgione, N. Numerical Simulation of an Out-Vessel Loss of Coolant from the Breeder Primary Loop Due to Large Rupture of Tubes in a Primary Heat Exchanger in the DEMO WCLL Concept. Energies 2021, 14, 6916. https://doi.org/10.3390/en14216916
Galleni F, Moscardini M, Pucciarelli A, Porfiri MT, Forgione N. Numerical Simulation of an Out-Vessel Loss of Coolant from the Breeder Primary Loop Due to Large Rupture of Tubes in a Primary Heat Exchanger in the DEMO WCLL Concept. Energies. 2021; 14(21):6916. https://doi.org/10.3390/en14216916
Chicago/Turabian StyleGalleni, Francesco, Marigrazia Moscardini, Andrea Pucciarelli, Maria Teresa Porfiri, and Nicola Forgione. 2021. "Numerical Simulation of an Out-Vessel Loss of Coolant from the Breeder Primary Loop Due to Large Rupture of Tubes in a Primary Heat Exchanger in the DEMO WCLL Concept" Energies 14, no. 21: 6916. https://doi.org/10.3390/en14216916
APA StyleGalleni, F., Moscardini, M., Pucciarelli, A., Porfiri, M. T., & Forgione, N. (2021). Numerical Simulation of an Out-Vessel Loss of Coolant from the Breeder Primary Loop Due to Large Rupture of Tubes in a Primary Heat Exchanger in the DEMO WCLL Concept. Energies, 14(21), 6916. https://doi.org/10.3390/en14216916