Article

Commercial PV Inverter IEEE 1547.1 Ride-Through Assessments Using an Automated PHIL Test Platform

1
CanmetENERGY, Natural Resources Canada (NRCan), Varennes, QC J3X 1S6, Canada
2
Sandia National Laboratories, Albuquerque, NM 87185, USA
*
Author to whom correspondence should be addressed.
Energies 2021, 14(21), 6936; https://doi.org/10.3390/en14216936
Submission received: 19 August 2021 / Revised: 27 September 2021 / Accepted: 13 October 2021 / Published: 21 October 2021

Abstract

:
As more countries seek solutions to their de-carbonization targets using renewable energy (RE) technologies, interconnection standards and national grid codes for distributed energy resources (DER) are being updated to support higher penetrations of RE and improve grid stability. Common grid-code revisions mandate DER devices, such as solar inverters and energy storage systems, ride-through (RT) voltage and frequency disturbances. This is necessary because as the percentage of generation from DER increases, there is a greater risk power system faults will cause many or all DER to trip, triggering a substantial load-generation imbalance and possible cascading blackout. This paper demonstrates for the first time a methodology to verify commercial DER devices are compliant to new voltage, frequency, and rate of change of frequency (ROCOF) RT requirements established in IEEE Std. 1547-2018. The methodology incorporates a software automation tool, called the SunSpec System Validation Platform (SVP), in combination with a hardware-in-the-loop (HIL) system to execute the IEEE Std. 1547.1-2020 RT test protocols. In this paper, the approach is validated with two commercial photovoltaic inverters, the test results are analyzed for compliance, and improvements to the test procedure are suggested.

1. Introduction

The penetration of renewable energy (RE) in electric power grids is increasing rapidly worldwide. This growth is driven by ambitious renewable portfolio standards set by countries or regional jurisdictions to meet de-carbonization targets and decreasing costs of renewable generation. This higher penetration of inverter-based distributed energy resources (DER) presents challenges for grid operators [1], e.g., displacement of synchronous generators reduces inertia, increases variability and uncertainty of the generation sources, and produces larger voltage fluctuations and frequency variations. Currently, the majority of DER devices are not monitored or controlled by grid operators. High numbers of DER may cause detrimental effects both during normal and contingency operations of the power system [2].
Perturbations to voltage or frequency are experienced during power system faults. If these deviations trip DER, substantial generation would be lost and cause the power system to destabilize or operate with unplanned, expensive reserve generation. This concern was highlighted with the famous 50.2 Hz problem in Germany where several gigawatts of DER could have tripped offline due to minor over-frequency event; this generation loss could not be met by the conventional reserve capacities [3]. Other examples exist in which DER tripped on voltage or frequency perturbations and caused challenges to power system operators. Approximately 1.2 GW and 900 MW of solar PV tripped offline in two different fault events (Blue Cut fire and Canyon Creek fire) in California during 2016 and 2017 respectively [4,5]. The tripping of the PV systems in both these California events was caused by the protection settings of these PV systems [6].
To prevent these situations in the future and facilitate higher RE integration at distribution and transmission levels, grid codes around the world are being updated with new DER grid-support function (GSF) requirements. The American IEEE Std. 1547-2018 [7], Canadian CSA C22.3 No. 9-2020 Std. [8], and Australian/New Zealand AS/NZS 4777.2 Std. [9] all include revisions to the voltage ride-through (VRT) and frequency ride-through (FRT) functions to keep DER operating during transient voltage and frequency disturbance events. IEEE 1547 requires DER either continue injecting power during the disturbance (a RT) or restart current injection immediately after the disturbance (a momentary cessation) depending on the voltage/frequency excursions from the nominal value based on the severity of the disturbance. By taking this approach, the RT function facilitates grid support during the fault and RE power for restoration after short disturbances by keeping DER connected to the grid.
Frequency excursions during the transient faults in the electric power system are characterized by the magnitude and rate of change of frequency (ROCOF). Most current electric power systems are synchronous machine dominated, therefore, the ROCOF value are typically in the range of 1–2 Hz/s [10]. The study in [11] shows that after a separation of the Ireland and Northern Ireland electrical systems resulted in a ROCOF of over 1 Hz/s in Ireland, and a ROCOF of over 2 Hz/s in Northern Ireland. As power systems move toward higher RE penetrations by offsetting traditional synchronous generators, there will be higher frequency disturbance ROCOF values [1], e.g., a grid event in South Australia where ROCOF reached 6 Hz/s [12]. Unfortunately, faster ROCOFs are more challenging for the DER inverter control loops to maintain synchronism with the power system [10], e.g., [12] reported experimental verification of residential PV inverters disconnecting due to ROCOF. So it is important to test the DER for operations with aggressive ROCOF values. IEEE 1547-2018 specifies ROCOF values of up to 3 Hz/s to ensure DER sustain synchronism during a rapid frequency deviation.
IEEE Std. 1547.1-2020 [13] defines conformance test procedures for DER devices in the USA and was recently revised to align with IEEE Std. 1547-2018. To pass the test procedures in IEEE 1547.1, DER must comply with all the GSFs defined in IEEE 1547-2018. DER inverter industry stakeholders (i.e., DER vendors, grid operators, certification laboratories, and academic smart grid test laboratories) need appropriate testing tools to verify the power and communication characteristics for different GSFs. The IEEE 1547.1 test procedures typically include dozens, if not hundreds, of measurement points for each of the GSFs, so it is critical to automate the certification process to minimize certification costs, test durations, and risk of human error.
Recently, other jurisdictions are including grid-code compliance test requirements such as the IEEE 1547.1 standard. The Canadian CSA C22.3 No. 9 standard includes a section on compliance testing [8]. In Australia and New Zealand, AS/NZS 4777.2 standard includes the testing requirement for the different GSFs of DER with detailed guideline such as the IEEE 1547.1 standard [9], along with tests for multiple-unit operation, technology-specific DER devices, etc. Currently, the European standard EN 50549-10 is being developed to assess GSFs of DERs for low and medium voltage network connections [14].
Several national research laboratories from different jurisdiction are collaborating within the Smart Grid International Research Facility Network (SIRFN) to evaluate GSFs of different DER devices [15,16,17]. These evaluations have been completed by developing test scripts for different test protocols, i.e., UL 1741 SA [16] and IEEE 1547.1. The SVP was used in these evaluations to automate the test sequences in Python environment. The SVP communicates with and controls AC grid simulators, PV simulators, Equipment Under Test (EUT) and data acquisition systems [18]. The SVP is used to create the test results (e.g., raw data in CSV file format) along with a test manifest (e.g., log files) that are then summarized in a Microsoft Excel file to provide pass-fail tables and plots of the results. This testing framework helps the SIRFN group to assess new and developing grid codes and associated test procedures from different jurisdictions. The experimental results provide feedback to the standard development organizations for corrections and enhancements to the test procedures [15,16].
Many researchers have developed RT algorithms for DER devices [19,20,21]. In their work, RT capabilities are usually tested by applying fault scenarios on a simulated AC grid. However, the RT algorithms are not tested to a standardized RT test procedure, such as those required of commercial DER device. During the standards development process, historical fault profiles were studied by the committees to create representative fault profiles to evaluate the DER products. This process was similar for the other GSFs. The recently published IEEE Std. 1547.1-2020 introduced type tests for response of voltage and frequency disturbance (i.e., VRT, FRT, phase-angle change RT), as well as different voltage regulation and frequency-support functions (e.g., frequency-droop, constant reactive power, active power–reactive power, etc.). Each of these tests were designed to evaluate the GSFs in representative—-albeit worst case-—scenarios that fielded DER were likely to encounter in their lifetimes. The SIRFN collaboration is assessing several solar PV inverters for these GSFs using the SVP, while PV inverter manufacturers are certifying their products with these latest requirements. Previously, the team developed many scripts for type tests in IEEE P1547.1 (Draft versions D9.6 & D9.9) and shared the test protocol evaluation findings with the IEEE standards development committee to help refine the standard before final publication [15,22,23]. Now, after publication, this team is completing the IEEE 1547.1 open-source test scripts to accelerate the development and deployment of RE systems. Test facilities, DER vendors, and research institutions can use this software to perform certification test procedures.
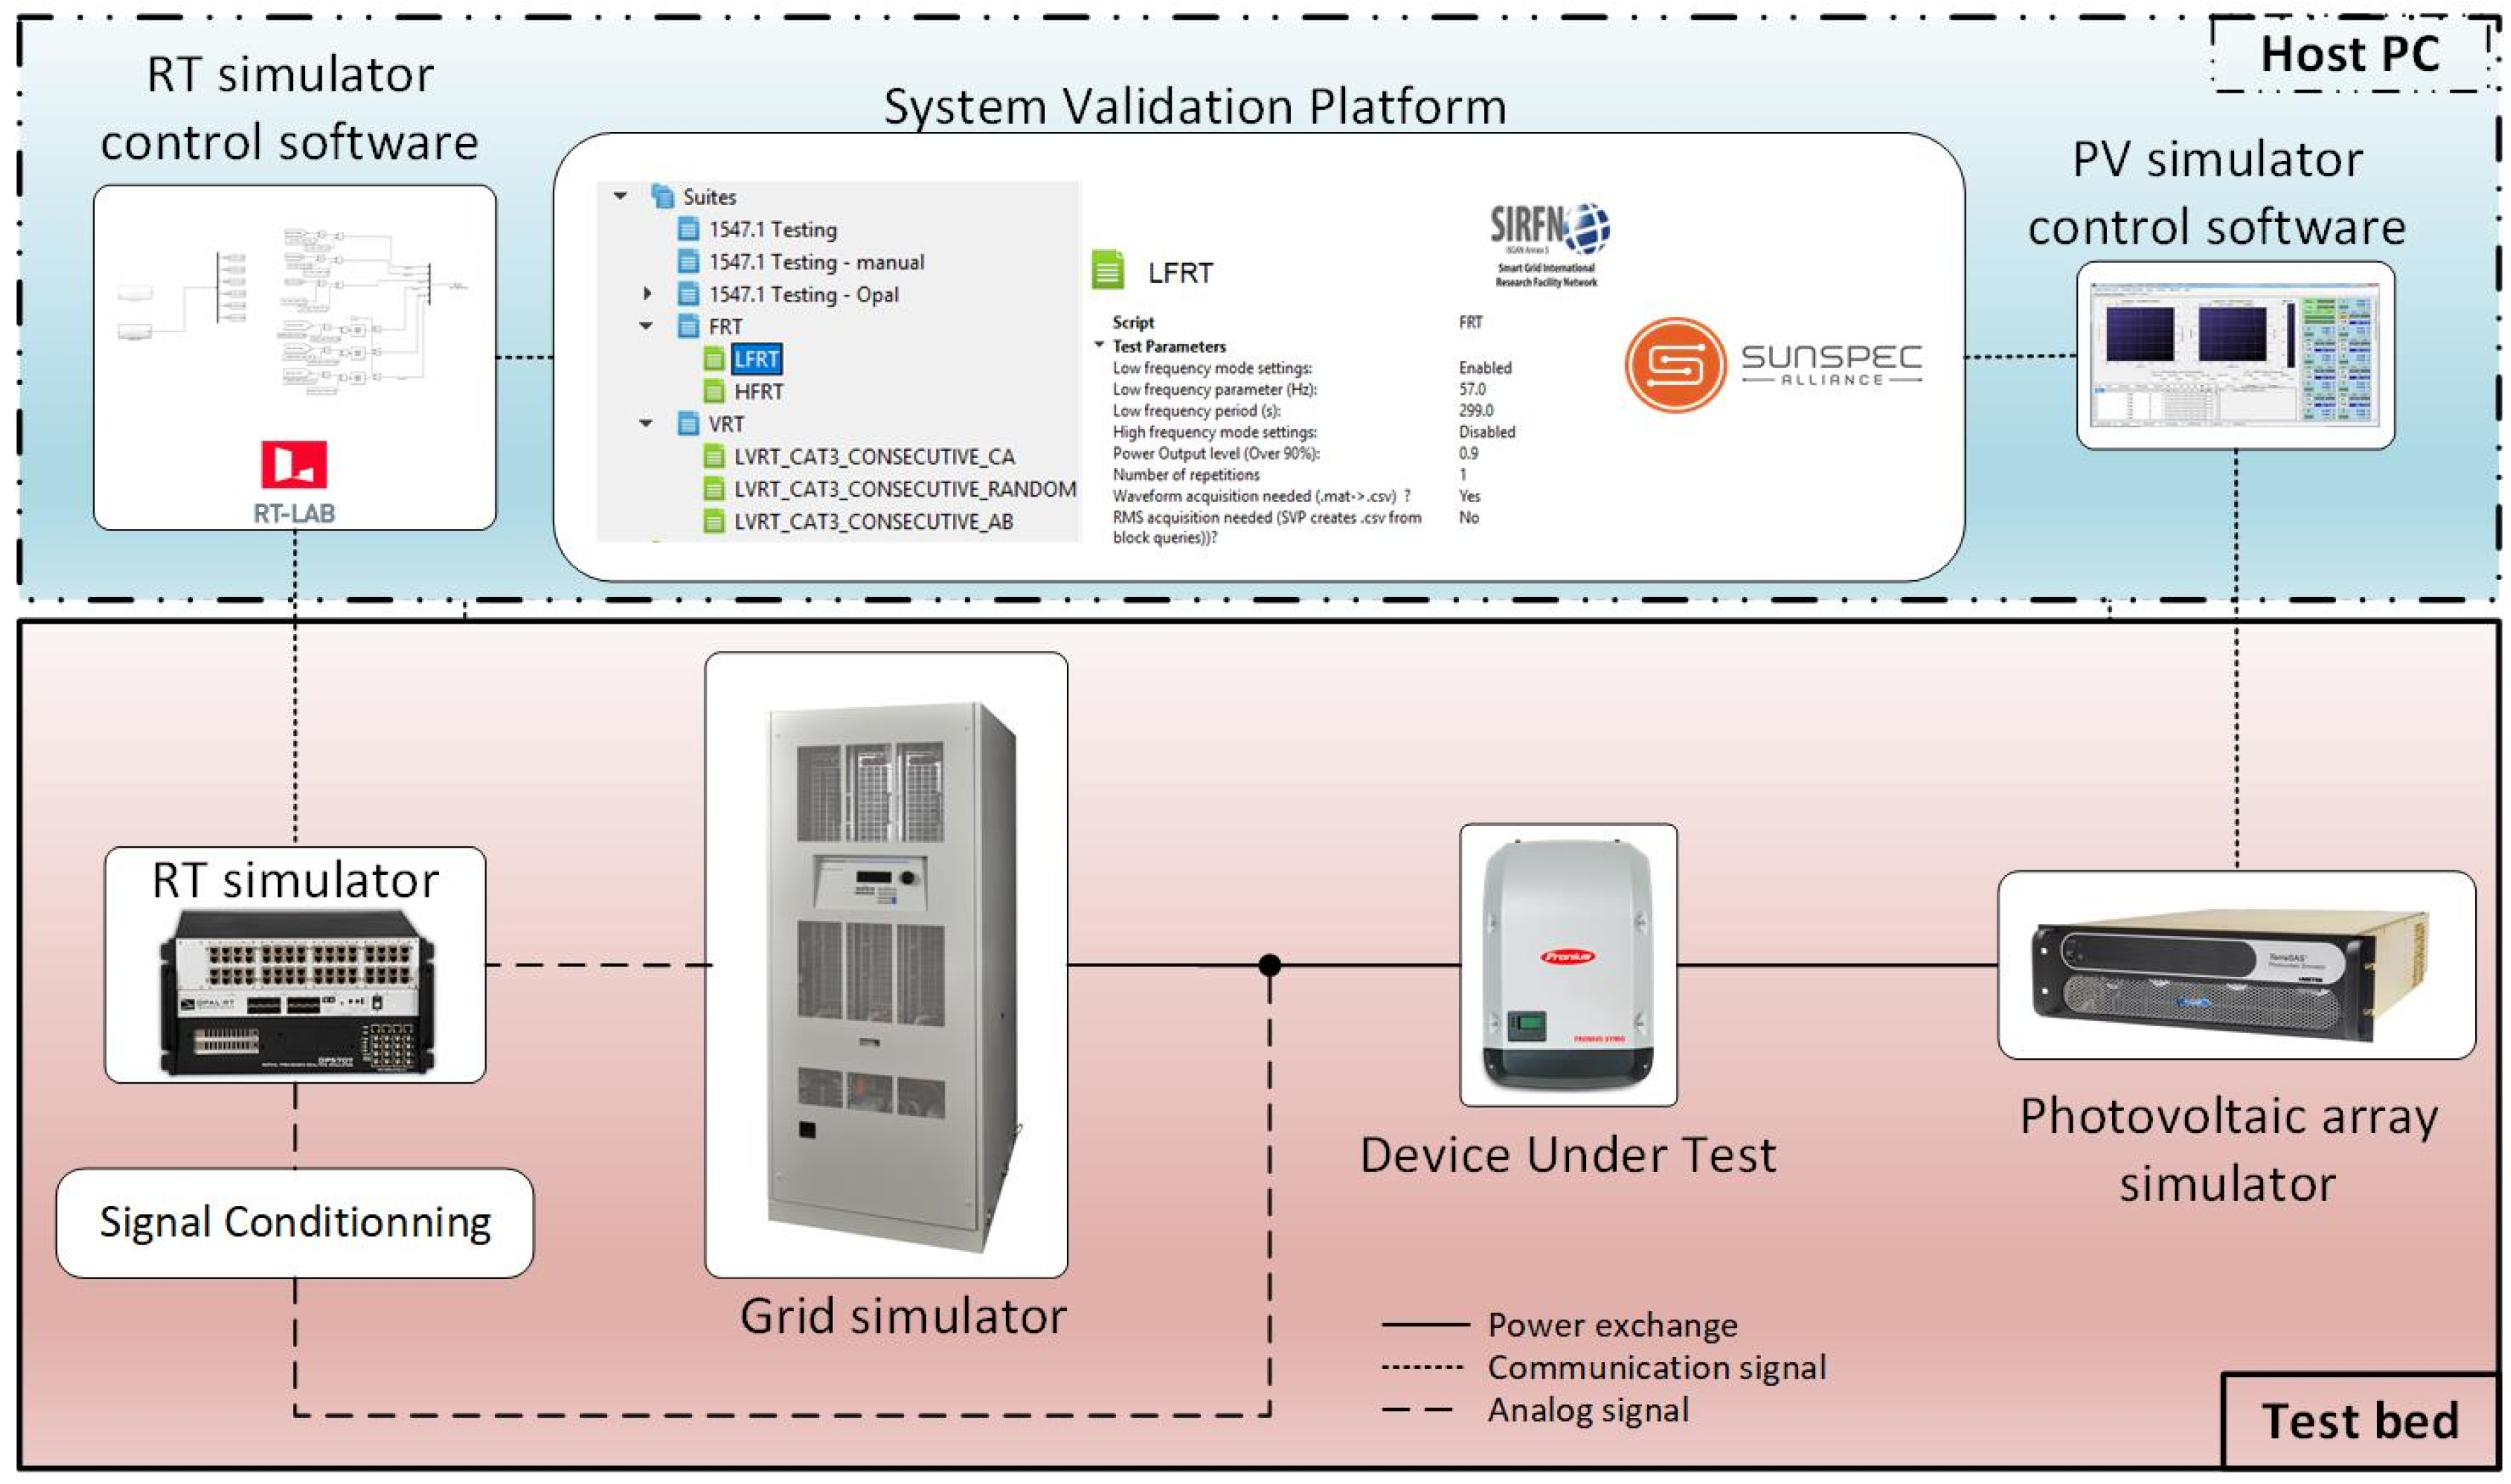
In terms of IEEE 1547.1 RT requirements, the standard requires commercial PV inverters to be tested with consecutive disturbances for both over and under frequency and voltage levels, at two different operating power levels based on the category of DER device. Generation of IEEE 1547.1-2020 RT results requires creating precise event triggers and capturing current and voltage waveform data. The FRT test also requires a controlled ROCOF of the applied voltage signal. To record precision data, an open-loop Power Hardware-in-the-Loop (PHIL)-based automated test setup (i.e., a signal-injection testbed) was created to evaluate commercial PV inverter compliance to the IEEE 1547.1-2020 RT criteria. The SIRFN labs developed open-source Python test scripts to drive the PHIL simulation to capture the VRT, FRT, and ROCOF RT function evaluations [24]. The SVP test scripts compile and execute a MATLAB Simulink model in the Opal-RT simulator environment, RT-LAB, to achieve precise timing, generate the voltage signal disturbances (magnitude, phase and frequency), and capture waveform test result data. The SVP communicated to the PHIL environment using Opal-RT’s RT-Lab Python Application Programming Interface (API). In this paper, two commercial three-phase PV inverters with different nameplate capacities and configurations were assessed to the IEEE 1547.1 VRT and FRT test procedure. This PHIL-based platform allowed identification of potential improvements to increase test consistency and reliability across multiple test laboratories. The primary contributions from this work are: (a) creation of an open-source, frequency-adaptive RT-Lab Simulink model that can be used to perform VRT, FRT and ROCOF RT experiments, (b) the development of automated, open-source HIL certification scripts that reduce the burden of manual experimentation, and (c) the first-ever experimental comparison of IEEE 1547.1-2020 LVRT, HFRT, LFRT, and ROCOF RT results from two production DER devices.

2. IEEE 1547.1 VRT and FRT Test Requirements

The revised IEEE 1547-2018 standard specifies the DER requirements for different GSFs. These requirements may vary based on technology, application purpose, power generation variability, and the specific characteristics of the point of common coupling. Therefore, two types of performance category definition were adopted in the standard:
  • Category (Cat.) A and B are based on DER participation in the voltage and reactive power management. Cat. A requirements are minimum voltage support requirements for all state-of-the-art DER technologies, usually for low-RE penetration operations. Although Cat. B covers supplemental capabilities to address high-RE penetration operations of the electric grid. Cat. B devices include active power–reactive power and voltage–active power modes along with expanded reactive power capabilities.
  • Category I, II and III are based on disturbance RT capabilities for power system protection and power quality. Cat. I RT requirements are defined for synchronous machine-based DER based on the German Association of Energy and Water Industries (BDEW) standard for medium voltage synchronous generators [25]. Cat. II requirements are based on the North American bulk power system (BPS) reliability standard, NERC PRC-024-2 [26], but have much tighter operating bands than Cat. III. Cat. III goes beyond the ride-through requirements in NERC PRC-024-2 to add the widest disturbance ride-through capabilities, based on California Rule 21 [27], applicable for inverter-based DERs in high-RE penetration grids.
The VRT capability of DER is the ability to RT voltage sags and swells without tripping the unit. Similarly, the FRT capability is the ability to RT the frequency excursions that are outside the normal range of operation. Voltage and frequency excursions outside the normal range of continuous operation require certain response characteristics from the DER depending on the magnitude and history of grid voltage or frequency. The types of DER operating modes during a RT event are:
  • Mandatory operation: DER shall maintain synchronism and continue active power exchange.
  • Permissive operation: DER may continue active power exchange or may cease to energize.
  • Momentary cessation (MC): DER shall cease to energize.
When the DER is in MC mode, it shall not trip and shall restore output following IEEE 1547-2018 Section 6.4.2.7, i.e., a DER without dynamic voltage support shall restart total active current injection of at least 80% of pre-disturbance active current level within 0.4 s. Additionally, the IEEE 1547.1 provides different methods for testing based on the DER technology. This article focuses on the testing of inverter-based DER.

2.1. Low Voltage RT Test

The purpose of the IEEE 1547.1 low voltage RT (LVRT) test is to verify the capability of the EUT to RT voltage sags without tripping. To properly assess the LVRT capability of the EUT, the undervoltage trip function is disabled or set to not influence the outcome of the test. Among all the different voltage support functions of the EUT, only the voltage-reactive power (volt-var) function shall be enabled with default parameters. The LVRT tests shall be conducted at two output power levels—one high (rating at greater than 90%) and one low (active power in between 25% and 50%)—with power factor greater than 0.90.
IEEE 1547.1-2020 standard presents the LVRT test signals that shall be applied on the EUT terminals for Cat. I, II and III EUTs, in accordance with the defined LVRT test conditions. The Cat. III LVRT test conditions are presented in Table 1. The time frame of each test condition during the RT test is such that the low voltage is applied from a minimum of 1 s to a maximum of 120 s. The different modes of operation during the LVRT test are evaluated using consecutive RT tests where the LVRT test sequences are repeated without interruption as described in 5.4.4.3 of the standard. The LVRT capability of a three-phase EUT is assessed by applying the repeated voltage sag profile on all three phases simultaneously, at least one two-phase pair simultaneously, and at least one single phase individually. Based on the test results, the EUT is found compliant if it meets the requirements of the mandatory, permissive, and MC mode definitions from the previous section. In addition, during the mandatory operation, it shall maintain its total apparent current during the disturbance period at or above 80% of the pre-disturbance value.

2.2. High Voltage RT Test

The purpose of the high voltage RT (HVRT) test is to verify the capability of the EUT to RT voltage swells without tripping. The HVRT test has similar requirements and procedures to the LVRT test. To properly assess the HVRT capability of the EUT, the overvoltage trip function and voltage-reactive power (volt-var) function are programmed the same way as the LVRT test. The HVRT test is also conducted at two power levels such as the LVRT test. The IEEE 1547.1-2020 standard presents HVRT test signals in accordance with HVRT test conditions for different EUT categories. Again, the different modes of operation during the HVRT test are evaluated using consecutive RT tests. The three-phase EUT is tested at a minimum of three different voltage scenarios; three phases simultaneously, at least one two-phase pair simultaneously, and at least one single phase individually. Based on the test results, the EUT shall be HVRT compliant if it meets the requirements of the permissive and MC mode definitions from Section 2.

2.3. Low Frequency RT Test

The purpose of the low frequency RT (LFRT) test is to verify the capability of the EUT to RT low frequency excursions (outside the normal range of operation) without tripping. The frequency trip settings are set to not influence the outcome of the test. The frequency-droop function is programmed for least aggressive settings to make the active power change with respect to frequency as small as possible. The test is conducted at a power level greater than or equal to 90% of EUT rating and the applied frequency variation during the test is greater than or equal to the ROCOF limit specified for the EUT Cat. III. Therefore, this test also verifies the ROCOF capability of the EUT. Based on the test results, the EUT is compliant if it maintains active power above the pre-disturbance active power output for a Cat. III EUT.

2.4. High Frequency RT Test

The purpose of the high frequency RT (HFRT) test is to verify the capability of the EUT to RT high frequency excursions (outside the normal range of operation) without tripping. The HFRT test has similar requirements for settings of trip function, droop and power level for testing, frequency variation following ROCOF, and compliance assessment.

3. SVP-PHIL-Based DER Inverter Testbed

A hardware DER inverter can be interfaced into a real-time power system simulation environment using the power hardware-in-the-loop (PHIL) setup. This approach allows the testing of commercial DER inverter with various test scenarios [28]. The EUT used for this work were two commercial three-phase PV inverters. Voltage magnitude and frequency test conditions were applied to the EUT terminals with the PHIL setup. Figure 1 presents the overall testbed architecture as employed in this work. It is divided into two elements: a testbed composed of actual electrical devices and a host Windows computer with different software elements to control the test architecture and environment. This setup was employed in CanmetENERGY laboratory in Canada and Sandia National Laboratories in the USA.

3.1. PHIL Testbed

For both laboratories, the testbed included a programmable AC power supply or grid simulator/amplifier controlled through the analog signal from an HIL system. Although a test lab could conceivably certify a PV inverter to IEEE 1547.1 using a programmable AC power source, it would be challenging to conduct tests requiring voltage unbalance, controlled ramp changes for voltage and frequency, phase jumps, and the precise timing for RT tests. These can be easily achieved using a real-time simulator (RTS) in an open-loop PHIL setup. The RTS from Opal-RT Technologies has been employed for this PHIL work. The EUT voltage and current (waveform) measurements were recorded in the PHIL simulation using the analog input interface of the RTS. The DC side of the EUT was powered by PV array simulator programmed with I-V curves defined using the EN 50530 standard [29].

3.2. Modeling and Automation in PHIL Testbed Environment

3.2.1. Test Automation using System Validation Platform (SVP)

The SIRFN working group has been using the System Validation Platform (SVP) extensively to assess different GSFs of DER inverters [15,16,22,23]. The SVP software was originally developed in a collaboration between the SunSpec Alliance and Sandia National Laboratories, but since becoming publicly available in the GitHub repository [30], it has seen rapid development within the research community. The SVP executes tests and evaluates results in an automated manner by communicating to all necessary laboratory equipment. The user defines tests in the SVP graphical user interface (GUI), first by choosing the appropriate test script, and then by defining the test parameters. Following this, all laboratory equipment are programmed by SVP. Since the SVP software uses abstraction layers for testbed components, the same test script (Python logic) can be used with different laboratory testbeds by merely changing the equipment drivers for their testbed configuration. Drivers for a range of PV simulators, grid simulators, commercial EUTs, and data acquisition systems are made available in the open-source SVP [31].
As mentioned in the previous section, it is quite challenging to control the grid simulator from the SVP using the communication link for voltage unbalance, controlled voltage and frequency ramp changes, and precise timing control for RT tests. Often these capabilities are not available for commercial grid simulators. Furthermore, for transient IEEE 1547.1 tests, another major challenge is synchronizing the grid disturbance and data capture via a trigger signal. To overcome these challenges, the Opal-RT PHIL system was used where the RTS provided the precise timing required to execute the perturbations and acquisition.
The Opal-RT RT-LAB RTS has a Python API through which the real-time simulation can be controlled and automated with SVP drivers developed by the SIRFN community. A RT test model was created in MATLAB Simulink which runs in real time and can be controlled through the RTS interface. During each test, the SVP sends the disturbance parameters sequentially and the RTS applied these to the EUT using the grid simulator amplifier. The RTS recorded the waveform data and the SVP retrieved this at the end of the test. RMS (root mean square) data were also captured through the Opal API for use in the SVP logic and addition in the manifest. Figure 2 shows the automated process for RT test where SVP steps are marked in orange and the RT model steps in RTS are marked in blue. The test starts by configuring, compiling, and starting the RTS model as well as other equipment. The RTS model applies the disturbances to the EUT in PHIL setup. Then it acquires the voltage/current signals, logs the test results, and finishes the current scenario of the test by returning the equipment to safe conditions. At that point, it may optionally execute other scenarios by executing the same sequence as above. More details about the RTS model steps are described in the next section.

3.2.2. RT Model Characteristic

State Machine

Synchronization of hardware equipment was achieved by the RTS system. The Simulink model running in the RTS created the voltage or frequency disturbance following a precise time sequence. This was accomplished using a MATLAB function (M-function) block within the Simulink environment, which executed the test logic through a state machine. A state machine is an abstract machine or algorithm that has finite states. The main application of the state machine was to iterate over the input vectors, select the current test condition, and apply the correct voltage disturbance in terms of magnitude/phase/frequency based on a precise timing sequence. It also generated a trigger signal to indicate the current state. The voltage disturbance and trigger signal were passed to the waveform generator block and waveform acquisition block.

Waveform Generator

This RT-LAB block generated the three-phase voltage waveforms that were applied to the EUT terminals through the amplifier. It generated the signal(s) according to the voltage disturbance signal from the state machine while enforcing the ROCOF requirements. In addition, it also saturated the voltage magnitude signal to protect the grid simulator from overvoltage conditions (e.g., CanmetENERGY grid simulator maximum voltage is limited to 1.1 per unit). Please note that this is an open-loop control system where power measurements from the DER do not change the power simulation. This is called “signal injection” in IEEE 1547.1.

Waveform Acquisition

This RT-LAB block captured the time domain voltage and current waveforms and created the waveform file. It is composed of two Opal-RT library blocks: OpWriteFile and OpTrigger. These two blocks allowed the data capture from the real-time simulation once the size of the buffer memory and data transfer rate were set appropriately. The OpTrigger is the OpWriteFile trigger and has a straightforward application. When the trigger criterion is met, OpTrigger initiates data acquisition. At the end of the trigger, the data are sent from the RTS to the host machine where they can be processed, analyzed, and stored by the SVP after the test has completed.
For VRT and FRT tests, the measurement system must comply with IEEE Std 1547-2018 Table 3 of IEEE Std 1547-2018. To meet this requirement, waveforms in this work were captured at a sampling rate of 6.25 kHz (every 160 μ s). The RMS and power calculations were done at a sampling rate of 1 kHz (every 1 ms).

Data Processing

The VRT and FRT tests are evaluated based on the RMS value of current/voltage, frequency, active/reactive power. A data processing model was developed in a Simulink environment. The acquired voltage and current waveforms were processed to generate the required parameter values. To maintain the greatest accuracy in the results, the RMS data were calculated from the waveform captures of the experiments, and not just from RMS values extracted from the Opal-RT API during simulation. Saving the waveform data were also important because they contained additional information that could be used to confirm the transient change, trigger signal accuracy, and it allowed for alternative waveform post-processing techniques to be applied to the dataset. For the VRT results, the RMS values, active and reactive power values were calculated from the waveform data using the Simulink library component for RMS and active/reactive power calculation. However, this library component uses nominal frequency for this calculation of the output value; therefore, when the frequency of the voltage and current waveform varied during the FRT test, the calculated RMS and active and reactive power values were not correct. To address this problem, these calculations were completed using frequency-adaptive methods as follows.
To create a frequency-adaptive method, the RMS value of a voltage/current signal was obtained from the original and its orthogonal signals. The orthogonal signal is a 90° phase-shifted signal of the original signal. There are various techniques in the literature to obtain the orthogonal signal [32], i.e., T/4 delay, all-pass filter, Hilbert transformation, second order generalized integrator (SOGI), etc. The SOGI method has gained significant attention for orthogonal signal generation as it is fast and frequency-adaptive [33]. The SOGI method has been used in this work to generate the orthogonal signal. The frequency is obtained from the grid voltage using an adaptive PLL [34]. If x α is the instantaneous original signal and x β is the instantaneous orthogonal signal, then the RMS value can be calculated using the following equation:
x r m s = 1 2 ( x α 2 + x β 2 )
The active and reactive power were calculated using the power (PLL-driven, positive sequence) calculation block from Simulink library [35].

3.3. Test Parameters

3.3.1. VRT Test

Recall that Section 2.1 and Section 2.2 provided a detailed overview of the LVRT and HVRT tests. Overall, the VRT tests have 144 possible scenarios based on the multiple SVP test parameters. Table 2 presents the parameter definition options for both the LVRT and HVRT tests. All the possible scenarios from IEEE 1547.1 were implemented in the VRT tests and summarized in Table 3. As can be seen, the test includes options for low or high VRT test, low or high power levels, and test profiles for Cat. II and Cat. III DER—under which inverter-based DER fall. The test can be configured for a single RT event or consecutive RT events. The disturbance can be applied on any specific single phase, two phases or three phases. In addition, the RT profiles can be “figure” or “random”. The “figure” option is the RT profile that are presented with figures in 5.4.4 of IEEE 1547.1. When “random” is selected, then the RT profile will be generated using the random value from the voltage ranges specified in Table 1. IEEE 1547.1 does not specify any order for phase disturbance; therefore, the script can select either a single-phase disturbance (A, B, and/or C), dual-phase disturbance (AB, BC and/or CA), and all phases at the same time (ABC). Therefore, the scope of the developed VRT test script and model not only covers the IEEE 1547.1 VRT tests, but also can be used for detailed VRT performance assessment of the EUT. The complete VRT test script is available in the open-source GitHub repository of test scripts [24].

3.3.2. FRT Test

Table 4 presents the parameters of the FRT tests in SVP implementation. The test can be defined for either LFRT or HFRT and Cat. II or III EUTs. When the EUT Category is selected, the script configures the appropriate ROCOF value (2 Hz/s or 3 Hz/s). Custom profiles can be executed as well using the programmable parameters of power level, frequency excursion value, time window, and number of iterations. The standard requires testing FRT with frequency-droop enabled and configured for the least aggressive setting. The frequency-droop function can be programmed for default, least aggressive, or custom setting using the EUT parameters. This allows assessment of FRT operations with different droop scenarios. The complete FRT test script and Simulink model are also available in the open-source GitHub repository [24,36].

4. Experimental Results

The experiments were performed on two different commercial EUTs at two SIRFN laboratories. Table 5 presents EUT specifications. Modern commercial PV inverters include most of the GSFs capabilities to address the maximum voltage and frequency support for high-RE grids. Therefore, these EUTs were tested for the maximum voltage support definition of Cat. B and maximum disturbance RT capability definition of Cat. III. The firmware on the EUT from Sandia and CanmetENERGY were listed to IEEE 1547a-2014 and certified for the UL 1741-2010 Second Edition. Since the EUT ratings for the two EUTs were different, the results are presented in per unit (pu) values for easy visualization and comparison purpose. Both laboratories were unable to test HVRT cases due to equipment limitations; the grid simulator maximum voltage values were limited to 1.1 pu while the HVRT tests require higher voltage values.

4.1. VRT Tests

LVRT tests with different phase combinations were conducted at both laboratories. Figure 3 presents the LVRT test results with disturbance in Phase A, Phase AB and Phase ABC for the high-power operation following the “figure” profile. The first row shows the voltage command and grid simulator voltage response in per unit values for all phases and the second row presents the corresponding total current response in per unit (in green). The second row also includes a line indicating the 80 % of the pre-disturbance current level, which is used for pass and fail assessment of the VRT capability.
During the LVRT test profile, when in Test Condition B (voltage below 0.05 pu as shown in Table 1), the EUTs should go into MC. Once the voltage rebounds, the EUT should be in mandatory operation mode. Except during the MC period, the EUT should maintain total current 80 % of pre-disturbance threshold after the 0.4-s recovery time. For the disturbance on Phase A (first column of Figure 3), both EUTs successfully RT the LVRT test by maintaining the total current above 80 % of pre-disturbance threshold. For the disturbance on phase AB and ABC (second and third columns of Figure 3 respectively), the EUT at Sandia managed to successfully RT both cases. However, the EUT at CanmetENERGY tripped and did not RT these two cases. Further investigation is required to understand the RT behavior of the EUT from CanmetENERGY. The EUT from Sandia maintained the total current value at more than 80 % of pre-disturbance value (except during the MC mode); however, this EUT exhibits an undesirable current oscillation at 0.5 pu voltage for the LVRT case of phase AB.
Figure 4 presents a detailed view of the voltage and total current when the LVRT disturbance is applied to two phases. During the MC mode of Test Condition B, the current drops to nearly zero (less than 5% of rated value). In Test Condition C, it is in mandatory operation mode, so the EUT is required to restore output total current to more than 80% of pre-disturbance value. As can be seen in Figure 4, this EUT returns to pre-disturbance current value within the required time of 0.4 s. Thus, it meets the LVRT MC and successive current restore requirement.
CanmetENERGY conducted additional IEEE 1547.1 LVRT tests using the “Consecutive Testing” requirements in Table 6 to explore additional test conditions and reproduce the trip behavior. Please note that the last sequence (A, B, C’, D and E) in Table 6 is run only if the restore output following MC cannot be evaluated properly in previous steps. For simplification of the test representation, this step was included in the automated SVP test sequence, even though the EUT did restore output current properly. Figure 5 presents the test results for consecutive LVRT test when the voltage disturbance is applied in two phases (AB, BC and CA). For the disturbance in phase AB, CanmetENERGY’s EUT failed in a manner similar to the test case in Figure 3; however, during the consecutive testing the EUT reenergizes after roughly 100 seconds. Nevertheless, for disturbance BC and CA, the EUT passed the RT test for the consecutive testing as shown in Figure 5. This commercial unit may have a phase-based control scheme as it only fails for phase AB disturbance. This result shows the value in thoroughly evaluating DER products to a range of faults and automating the process to quickly generate results for multiple test conditions.
As mentioned earlier, the LVRT tests can also be run with a “random” profile, which uses random values within the range of different test conditions of Table 1. Figure 6 presents the test results with the random option when the LVRT disturbance is applied in two scenarios: phase A and phase BC. The voltage in Test Condition C from Table 1 is in the range of 0 to 0.5 pu. When the voltage is within this range following the MC mode in Test Condition B, the EUT is permitted to stay in MC mode, but this EUT does not restore its output, contrary to the figure-based approach. The EUT trips for this voltage range and comes back online after a delay. Note this result is not unexpected as the device is not listed to the IEEE 1547-2018/IEEE 1547.1-2020 standards or programmed to those requirements.Yet this finding is significant. The random implementation does not provide the same behavior as the “figure” implementation for this EUT because the voltage sags are larger. As a result, it is recommended for the next revision of the IEEE 1547.1 standard, the RT profiles for different operating modes be defined clearly so the tests are run consistently for all laboratories.

4.2. FRT Tests

Both the EUTs were tested to the LFRT and HFRT requirements. IEEE 1547.1 requires the LFRT and HFRT tests to be conducted with the frequency-droop function programmed in such a way to make the active power change with respect to frequency as small as possible, i.e., the least aggressive settings (1 Hz deadband (db), 5% droop factor (k) and 10 s response time). However, for this work, the tests were also conducted with different scenarios of the frequency-droop function (disabled and default characteristic) to further assess the FRT performance of the EUTs.
The EUTs did not respond to frequency excursions below the nominal value because they employ a frequency-watt function, not a frequency-droop function, as described in prior work [22]. Therefore, the EUTs show similar LFRT response with and without frequency-droop enabled. Figure 7 presents the results for the LFRT tests. It shows the commanded frequency and response as well as the active power responses for both EUTs. Initially, the EUTs operate at 60 Hz. Then starting at 1 s, the frequency is ramped down at 3 Hz/s (see zoomed subplot in the - B) and maintained at 57 Hz (see zoomed subplot in the lower right - C) for a duration of 299 s and finally ramped back up to 60 Hz. The grid frequency at the terminals of the EUTs tracks the commanded values reasonably during ramp and steady state operations as seen in both zoomed subplots. The active power response of both EUTs are maintained at the same value during the whole LFRT test. IEEE 1547.1 requires the EUT to maintain the same power value during the low frequency RT event. Therefore, the unit is compliant to LFRT per IEEE 1547.1 as it maintains the same active power value throughout the test.
Both the EUTs follow the frequency-droop function for frequency excursions above the nominal value. Though IEEE 1547.1 requires the HFRT test to be conducted with only the least aggressive setting of frequency-droop function, this work investigated three different scenarios. The first scenario is when the droop function is disabled, a scenario which was conducted on both EUTs. The second scenario is for droop with a least aggressive setting scenario and done at CanmetENERGY. The third scenario is with the default setting for the droop function and conducted at Sandia. Figure 8 presents the HFRT test results for the three scenarios. Here, the frequency is varied from 60 Hz to 61.8 Hz with a ramp rate of 3 Hz/s and maintained there for a duration of 299 s and finally ramped down to 60 Hz. This commanded frequency and the actual applied frequency are shown in Figure 8. The frequency of the EUT terminal voltage is tracking the commanded value quite reasonably during both ramp and steady state conditions.
The HFRT tests were conducted at 90% power level. The EUT is required to reduce active power following the droop function during the HFRT event according to IEEE 1547.1. As expected, when the frequency-droop function is disabled, both EUTs maintain the same power value before, during, and after the high frequency disturbance. When the frequency-droop function is enabled for the HFRT test, the active power is reduced for the over-frequency condition. This reduction or final value at 61.8 Hz depends on the parameter settings of the droop function. Both the default and least aggressive setting of droop function use the same 5% k; however, the least aggressive setting uses higher value for deadband and response time than the default settings. The HFRT test with least aggressive setting (db = 1 Hz and time response = 10 s) for the EUT at CanmetENERGY shows that the active power reduces slowly for operation at 61.8 Hz. For default characteristic, the test was conducted with db = 0.036 Hz, but response time set to zero. Therefore, the active power response of the EUT from Sandia is almost instantaneous following the frequency ramp rate. It also reduces the active power to 0.37 pu for operation at 61.8 Hz as expected from the frequency-droop function. Therefore, both the EUTs maintain the desired power value during the HFRT event. At the end, the frequency is ramped again to 60 Hz. The standard does not mention the duration for recording the results at this 60 Hz operation. As seen in the Figure 8, if the duration is not more than the response time of the frequency-droop function, then it is not possible to properly evaluate the active power production from the EUT. Therefore, the IEEE 1547.1 standard needs to address this issue in the next revision, possibly by extending the duration of the test considering the time response of the frequency-droop function that allowing assessment of power value after the disturbance.
Finally, Figure 9 presents the steady state time domain response for frequency, three-phase voltages and currents at 60 Hz and 61.8 Hz for the scenarios of frequency-droop disabled and frequency-droop enabled with least aggressive setting scenarios. The EUT maintains the balanced output currents for both scenarios. The three-phase output currents maintained the same peak value for both 60 Hz and 61.8 Hz operations with frequency-droop disabled, but the current was reduced when the frequency-droop was enabled.

5. Suggested Modifications to IEEE 1547 and IEEE 1547.1

The IEEE 1547.1 test procedures were evaluated by developing test scripts, interactive RT-LAB real-time simulations, and running the automated VRT and FRT tests. Two limitations for the current IEEE 1547.1 test procedures were identified in Section 4:
  • For the assessment of VRT MC mode, IEEE 1547.1 has overlapping ranges for some of the Conditions in Table 1 and allows the test laboratory to select voltages anywhere within those ranges. This ambiguity resulted in inconsistent results for one of the EUTs. It is recommended for the next revision of the IEEE 1547.1 standard that the voltage values for each of the conditions be precisely defined to minimize the risk of inconsistent testing results.
  • The test procedures for FRT do not include enough measurement time for assessing the output power of EUT following the L/HFRT excursions. To properly assess the FRT capability with frequency-droop response, the test needs to be extended for an additional duration. This duration shall cover minimum time required considering the response time of frequency-droop function.
Since the IEEE 1547.1 frequency-droop test uses at least 4 times the response time of frequency-droop function, the authors recommend adopting the same requirement for the additional duration to be added to the FRT test. Additionally, the IEEE 1547 standard does not specify the required reactive current/power support during the voltage RT event. The voltage disturbances from a transient fault may be better mitigated by providing reactive current or negative sequence current. Such a requirement is imposed in a few new and proposed grid codes, i.e., IEEE P2800 [37]. Such reactive current support or dynamic voltage support could be addressed in IEEE 1547 and associated test procedures specified in IEEE 1547.1. DERs are not required to change their active power output during the L/HFRT tests. However, automatically enabling a FW response during the FRT would support the power system. IEEE P2800 is currently being balloted for transmission and sub-transmission connected IBRs and includes a range of grid stability including primary frequency response capabilities. These requirements should be considered for inclusion in IEEE 1547 in the future. The ROCOF testing rates may not be sufficient in smaller power systems or microgrids (especially with high penetrations of inverter-based resources) in the future, so this may be an area for improvement in the next revision of IEEE 1547 as well.

6. Conclusions

This paper presents a fully automated SVP-based PHIL architecture for IEEE 1547.1 voltage, frequency, and ROCOF RT testing of DER inverters. SVP test scripts and Simulink models were developed to precisely produce the desired voltage or frequency perturbation sequence while also acquiring the test results data. The test scripts and Simulink model allowed investigation of different parameter scenarios by adjusting the EUT power levels, frequency-droop parameter, magnitudes and number of phases involved in the disturbance. Two commercial three-phase PV inverters with different nameplate capacities and firmware configurations were assessed using the IEEE 1547.1 VRT and FRT test procedures. Each PV inverter was tested with single-, two-, and three-phase voltage disturbances and symmetrical frequency disturbances. In the case of the FRT tests, a frequency-adaptive Simulink model was used to post-process the waveform datasets. A detailed comparison of RT behaviors for two EUTs was presented to demonstrate the assessment methodology and weaknesses in the compliance standard. It was found that the devices were not compliant to the IEEE 1547.1 criteria, as expected, since they were manufactured prior to the revised requirements and listed to IEEE 1547a-2014. However, by developing the open-source IEEE Std. 1547.1 high and low voltage/frequency RT test scripts, financial and technical barriers are lowered for DER vendor internal product evaluations, product compliance testing at certification laboratories, and research institutions studying DER response behaviors. As DER devices are designed with these new capabilities, this testing methodology is expected to help accelerate the deployment of DER products on power systems worldwide.

Author Contributions

Conceptualization, formal analysis, and visualization: N.N., E.A.-A., M.B.; Project administration and supervision: N.N., J.J.; Investigation, resources and software (Model and test script development): N.N., E.A.-A., M.B., J.J.; Experiment and data collection: E.A.-A., M.B., J.J.; Writing original draft: N.N., E.A.-A., M.B.; Writing—review and editing: N.N., J.J. All authors have read and agreed to the published version of the manuscript.

Funding

CanmetENERGY is a federal research laboratory in Canada; financial support for this research work was provided by Natural Resources Canada (NRCan) through the Program on Energy Research and Development (PERD) in the framework of REN-2 Smart Grid and Microgrid Control for Resilient Power Systems Project. Sandia National Laboratories is a multi-mission laboratory managed and operated by National Technology and Engineering Solutions of Sandia, LLC, a wholly owned subsidiary of Honeywell International, Inc., for the U.S. Department of Energy’s National Nuclear Security Administration under contract DE-NA0003525. This material is partially-based upon work supported by the U.S. Department of Energy’s Office of Energy Efficiency and Renewable Energy (EERE) under the Solar Energy Technologies Office Award Number 34219.

Data Availability Statement

The OpenSVP software, device drivers and test scripts (including HIL model) are available in open-source at the following GitHub repository links [24,30,31].

Acknowledgments

The authors would like to thank Dave Turcotte and Janos Rajda from CanmetENERGY for their comments and suggestions towards this work.

Conflicts of Interest

The authors declare no conflict of interest.

Abbreviations

The following abbreviations are used in this manuscript:
DERDistributed Energy Resources
FRTFrequency Ride-Through
GSFGrid-Support Function
HILHardware-In-the-Loop
MCMomentary Cessation
RERenewable Energy
ROCOFRate Of Change Of Frequency
RTRide-Through
RTSReal-Time Simulator
SVPSystem Validation Platform
SIRFNSmart Grid International Research Facility Network
VRTVoltage Ride-Through

References

  1. Pattabiraman, D.; Tan, J.; Gevorgian, V.; Hoke, A.; Antonio, C.; Arakawa, D. Impact of Frequency-Watt Control on the Dynamics of a High DER Penetration Power System. In Proceedings of the 2018 IEEE Power Energy Society General Meeting (PESGM), Portland, OR, USA, 5–10 August 2018; pp. 1–5. [Google Scholar] [CrossRef]
  2. Walling, R.; Ellis, A.; Gonzalez, S. Implementation of Voltage and Frequency Ride-Through Requirements in Distributed Energy Resources Interconnection Standards; Technical Report 2014-3122; Sandia National Laboratories: Albuquerque, NM, USA, 2014. [Google Scholar]
  3. Brundlinger, R.; Strasser, T.; Lauss, G.; Hoke, A.; Chakraborty, S.; Martin, G.; Kroposki, B.; Johnson, J.; de Jong, E. Lab Tests: Verifying That Smart Grid Power Converters Are Truly Smart. IEEE Power Energy Mag. 2015, 13, 30–42. [Google Scholar] [CrossRef]
  4. NERC Report. 1200 MW Fault Induced Solar Photovoltaic Resource Interruption Disturbance Report; Technical Report; NERC: Atlanta, GA, USA, 2017. [Google Scholar]
  5. 900 MW Fault Induced Solar Photovoltaic Resource Interruption Disturbance Report; Technical Report; Joint NERC and WECC Staff Report; North American Electric Reliability Corporation: Atlanta, GA, USA, 2018.
  6. Paolone, M.; Gaunt, T.; Guillaud, X.; Liserre, M.; Meliopoulos, S.; Monti, A.; Van Cutsem, T.; Vittal, V.; Vournas, C. Fundamentals of power systems modelling in the presence of converter-interfaced generation. Electr. Power Syst. Res. 2020, 189, 106811. [Google Scholar] [CrossRef]
  7. IEEE Standard 1547-2018 IEEE Standard for Interconnection and Interoperability of Distributed Energy Resources with Associated Electric Power Systems Interfaces; IEEE Standard Association: Piscataway, NJ, USA, 2018.
  8. CSA C22. 3 No. 9—2020 Std. CSA C22.3 No. 9—2020: Interconnection of Distributed Energy Resources and Electricity Supply Systems; Canadian Standard Association (CSA): Toronto, ON, Canada, 2020. [Google Scholar]
  9. AS/NZS 4777.2:2020 Std. AS/NZS 4777.2:2020, Grid Connection of Energy Systems via Inverters, Part 2: Inverter Requirements; Standard Australia & New Zealand. Available online: https://www.standards.govt.nz/shop/asnzs-4777-22020/ (accessed on 18 October 2012).
  10. Hoke, A.F.; Shirazi, M.; Chakraborty, S.; Muljadi, E.; Maksimovic, D. Rapid Active Power Control of Photovoltaic Systems for Grid Frequency Support. IEEE J. Emerg. Sel. Top. Power Electron. 2017, 5, 1154–1163. [Google Scholar] [CrossRef]
  11. Rate of Change of Frequency (ROCOF): Review of TSO and Generator Submissions—Final Report; Technical Report; PPA Energy: Guildford, UK, 2013.
  12. Callegaro, L.; Konstantinou, G.; Rojas, C.A.; Avila, N.F.; Fletcher, J.E. Testing Evidence and Analysis of Rooftop PV Inverters Response to Grid Disturbances. IEEE J. Photovoltaics 2020, 10, 1882–1891. [Google Scholar] [CrossRef]
  13. IEEE 1547. 1-2020 Std. IEEE Standard Conformance Test Procedures for Equipment Interconnecting Distributed Energy Resources with Electric Power Systems and Associated Interfaces; IEEE Standard Association: Piscataway, NJ, USA, 2020. [Google Scholar]
  14. Vancoetsem, W. Work progress EN50549-x. In Proceedings of the ESC CNC Meeting. 2018. Available online: https://slidetodoc.com/work-progress-en-50549-x-presented-at-esc-2/ (accessed on 18 October 2021).
  15. Ninad, N.; Apablaza-Arancibia, E.; Bui, M.; Johnsson, J.; Gonzalez, S.; Son, W.; Cho, C.; Hashimoto, J.; Otani, K.; Bründlinger, R.; et al. Development and Evaluation of Open-Source IEEE 1547.1 Test Scripts for Improved Solar Integration. In Proceedings of the 35th EU PVSEC, Marseille, France, 9–13 September 2019. [Google Scholar]
  16. Johnson, J.; Apablaza-Arancibia, E.; Ninad, N.; Turcotte, D.; Prieur, A.; Ablinger, R.; Brïndlinger, R.; Moore, T.; Heidari, R.; Hashimoto, J.; et al. International Development of a Distributed Energy Resource Test Platform for Electrical and Interoperability Certification. In Proceedings of the 2018 IEEE 7th World Conference on Photovoltaic Energy Conversion (WCPEC) (A Joint Conference of 45th IEEE PVSC, 28th PVSEC & 34th EU PVSEC), Waikoloa, HI, USA, 10–15 June 2018. [Google Scholar]
  17. Johnson, J.; Ablinger, R.; Bruendlinger, R.; Fox, B.; Flicker, J. Interconnection Standard Grid-Support Function Evaluations Using an Automated Hardware-in-the-Loop Testbed. IEEE J. Photovoltaics 2018, 8, 565–571. [Google Scholar] [CrossRef]
  18. Johnson, J.; Fox, B. Automating the Sandia Advanced Interoperability Test Protocols. In Proceedings of the 40th IEEE PVSC, Denvar, CO, USA, 8–13 June 2014. [Google Scholar]
  19. Jaalam, N.; Rahim, N.A.; Bakar, A.H.A.; Eid, B.M. Strategy to enhance the low-voltage ride-through in photovoltaic system during multi-mode transition. Sol. Energy 2017, 153, 744–754. [Google Scholar] [CrossRef]
  20. Pierre, B.J.; Elkhatib, M.E.; Hoke, A. Photovoltaic Inverter Momentary Cessation: Recovery Process is Key. In Proceedings of the 2019 IEEE 46th Photovoltaic Specialists Conference (PVSC), Chicago, IL, USA, 16–21 June 2019; pp. 1561–1565. [Google Scholar] [CrossRef]
  21. Duong, M.Q.; Leva, S.; Mussetta, M.; Le, K.H. A Comparative Study on Controllers for Improving Transient Stability of DFIG Wind Turbines During Large Disturbances. Energies 2018, 11, 480. [Google Scholar] [CrossRef] [Green Version]
  22. Ninad, N.; Apablaza-Arancibia, E.; Bui, M.; Johnson, J.; Gonzalez, S.; Darbali-Zamora, R.; Cho, C.; Son, W.; Hashimoto, J.; Otani, K.; et al. PV Inverter Grid Support Function Assessment using Open-Source IEEE P1547.1 Test Package. In Proceedings of the 2020 47th IEEE Photovoltaic Specialists Conference (PVSC), Calgary, AB, Canada, 14–19 June 2020; pp. 1138–1144. [Google Scholar] [CrossRef]
  23. Darbali-Zamora, R.; Johnson, J.; Gurule, N.S.; Reno, M.J.; Ninad, N.; Apablaza-Arancibia, E. Evaluation of Photovoltaic Inverters Under Balanced and Unbalanced Voltage Phase Angle Jump Conditions. In Proceedings of the 2020 IEEE PVSC, Calgary, AB, Canada, 14–19 June 2020; p. 8. [Google Scholar]
  24. IEEE 1547.1-2020 Std Test Script GitHub Repository. 2020. Available online: https://github.com/jayatsandia/svp_1547.1/tree/master3.7 (accessed on 18 October 2021.).
  25. Bundesverband der Energie- und Wasserwirtschaft, e.V. (German Association of Energy and Water Industries). Technical Guideline: Generating Plants Connected to the Medium-Voltage Network. Guideline for generating plants’ connection to and parallel operation with the medium-voltagenetwork), revised January 2013. 2008. Available online: https://erranet.org/download/generating-plants-connected-to-medium-voltage-network/ (accessed on 18 October 2021).
  26. North American Electric Reliability Corporation. NERC Standard PRC-024-2 Generator Frequency and Voltage Protective Relay Settings; North American Electric Reliability Corporation: Atlanta, GA, USA, 2016. [Google Scholar]
  27. California Public Utilities Commission. Electric Rule No. 21 Generating Facility Interconnections; California Public Utilities Commission: San Francisco, CA, USA, 2018. [Google Scholar]
  28. Darbali-Zamora, R.; Hernandez-Alvidrez, J.; Summers, A.; Gurule, N.S.; Reno, M.J.; Johnson, J. Distribution Feeder Fault Comparison Utilizing a Real-Time Power Hardware-in-the-Loop Approach for Photovoltaic System Applications. In Proceedings of the 2019 IEEE 46th Photovoltaic Specialists Conference (PVSC), Chicago, IL, USA, 16–21 June 2019; pp. 2916–2922. [Google Scholar] [CrossRef]
  29. EN 50530 Std. Overall Efficiency of Grid Connected Photovoltaic Inverters; European Standards. 2010. Available online: https://www.en-standard.eu/csn-en-50530-overall-efficiency-of-grid-connected-photovoltaic-inverters/ (accessed on 18 October 2021).
  30. OpenSVP Software. 2020. Available online: https://github.com/sunspec/svp (accessed on 18 October 2021).
  31. GitHub Repository for Laboratory Equipment Drivers (SVP Library that Enables Communication with Energy Lab Equipment). 2020. Available online: https://github.com/sunspec/svp_energy_lab/tree/dev37 (accessed on 18 October 2021).
  32. Ninad, N.A.; Lopes, L.A.C.; Rufer, A. A vector controlled single-phase voltage source inverter with enhanced dynamic response. In Proceedings of the 2010 IEEE International Symposium on Industrial Electronics, Bari, Italy, 4–7 July 2010; pp. 2891–2896. [Google Scholar] [CrossRef]
  33. Ninad, N.A.; Lopes, L.A.C. A Vector-controlled Single-phase Voltage Source Inverter Based Grid Interface Suitable for Variable Frequency Operation in Autonomous Microgrids. Electr. Power Components Syst. 2012, 40, 1266–1284. [Google Scholar] [CrossRef]
  34. Rodriguez, P.; Luna, A.; Etxeberria, I.; Hermoso, J.R.; Teodorescu, R. Multiple second order generalized integrators for harmonic synchronization of power converters. In Proceedings of the 2009 IEEE Energy Conversion Congress and Exposition, San Jose, CA, USA, 20–24 September 2009; pp. 2239–2246. [Google Scholar] [CrossRef] [Green Version]
  35. Power Calculation Component from Matlab-Simulink. Available online: https://www.mathworks.com/help/physmod/sps/powersys/ref/powerplldrivenpositivesequence.html (accessed on 18 October 2021).
  36. UL 1741 SA GitHub Repository for Test Scripts. 2020. Available online: https://github.com/sunspec/svp_UL1741SA/tree/dev/UL1741%20SA/Scripts (accessed on 18 October 2021).
  37. IEEE P2800/D6. 0 Std. Draft Standard for Interconnection and Interoperability of Inverter-Based Resources Interconnecting with Associated Transmission Systems; IEEE Standard Association: Piscataway, NJ, USA, 2021. [Google Scholar]
Figure 1. Detailed SVP and HIL test bed showing the hardware and software components.
Energies 14 06936 g001
Figure 2. SVP process of configuring, running, and analyzing the RT tests via the HIL API.
Energies 14 06936 g002
Figure 3. LVRT test results with high power and voltage profile following the ‘figure’.
Energies 14 06936 g003
Figure 4. Assessment of LVRT momentary cessation for Cat. III RT capabilities.
Energies 14 06936 g004
Figure 5. LVRT Consecutive testing for a two-phase disturbance.
Energies 14 06936 g005
Figure 6. LVRT test results using a random profile.
Energies 14 06936 g006
Figure 7. Comparison of LFRT results for the two laboratories.
Energies 14 06936 g007
Figure 8. HFRT results with frequency-droop enabled and disabled.
Energies 14 06936 g008
Figure 9. HFRT waveform data captured by the SVP during the tests.
Energies 14 06936 g009
Table 1. LVRT test conditions for Cat. III DER.
Test ConditionResidual Voltage (p.u)Minimum Duration (s)Required DER Mode Of Operation
A0.88–1.005Continuous Operation
B0.00–0.051Momentary Cessation
C0.00–0.5010Mandatory Operation
C’0.52–0.7010Mandatory Operation
D0.50–0.7020Mandatory Operation
E0.88–1.00120Continuous Operation
Table 2. Test parameter options for VRT tests.
Test ParametersDefault ValueOptions
Low Voltage mode settingsEnabledEnabled, Disabled
High Voltage mode settingsEnabledEnabled, Disabled
Low Power Output TestEnabledEnabled, Disabled
Low Power Output level (Between 25-50%)0.5 0.25 R 0.5
High Power Output TestEnabledEnabled, Disabled
High Power Output level ( 90 % )0.91 0.9 R 1.0
Cat. II and/or IIICAT IIICAT II, CAT III or Both
Consecutive RT testEnabledEnabled, Disabled
Apply disturbance to one phaseEnabledEnabled, Disabled
Which phase?AA, B or B
Apply disturbance to two phasesEnabledEnabled, Disabled
Which phase?AA, B or B
Which phase?BA, B or B
Apply disturbance to all phasesEnabledEnabled, Disabled
RT Profile (“Figure” is following the RT images from standard)FigureFigure, Random
Waveform acquisition needed?YesYes, No
RMS acquisition needed?NoYes, No
Table 3. Test scenarios possibilities for VRT.
ParametersValue/Description
VoltageLow or High
PowerLow or High
ModeConsecutive or Single
RT profileFigure or Random
Single-phase disturbanceA, B or C
Two-phase disturbanceAB, BC or CA
All-phase disturbanceABC
Table 4. Test parameter options for FRT tests.
Test ParametersDefault ValueOptions
Low frequency mode settingsEnabledEnabled, Disabled
Low frequency parameter (Hz)57.0 R +
Low frequency period (s)299.0 R +
High frequency mode settingsEnabledEnabled, Disabled
High frequency parameter (Hz)61.8 R +
High frequency period (s)299.0 R +
Power Output level (≥90%)0.91 0.9 R 1.0
Number of repetitions3 Z +
Cat. II and/or IIICAT IIICAT II, CAT III or Both
Waveform acquisitionYesYes, No
RMS acquisitionNoYes, No
Table 5. EUT Specifications.
ParametersCanmetENERGY2Sandia National Laboratories
Rated voltage level (L-N)120 V277 V
Apparent power rating10 kVA24 kVA
Power rating10 kW24 kW
Output var rating4.4 kVAr12 kVAr
Inverter typeThree-phaseThree-phase
Nominal AC Frequency60 Hz60 Hz
Table 6. Test condition sequence for LVRT.
Sequence of Test ConditionsNotes
A, B, C, D,
A, B, C, D,4Test Condition E may be conducted at 0.88 ± 0.02 pu
A, B, C, D, Eor at any voltage between 0.88 pu and 1.00 pu
A, B, C’, D, E
Publisher’s Note: MDPI stays neutral with regard to jurisdictional claims in published maps and institutional affiliations.

