Abstract
The aim of this work is to design a piezoelectric power generation system that extracts power from the vibration of a cantilever beam. A semi-cylinder placed in a water stream and attached to the beam is excited into vortex-induced vibrations (VIV), which triggers the piezoelectric deformation. The mechanical system is modelled using parametric equations based on Hamilton’s extended principle for the cantilever beam and the modified Van der Pol model for the bluff body (the semi-cylinder). These equations are simulated using the MATLAB software. The dimensions of the model, the flow velocity and the resistance are treated as design parameters and an optimization study is conducted using MATLAB to determine the combination of optimal values at which maximum power is extracted. The key findings of this research lie in the identification of the effect of changing the design parameters on output power. In addition to the numerical simulation, a finite element analysis is carried out on the bluff body and the hydrodynamic forces and velocity profiles are observed. It is determined that the vibration amplitudes increase with increasing diameter of the bluff body, length of the bluff body and water velocity.
1. Introduction
Traditional fossil-fuel-based power plants tend to pose many risks to the environment including releasing particulate matter that binds to nitrogen oxides and sulfur dioxide, which in turn causes health problems such as asthma, bronchitis and premature death [1]. In addition, many power plants are built near water streams to be used as coolants. The same water used for cooling is discharged back into the water, only now in its pollutant form, which is extremely harmful to the aquatic life [1]. These risks are only two of many. UCS USA [2] reported that there is a link between running power plants and global warming due to carbon and methane emissions. With the rising pollution rates over the last few decades, there is an urgent need for power generation from renewable sources. In 2017, hydropower was reported to account for 1.8% of Britain’s total electricity supply, which made up 18% of Britain’s renewable energy supply [3]. Hydropower mainly comes in the form of dams that control water flow and turbines which, in turn, convert stored energy in the water to electrical energy. However, this method of power generation is accompanied by a few risks. Dams have the capacity to impact rivers and the aquatic life by preventing the upstream and downstream migration of aquatic organisms and nutrients and by altering the hydrological flow pattern of rivers [4]. Therefore, a different method of power generation from water flow is examined in this paper. This technique involves the flow of water over a cylinder immersed in a river stream. The flow excites the cylinder into crossflow vibrations, which causes the deformation of a piezoelectric beam attached to it.
Vortex shedding occurs when a flow separates from an elastic bluff body submerged in the fluid [5]. When a cylinder is submerged in a stream of water with velocities exceeding laminar flow, the inertia of the water renders it incapable of negotiating the half of the cylinder facing the downstream. As such, the water flow tends to separate from the top surface of the cylinder, and then peels off in a clockwise motion. This clockwise motion of the fluid is a series of shed vortices, known as the Karman Vortex Street. The same phenomenon occurs at the bottom surface of the cylinder, only the vortices are shed in a counter-clockwise motion [6]. The shedding of these vortices exerts a periodic force on the body, causing it to vibrate transversally with respect to the flow in a simple harmonic motion, provided that the cylinder is restricted such that is does not move along the water flow [6]. These oscillations are known as vortex-induced vibrations (VIV). When the frequency of this motion (the natural frequency) nears the vortex shedding frequency (within ±10%), nonlinear resonance is observed and the amplitude of the cylinder vibrations increases to a peak [7]. This is known as self-excited oscillations VIV. On the other hand, forced-oscillations VIV occurs when the velocity and amplitude of the cylinder vibrations are preset to forcibly produce resonance [7].
In general, recent studies on VIV focus on the effect of certain parameters on the response of a vibrating cylinder and the efficiency of energy extraction. They also investigate different ways to harvest energy from the mechanical vibration of the cylinder.
Xu, Qin, & Gao [8] studied the excitation regions and displacement curves and amplitudes in vortex-induced vibrations of slender, flexible cylinders. Their study shows that there were two excitation regions for different ranges of reduced velocity. The cylinder assumed different displacement shapes in each of the two excitation regions.
Leclercq and de Langre [9] studied the effect of flow-induced bending (in-line deflections) due to the drag caused by VIV on the dynamics of slender cantilever cylinders. It was found that the bending observed in the cylinder exposed to fluid flow switched the system from a single mode lock-in to a multi-frequency response. An impact of this transformation was reduced amplitude vibrations.
Vortex-induced vibrations can be used to generate power. There are different systems that have been built/designed in the past. For example, the cylinder can be mounted on a piezoelectric transducer that converts the deformation caused by the movement of the cylinder into an electric charge [10]. Another method is to attach the cylinder to a linear electromagnetic alternator (a magnet and a coil), where the relative motion between the magnet and the coil induces a current through the coil as per Faraday’s Law of electromagnetic induction [10]. There is also the VIVACE (Vortex Induced Vibration Aquatic Clean Energy) system which was patented in 2008 [11]. This transmits the mechanical energy produced by the cylinder to a generator via a gear-belt system. The generator then transforms the mechanical energy into electrical energy [12].
Among the different methods for power generation, piezoelectricity has been proven by Sun et al. [13] and other previous experimentations to produce power in low-velocity flows. The electromagnetic method requires relatively demanding maintenance requirements compared to piezoelectricity [14].
Piezoelectric materials are materials than can produce an electric voltage when exposed to mechanical strain. This is known as the piezoelectric effect. It also works in reverse, that is, the materials tend to deform if a voltage is applied to them [15]. This principle is the basis of piezoelectric transducers. According to Woodford [16], the crystals inside a piezoelectric material are electrically neutral but not symmetrically arranged. When a mechanical stress is applied to it, however, the atoms rearrange due to the asymmetry, which upsets the balance of positive and negative charges and causes an electric potential to appear.
The amount of generated electrical energy is mainly dependent on the strain induced in the piezoelectric layer and on the kind of this material. Different piezoelectric materials can be used to generate power. The materials with the highest piezoelectric properties include PMN-PT and PZN-PT. However, they are highly sensitive to temperature change, susceptible to fatigue and difficult to manufacture. Lead Zicronate Titanate (PZT) is the most commonly used material for piezoelectric energy harvesting since it has sufficient piezoelectric properties while more convenient in terms of sensitivity to temperature, fatigue and manufacturing when compared to PMN-PT and PZN-PT [17].
The PZT ceramics used in energy harvesting [18] are replaced by inorganic and composite materials. Among them, microfiber composite (MFC) material is favoured due to its good bending performance which leads to considerable strains of piezoelectric elements [19]. Shan et al. [20] investigated the feasibility of energy harvesting of an MFC piezoelectric energy harvester (PEH) induced by water vortex shedding.
Modeling and simulation of a piezoelectric generator helps to evaluate the performance of new materials with varying piezoelectric properties. Mokhtari et al. [21] introduced and investigated an electrospun PVDF/LiCl nanogenerator to determine the piezoelectric coupling constant using both experimental and analytical approaches.
There are different methods for enhancing energy harvesting such as Vortex Shedding-Induced Vibration which piezoelectric harvester immersed in the wake of another object [22,23,24,25], Interference of Multiple Harvesters with wake interference [26,27,28], Cantilever Beam geometry and stiffness [29,30,31], and Stable System by Magnetic Force by introducing magnet-induced nonlinearity [32,33].
Energy harvesting is affected by the orientation of the piezoelectric harvester [34,35]. Coupled damping is the smallest in the vertical arrangement among all configurations so this arrangement produces the largest power.
The most promising method for increasing the output power of a piezoelectric harvesters system is tuning the structural frequency to synchronize with the vortex shedding frequency [36,37,38]. This phenomenon is termed as lock-in. The efficiency of energy extraction through buffeting, galloping or VIV is maximized in the vicinity of lock-in [39]. Moon et al. [40] investigated the effect of cantilever beam mass tuning on the output power and an increase of 508.5% was obtained.
In the other studies different arrangements of the VIV energy harvesting setups have been analyzed. The bluff body can be placed at the upstream side of the piezoelectric in the direction of fluid flow. The influence of wake interference is a defining factor when the harvester is placed behind the bluff body. The lock-in region would not occur if the harvester is arranged in the wake of the bluff body with a small centre-to-centre spacing (1.5 times the diameter). In cases where the spacing ratio is larger than 3, the efficiency would decrease significantly due to the negative effect the spacing would have in terms of VIV suppression. The wake structure is sensitive to the spacing between the harvester and bluff body, the bluff body shape and the flow velocity [41]. The spacing varies over time due to the vigorous streamwise response and as a result the wake interaction varies too. Abdelkefi et al. [42] evaluated the output power of a square piezo aeroelastic energy harvester placed downstream of an oscillating circular cylinder. A wake-induced galloping was observed for the square cylinder at a wide operating range of wind speed.
Suitable geometry significantly improves energy conversion efficiency. It is due to the fact that the highest output power will be obtained when the structural frequency matches the resonant vibration frequency. The VIV amplitude and frequency vary with the cross section. There are several studies which have reviewed VIV for a single circular cylinder [43,44,45,46,47]. The amplitude, frequency, and vorticity distributions are the most important parameters that effectively describe and quantify flow-induced motion (FIM). In particular, the effect of cross section shape on FIM response and energy harvesting of a bluff body was analysed by Lian et al. [48]. This analysis showed that a triangular and a circular cylinder have a higher energy transfer ratio than a semi-cylinder.
Different cross sections have been extensively studied in VIVACE converter or application of VIV generators in wind [49] but results are not applicable for generators with a piezoelectric cantilever beam. Also, parameters may have different effects depending on the selected model. For example, for the VIV model, the onset velocity decreases with the increase of bluff body mass, while for the galloping model, the onset velocity increases with the bluff body mass. The galloping model has two optimum load resistance values at relatively small flow velocities while the VIV model has only one optimum load resistance at all flow velocities.
Beams with other common sections such as square, triangular, and D-shaped have also attracted attention. Ewere et al. [50] developed a model for a square beam and predicted the output power yield. Zhang et al. [51] studied the effect of attack angles on the harvested power of a square beam. It was found that an attack angle of 45° is the optimal one. In a study of the triangular cross section case [52], a vertex angle of 130° was recognized as the most preferred. Trapezoidal beams present a greater potential for energy harvesting as compared with a square beam [53]. A D-shaped beam shows a maximum output power of at a wind velocity of [54] whereas peak output power for a T-shaped piezoelectric cantilever is in wind speed of [55]. Studies show that other shapes such as three-blade with Y-type cross-section [25] or a fork-shaped cross section bluff body [56] enhance the performance significantly and have a lower onset of wind speed.
The onset galloping speed is sensitive to the cross sectional shape [57]. At a constant resistance load the D-shaped beam achieved the highest harvested power [58]. Also in a study by Sun et al. [13] in a circulating water channel, the maximum power density was achieved through a D-shaped bluff body. Nevertheless, Yang et al. [59] reported that the square beam reached the highest peak power in comparison with the rectangular, triangular, and D-shaped beams.
Previous research that studied the fluctuating cross-flow forces and vortex shedding around bluff bodies with the square beam [60] and a triangular prism [61] experimentally found a significant link between flow orientation and aspect ratio. The decrease in aspect ratio is generally accompanied with increasing vortex shedding frequency.
Sun et al. [13] investigated piezoelectric energy harvesting by VIV and galloping of water whose velocity ranged between and . In their study, three bluff bodies with different cross-sections were used: circle, semi-circle and isosceles triangle with an 80° top angle, and the results in terms of vortices formation and power generation were compared. They showed that power output increases with flow velocity and bluff body mass and that the onset velocity increases then decreases as load resistance is increased. Simulations of the experimental setup and the modelling equations showed that the semi-cylinder was exposed to the highest lift force, which translates to the largest vibration amplitudes, and in turn, the highest capacity for power harvest among the three shapes.
Qureshi et al. [14] studied piezoelectric power generation combined with VIV. The article states that piezoelectric energy harvesters produce power when they are exposed to cyclic pressures in the up and down direction due to fluid flow. They require no maintenance, unless the surrounding conditions vary significantly from the optimal conditions under which they were designed. Piezoelectric energy harvesters are composed of piezo-ceramic (or piezo-plastic) cantilevers that transform the kinetic energy of the water flow into electrical energy. Their work showed that a 15 mm-long cantilever is capable of producing only.
The aim of this research is to study the generation of power from the deformation of a piezoelectric transducer mounted directly on the bluff body in a vertical arrangement. The vortex shedding behind the bluff body (semi-cylinder) alters the pressure distribution causing periodic lift forces to act on the bluff body which excites it into crossflow vibrations. On the bluff body, a substrate layer is mounted and attached to a piezoelectric sheet. The piezoelectric material becomes compressed or tensioned and produces electrical energy.
For this study, the system is considered to be placed in a river in Huddersfield, GB. The velocity of the water is approximately 20 cm/s and the river is almost one-meter in depth.
Previous works that discuss piezoelectric power generation induced by vortex-induced vibrations do not optimize the system. Thus, the main objective of this paper is to find the set of design parameters (to be defined later) that allows the extraction of maximum power that the system is capable of producing.
2. Materials and Methods
2.1. The System
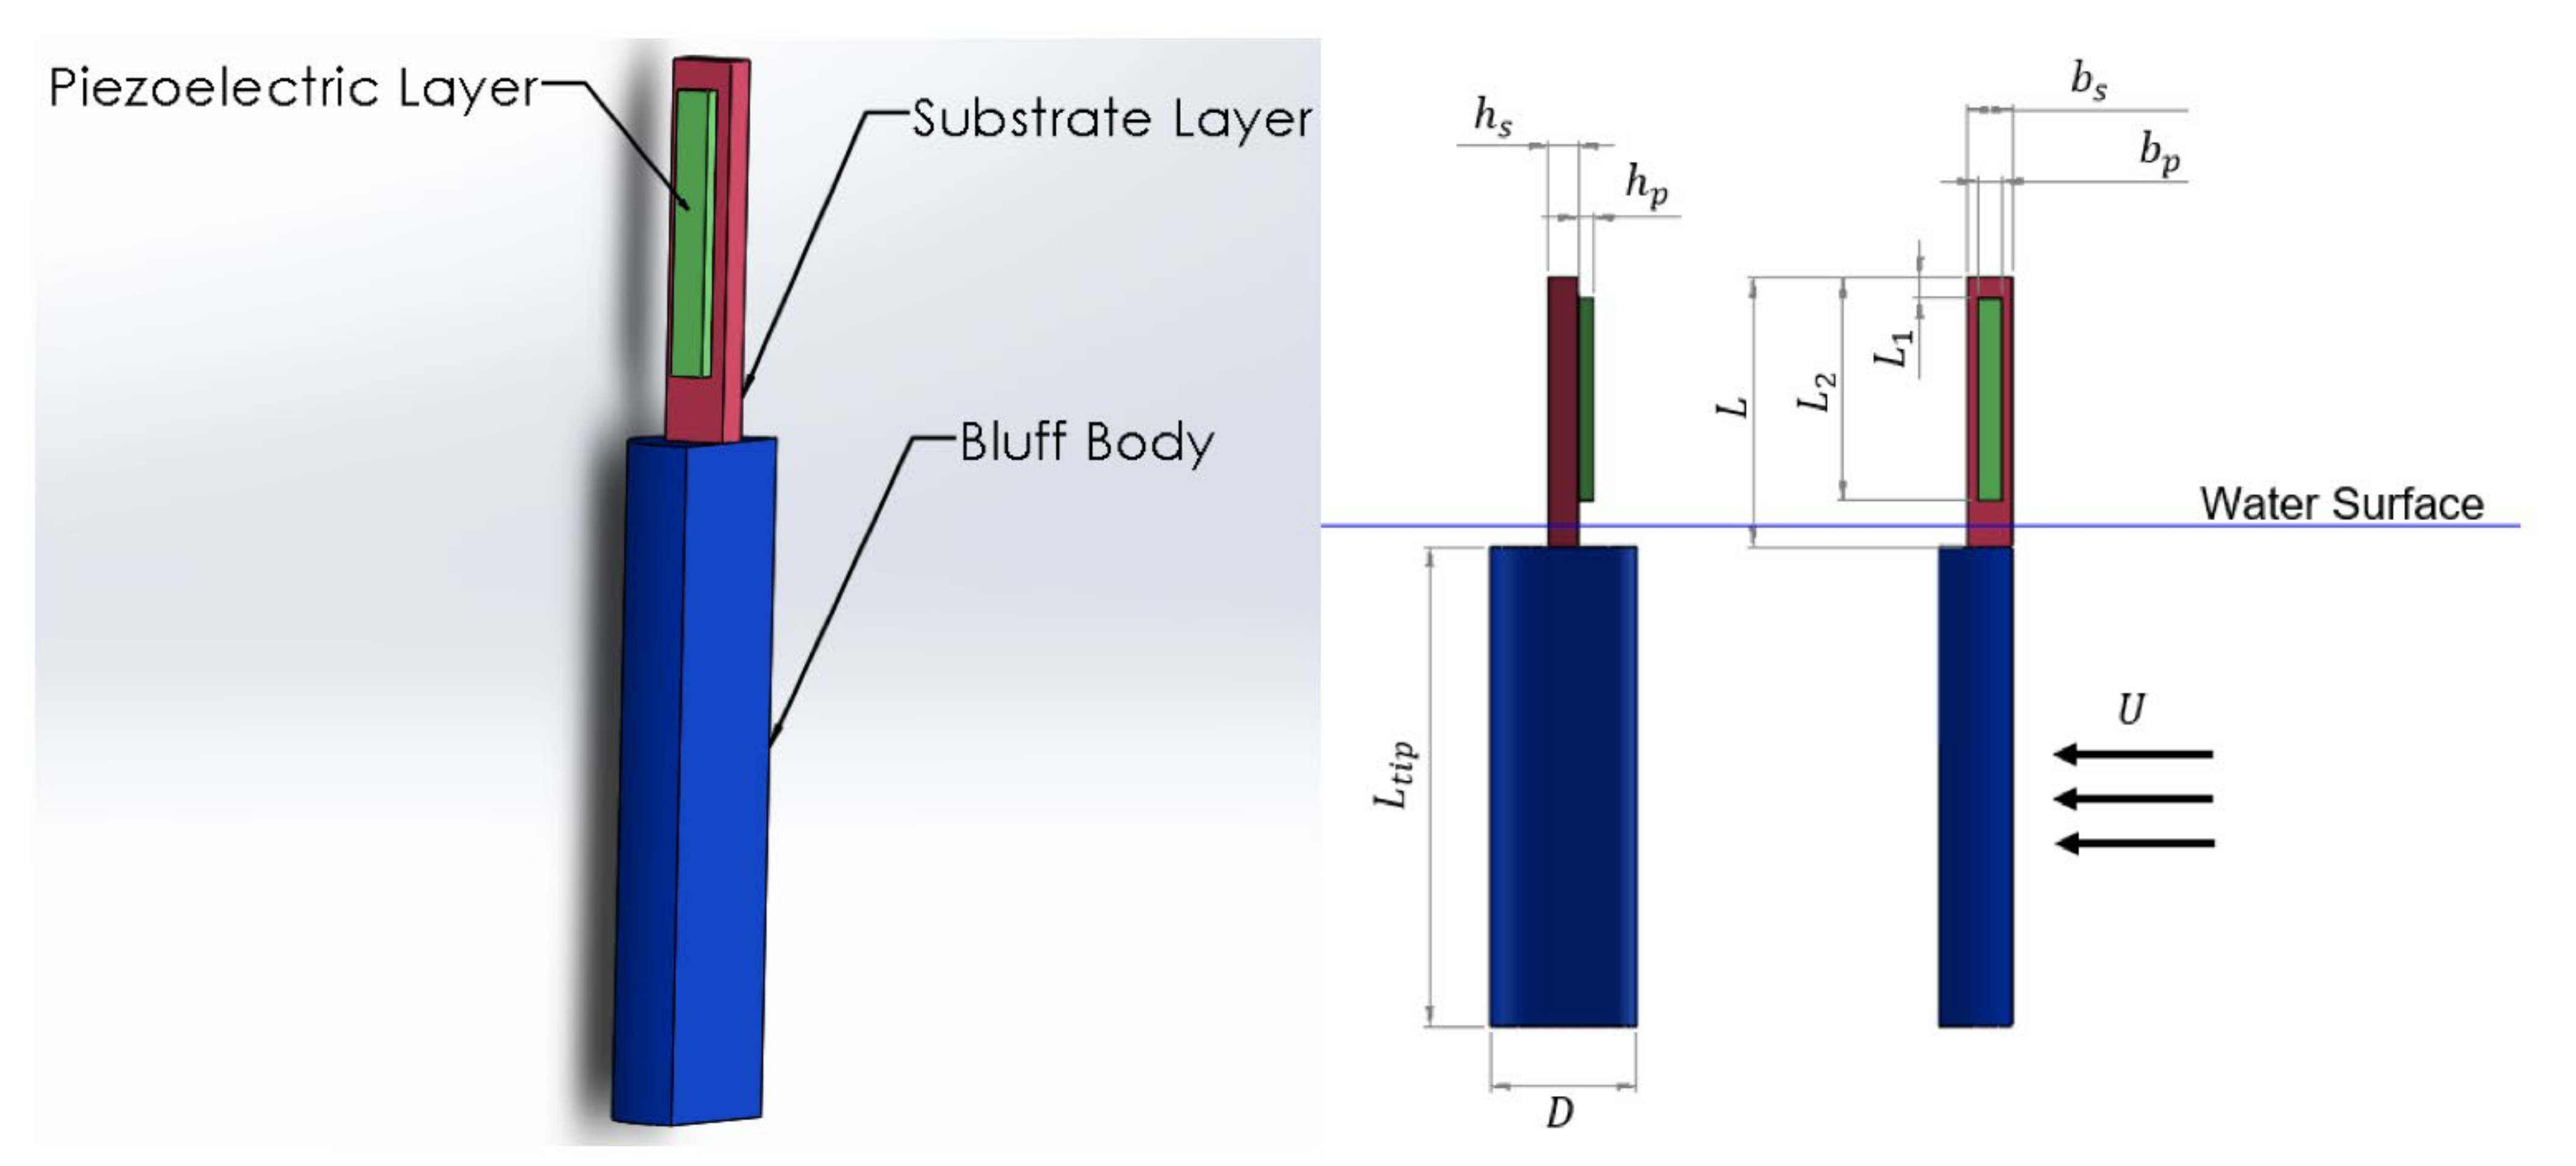
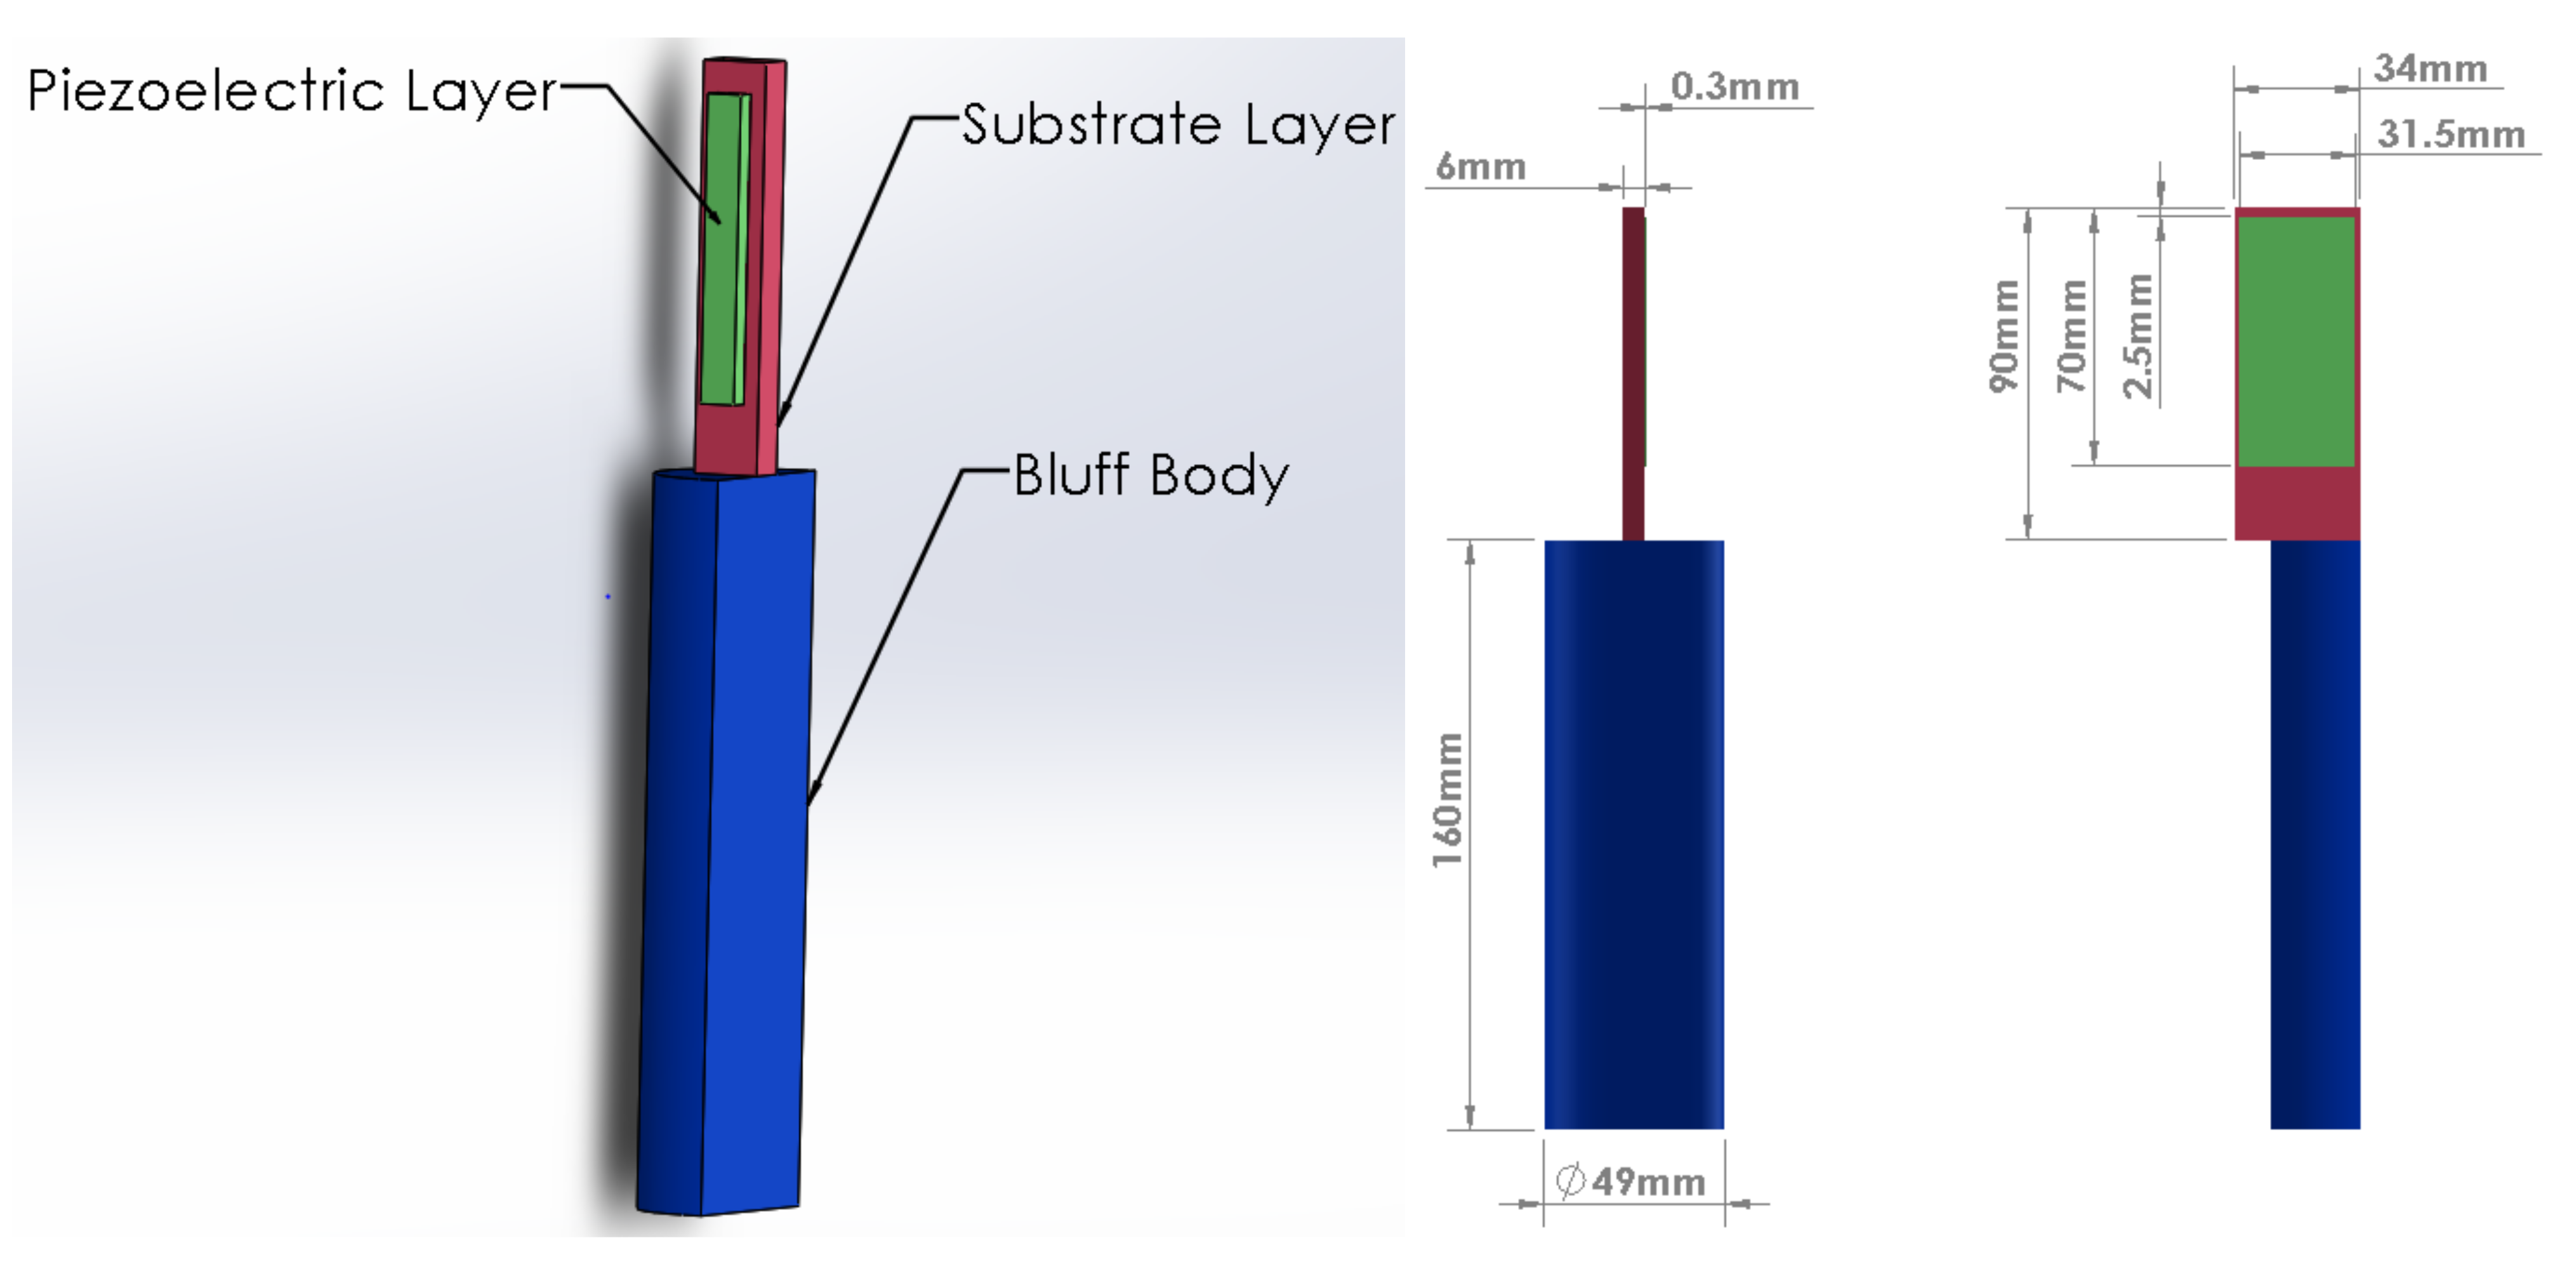
The system consists of a semi-cylindrical bluff body of Silicon material attached to a cantilever beam. Due to its density compared to the density of water, Silicon tends to resist the flow and thus ensures vortex shedding. The cantilever beam is composed of a substrate layer and a piezoelectric layer. The substrate layer is a carbon sheet while the piezoelectric layer is a macro fiber composite (MFC) sheet, which consists of piezoelectric fibers. The top surface of the bluff body is placed below the surface of the water. The cantilever beam is extended into the air. The top surface of the substrate is mounted such that the bluff body and cantilever beam are prevented from moving along the water flow. The flow hits the flat surface of the semi-cylinder and is perpendicular to it. Vibrations are to only take place transversely, with respect to the velocity vector. The cantilever beam and bluff body setup and a dimensioned drawing of the model are shown in Figure 1. The model is also connected to a resistance box. Weirs and notches can be placed behind the setup to increase the velocity of the flow moving towards the bluff body. The most convenient method can be decided upon once the velocity required for power generation is obtained.
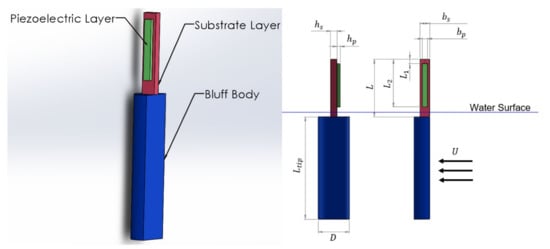
Figure 1.
3D Model and Dimensioned Drawing of the System.
and are the length and the diameter of the bluff body respectively. , and are the length of the cantilever beam, the length between the fixed end of the cantilever beam and the starting point of the piezoelectric layer and the length between the fixed end of the cantilever beam and the ending point of the piezoelectric layer. and are the widths of the piezoelectric layer and substrate layer respectively while and are the thicknesses of the piezoelectric layer and substrate layer respectively. if the velocity of the water and is the value of the resistance specified by the resistance box.
2.2. Modelling
The study begins by defining the equations that govern the system. The modelling equations link the vibrations performed by the bluff body and the fluid flow. The equations also link these vibrations to the deformation observed in the piezoelectric layer of the cantilever beam. Lastly, the power extracted from the deformation of the piezoelectric layer is defined. After defining the modelling equations, an optimization study is conducted using MATLAB. Eleven design parameters are identified for this project and the optimization is carried out to determine the set of design parameters that harvests the maximum power. A set of constraints and bounds is also specified for the design parameters.
To find the optimal parameters that would harvest maximum voltage, and in turn power, the model described in The Setup Section of this report is governed by a set of parametric equations based on design parameters. The bluff body has a semi-circular cross-section. These equations are applicable to one semi-cylinder only. The number of semi-cylinders in parallel required to harvest a certain amount of power can then be obtained based on the results of one semi-cylinder.
2.2.1. Mathematical Approach
Using Ohm’s Law and the relation between power and voltage, the harvested power can be expressed as
where is the harvested power and is the harvested voltage. is the value of the resistance provided by the resistance box. The resistance box is a source of variable resistance. The harvested voltage is defined as [13]
where is the piezoelectric coupling term, is the modified frequency of the energy harvester in the modified Van der Pol model, is the amplitude of the mode coordinate and is the capacitance of the MFC layer. describes the vibration motion of the bluff body.
The capacitance is defined as [13]
with , , and being the width of the piezoelectric layer, the thickness of the piezoelectric layer, the length between the fixed end of the cantilever beam and the starting point of the piezoelectric layer and the length between the fixed end of the cantilever beam and the ending point of the piezoelectric layer respectively (refer to Figure 1). is the permittivity at constant strain, also known as the dielectric constant.
The electromechanical coupling term , which describes the conversion of mechanical energy into electrical energy, is fully defined by using Equations (4)–(7) shown below [13]
where is the derivate of the mode shape with respect to , is the piezoelectric coupling coefficient, is the piezoelectric stress constant, is the strain coefficient of the piezoelectric layer and is the position of the neutral axis. and are the thickness and the width of the substrate layer respectively (refer to Figure 1) and and are the Young’s moduli of the substrate and piezoelectric materials respectively.
The amplitude of galloping of the bluff body is calculated using Equations (8)–(11) [13]. Galloping is the low-amplitude vibrational motion that occurs at low velocities and is incapable of producing vortices that exert negative hydrodynamic forces.
is the negative linear damping coefficient, is the first natural frequency, is the mechanical damping coefficient, is the electrical damping and is the cubic hydrodynamic coefficient. and are hydrodynamic coefficients and is the incoming water velocity.
The modified frequency is given by [13]
with being another hydrodynamic coefficient. Thus, it has to satisfy the following equation:
The hydrodynamic coefficients are defined as shown below [13]
where is the density of water, and are the diameter and the length of the bluff body respectively and is the length of the cantilever beam (refer to Figure 1). is the empirical experimental linear galloping coefficient, while is the empirical experimental cubic galloping coefficient. is the added mass coefficient and in this case, is equal to the density of the bluff body divided by the density of water.
Two main factors affect the frequency of vortex shedding. The diameter of the bluff body is inversely proportional to the vortex shedding frequency, and the flow velocity is directly proportional to the vortex shedding frequency [6]. These relations are depicted by the Strouhal relationship () where is the Strouhal number, is the vortex shedding frequency, is the diameter of the bluff body and is the velocity of the flow [5]. The relationship between the Strouhal Number () and Reynolds Number () can be estimated using the following empirical formula [62]:
Over a large range of Reynolds Number (), the Strouhal Number is almost constant at a value approximately equal to [62]. With the Strouhal number being a constant at around , the vortex shedding frequency can be calculated.
Finding the First Mode Shape at and the First Modal Frequency
The modal shapes describe the deformation that occurs in the cantilever beam. is the coordinate along the cantilever beam and is the point at the top of the beam where it is in contact with the support. The first modal shape can be found using equations Equations (18)–(20) [13]:
where , and are applicable for the conditions , and respectively.
The coefficients , , , , , , , , , , , , and can be found using the following boundary and orthogonality conditions [13]:
In the above equations, and are the mass per unit length of the substrate layer and the mass per unit length of the substrate and piezoelectric layers respectively, with and being the densities of the substrate and piezoelectric layers respectively. The stiffness of the substrate layer and the stiffness of the substrate and piezoelectric layers are given by the following equations:
where , and . is the mass of the bluff body and is the product of the density of the Silicon material that comprises the bluff body and its volume (). is the length between the center of gravity of the bluff body and the starting point of the piezoelectric layer (.
is the rotational inertia of the bluff body with respect to the end of the beam. Since inertia is the product of the mass and the square of the length, where is the distance between the center of gravity of the semi-cylinder and the end of the beam.
The first natural frequency is [13]
The boundary and orthogonality conditions give rise to fourteen complex equations to be solved with the aid of MATLAB. All these equations, along with the cantilever beam mechanical property [13], comprise a system of fifteen equations and fourteen unknowns, to be solved using MATLAB, such that the mode coefficients, and in turn the mode shapes, are obtained. Dimensions, resistance and flow velocity, are treated as design variables.
Equations (1)–(37) used to describe the cantilever beam behavior are based on Hamilton’s extended principle, which focuses on the displacement of the system and its time derivatives, as well as the kinetic and potential energies that the mechanical system holds. The equations used to describe the vibrations of the bluff body are based on the modified Van der Pol model which is an oscillatory model with non-linear damping.
Finding the Onset Velocity
The system is to be placed in a river in Huddersfield. The water velocity is low. However, it may be required to increase the water velocity by adding weirs or notches. The onset velocity is the velocity below which no considerable power is produced. The onset velocity is defined as [13]
where .
In this paper, the water velocity is treated as a design parameter. However, during optimization of this parameter, the onset velocity if calculated at each iteration to ensure the water velocity used as an input is greater than the onset velocity.
Defining the Constants
The densities of water, the substrate layer, the piezoelectric layer and the bluff body material (Silicon) have the values , , and respectively. The Young’s Moduli of the substrate and the piezoelectric layer have the respective values and . Previous experimentation [63] show that the mechanical damping coefficient for a semi-cylinder is . The permittivity of free space is . The piezoelectric strain coefficient of MFC (the piezoelectric layer) is . The permittivity at constant strain for the MFC is [13]. Finally, the hydrodynamic galloping coefficients and for the semi-cylinder are equal to and respectively [13].
2.2.2. Numerical Simulation
Constraints
There are certain constraints to this design analysis. From the setup’s design (Refer to Figure 1), it can be seen that the separate lengths and should be less than the length of the cantilever beam. In addition, the width of the piezoelectric layer should be less than or equal to that of the substrate layer. Therefore, the design problem is subject to the following constraints:
In addition to the aforementioned constraints, some of the design parameters are also bounded. The substrate and piezoelectric layers can be found in different sizes and thus, the parameters , , and are unbounded, except by the aforementioned constraints. The parameter is unbounded, and the upper limits of the lengths and are defined by the value of . L1 should be greater than 0 to allow the cantilever beam to be attached to the top support through the substrate layer rather than the piezoelectric layer. The depth of the river environment where this setup is intended to take place is no greater than one meter, which means that the length of the bluff body
should be less than . The water flows at approximately . However, weirs and notches can be used to increase the water velocity to around . The diameter and the resistance are unbounded. Therefore, the bounds of the design parameters are defined by the following:
2.3. Optimization
The design problem is simulated using a number of MATLAB codes. First, the boundary and orthogonality conditions (Equations (21)–(34)) are expanded using a separate code. These expanded equations are then copied into a function code, the aim of which is to find the values of the coefficients , , , , , , , , , , , , and . As for the main code, it starts by defining the constants, the parameters that can be calculated from the constants and the design parameters. Then a “for loop” is introduced that simulates Equations (1)–(16), (20) and (35)–(37). Inside the “for loop” is also a statement that calculates the onset velocity (Equation (38)) and checks whether or not this value is greater than the flow velocity. It is observed that when the flow velocity is less than the onset velocity, the harvested power obtained is negligible. Therefore, for simplicity and for a better reading, the code is made to return a value for the power when the onset velocity exceeds the flow velocity.
There are 11 design parameters for this optimization problem: , , , , , , , , , , and . Each of these parameters is defined as a vector of values (which adhere to the bounds and constraints) while the other parameters remain constant. The power at each cell of this vector is calculated using a “for loop”, and the optimal parameter at which maximum power is observed, is identified accordingly. Several rounds of this operation are performed for the 11 design parameters, until two consecutive rounds produce the same optimal values.
3. Verification of Mathematical Model and MATLAB Codes
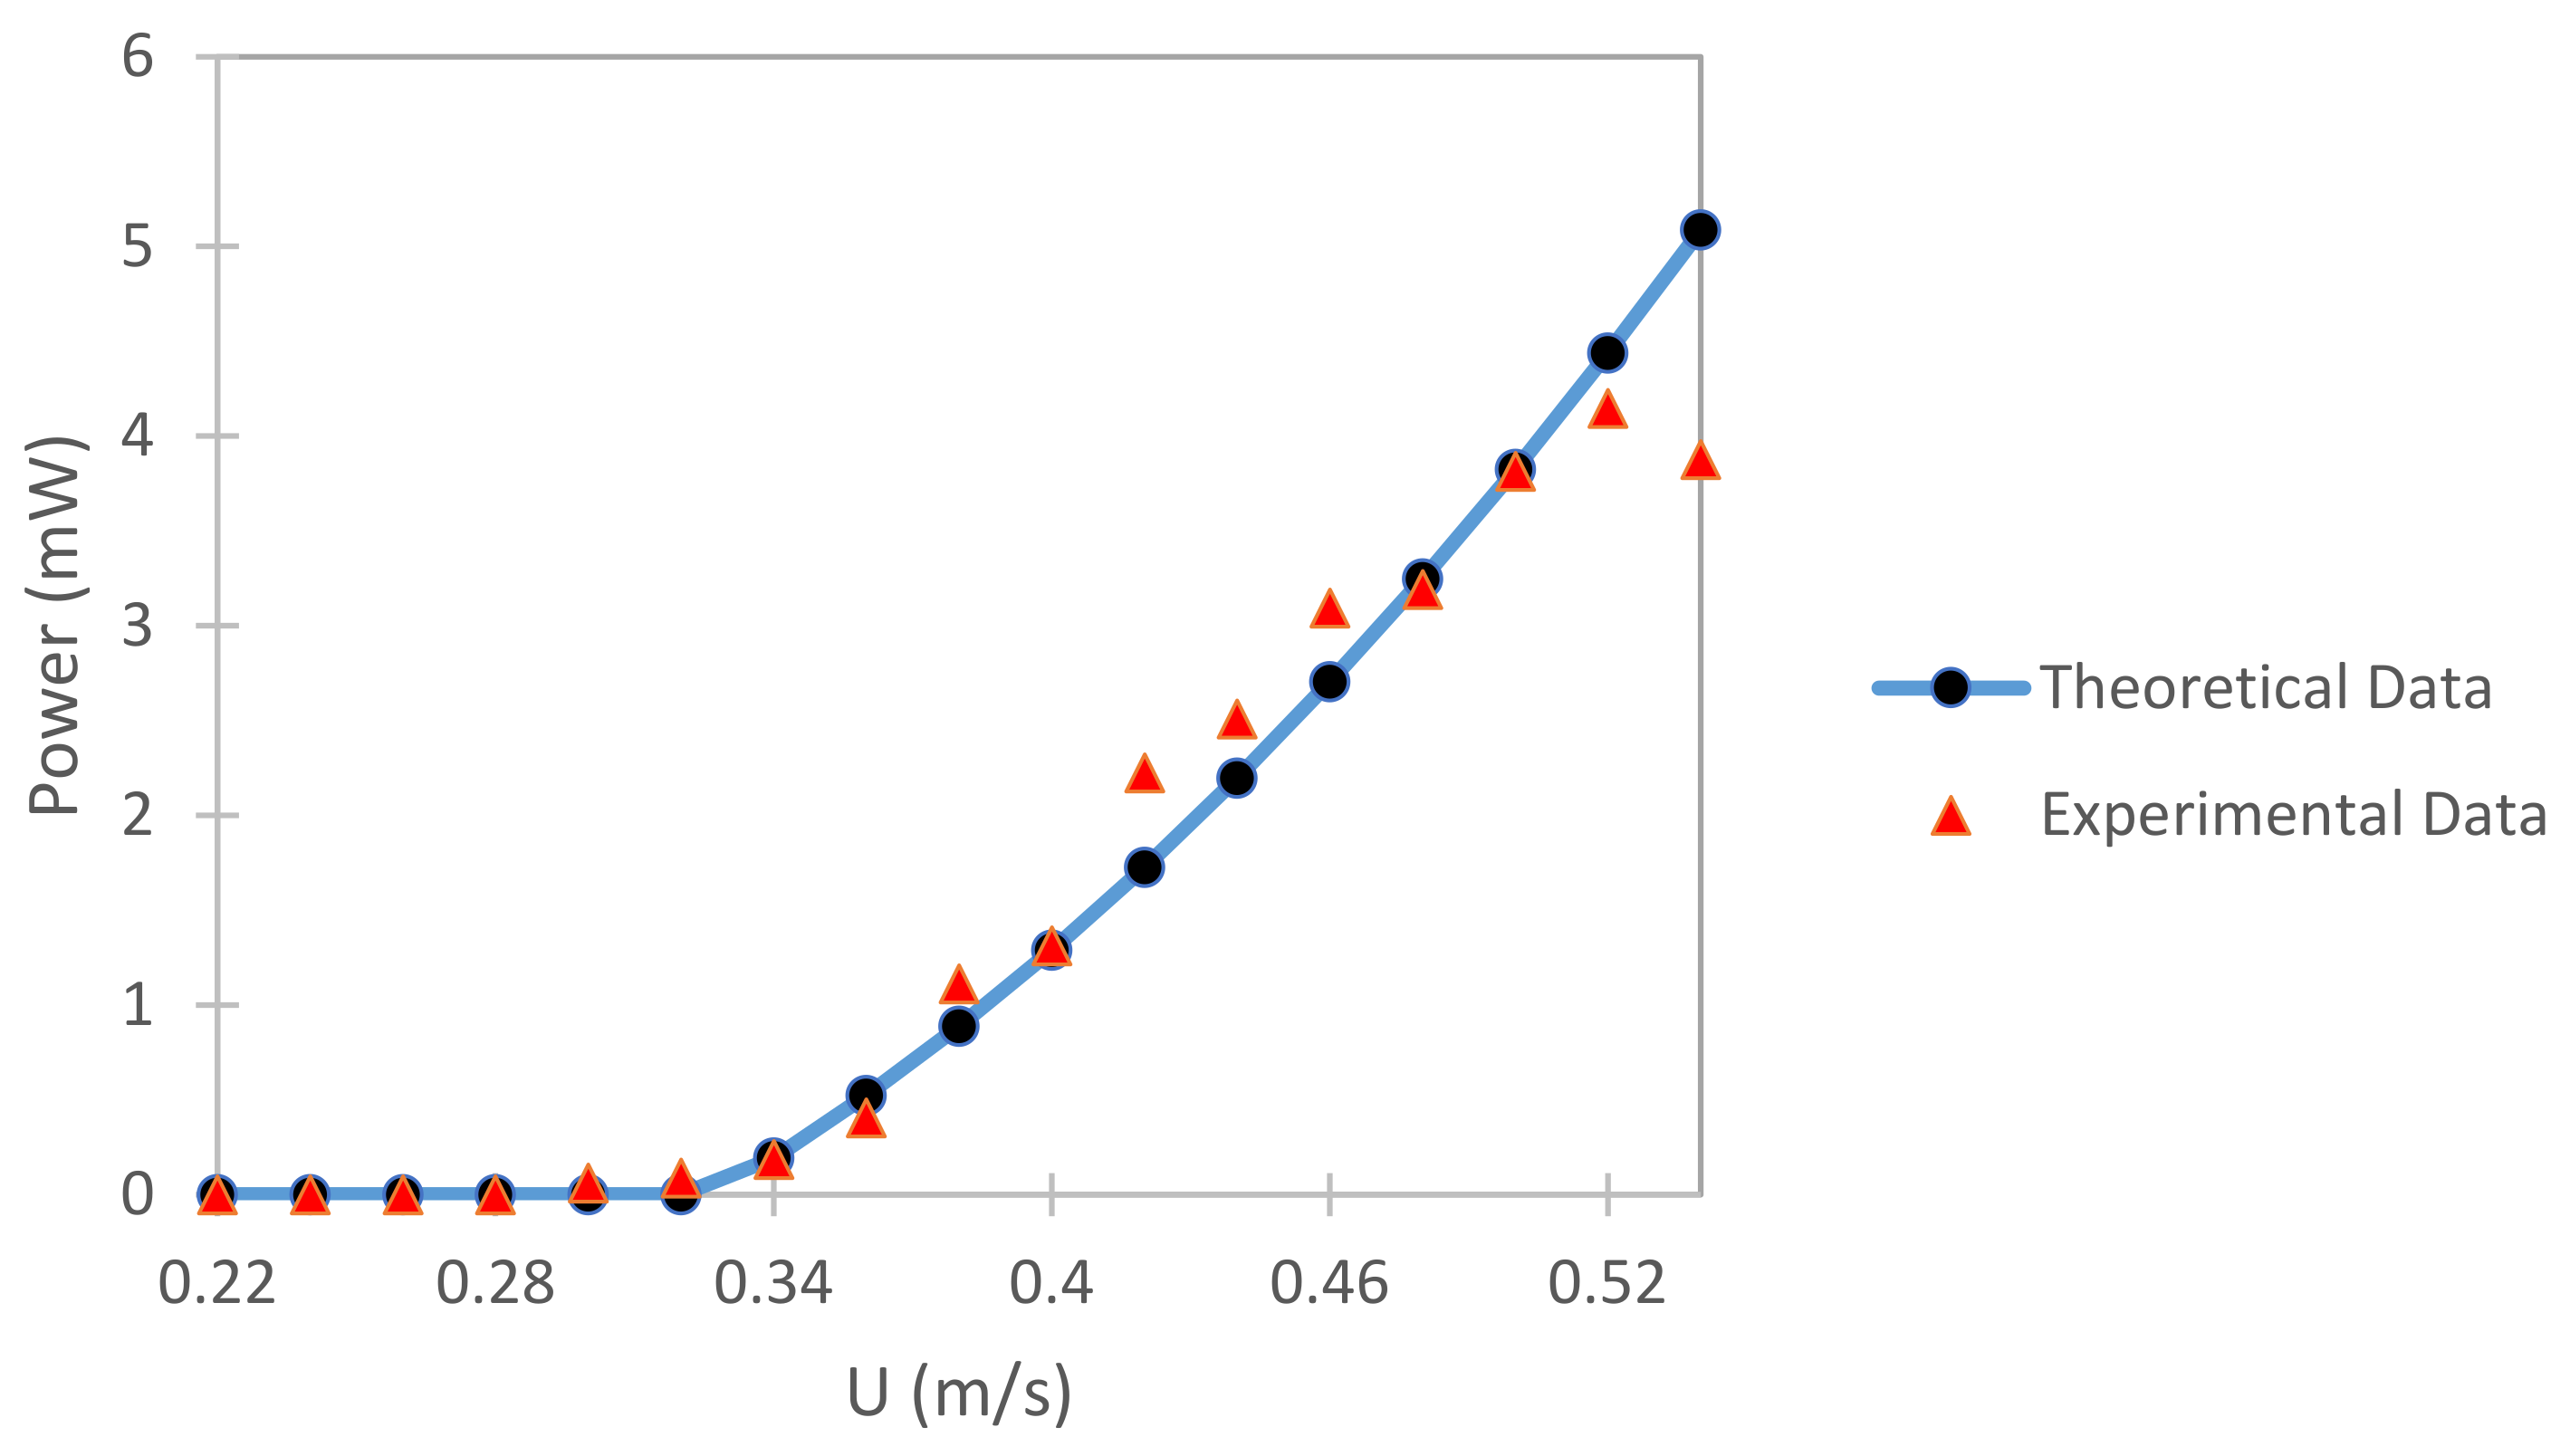
Prior to carrying out optimization, the mathematical model describing the mechanical setup, as well as the corresponding MATLAB codes are verified by comparing the theoretical data produced by the codes with experimental data of literature [30]. The experimental setup used in [30] is identical to the one shown in Figure 1. The values of the design variables used in the experimental setup are shown in Table 1. The MATLAB code is modified to match the eleven design parameters. Figure 2 compares the theoretical and experimental values of RMS power versus water velocity which show a good agreement. RMS power is defined as , where is the RMS voltage and defined as . The voltage is calculate using Equation (2) () and all the subsequent equations that relate it to water velocity. The onset velocity for this experimental setup as per the MATLAB codes is .

Table 1.
Values of Design Parameters Used in Experimental Setup [30].
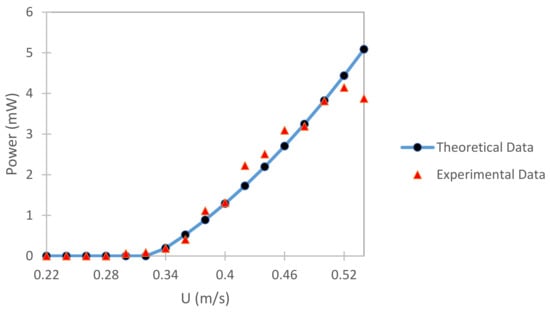
Figure 2.
Graph Showing Experimental and Theoretical Values of Harvested Power Varied with Water Velocity .
4. Optimization Results
4.1. Optimal Design Parameters
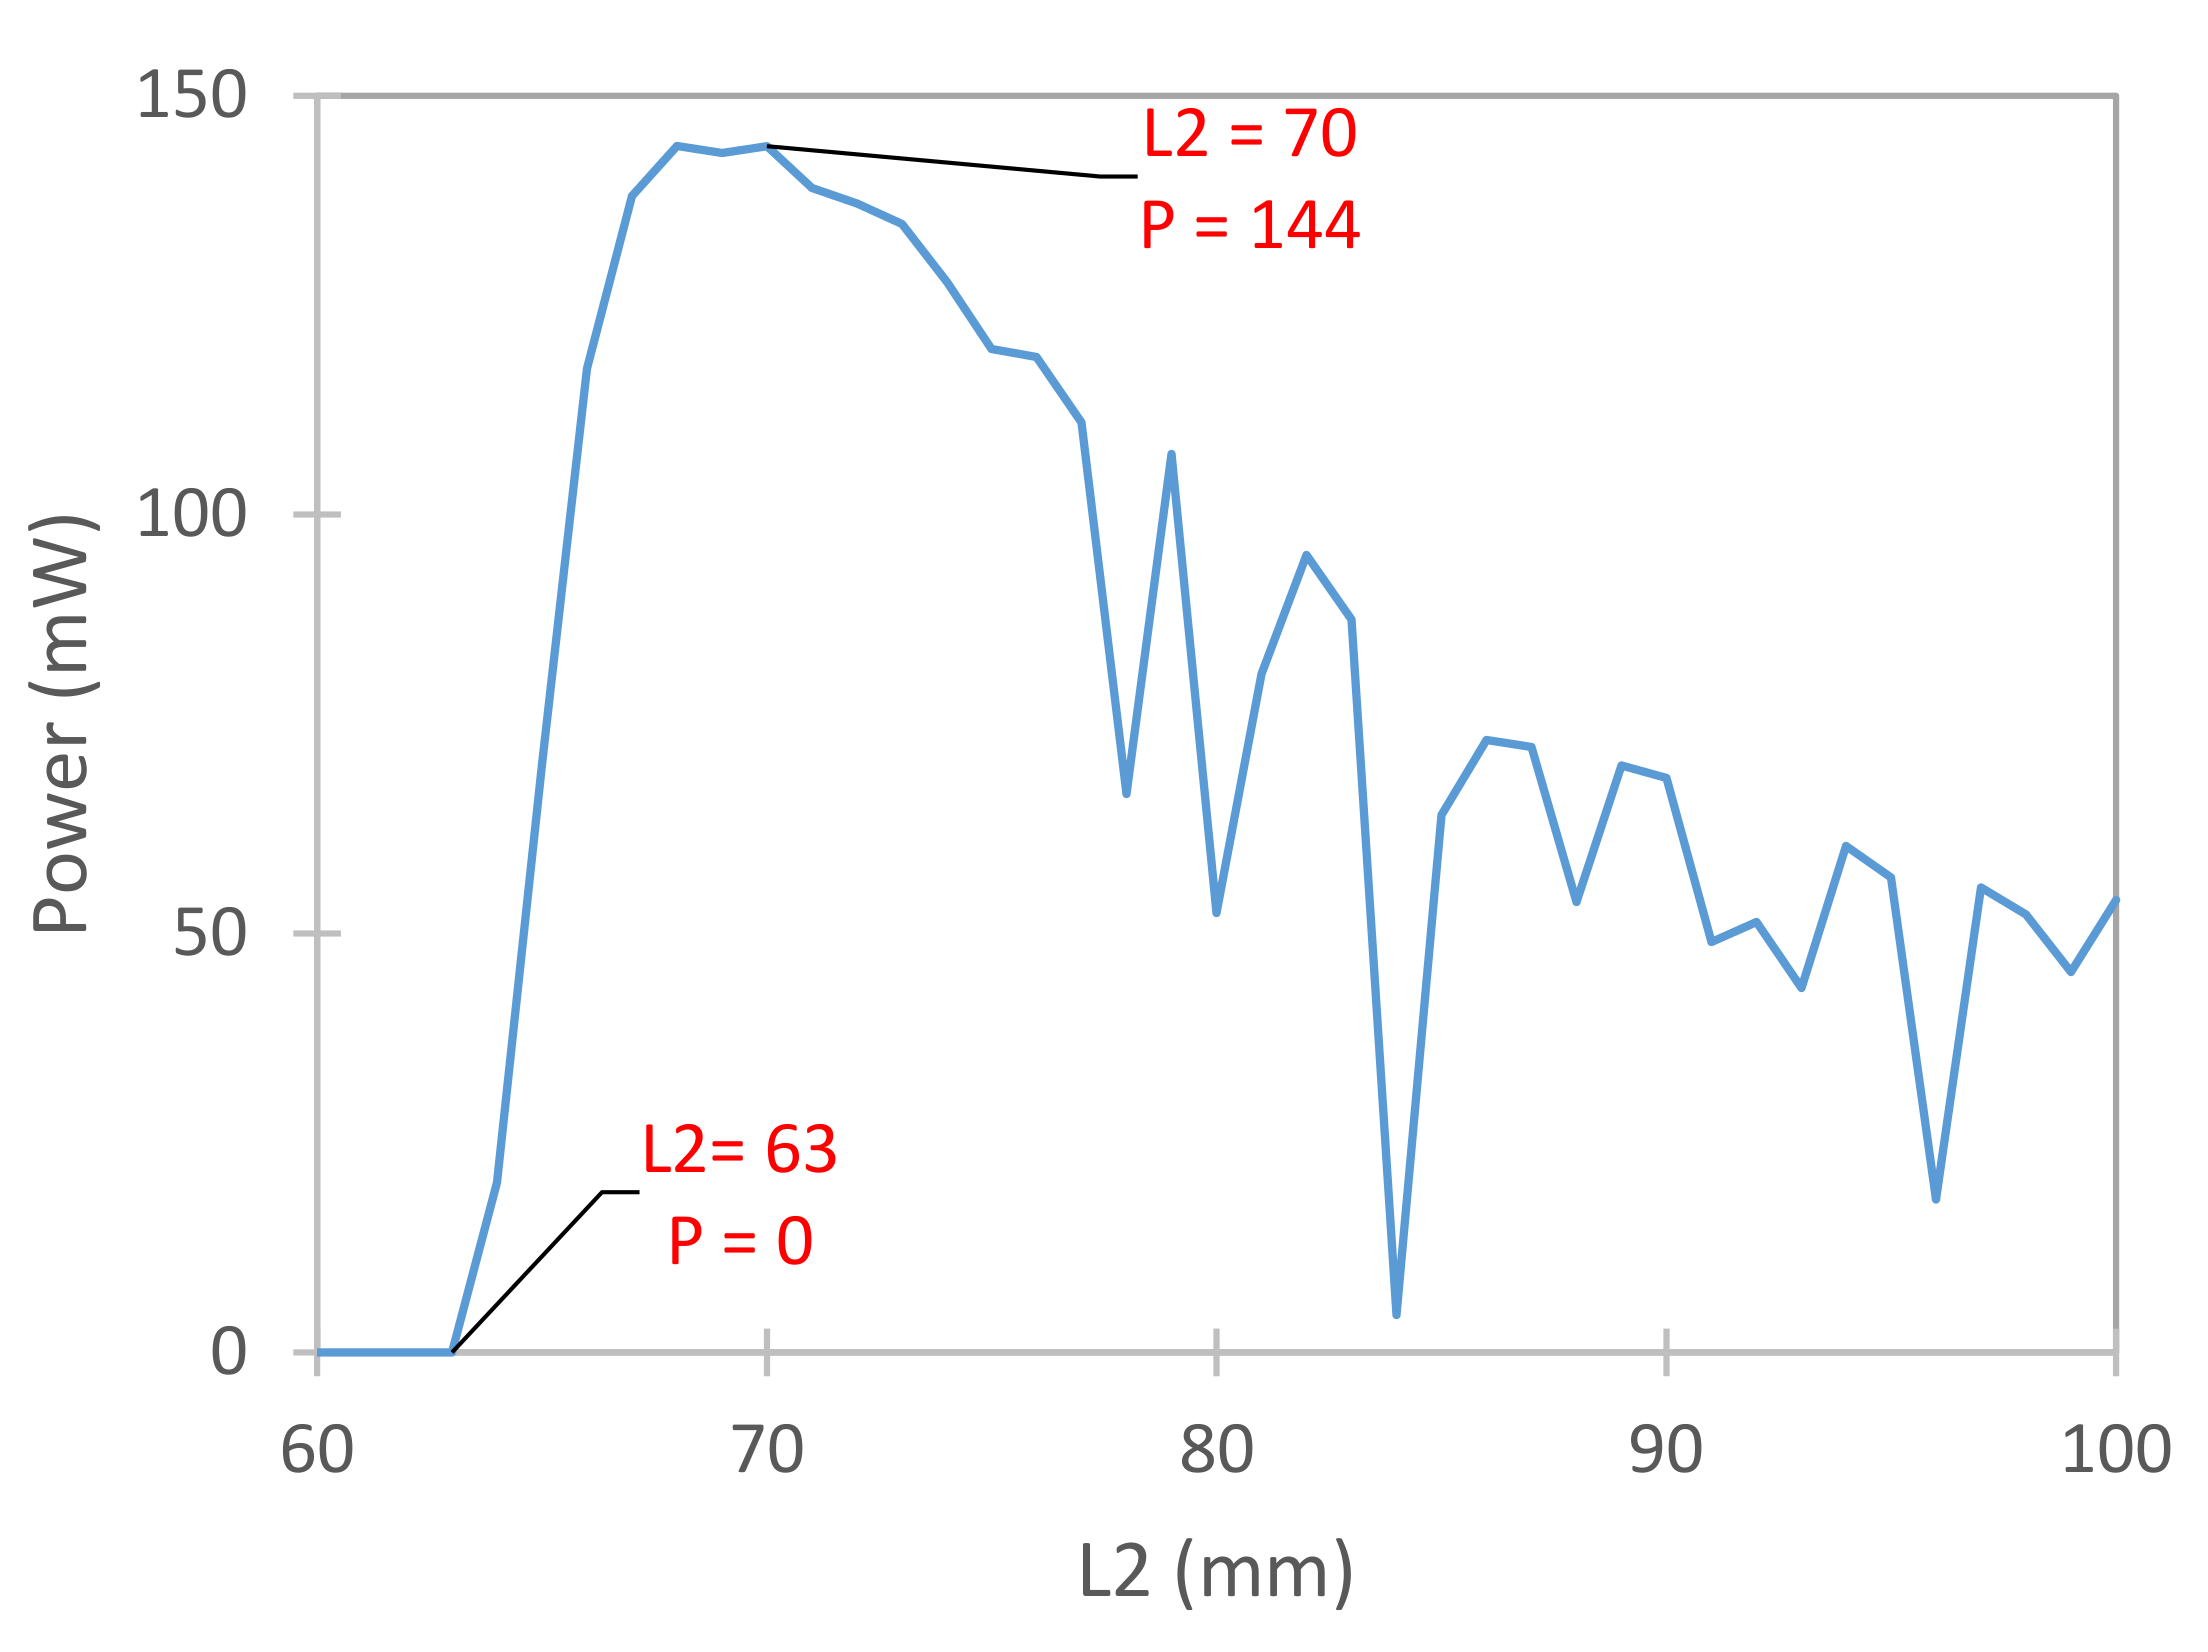
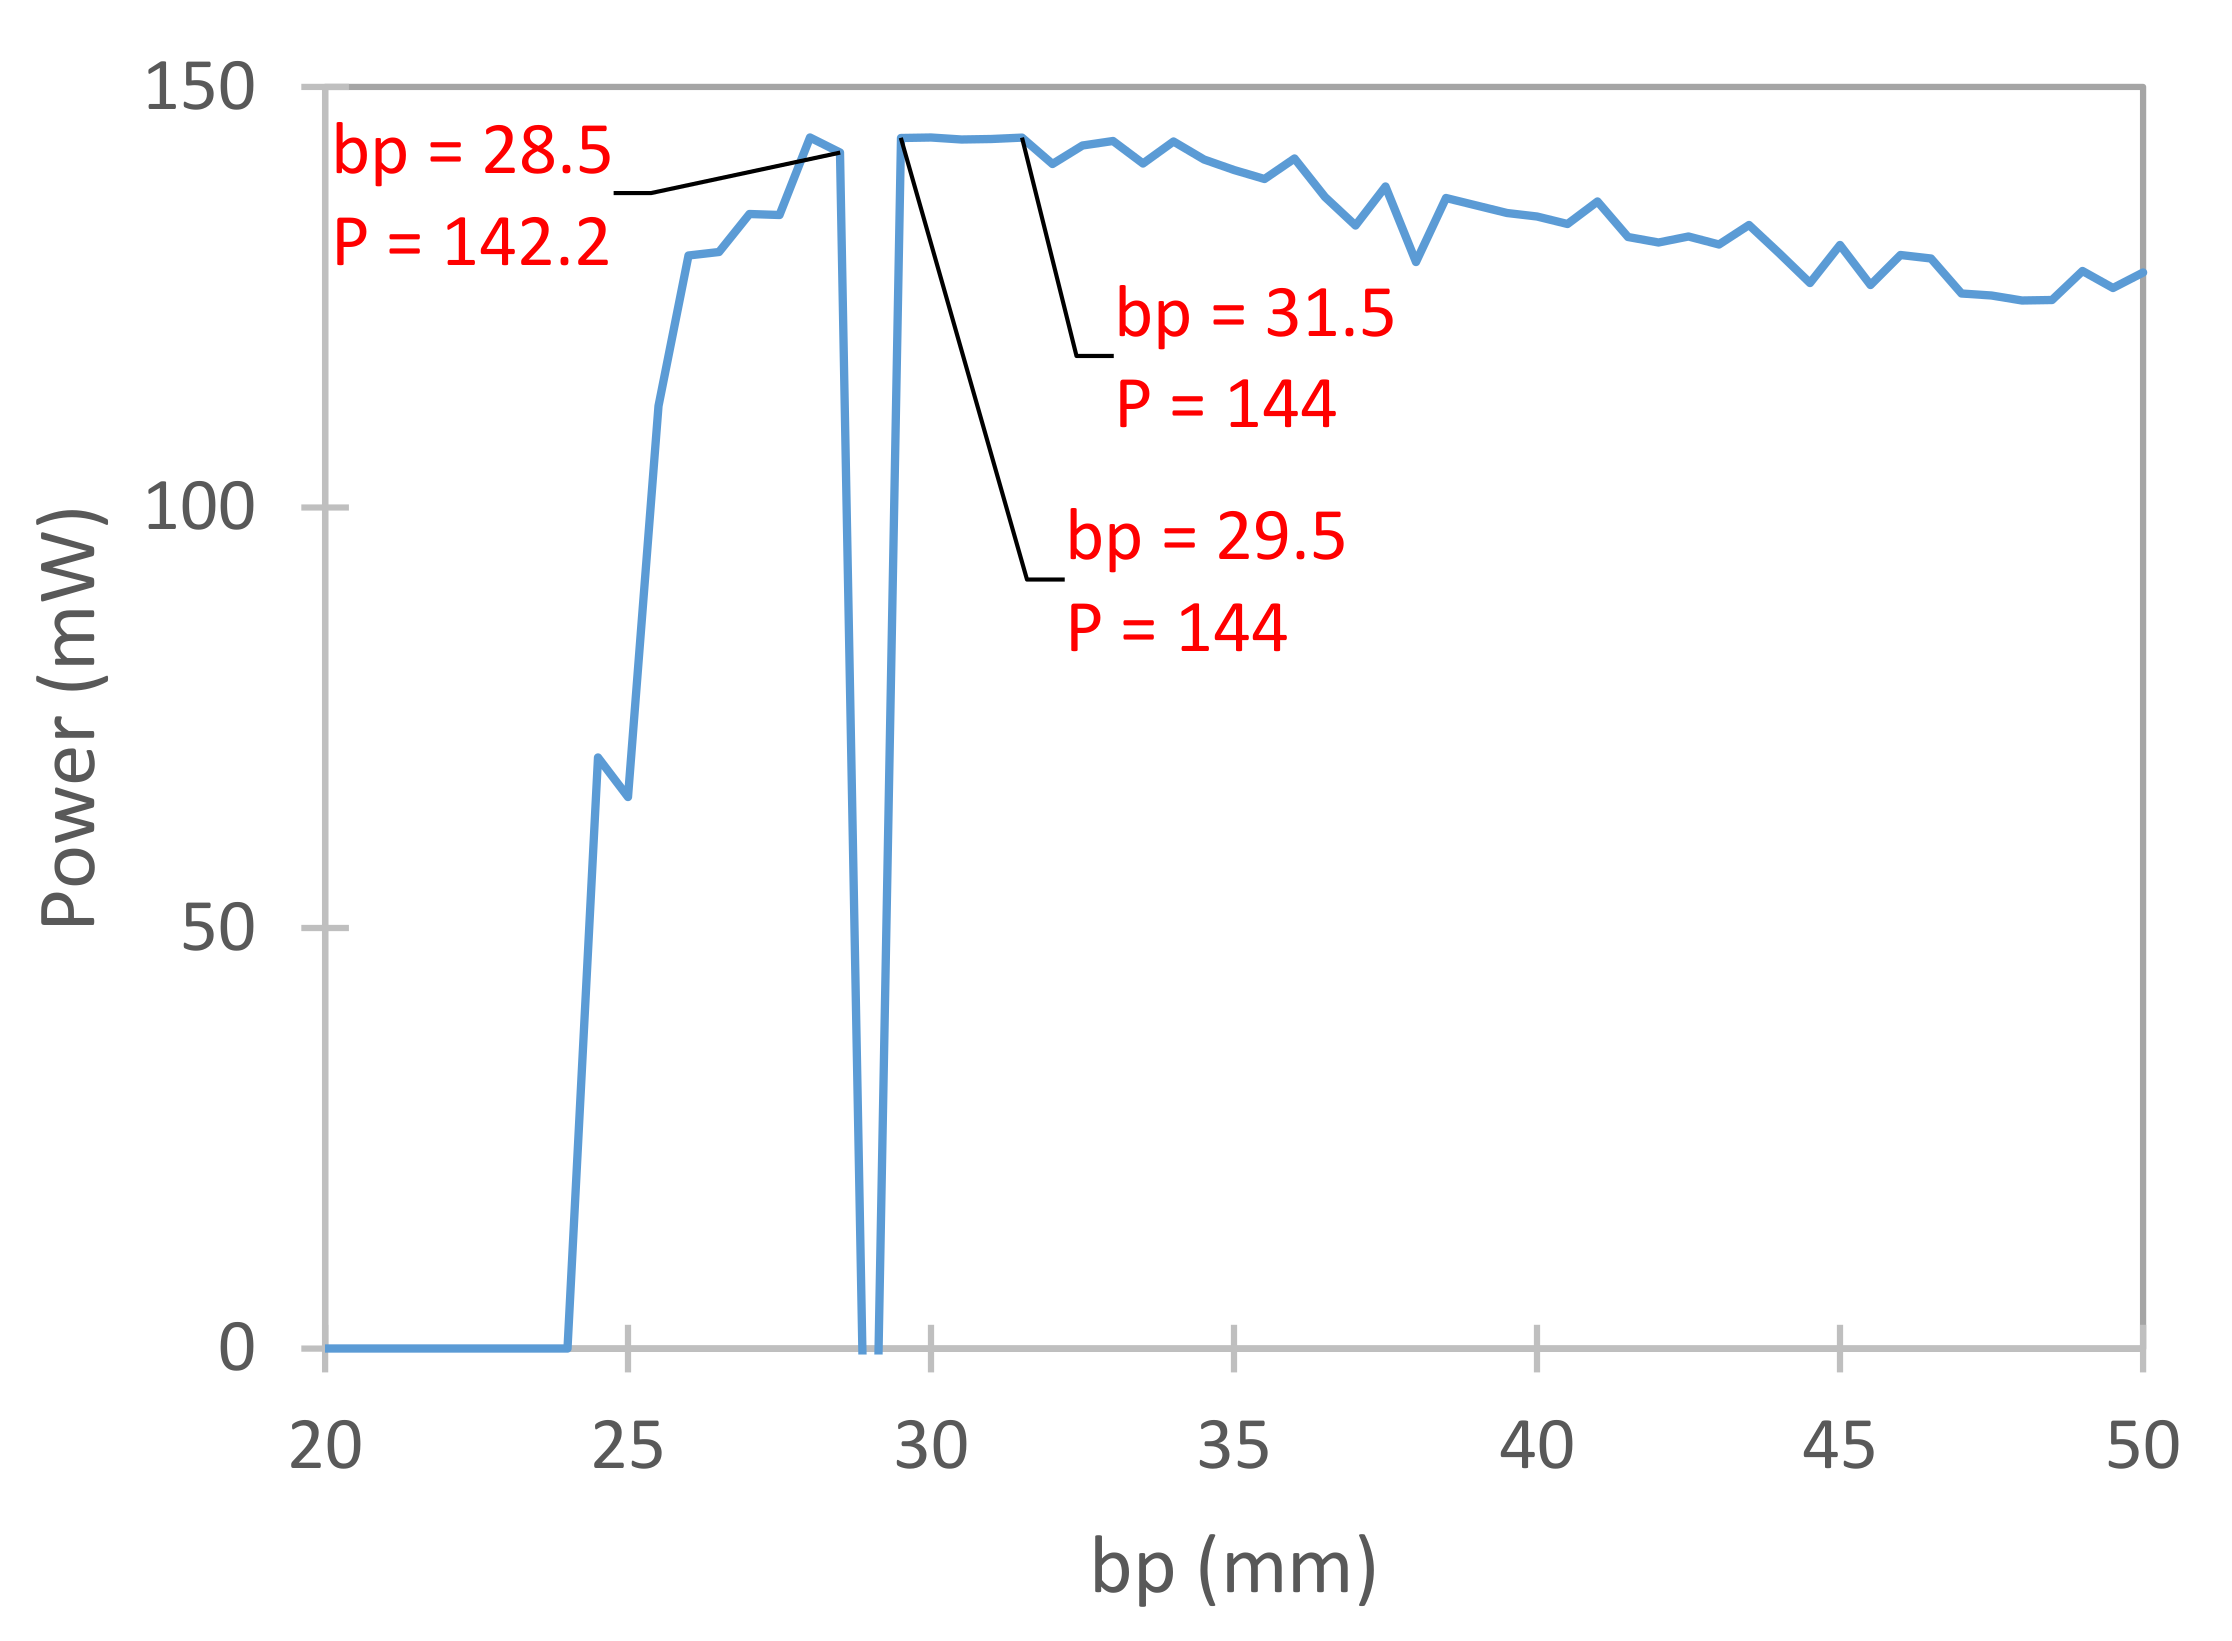
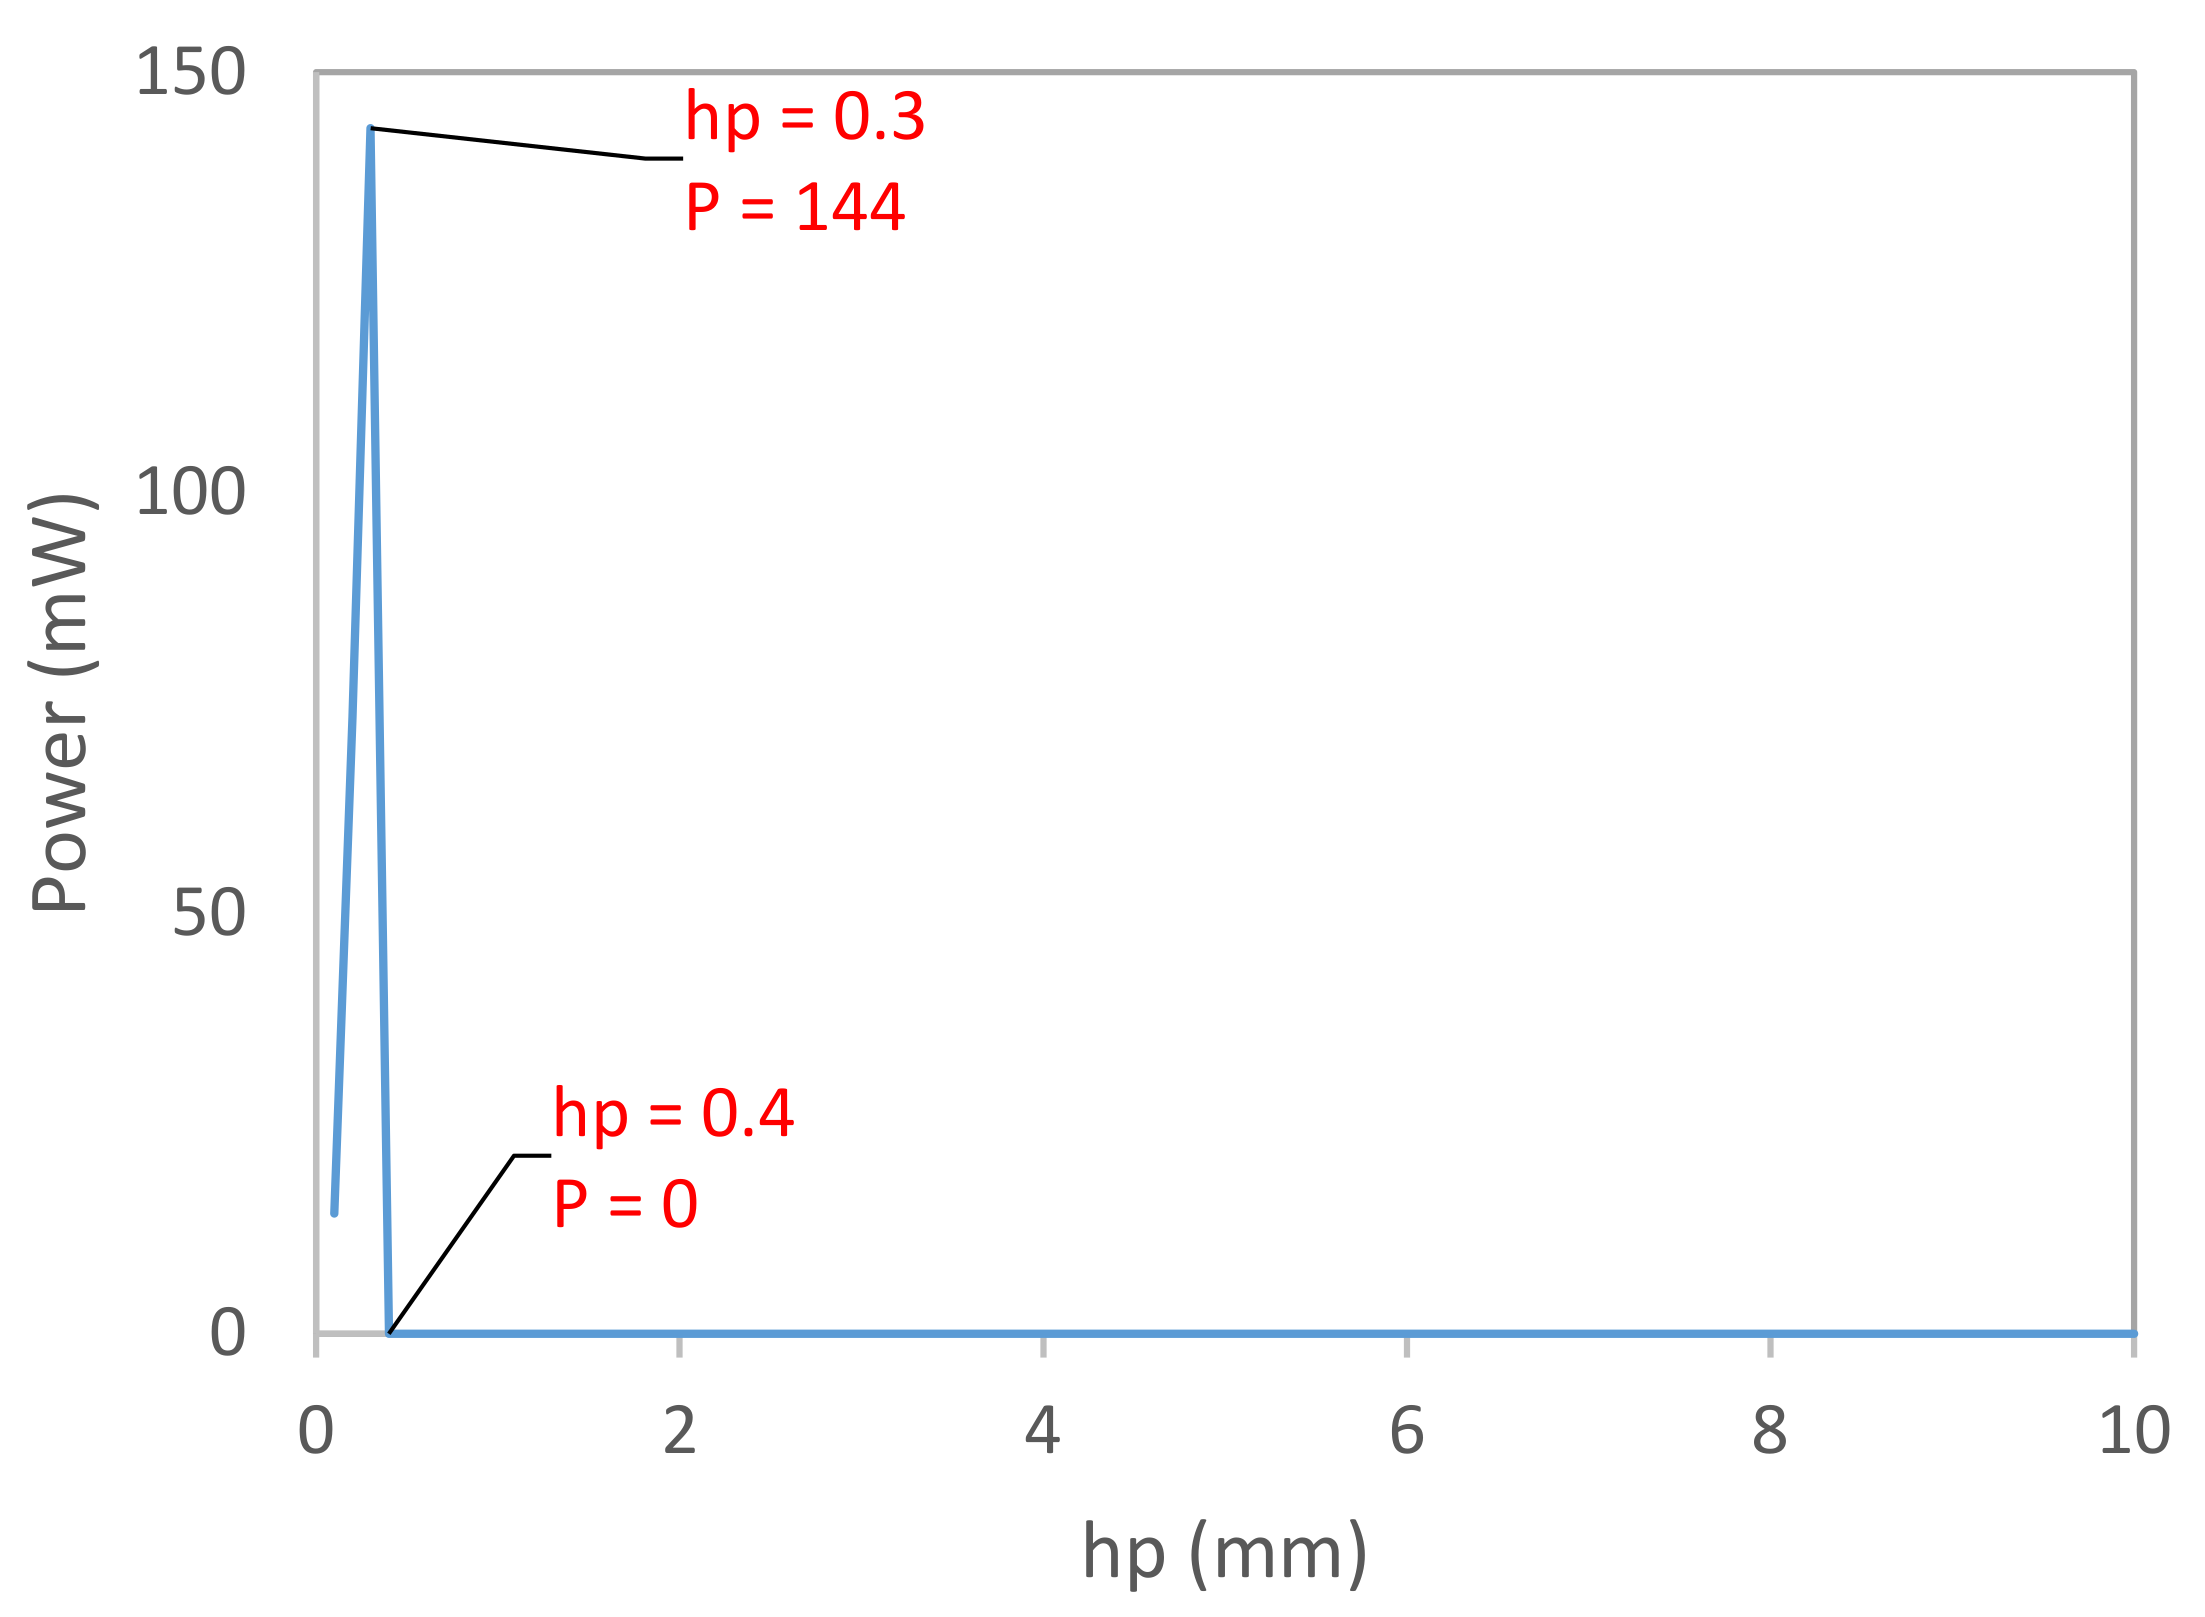
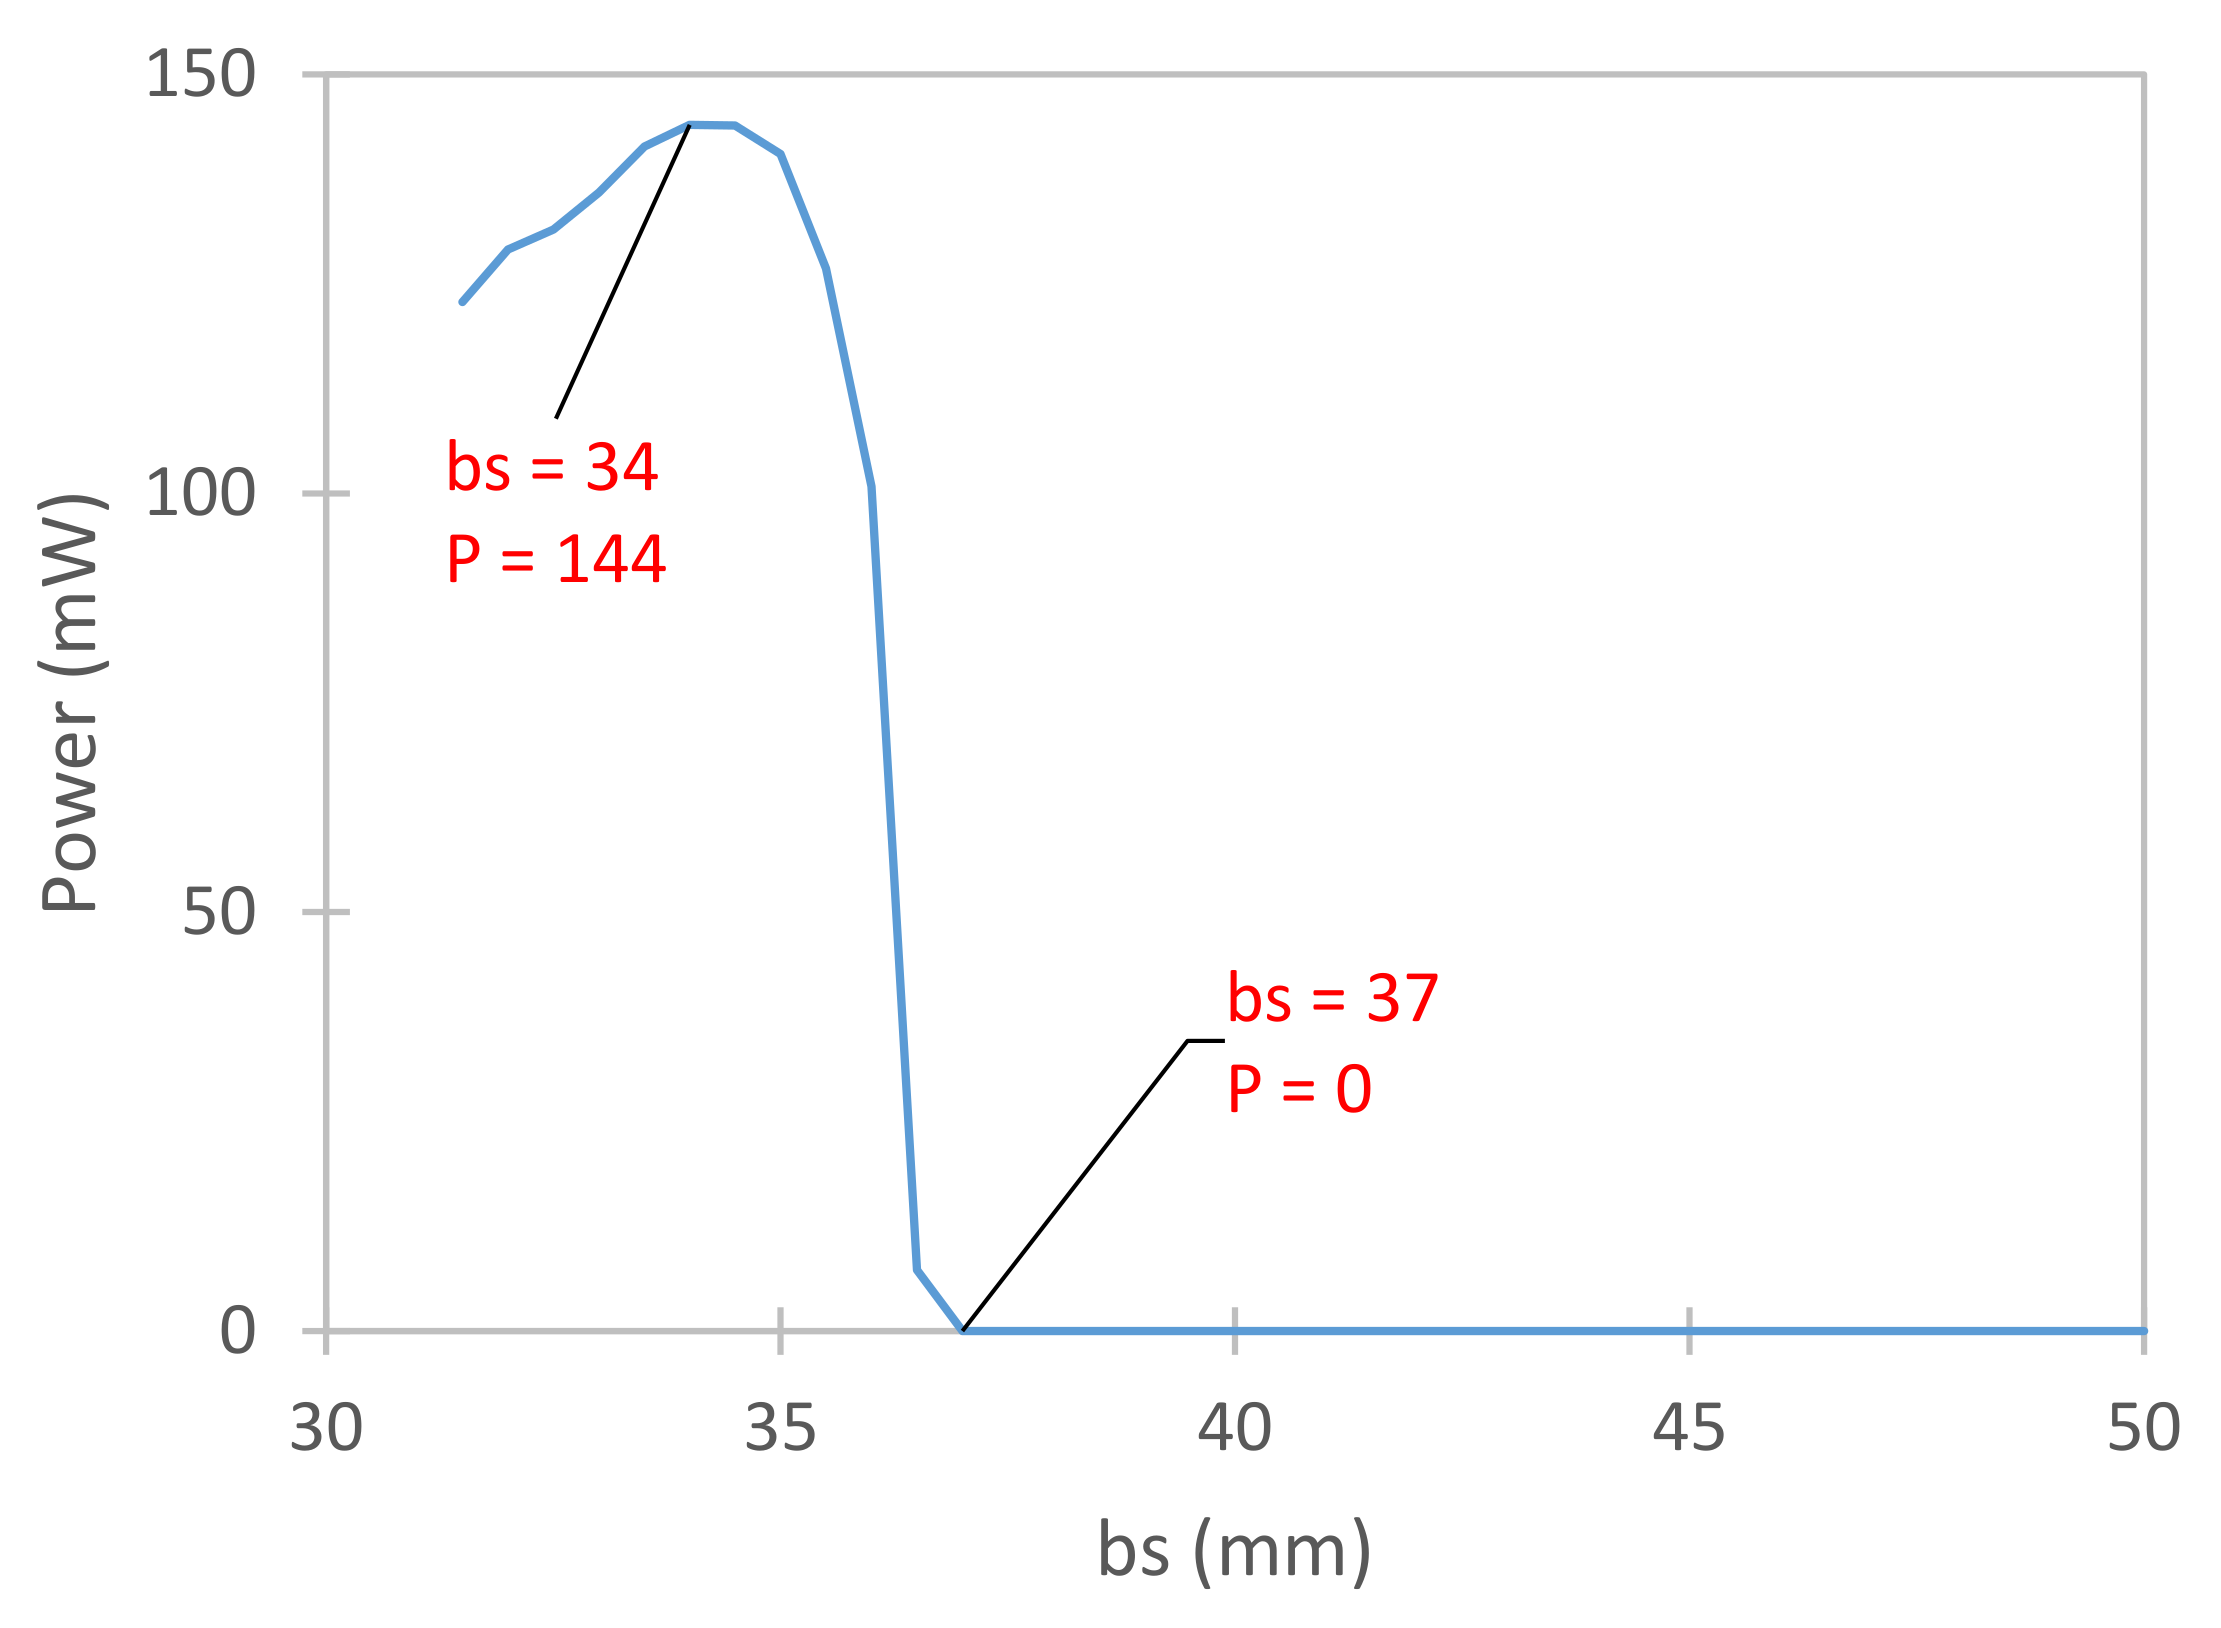
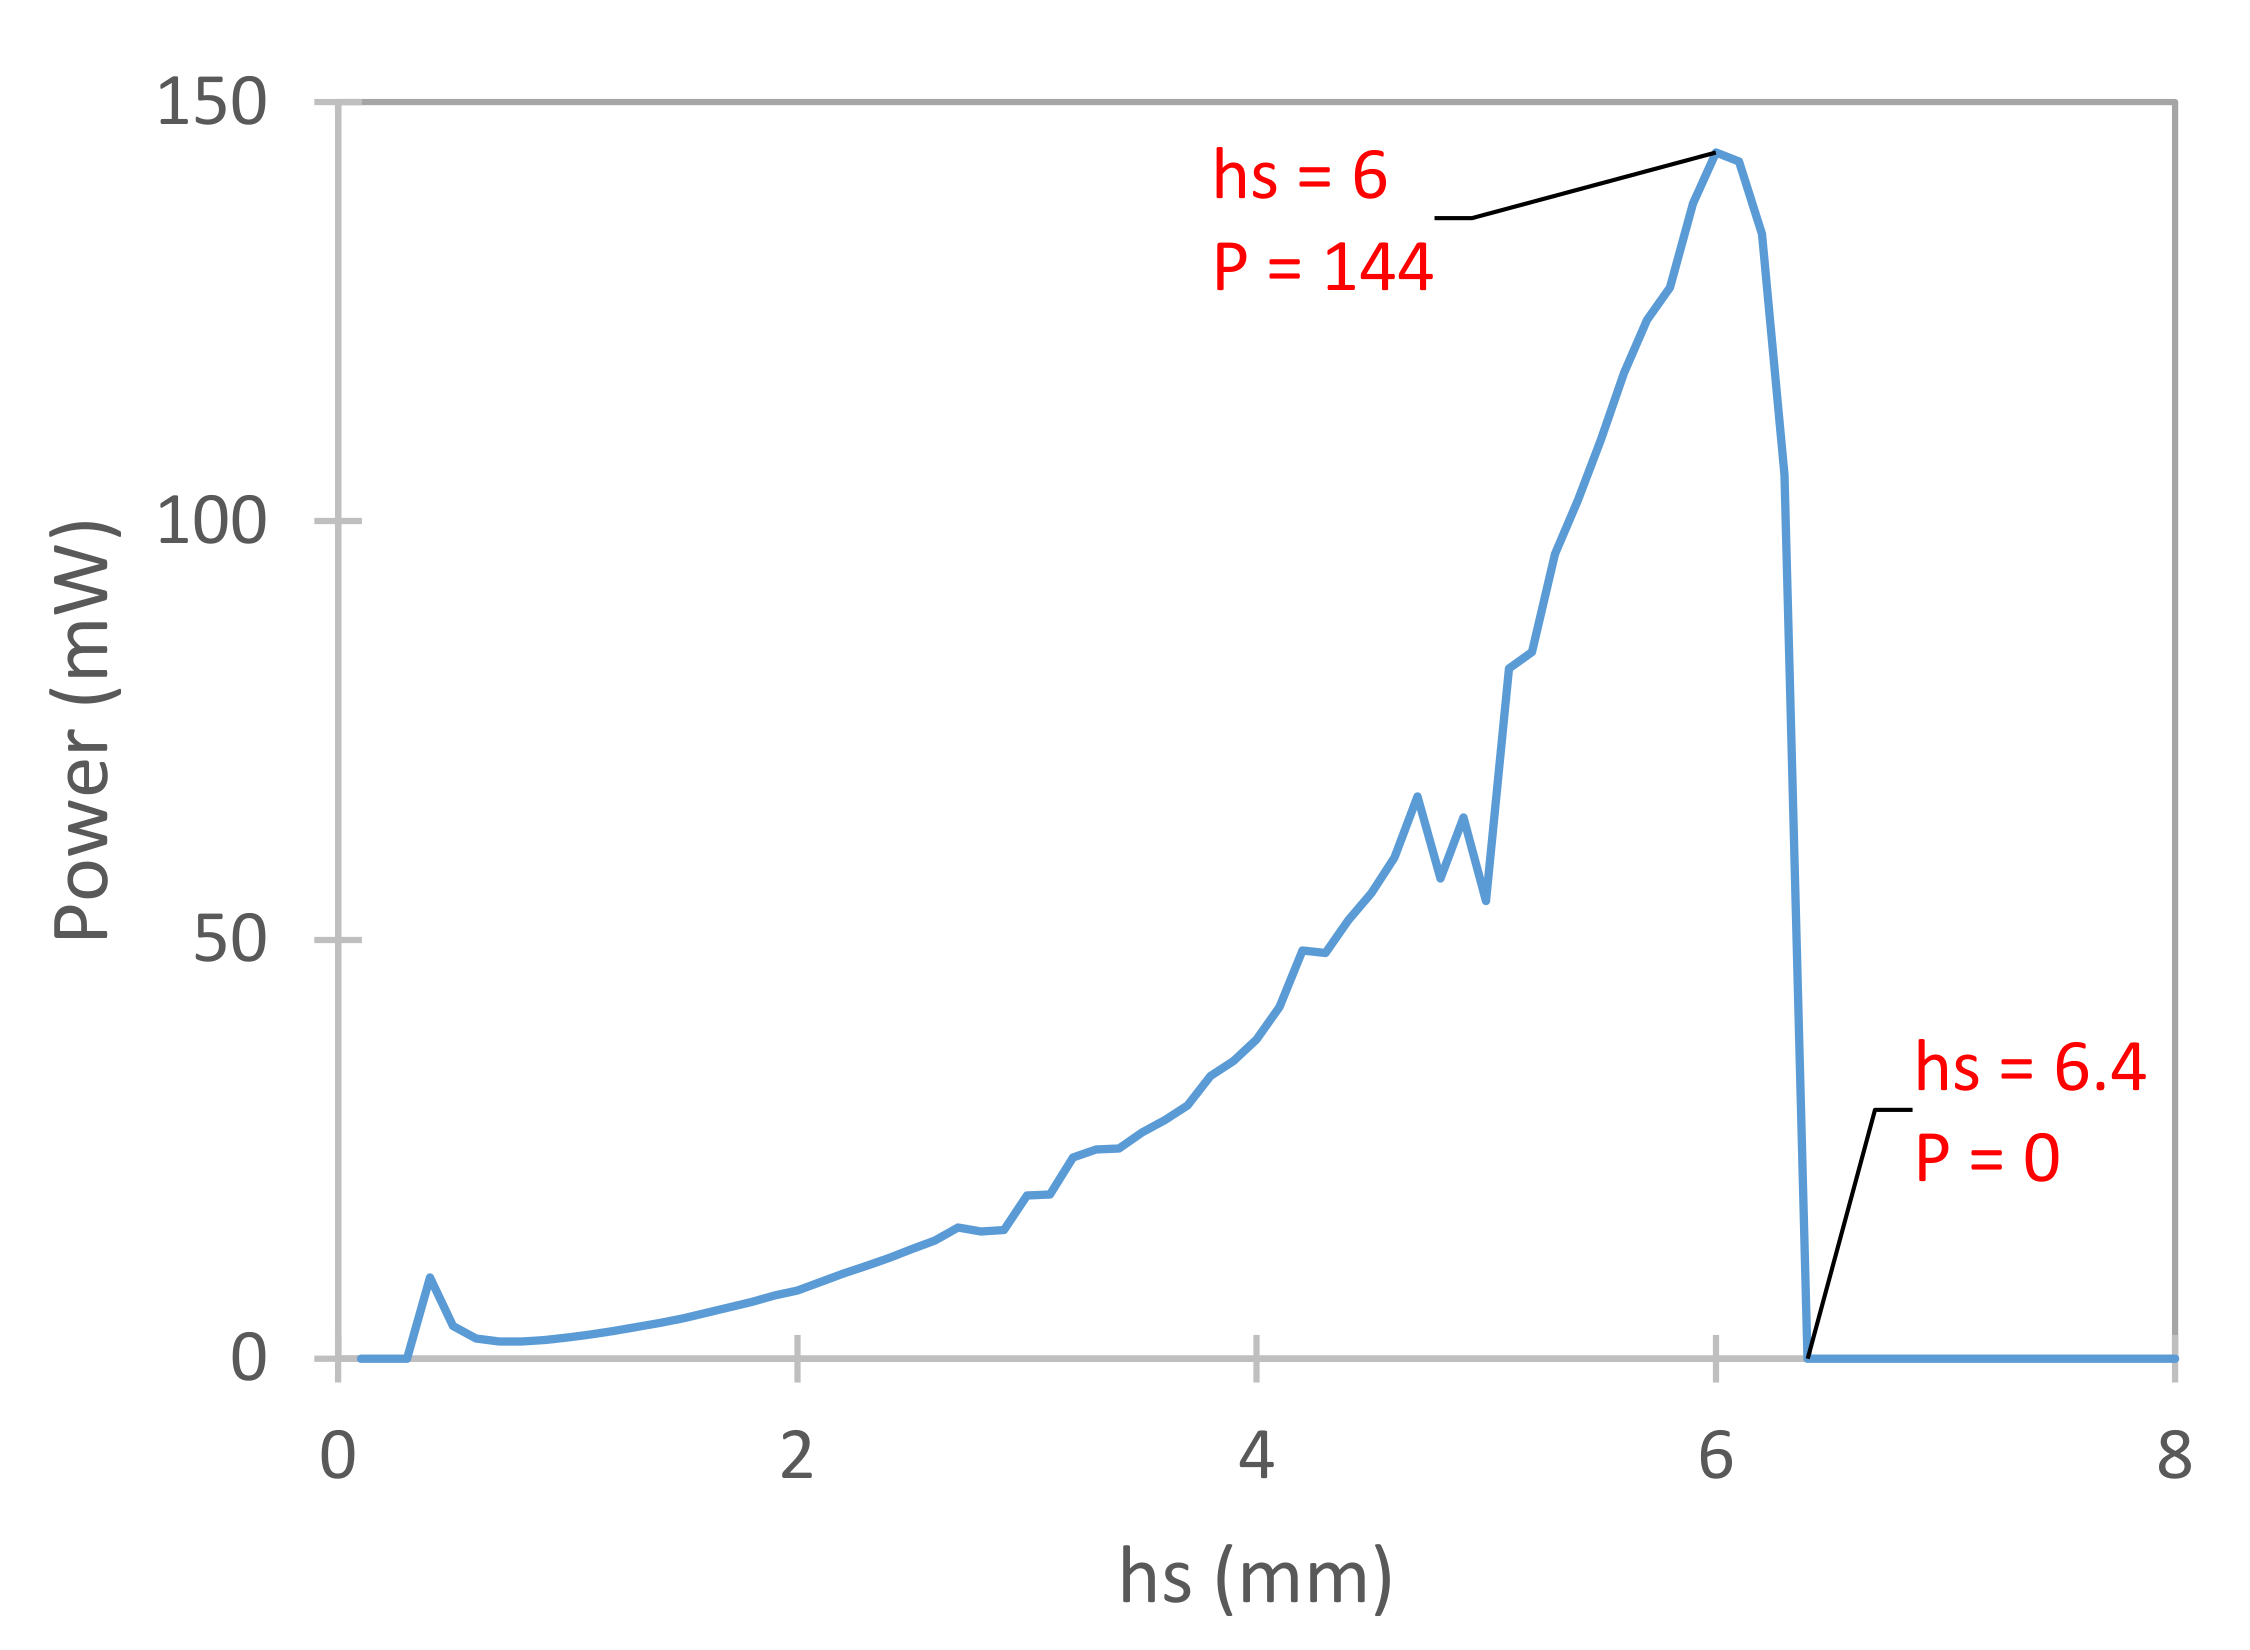
The maximum power harvested is around , with an onset velocity of . The optimal design parameters are shown in Table 2 and Figure 3, Figure 4, Figure 5, Figure 6, Figure 7, Figure 8, Figure 9, Figure 10, Figure 11, Figure 12 and Figure 13 show the change observed in power over a range of each of the design parameters. The range of each design parameter over which this study is conducted are mentioned later in this section. Some of the graphs are zoomed-in for better plot-readability.

Table 2.
Optimal Design Parameters.
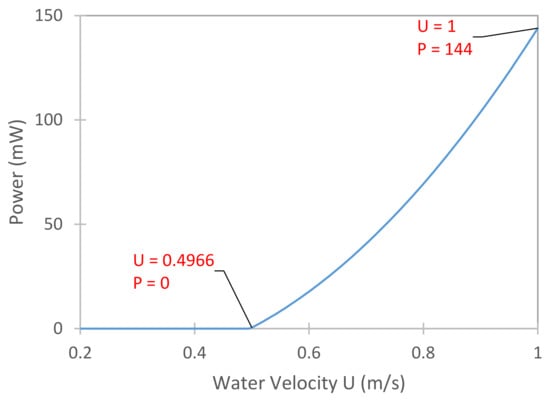
Figure 3.
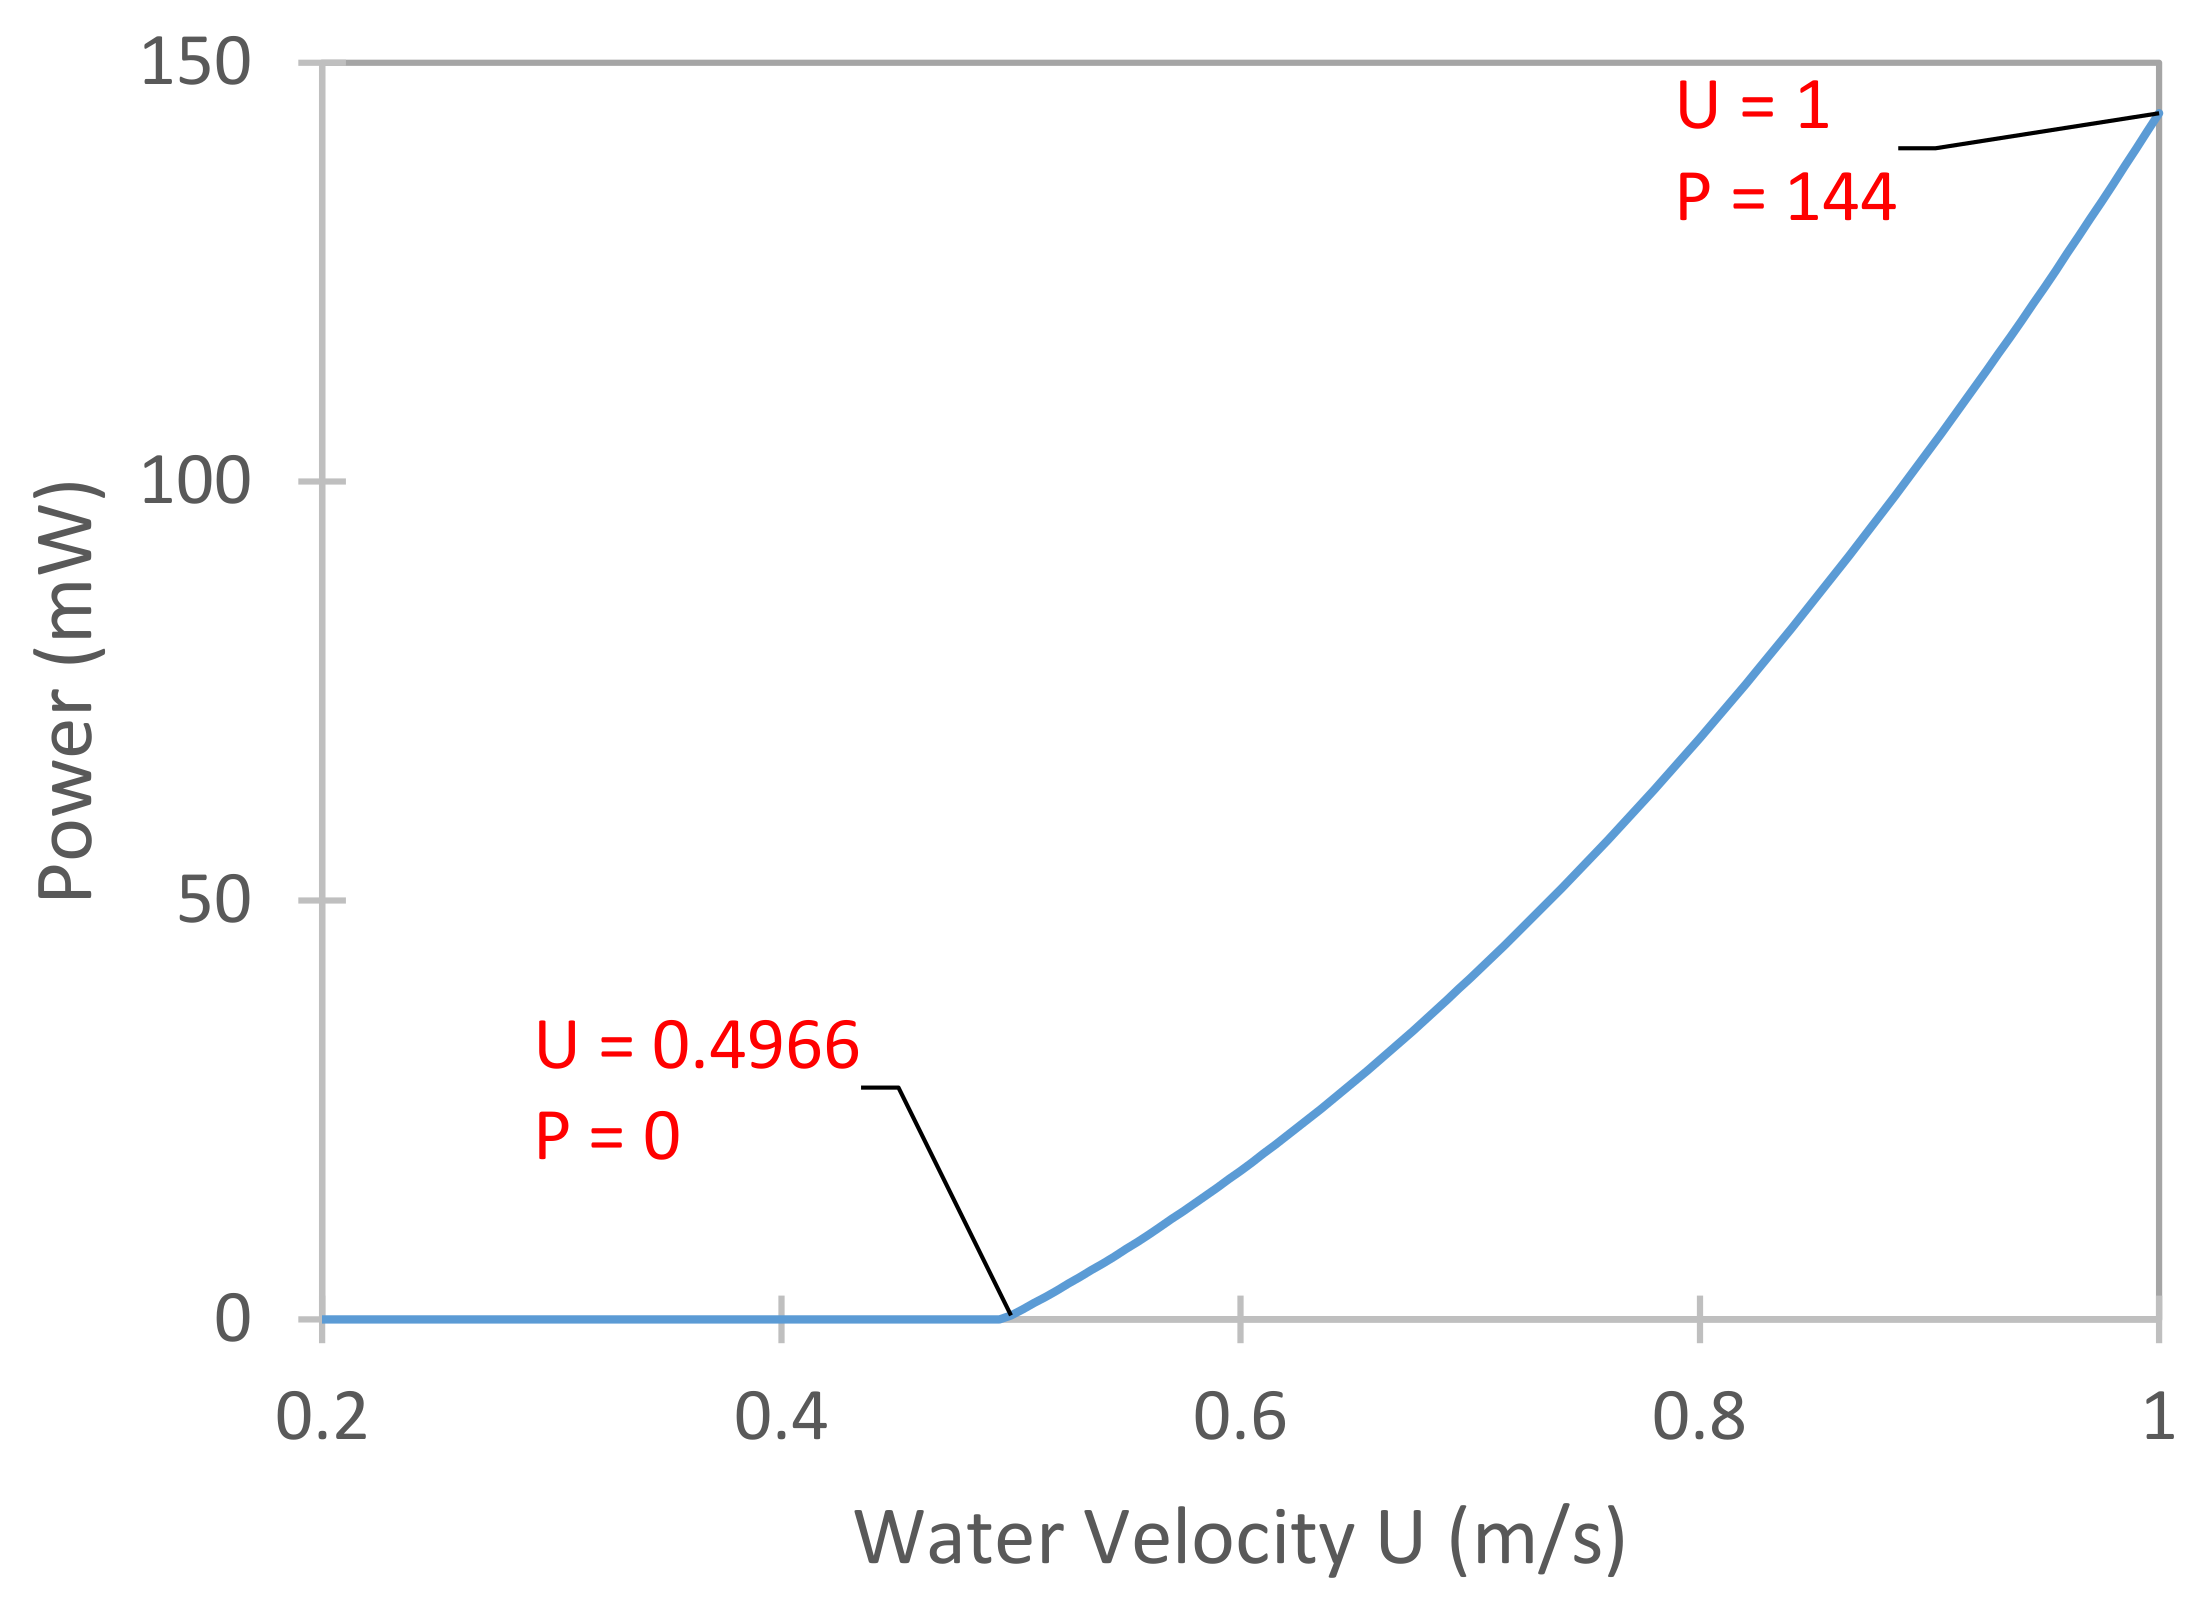
Graph Showing Variation of Power Output with Flow Velocity .
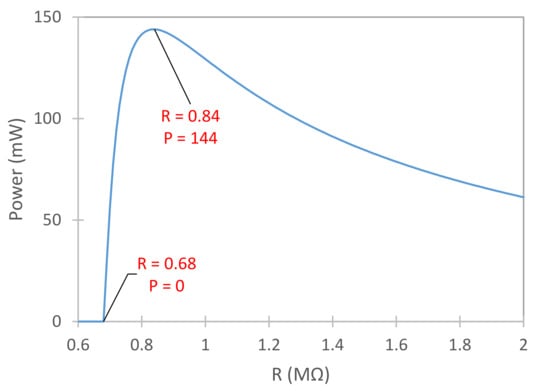
Figure 4.
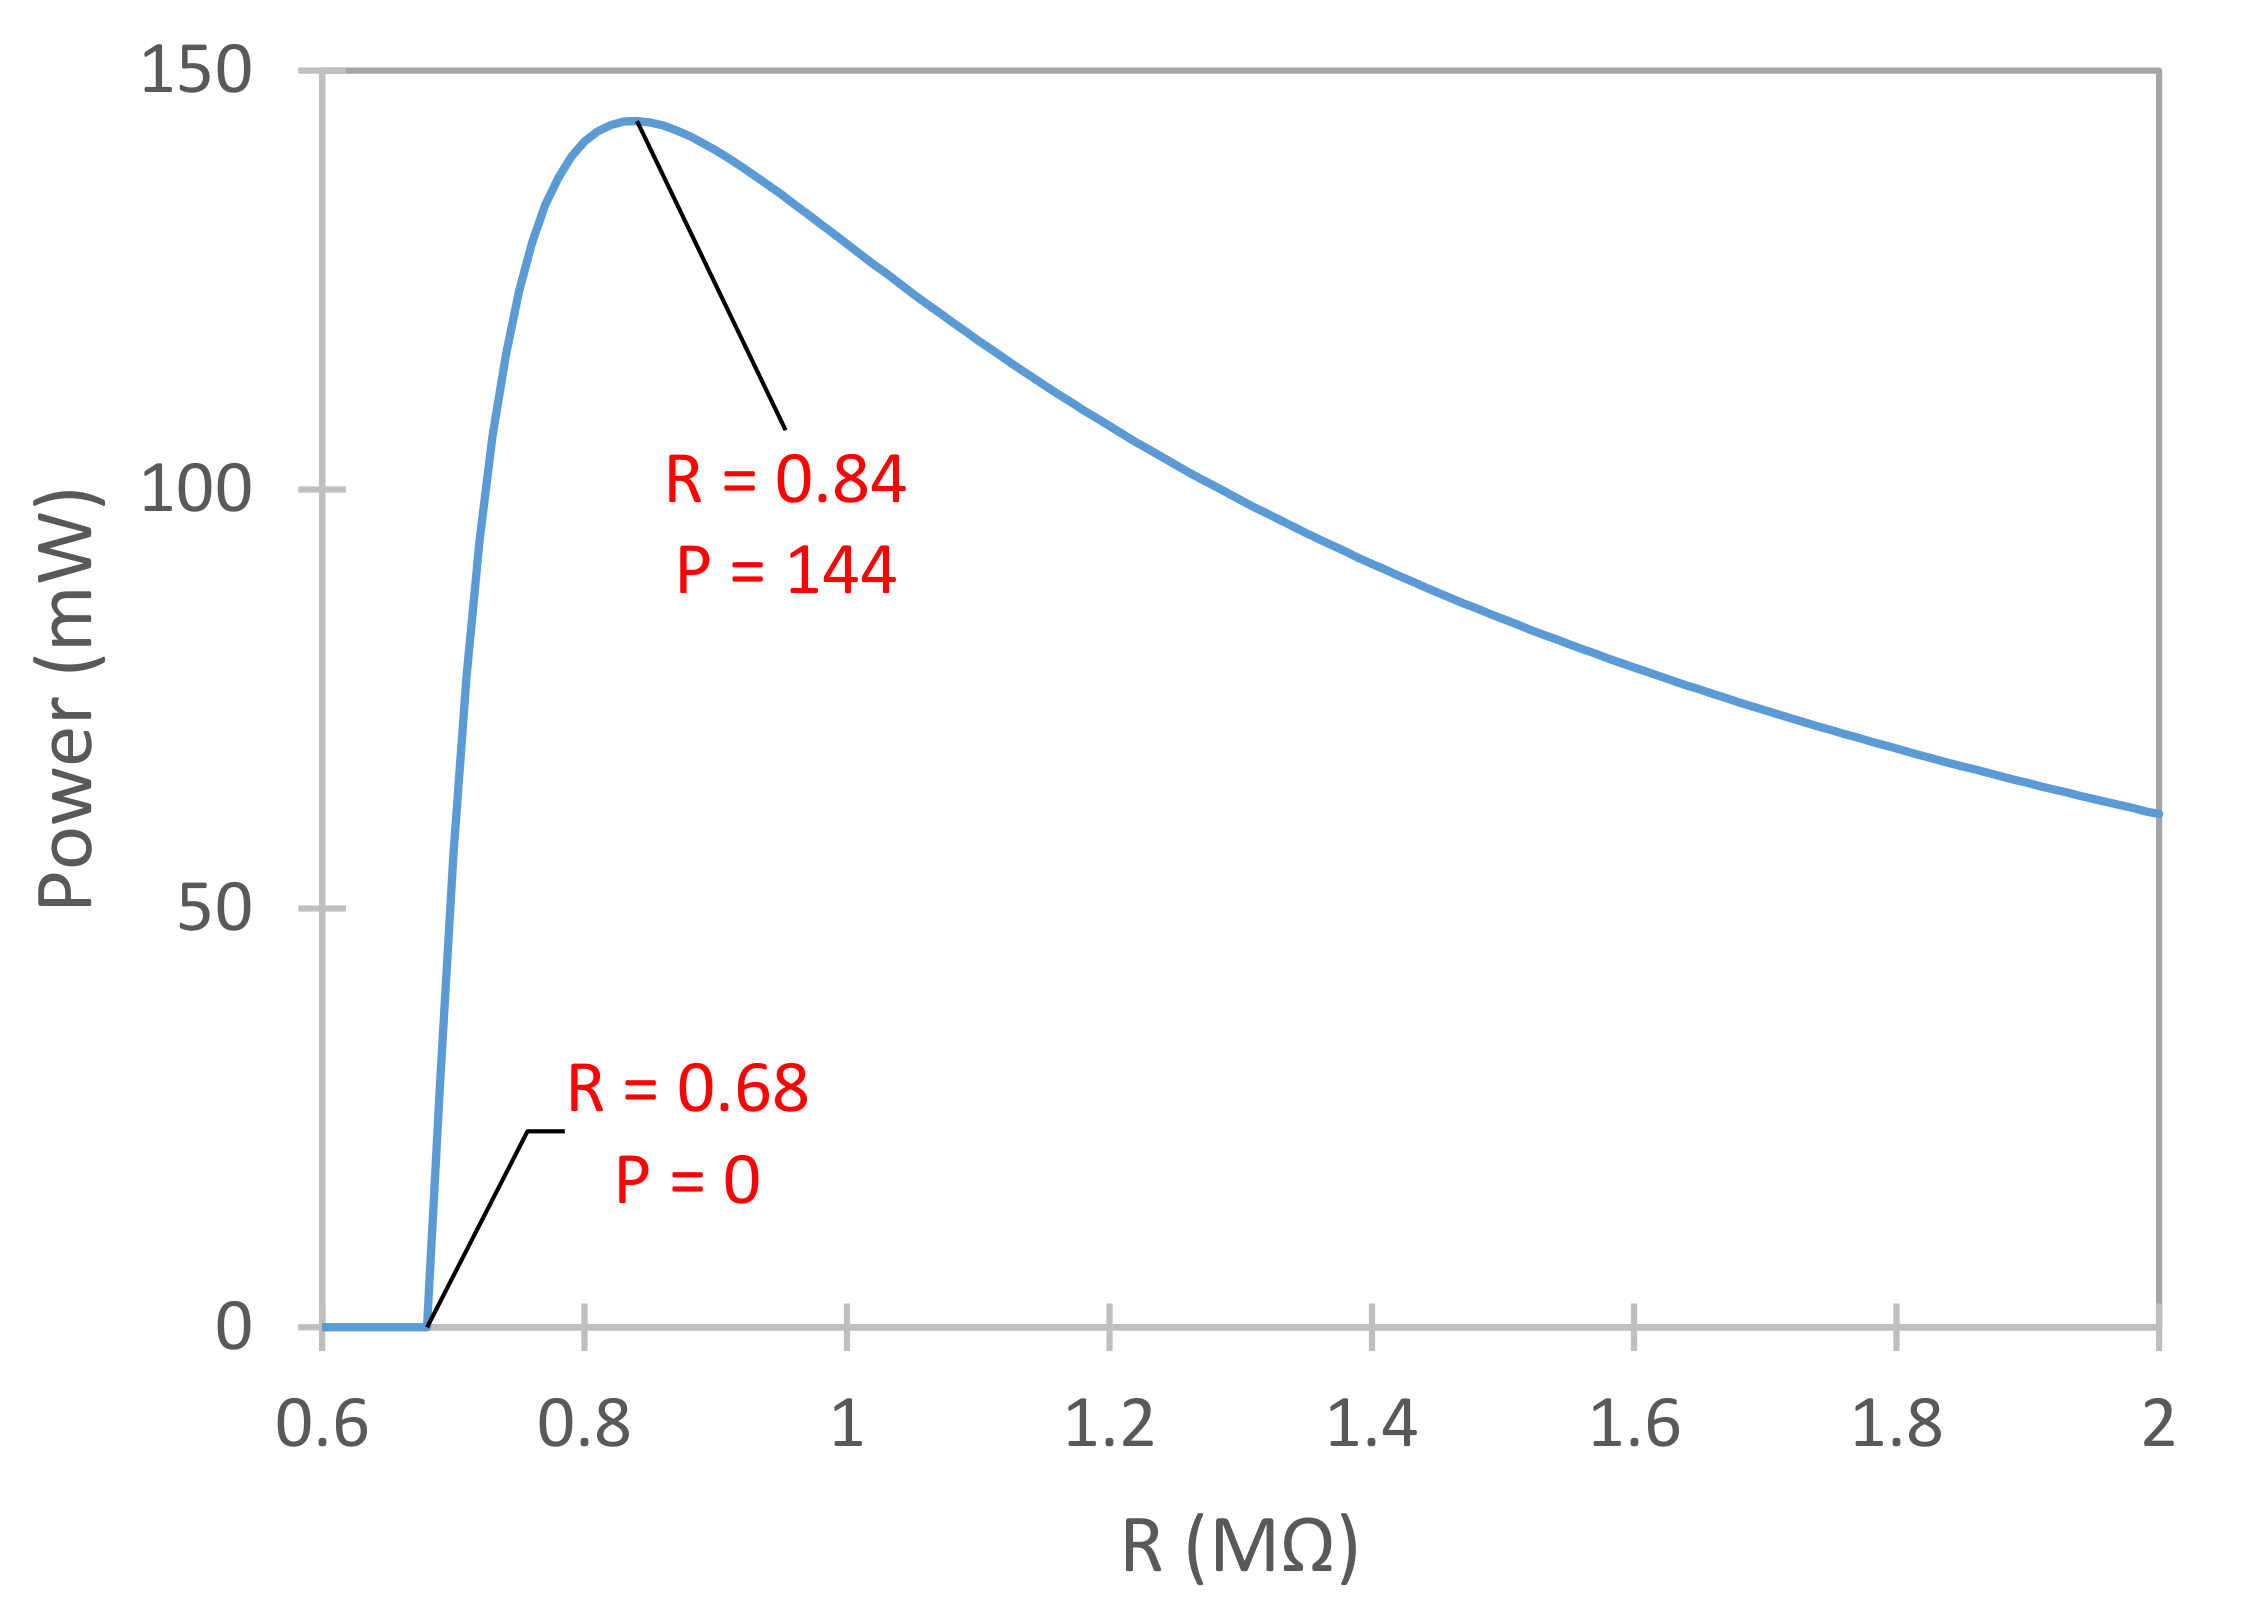
Graph Showing Variation of Power Output with Resistance .
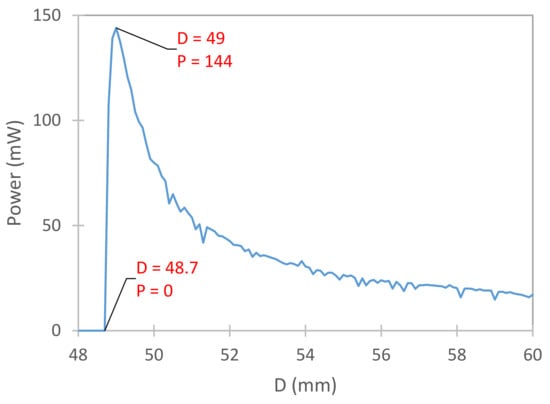
Figure 5.
Graph Showing Variation of Power Output with Bluff Body Diameter .
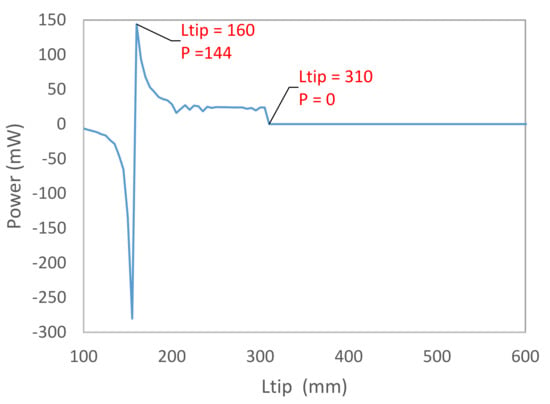
Figure 6.
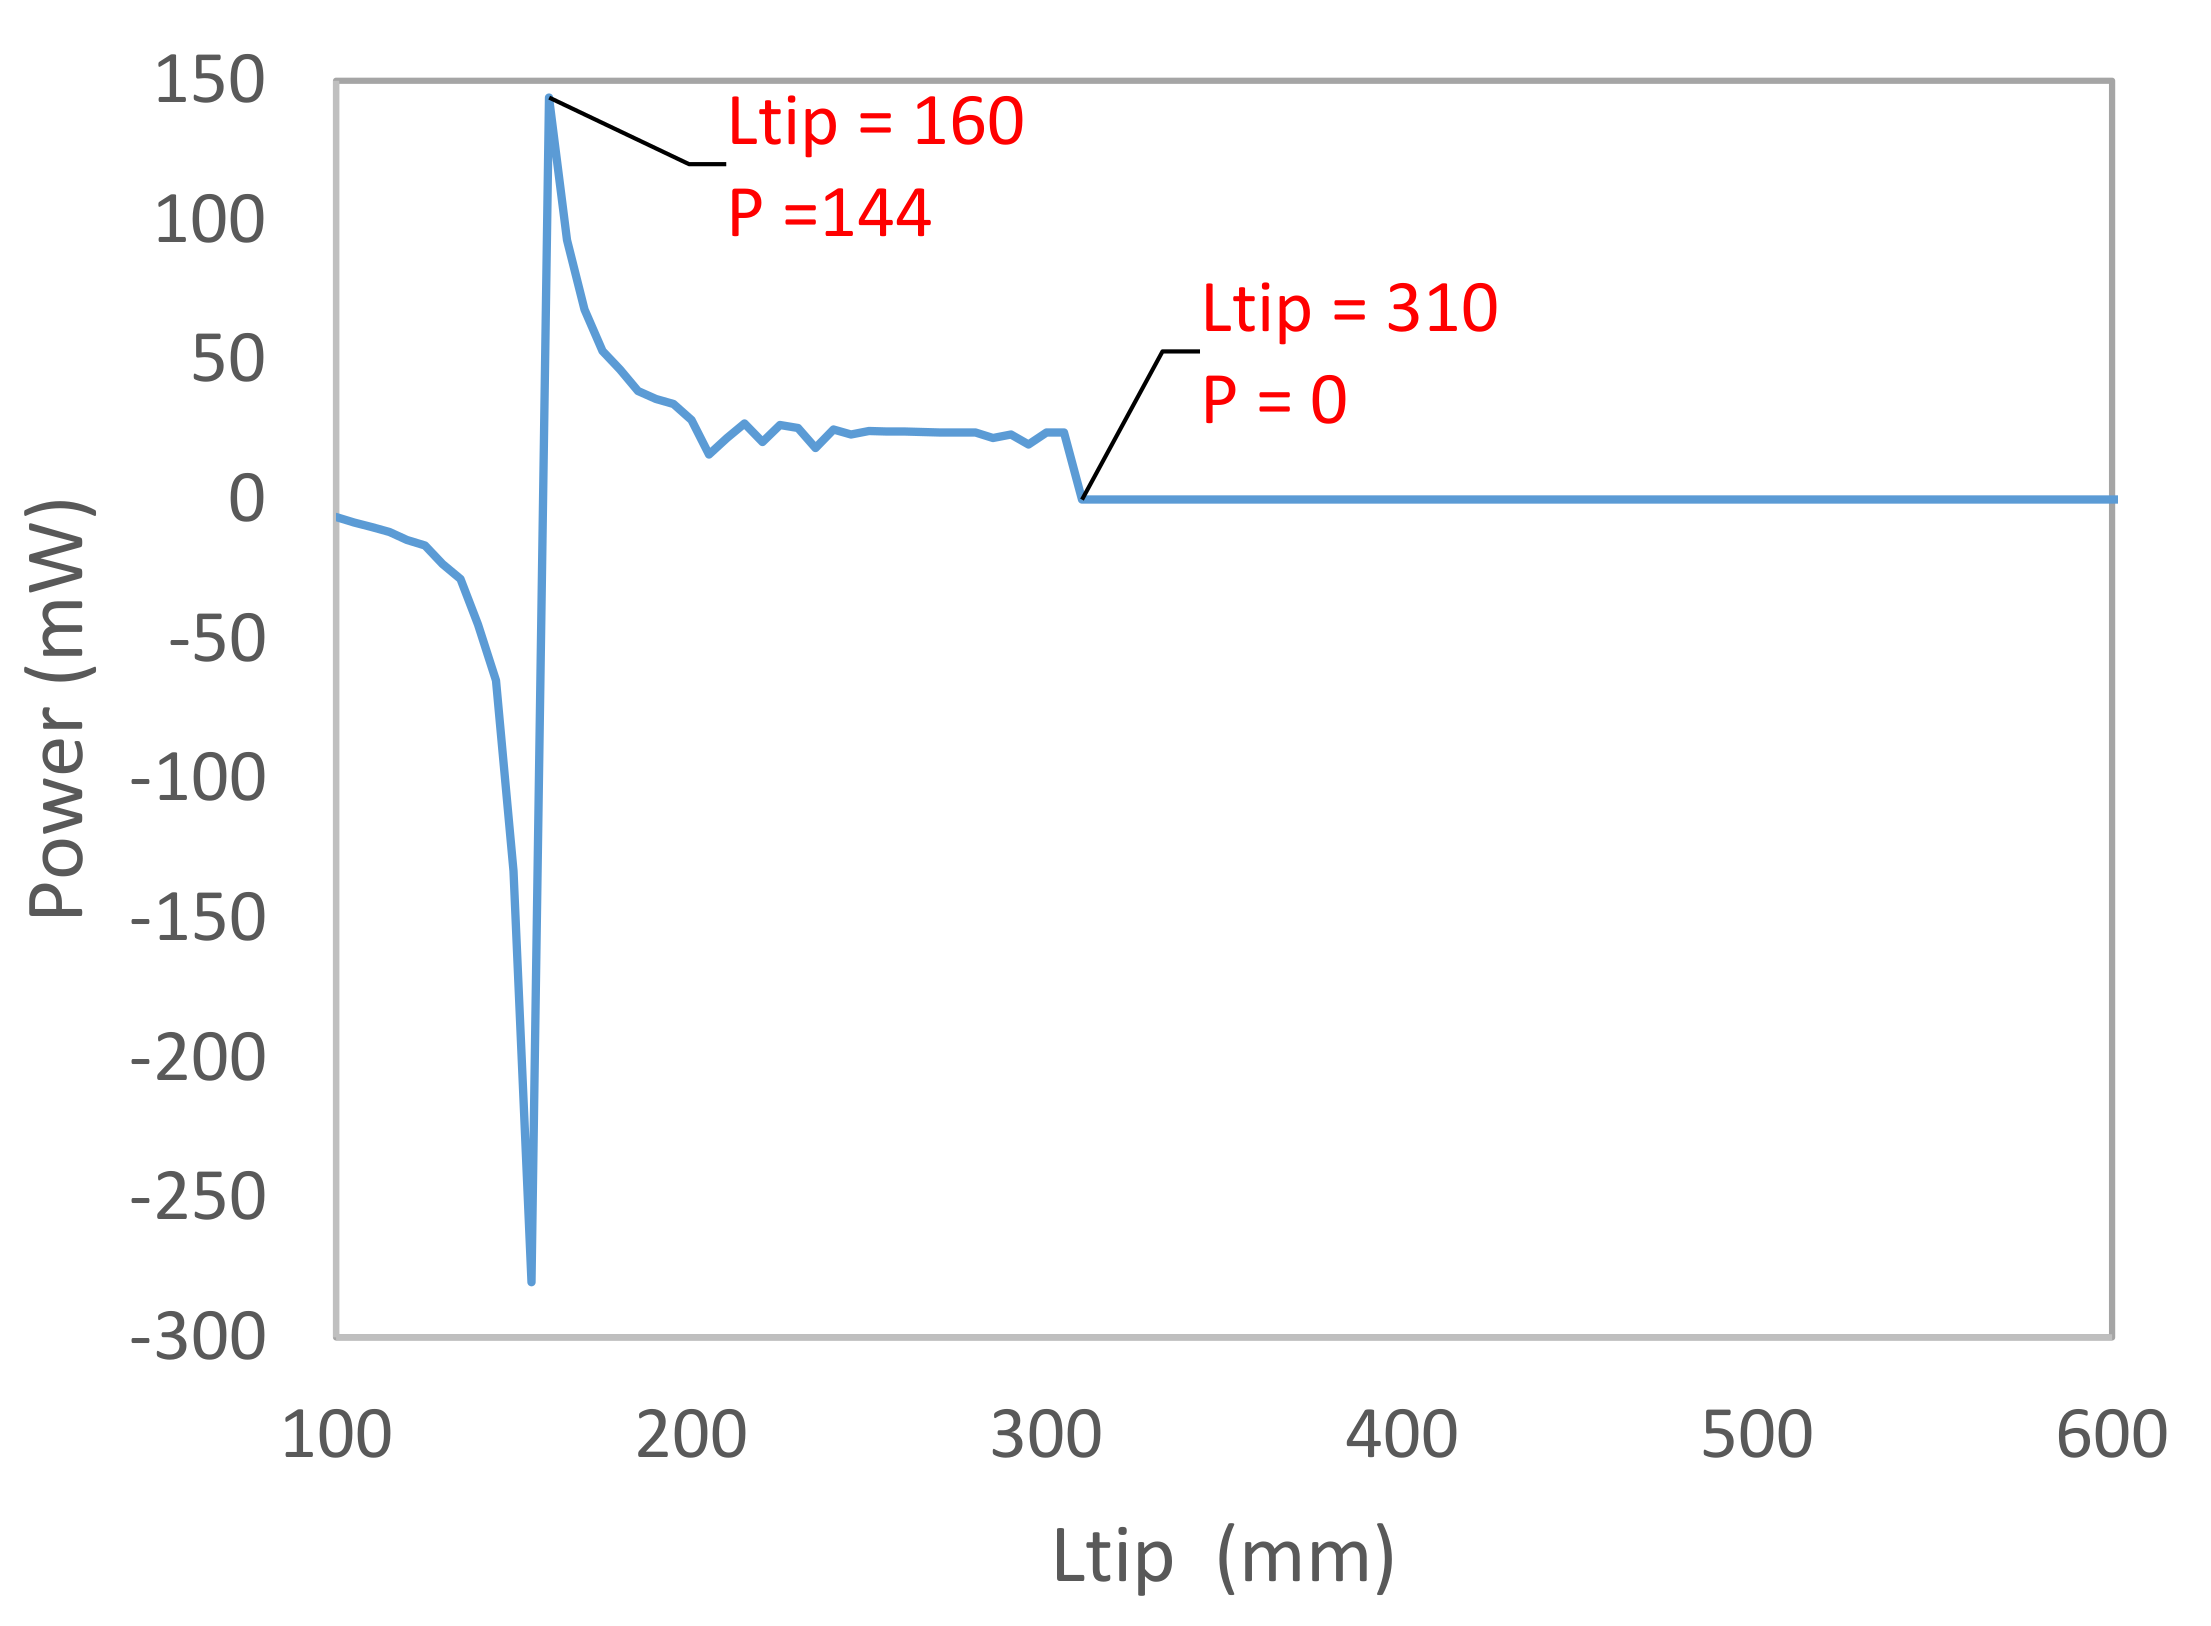
Graph Showing Variation of Power Output with Bluff Body Length .
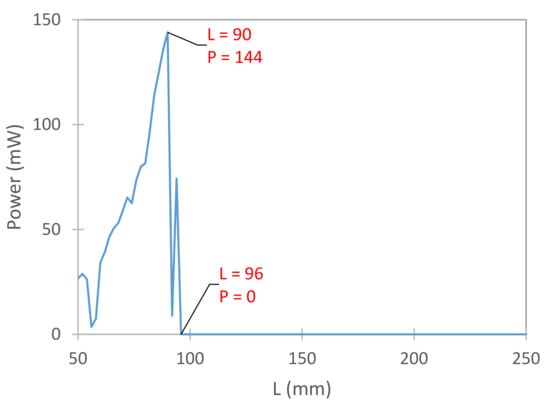
Figure 7.
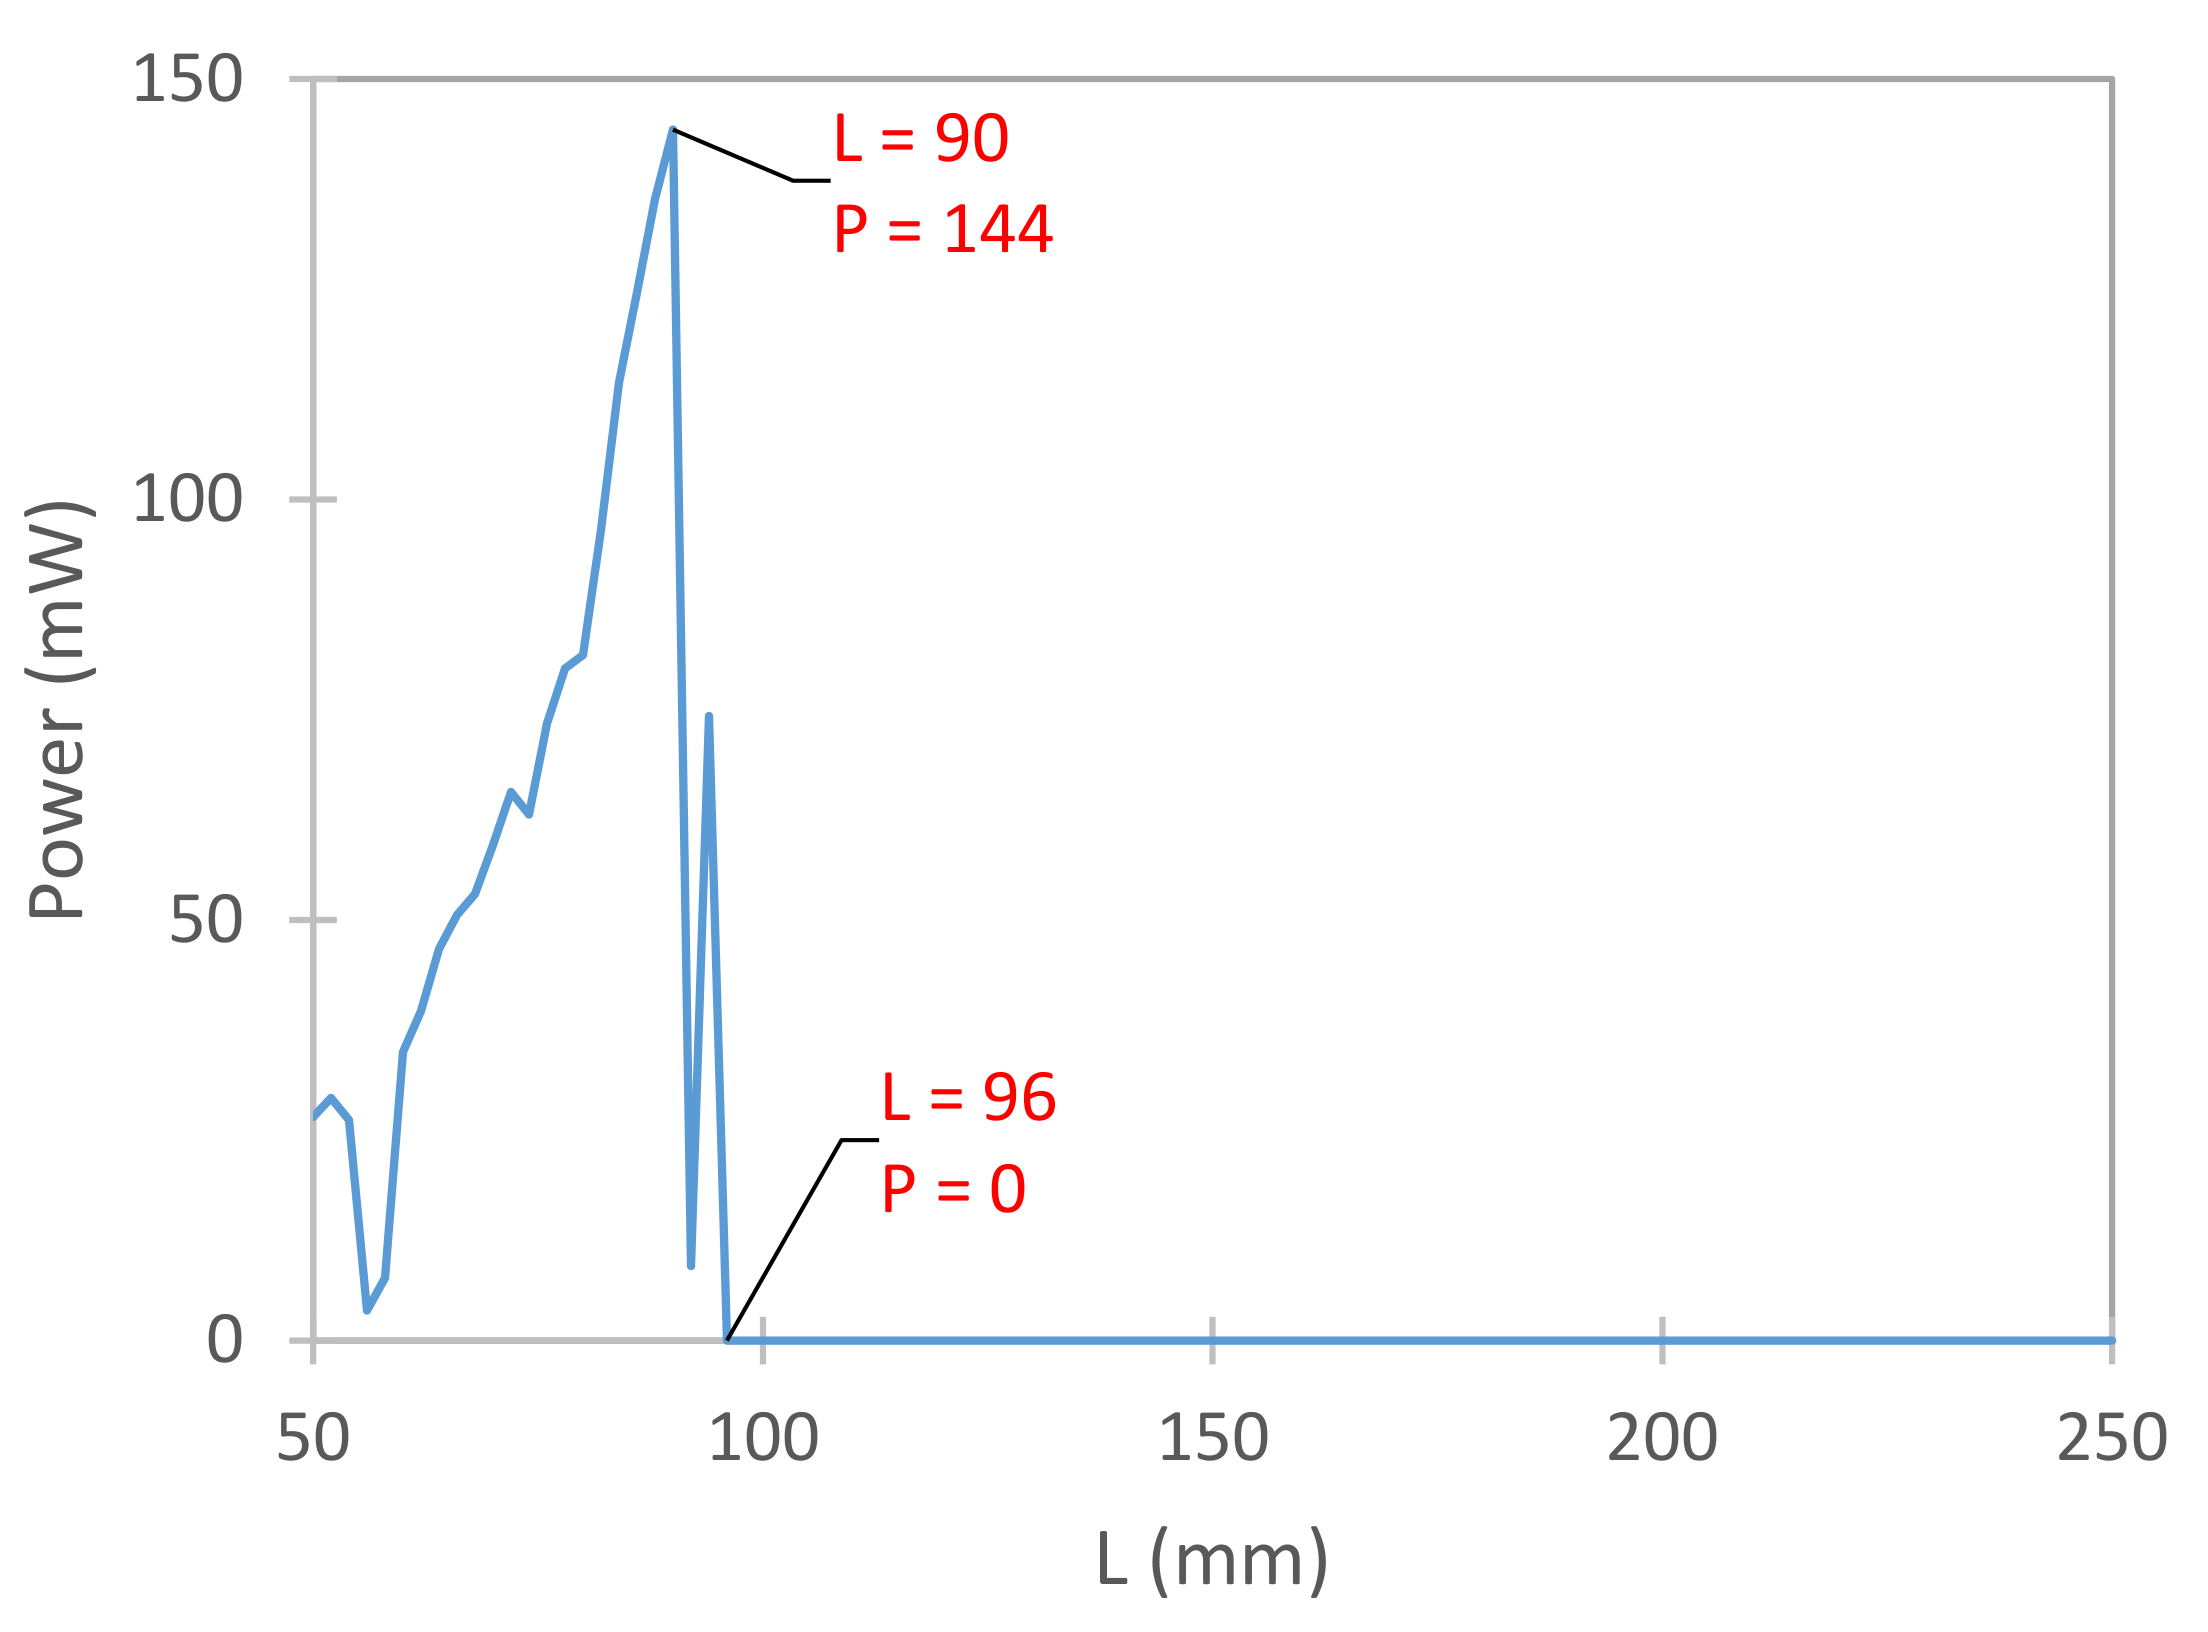
Graph Showing Variation of Power Output with Cantilever Beam Length .
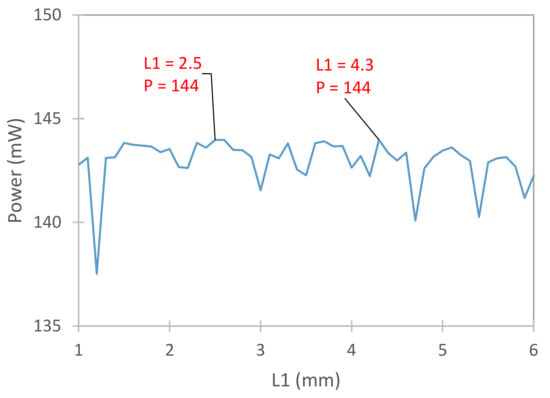
Figure 8.
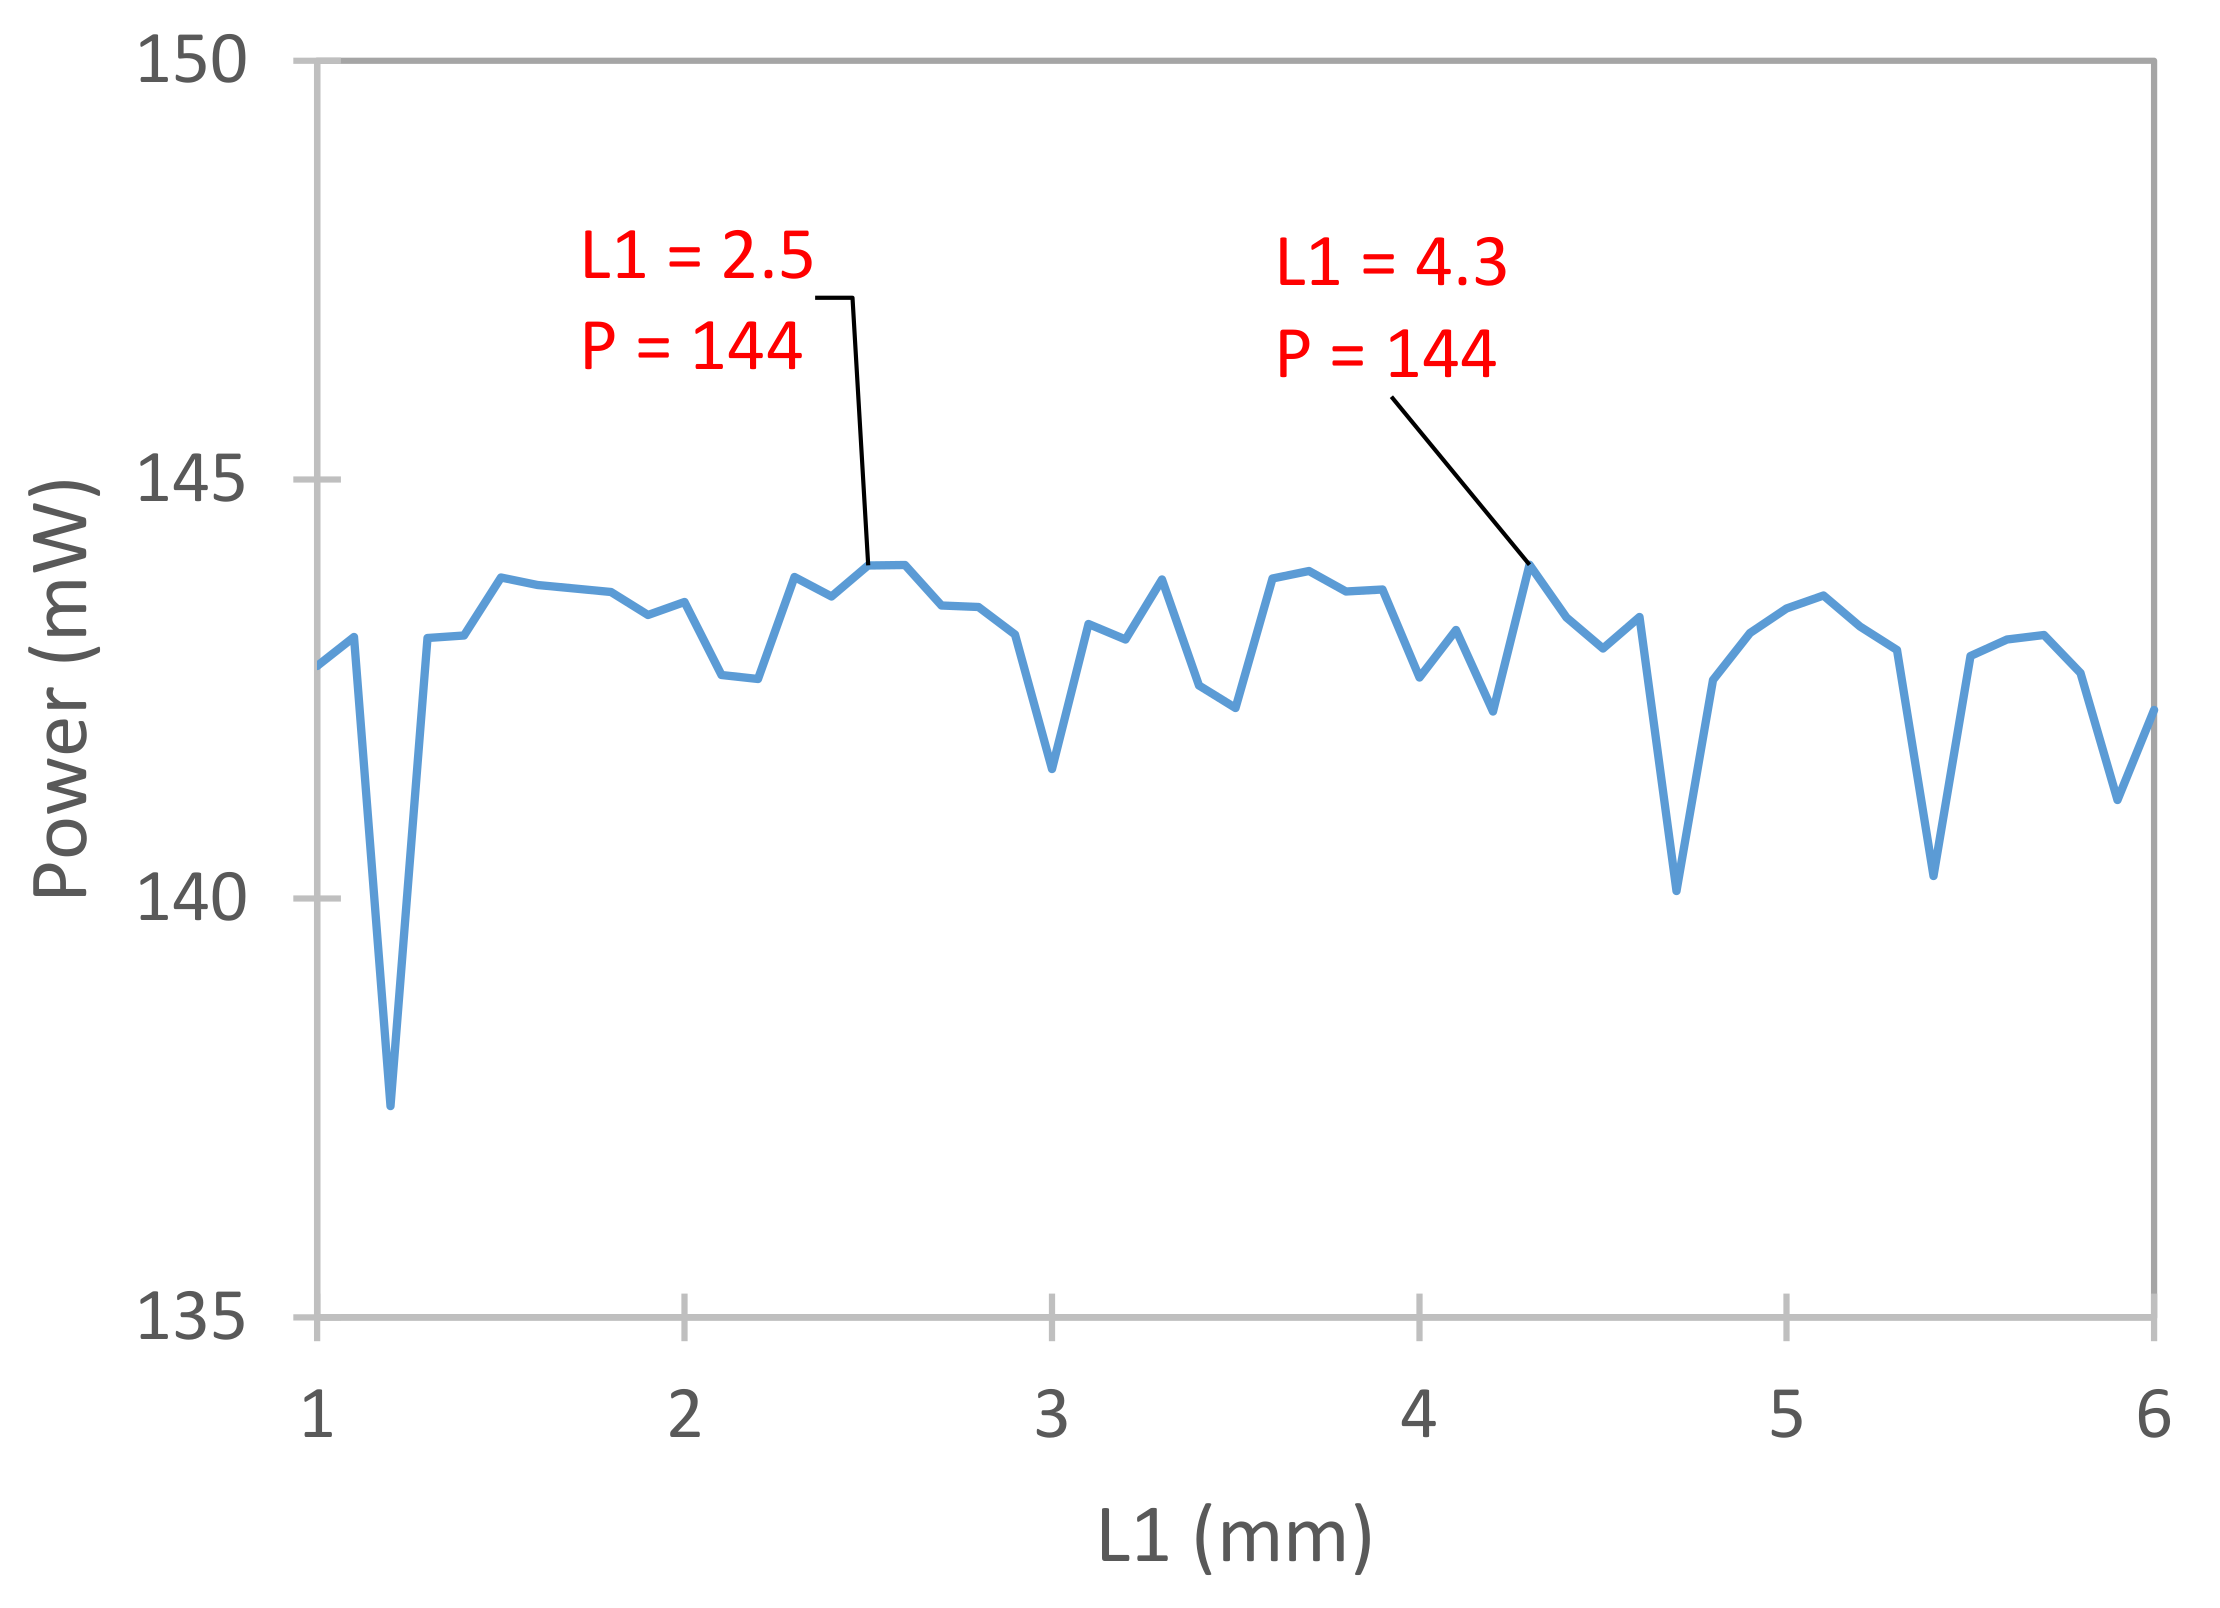
Graph Showing Variation of Power Output with the Length Between the Fixed End of the Cantilever Beam and the Starting Point of the Piezoelectric Layer .
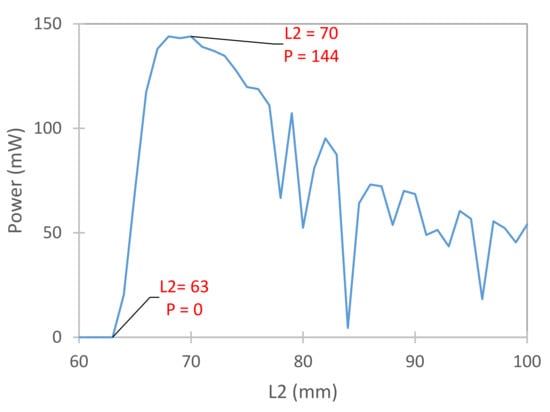
Figure 9.
Graph Showing Variation of Power Output with Length Length Between the Fixed End of the Cantilever Beam and the Ending Point of the Piezoelectric Layer .
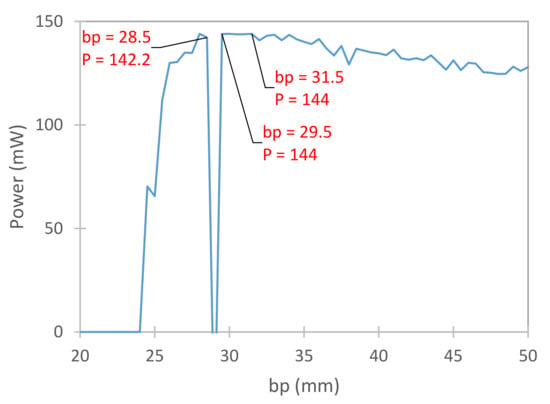
Figure 10.
Graph Showing Variation of Power Output with Piezoelectric Layer Width .
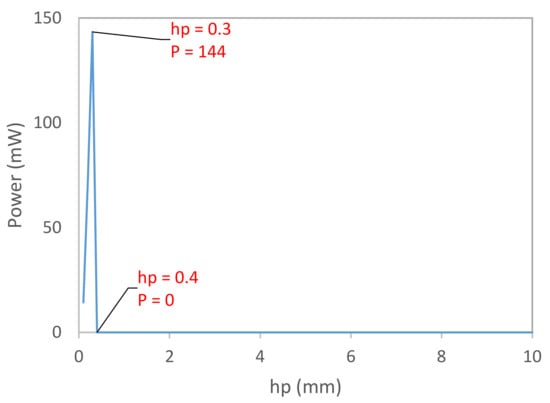
Figure 11.
Graph Showing Variation of Power Output with Piezoelectric Layer Thickness .
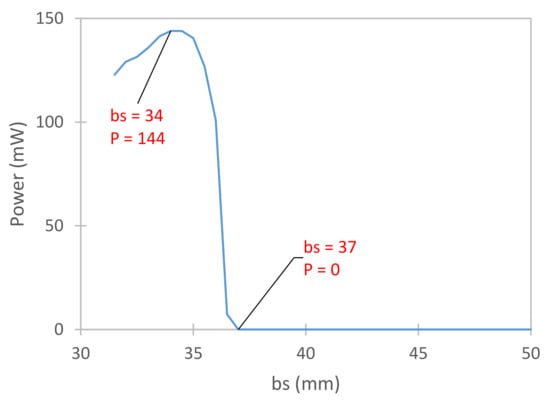
Figure 12.
Graph Showing Variation of Power Output with Substrate Layer Width .
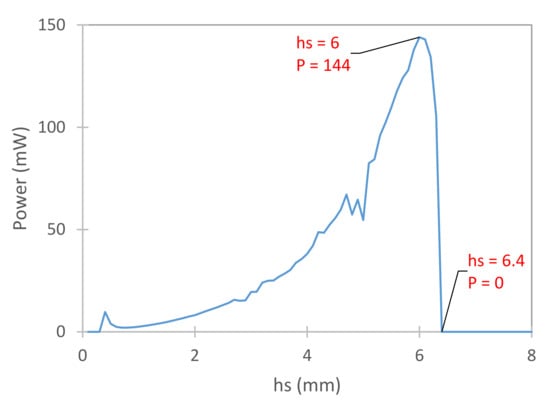
Figure 13.
Graph Showing Variation of Power Output with Substrate Layer Thickness
.
The flow velocity is varied between and with a step of .
According to Figure 3, the onset velocity is . For flow velocities below this onset velocity, no power is generated. Beyond this velocity, the harvested power increases with flow speed. It can be observed that the maximum harvested power occurs at the upper limit of the flow velocity; that is, at .
The resistance is varied between and with a step of . Figure 4 shows that for values of the resistance less than , the model produces negligible power.
For values of between and , the onset velocity is larger than the flow velocity. The maximum power is observed at a resistance of , beyond which a drop in power in observed. This is also seen in the design equations. The electrical damping (refer to Equation (9)) increases with the value of the resistance to a maximum and then starts to decrease. The electrical damping then affects the mode coordinate amplitude (refer to Equation (8)), which in turn affects the harvested voltage. The source impedance of the piezoelectric layer is defined as . This gives a value of equal to , which is almost identical to the load resistance . This means that the model is in accordance with the maximum power transfer theorem, which states that the highest output power is obtained when the source impedance is equal to the load impedance.
The extracted power is calculated for values of the bluff body diameter ranging between and with a step of . The results observed in Figure 5 for the parameter show that up to a negligible power value is obtained, or a large onset velocity is seen. The optimal value of is after which a drop in power output is observed. This is due to the fact that the mass of the bluff body is primarily affected by . Hence, beyond a certain , the piezoelectric beam starts displaying deformations that produce power less than the optimal power. This means that the hydrodynamic forces of the fluid at the optimal velocity tend to produce different vibration amplitudes in the bluff body as its mass increases. These vibration amplitudes drift farther from the optimal vibration-deformation combination as the mass of the bluff body increases, as seen in Figure 5.
The length of the bluff body is increased from to by steps. As can be observed in Figure 6, the model starts to produce positive power for values of being 160 mm or higher, with the maximum observed at 160 mm. When the length of the bluff body exceeds 310 mm, the onset velocity becomes very large compared to the flow velocity and power is no longer produced. Hence, beyond a certain bluff body mass , the piezoelectric beam is rendered incapable of displaying the deformation that produces the optimal power. This is due to the overall inertia of the bluff body reaching a point at this where the resonant frequency is much lower than the forcing frequency caused by the fluid. This renders the vibrations insufficient to produce cantilever beam deformations that lead to the extraction of considerable power. Therefore, a higher flow velocity, and hence larger hydrodynamic forces, is required for increasing values of . The negative power observed in Figure 6 is due to the fact that at certain values of , Equation (12) yields unreal roots, which leads to a negative value of and in turn a negative value for power.
The length of the cantilever beam is changed between and with steps. The same trend observed in the graph of is seen for the parameter in Figure 7, with the maximum observed at . It is noteworthy that the mass of the cantilever beam also affects the deformation of the cantilever. In addition, for values of exceeding , the power produced is either negligible or the flow velocity is less than the onset velocity, which means that a higher water velocity is required for the higher mass model, to exert a hydrodynamic force capable of producing bluff body vibrations that cause sufficient piezoelectric deformation.
There is noticeable fluctuation in power values as the parameter (the length between the fixed end of the cantilever beam and the starting point of the piezoelectric layer) is increased from to by . This means that the obtained power is highly sensitive to this parameter. A maximum is seen at in Figure 8. However, the third highest power is observed at . The difference between the powers at these two values of is less than . That being said, and given the need to decrease space and budget, the optimal value of is assumed to be .
With the values of and being constant, changing (the length between the fixed end of the cantilever beam and the ending point of the piezoelectric layer) means changing the length of the piezoelectric layer. is varied between and with a step of . Figure 9 shows that the water velocity becomes sufficient at and maximum power is obtained at . For values greater than this, the power produced decreases and fluctuations are observed. This drop is due not only to the mass of the model, but also the piezoelectric material’s maximum electricity-generating capacity and the effect of on piezoelectric deformation.
The width of the piezoelectric layer is increased from to by steps and the power extracted is reported at each step. For values of less than or equal to , the water velocity is insufficient to produce considerable power, as observed in Figure 10. The optimal value for is . For a value of , there is a significant drop in harvested power. Investigating the MATLAB code shows that the drop is due to a decrease in the electromechanical coupling term . This term depicts the conversion ratio between mechanical energy and electrical energy. In turn, this drop in is due to a low value of the term , which is the derivative of the mode shape of the beam with respect to at a length . It can be concluded that at , and at the optimal piezoelectric length and thickness, the deformation in the beam does not cause the electric charges to align such that an electrical output is produced, hence the low value observed for .
The thickness of the piezoelectric layer is varied between and with a step of . According to Figure 11, the maximum energy harvested occurs at an value of , and the critical dimension above which power becomes negligible due to onset velocity is . It is noteworthy that power is extremely sensitive to this parameter as a change causes the power to drop from maximum to minimum. This analysis leads to the conclusion that a very specific thickness is required for the electric charges in piezoelectric materials to properly rearrange upon the given deformation such that they produce considerable power.
Figure 12 shows that the optimal value of the width of the substrate layer is . This optimality is obtained for the parameter ranging between (the optimal width of the piezoelectric layer) and , studied every . Values of this dimension below , produce positive power which increases up to the maximum at . For values of of and higher, power output is negligible. This is because the width of the substrate affects the bending capacity of the cantilever beam and thus, the deformation of the piezoelectric layer.
The optimal value of the thickness of the substrate layer , ranging between and with steps, is observed in Figure 13 to be . At , and for a velocity of , the power output is reduced to zero, due to the increased thickness reducing the bending capacity of the beam.
4.2. Optimal Model Specifications
Figure 14 shows the 3D figure of the optimal model and its dimensioned drawing. The mass of the entire model is and its volume is or . These values are obtained from SolidWorks and exclude the top support from which the setup hangs. Using Equation (17), the vortex shedding frequency is found to be .
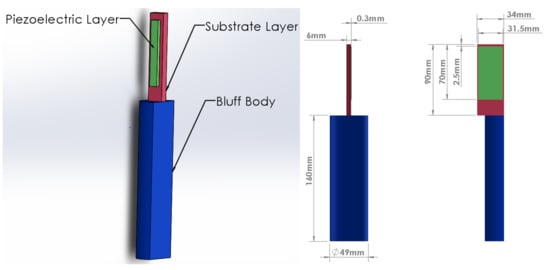
Figure 14.
3D Model and Dimensioned Drawing of Optimal Model.
Using the values of mode coordinates and mode shapes extracted from the code, the maximum tensile strain is found to be which is less than the recommended maximum tensile strain ( on average). This means that the solution to the optimization problem is acceptable.
The mechanical power produced by the vibrations of the bluff body is given by [64]:
where is the lift coefficient and equal to 0.5 based on experimentation on setups with similar Reynolds number [64] and is the vortex shedding frequency. This formula gives a mechanical power of or . With an electrical output of , the electromechanical efficiency is found to be .
4.3. Comparing the Performance of Different Piezoelectric Materials in the Optimal Setup
Table 3 shows the densities and piezoelectric properties of different piezoelectric properties. The materials include the MFC defined in this study. It also includes PZT-5A, PZT-5H and PMN-PT (30% PT). The properties of the three new materials are extracted from [65].

Table 3.
Densities and Piezoelectric Properties of Different Piezoelectric Materials.
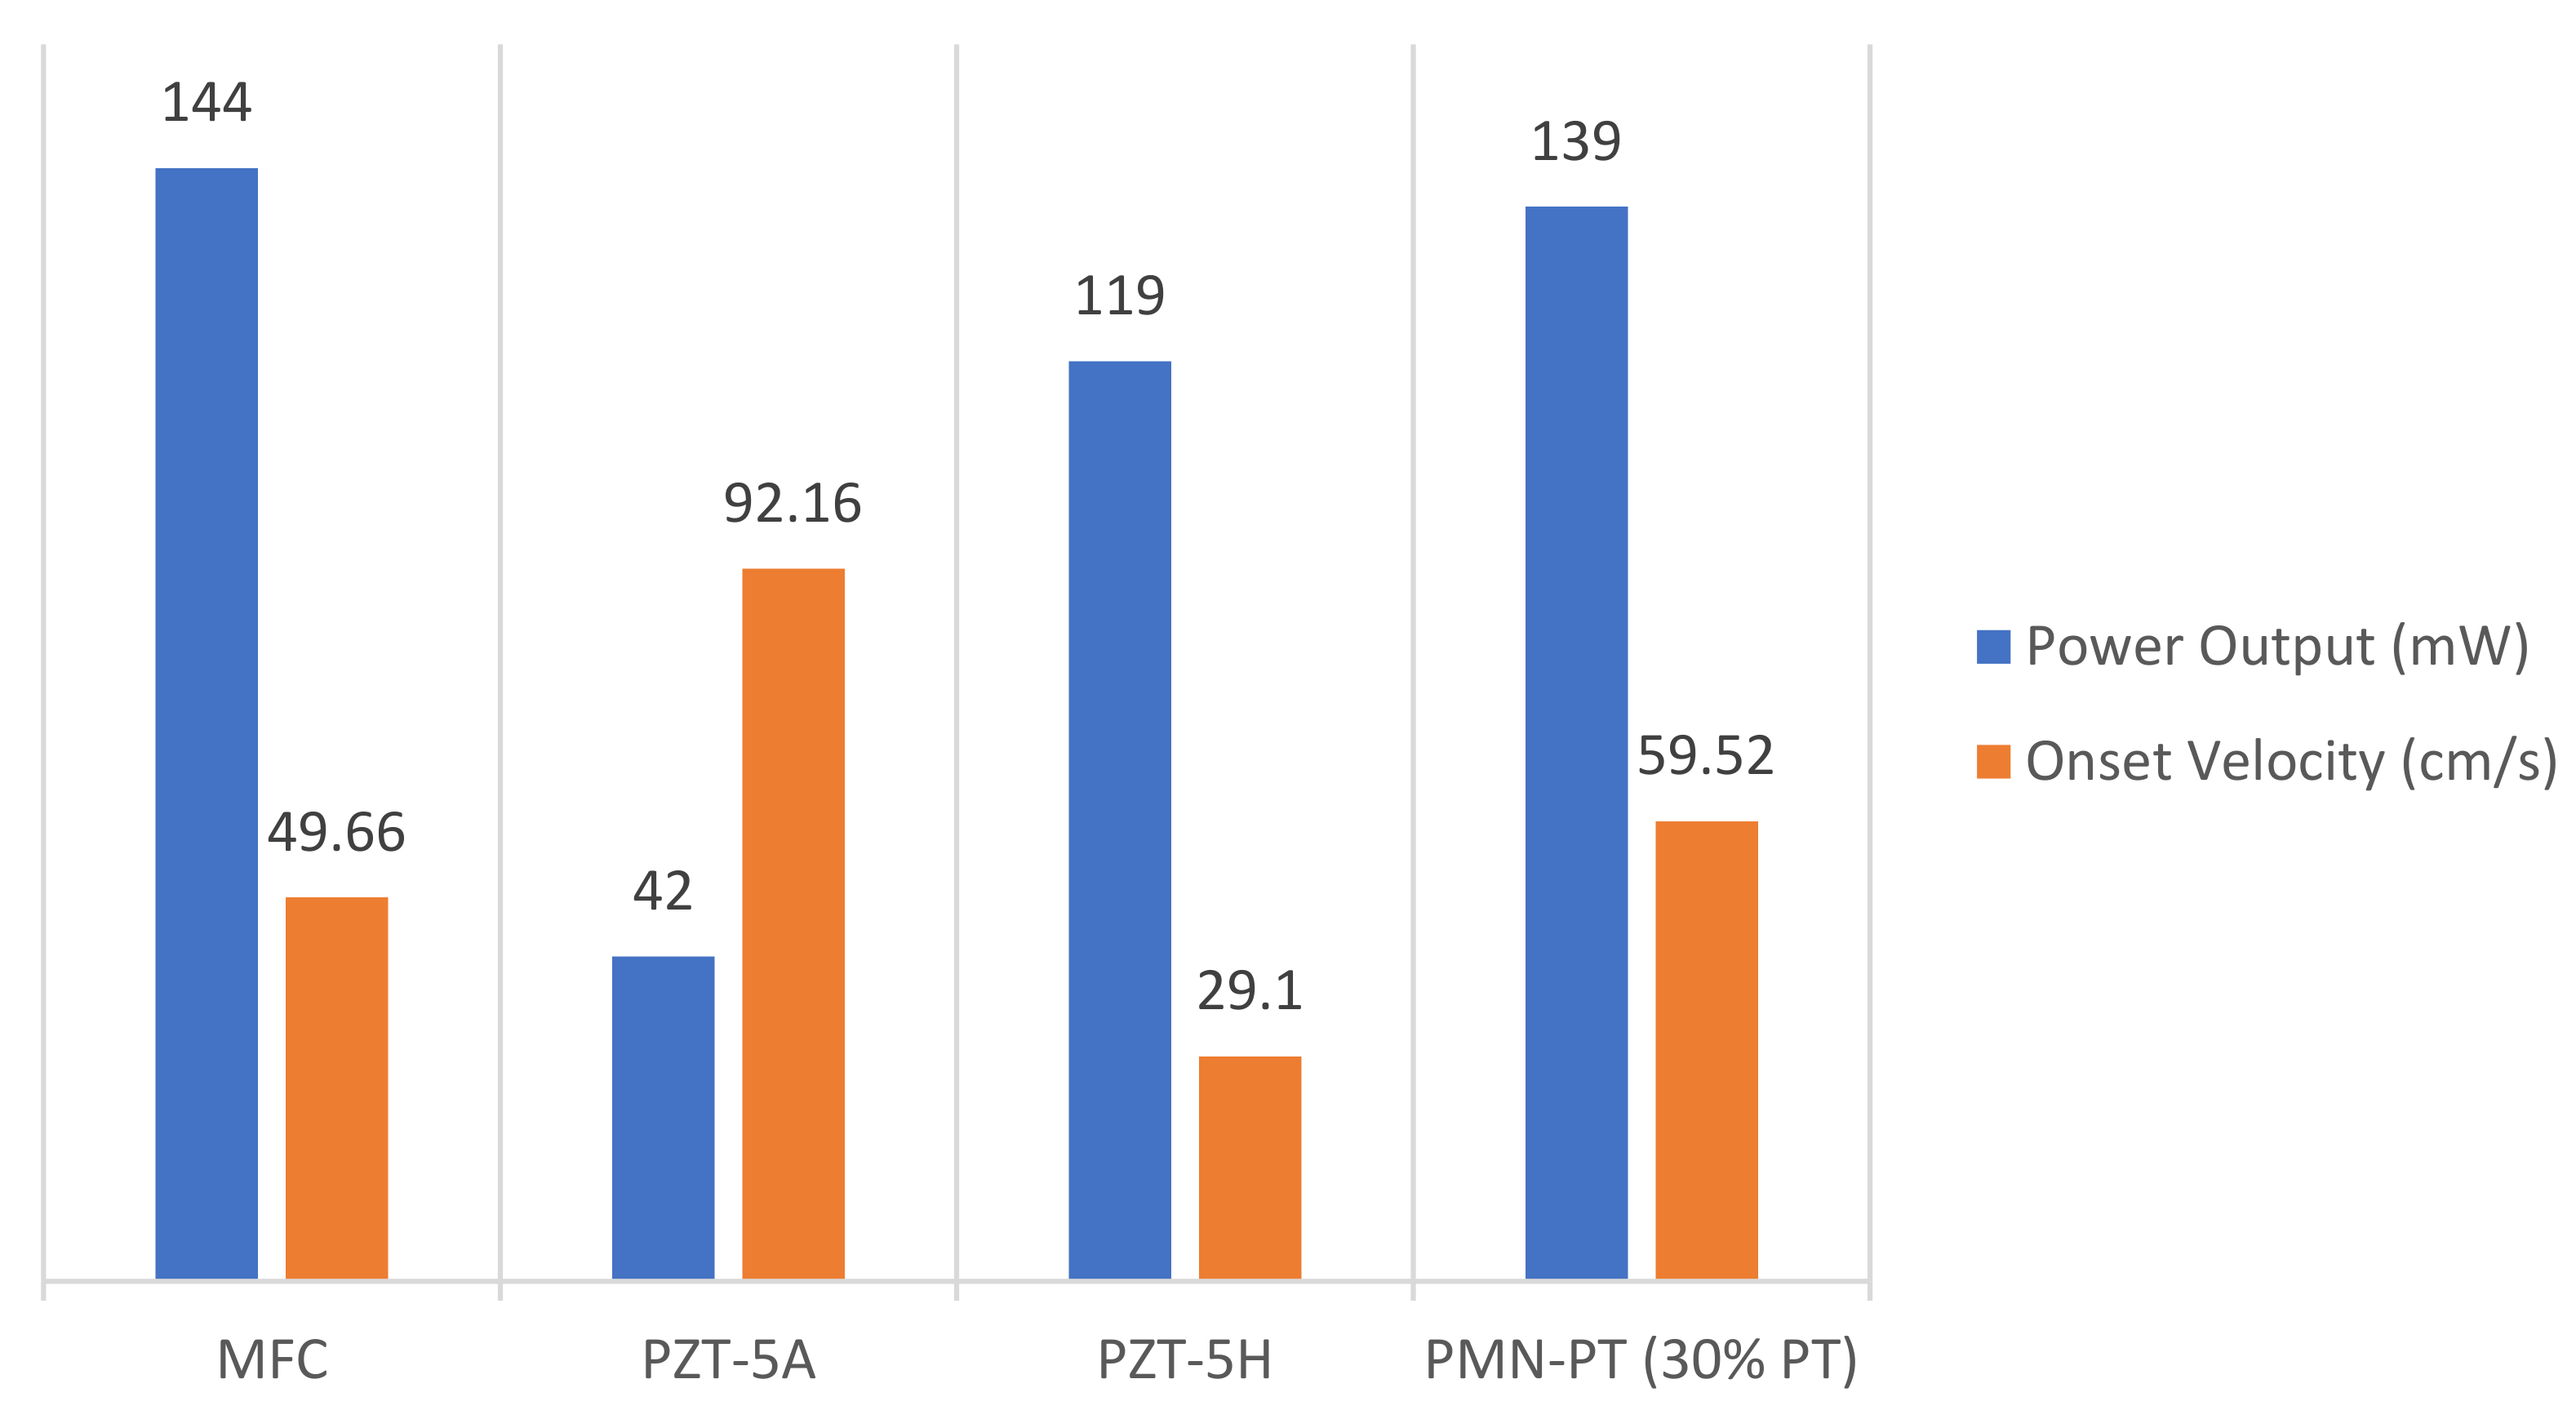
The results of this comparison in terms of power output and onset velocity are shown in Figure 15.
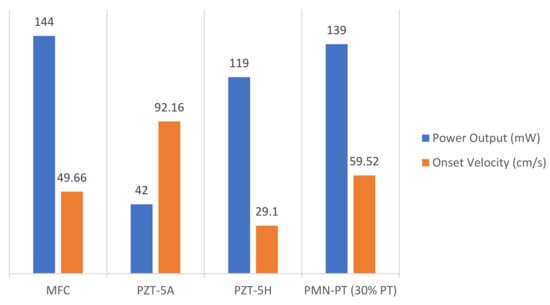
Figure 15.
Power Output and Onset Velocity for Different Piezoelectric Materials at the Optimal Model.
When comparing the performance of the different materials, Figure 15 shows that the MFC produces the highest power, followed by PMN-PT (30% PT), PZT-5H and then PZT-5A. However, in low-velocity flow environments, PZT-5H is the most convenient since it has a low onset velocity. Among the four materials, PZT-5A has the least performance in terms of power output and onset velocity.
5. Computational Fluid Dynamics (CFD)
The amplitude of vibration of the bluff body depends mainly on the hydrodynamic forces exerted by the fluid on the body. To determine hydrodynamic forces, a CFD analysis is conducted using ANSYS Fluent. The inlet velocity is specified, and the solution is calculated at 0.001 s per time step for 8000 time steps.
5.1. Mesh Convergence
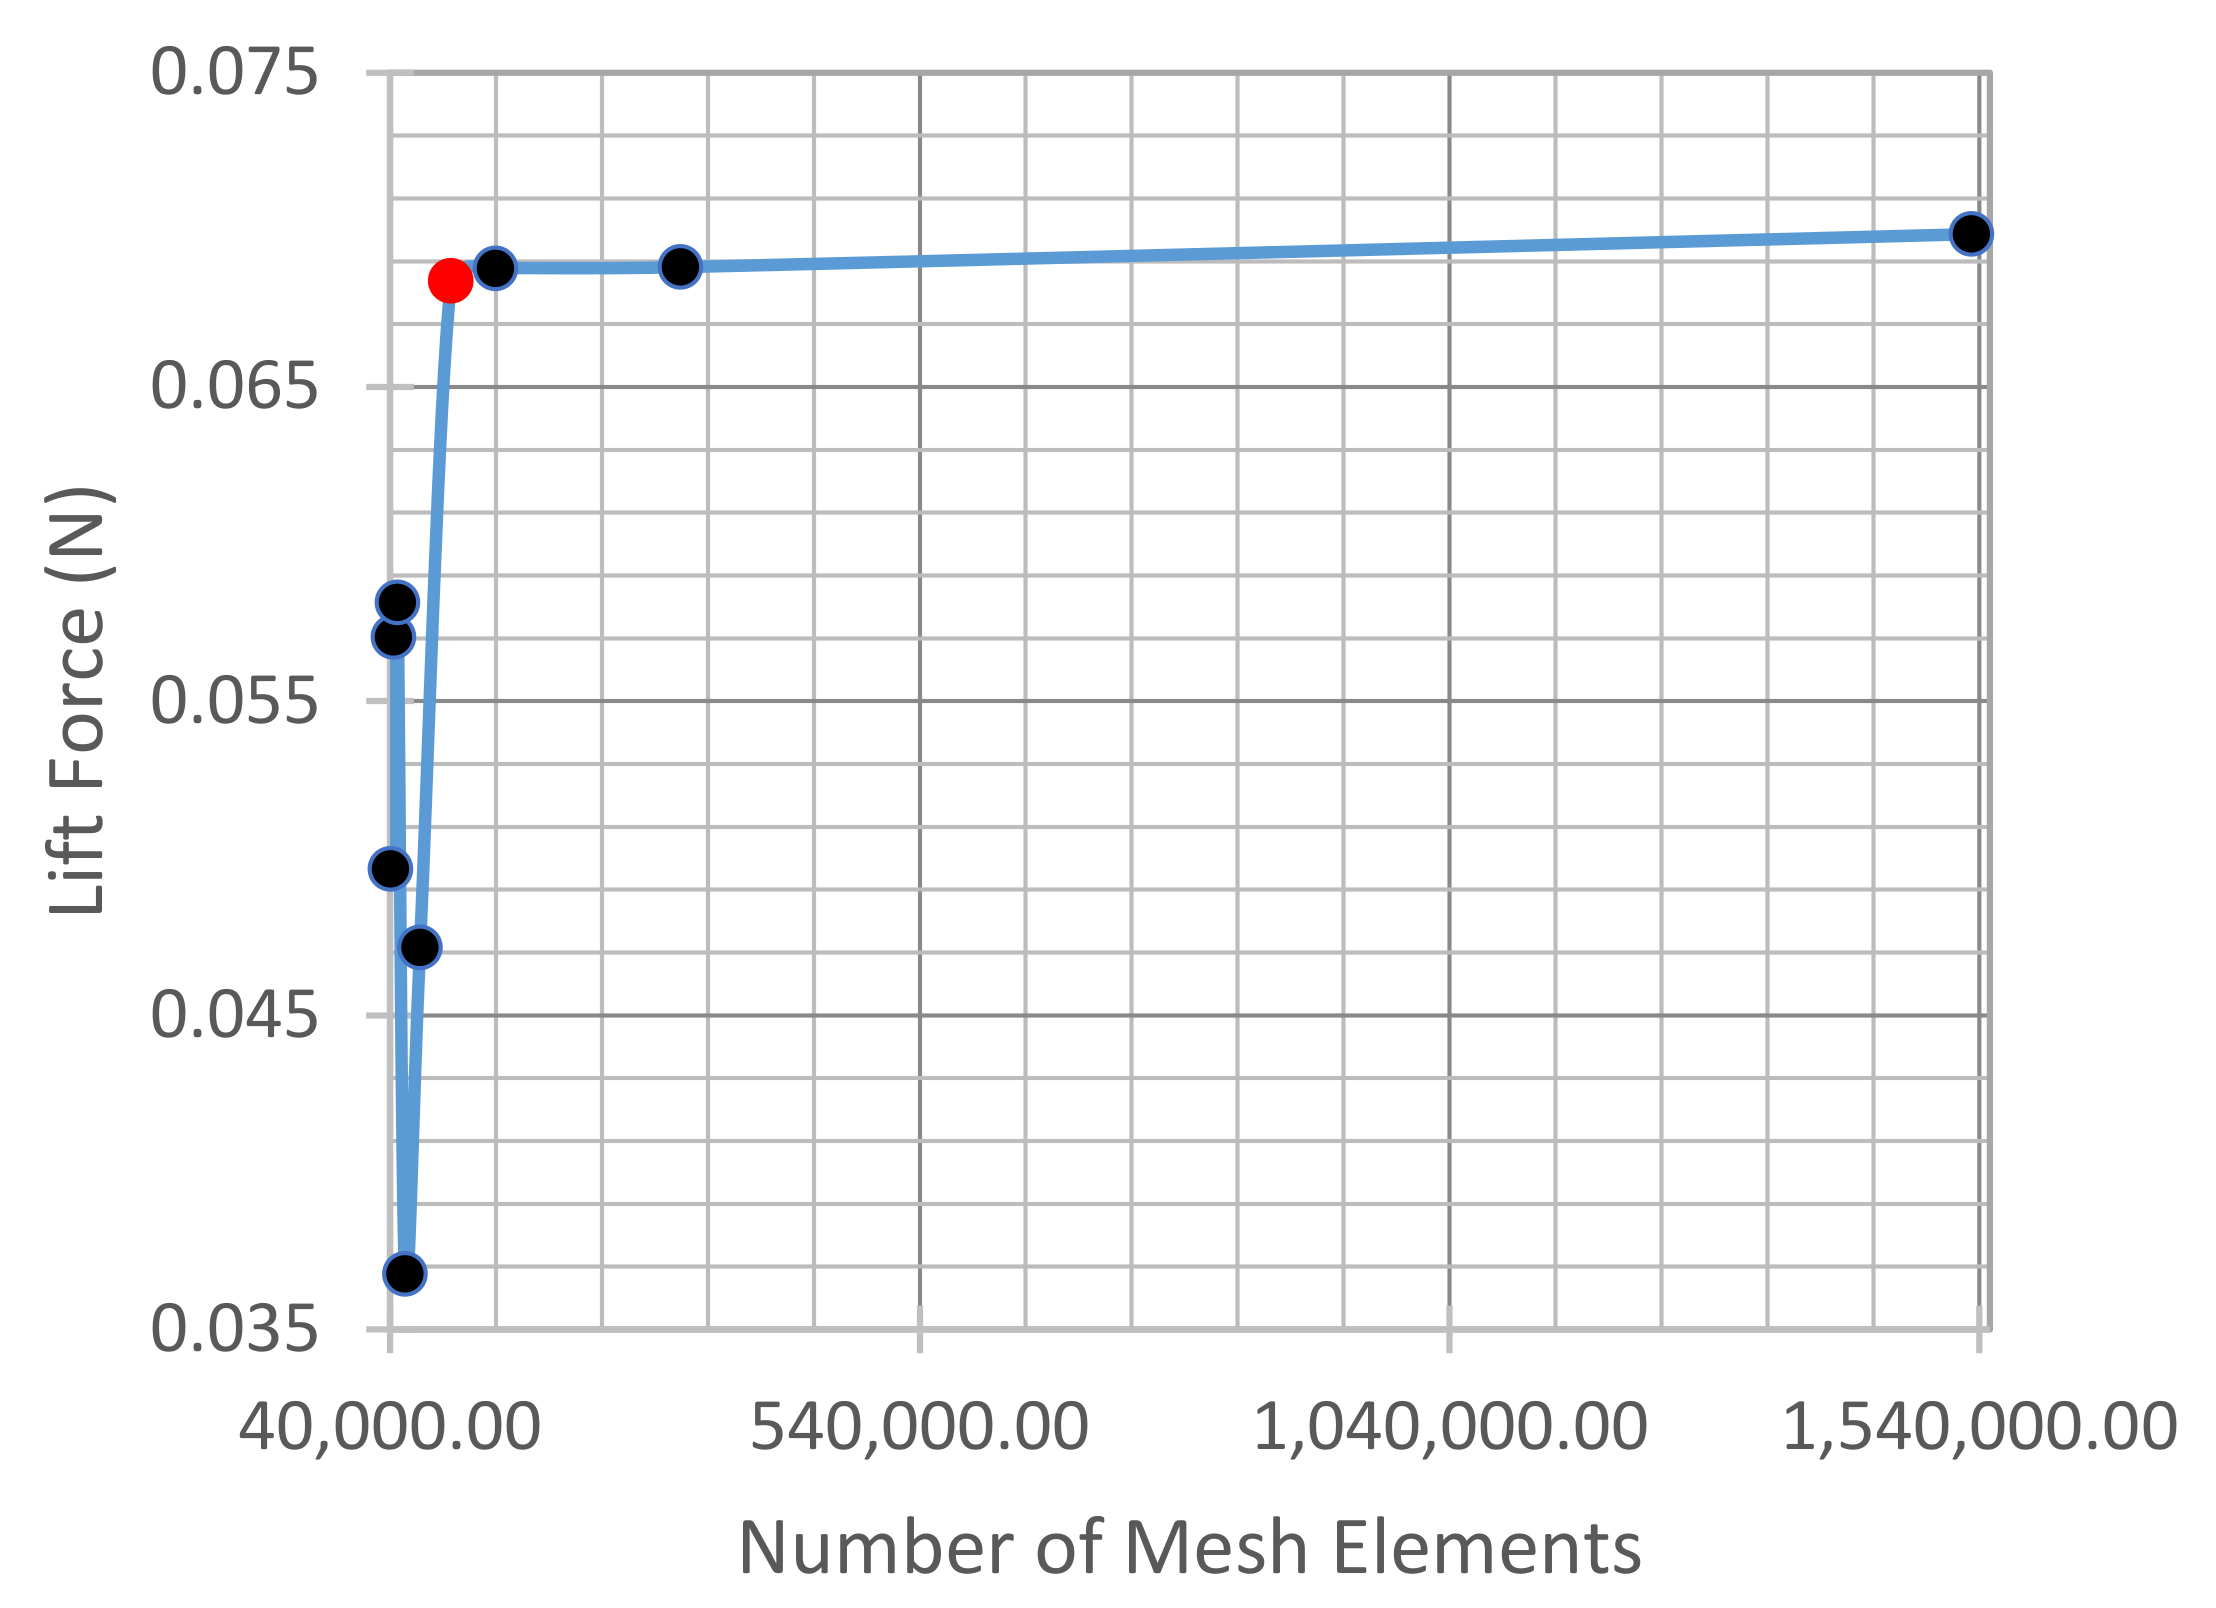
A mesh convergence study is conducted to ensure that the elements of the mesh are small enough to accurately compute results without being needlessly small. The results show that the lift force has changed less than for the element size of and higher (Figure 16).
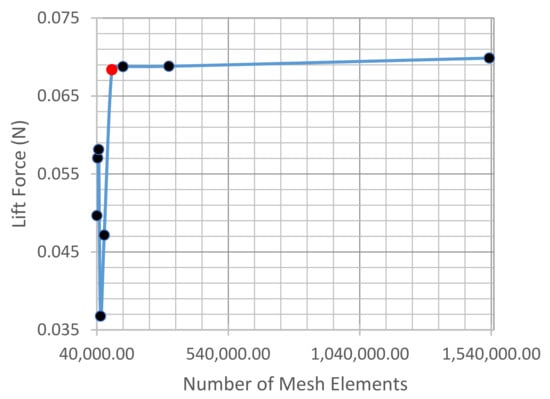
Figure 16.
3D Model and Dimensioned Drawing of Optimal Model.
5.2. Domain Convergence
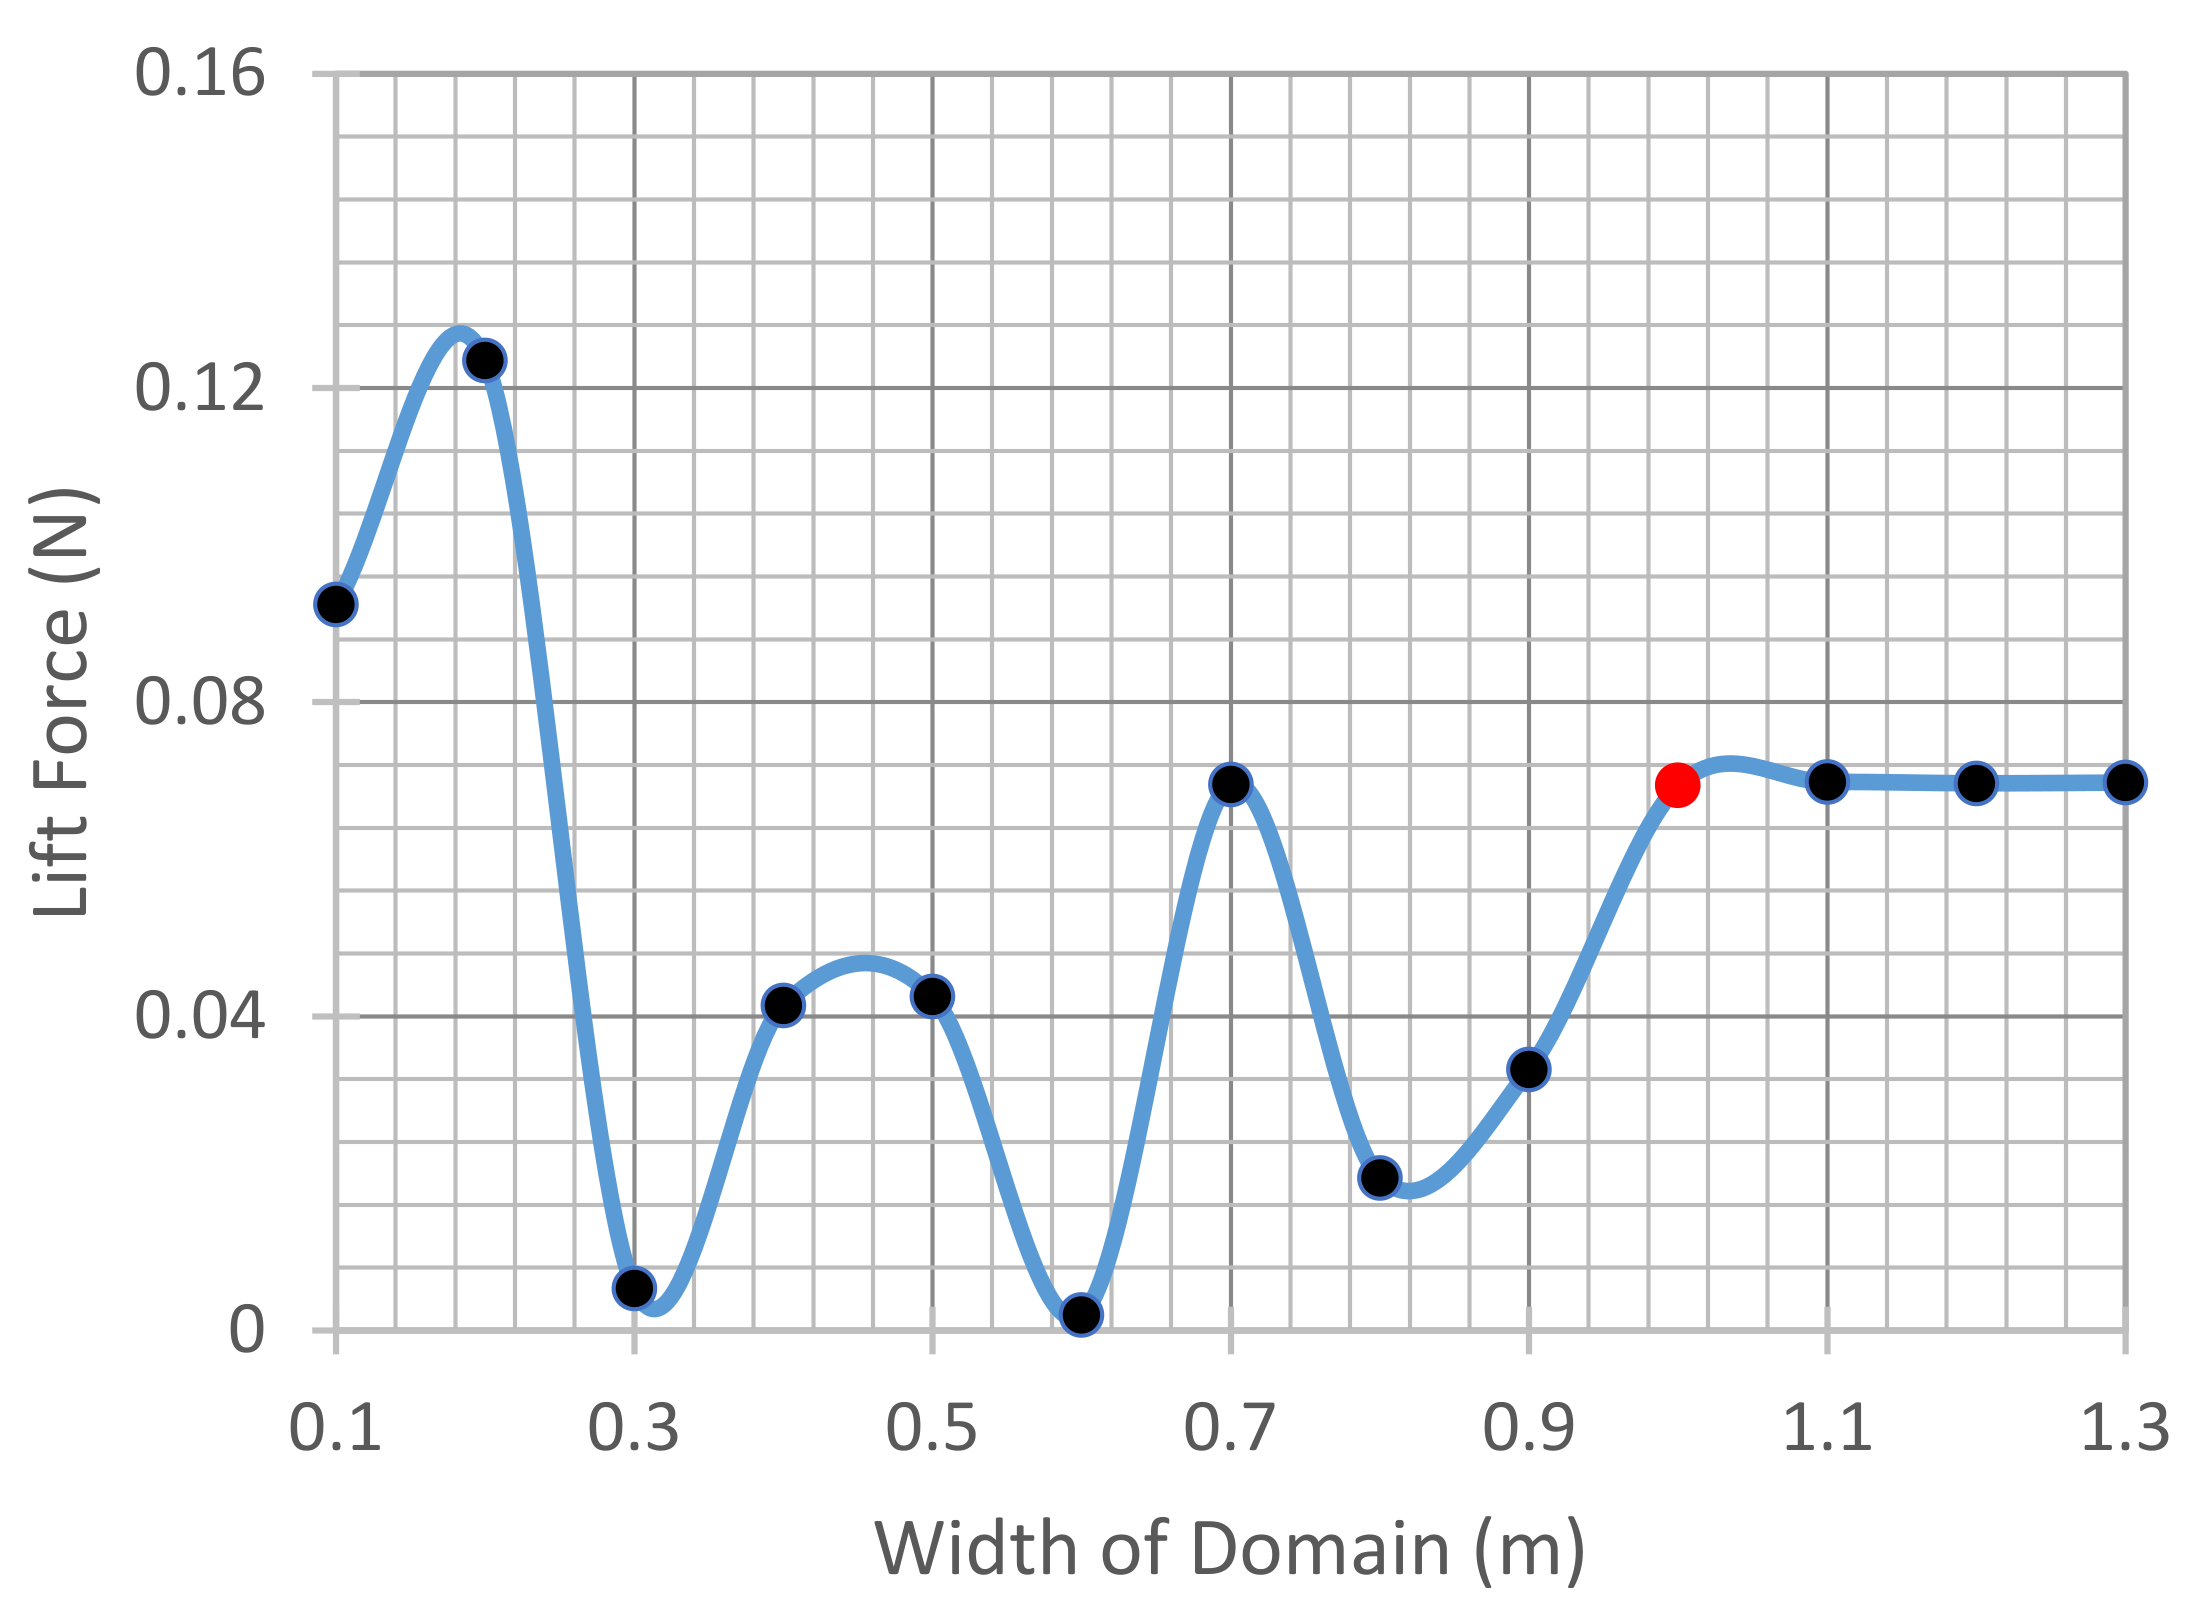
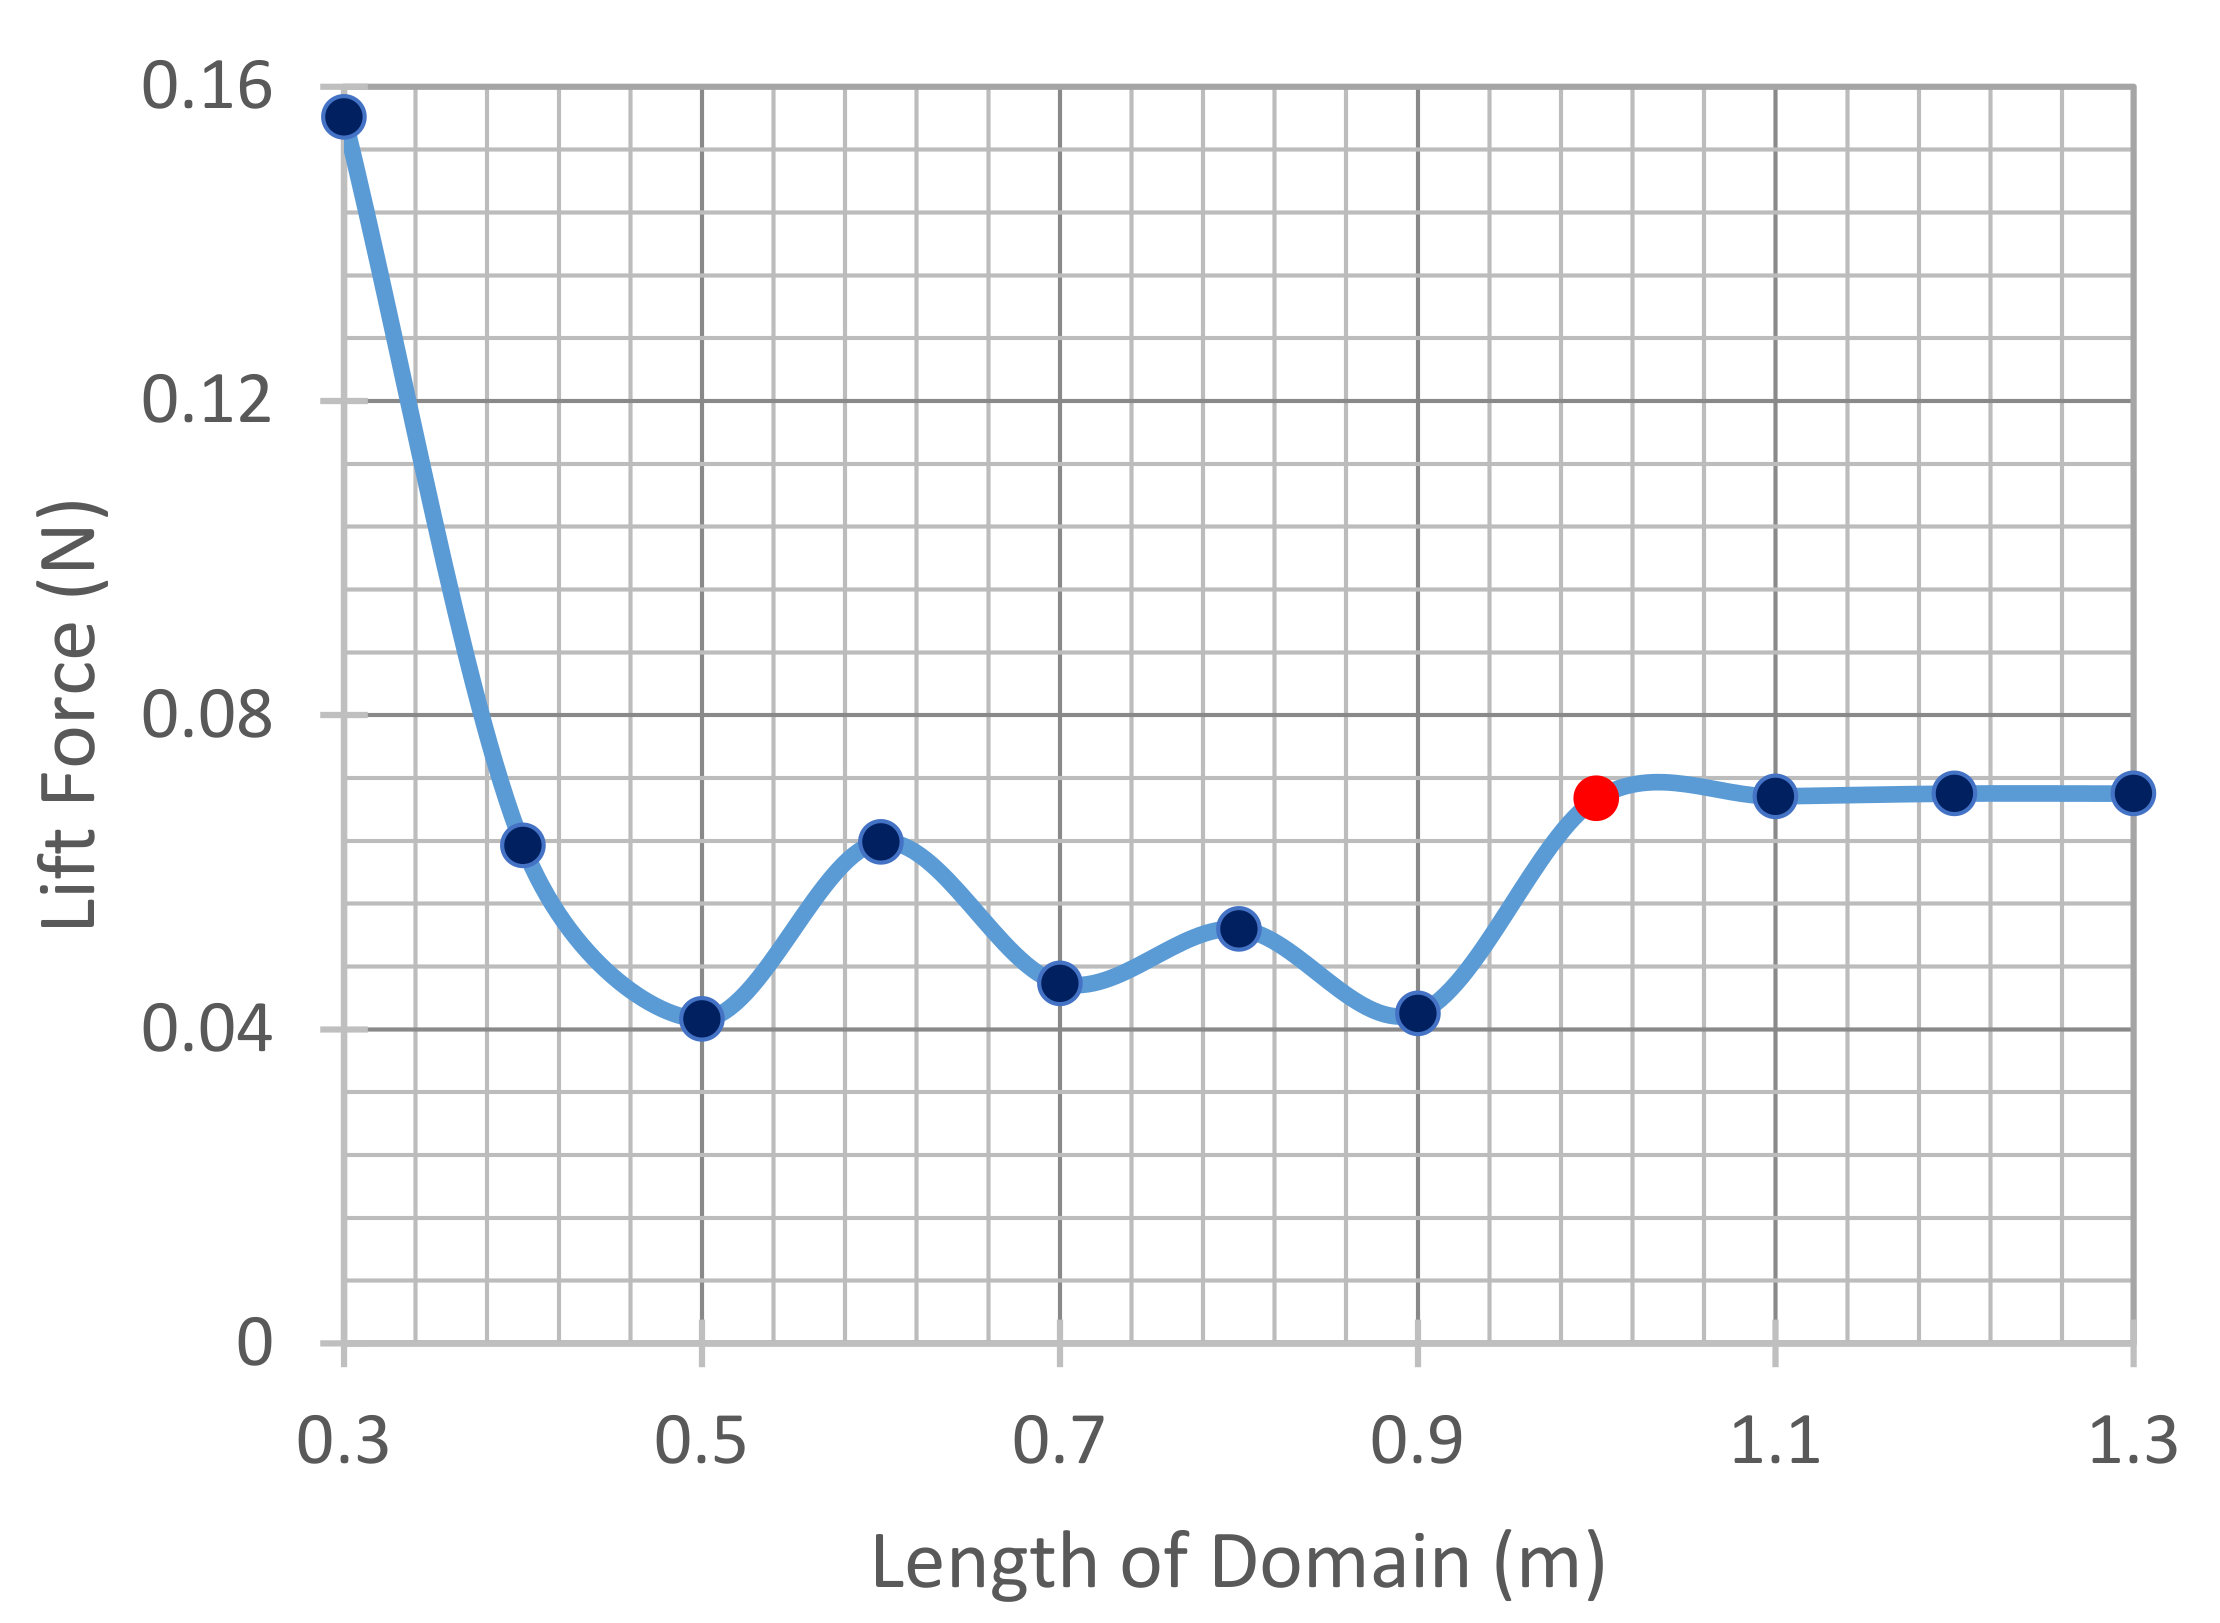
The domain convergence study is conducted to determine the smallest domain dimensions that produce accurate results which prevents the turbulence at the walls of the domain interferes with the actual solution. The domain convergence is performed based on the lift force. The convergent width is first identified by increasing the width gradually until the lift force converges. The same process is repeated for the length at the convergent width. The results are shown in Figure 17 and Figure 18.
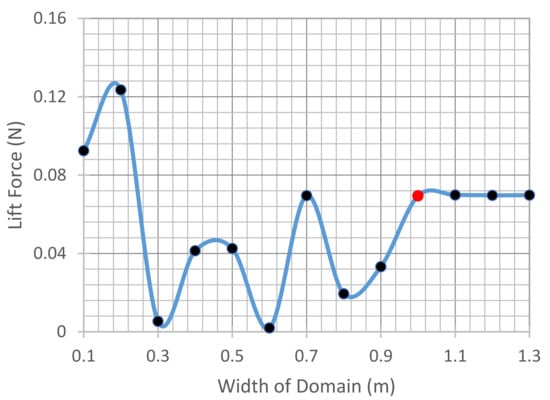
Figure 17.
Domain Width Convergence Plot.
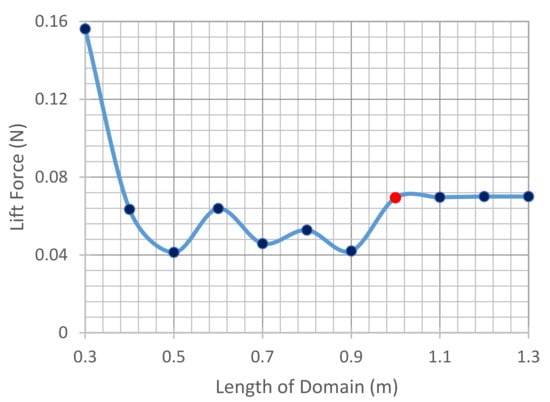
Figure 18.
Domain Length Convergence Plot.
The difference in the lift force between this dimension and all subsequent dimensions is less than 2%. In addition, this dimension is more than 20 times the diameter of the bluff body, which ensures that it is large enough in width and length for the flow to normalize, for turbulence interference to be avoided and for the software to accurately compute results.
5.3. CFD Results
CFD analysis is conducted on the optimal model and three models. Table 4 summarizes the parameters of the different models.

Table 4.
Specifications for Different Models Subject to Finite Element Analysis.
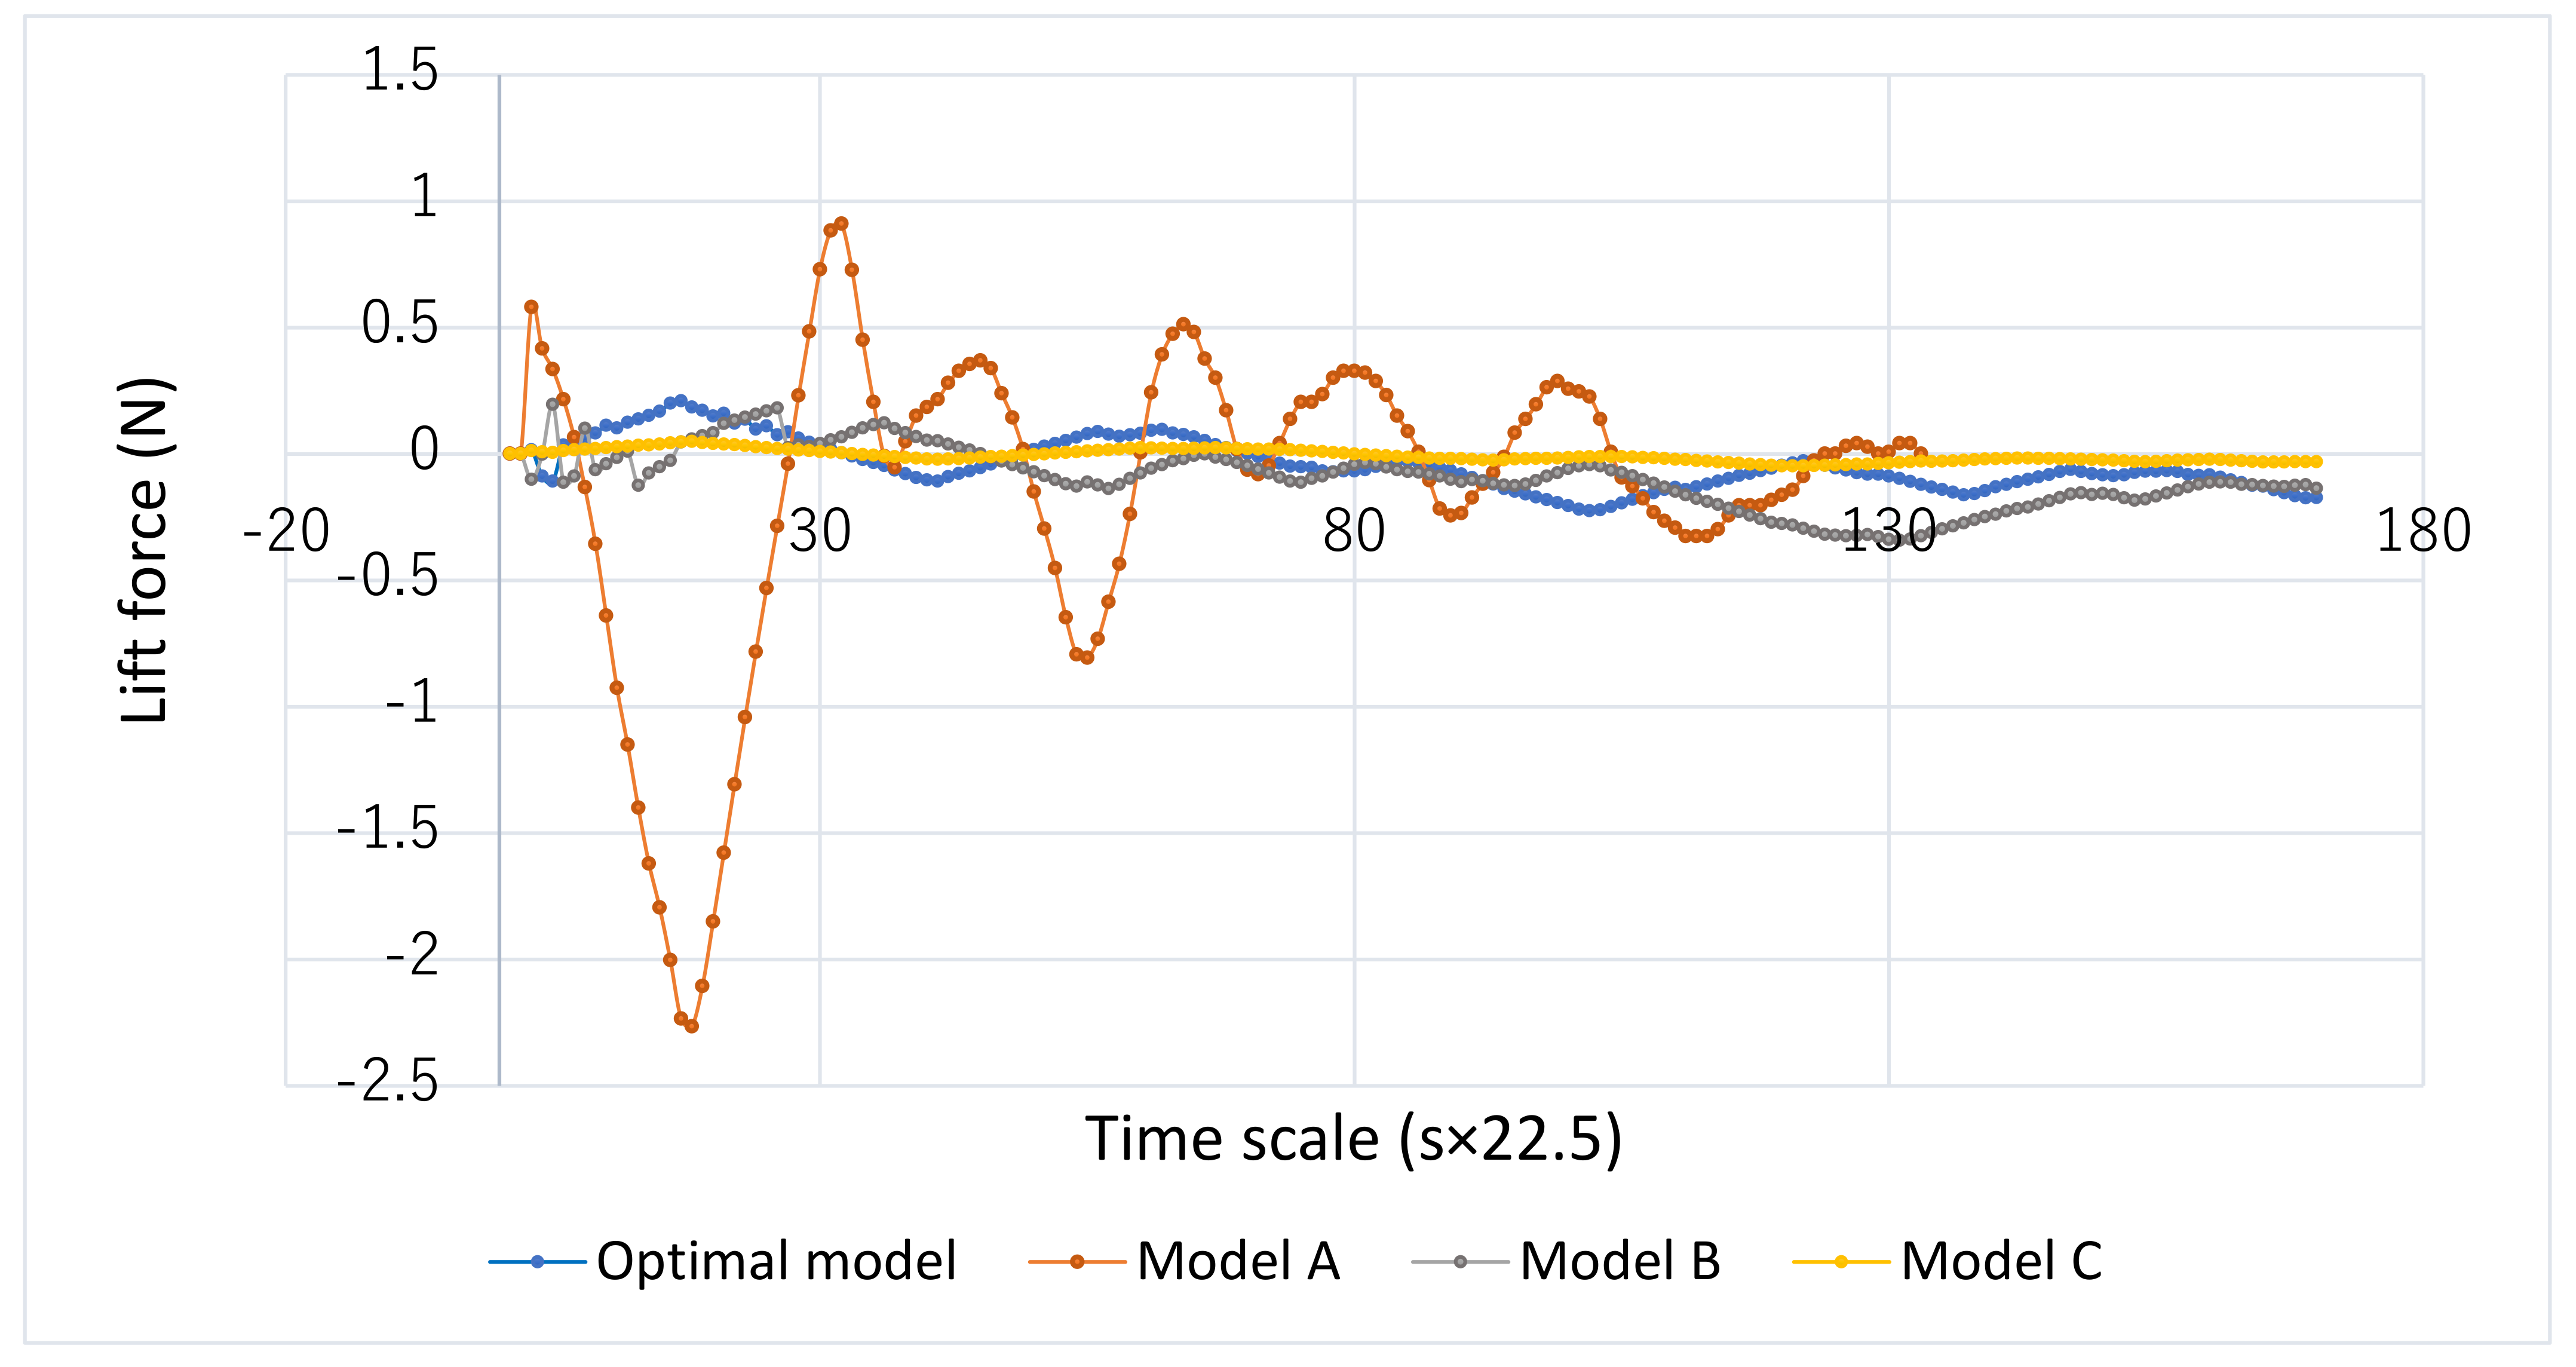
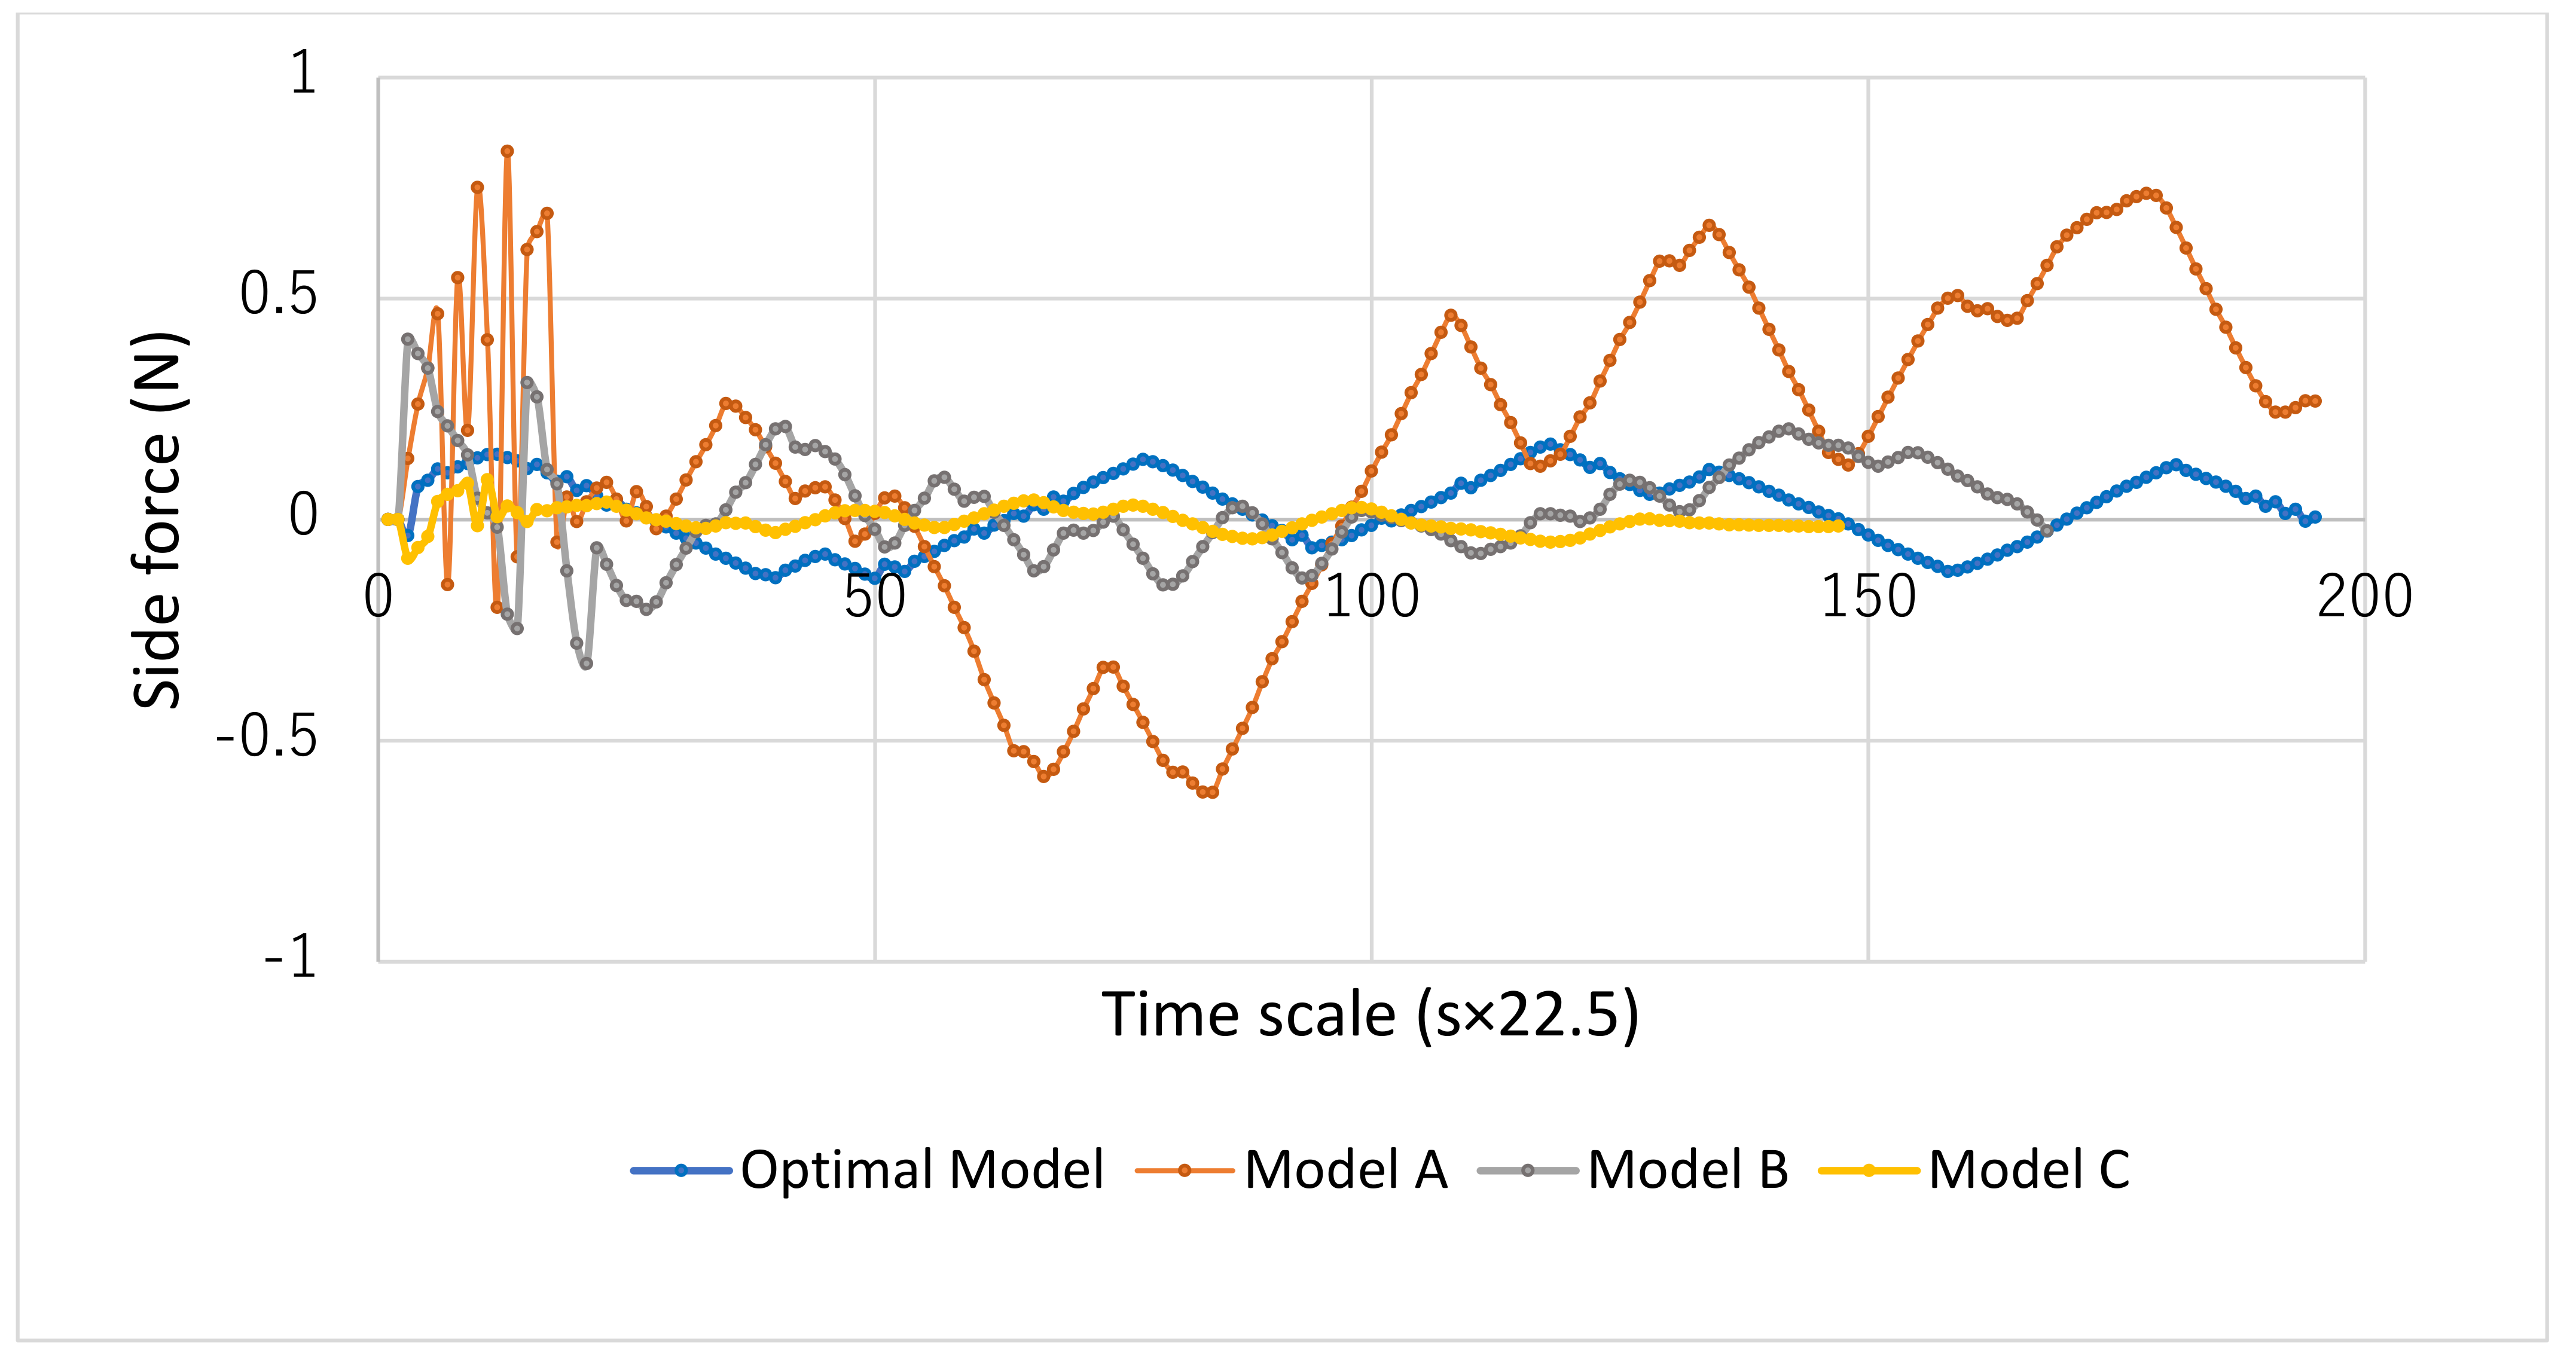
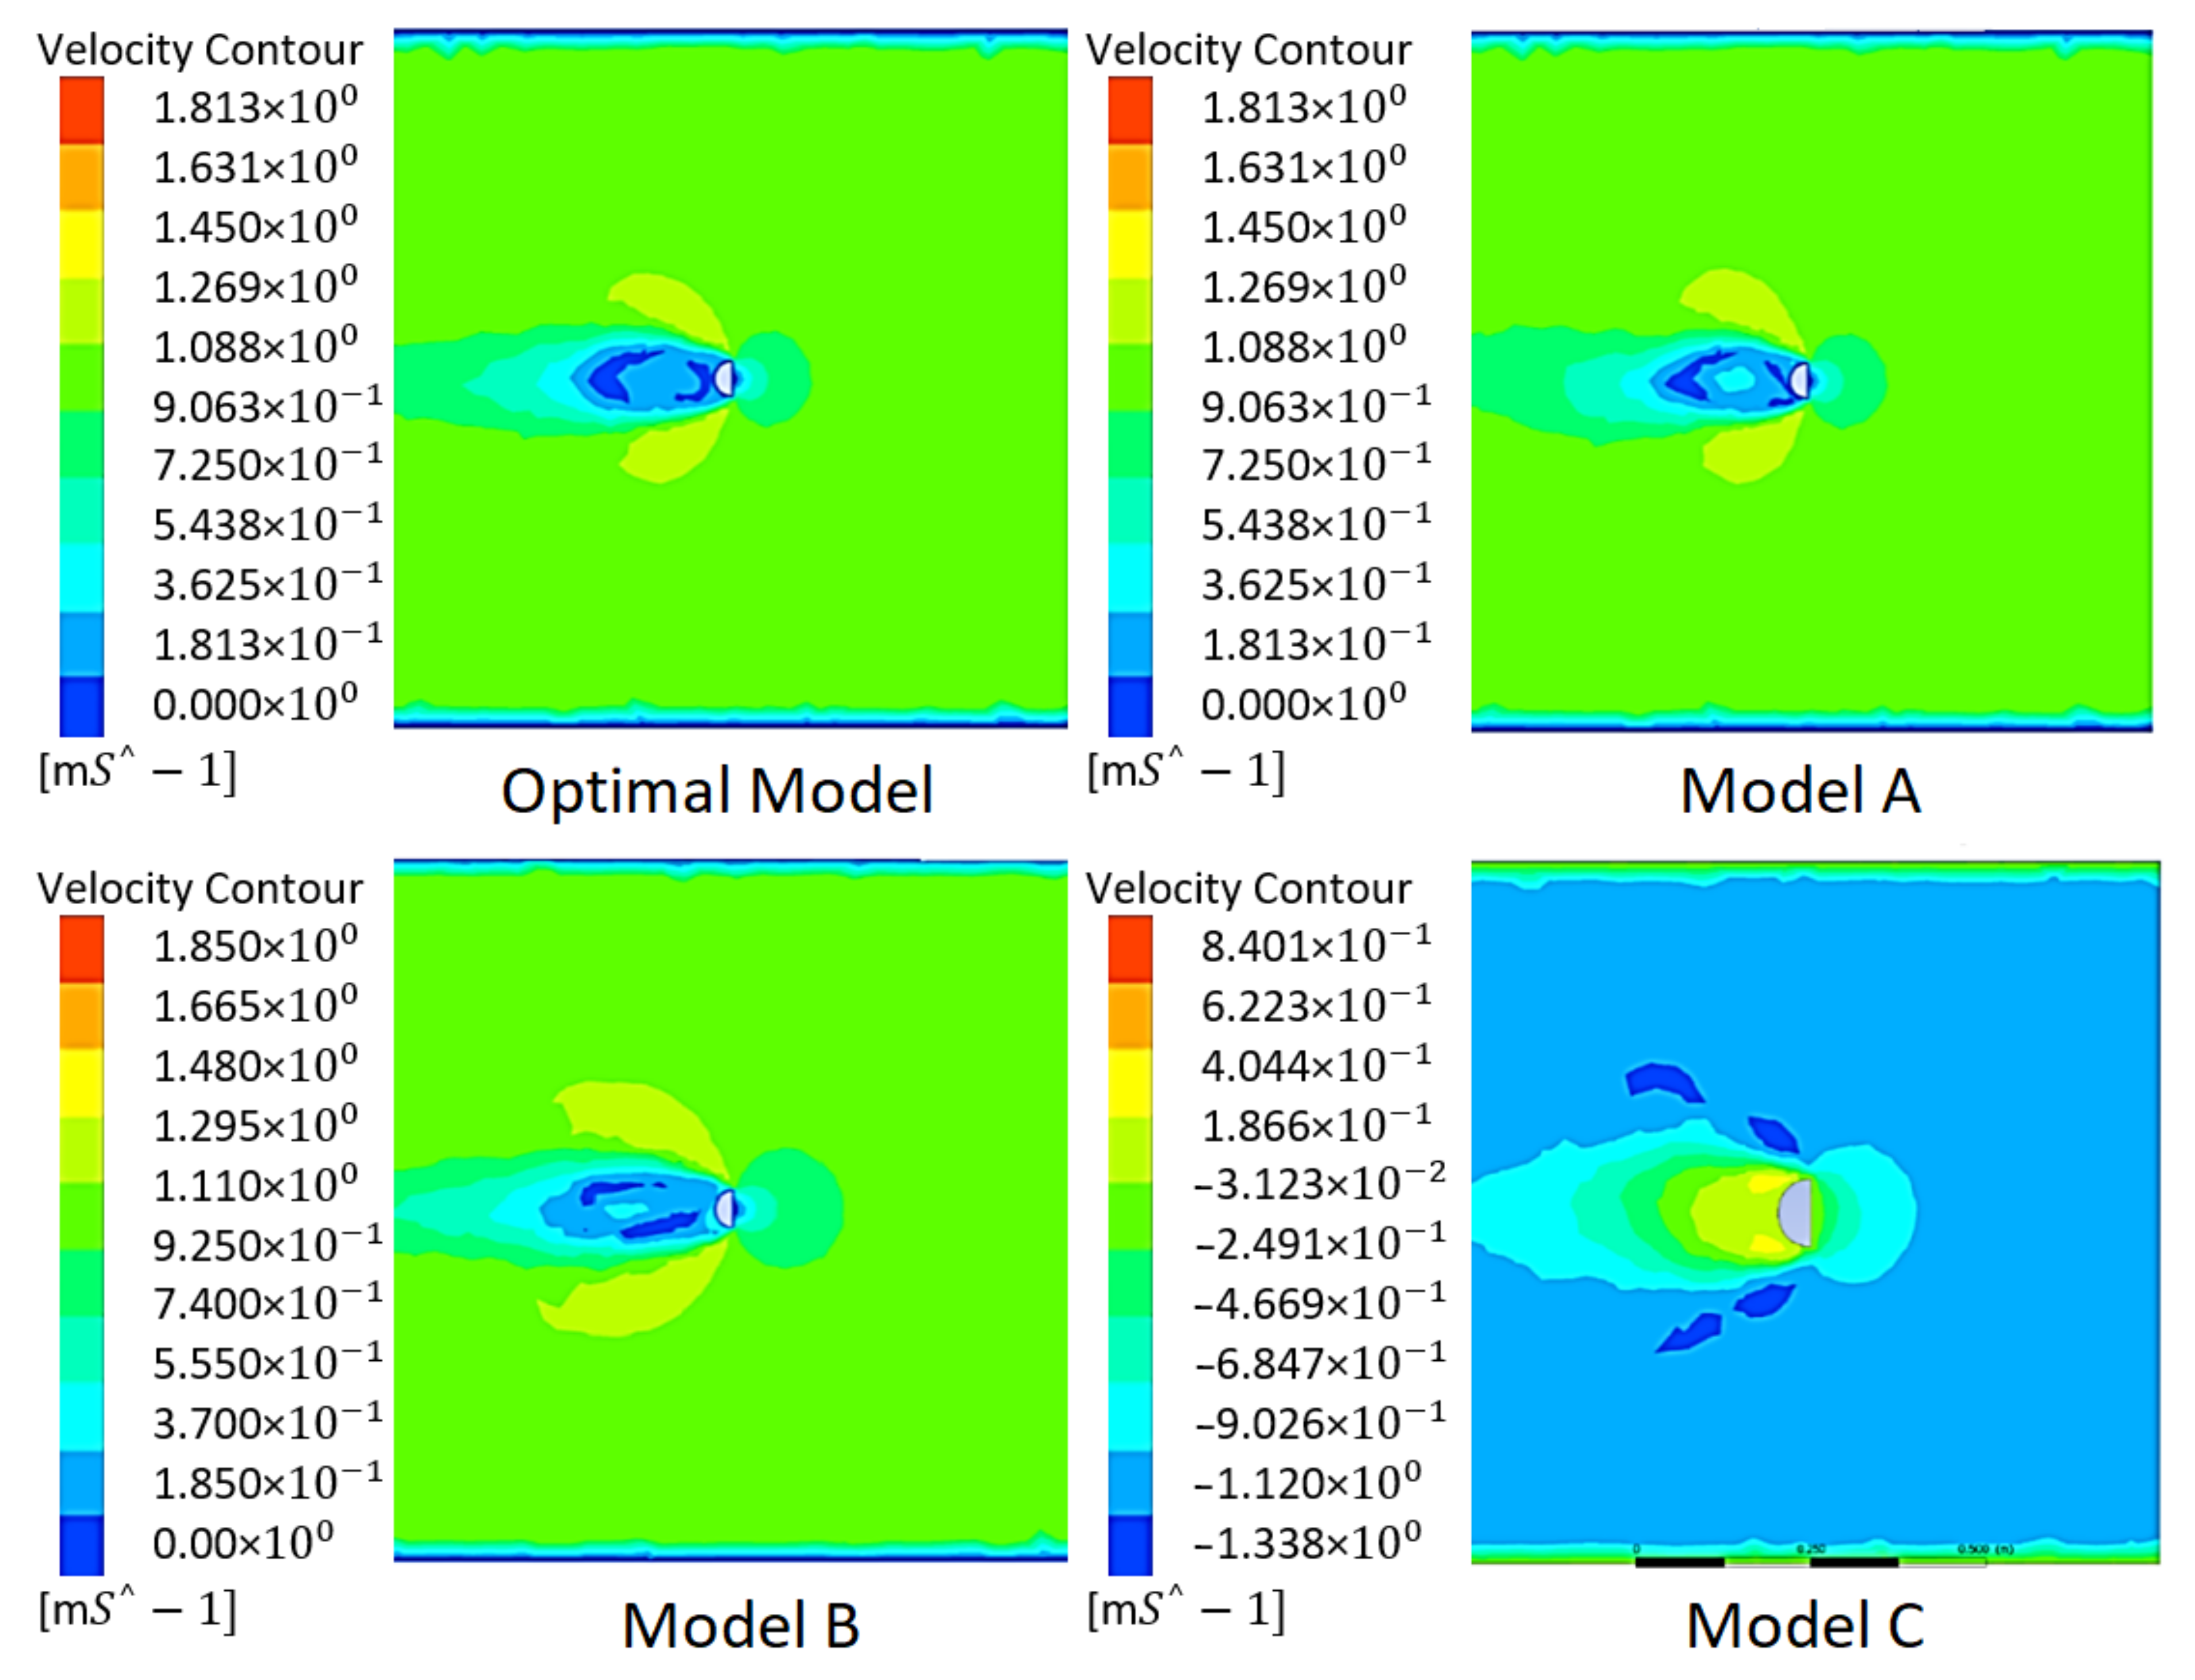
The variation of the lift and side forces exerted on the bluff body over time are plotted in Figure 19 and Figure 20 respectively for the four models. Figure 21 shows the velocity contours that allow for observing the vortex shedding occurring in each model.
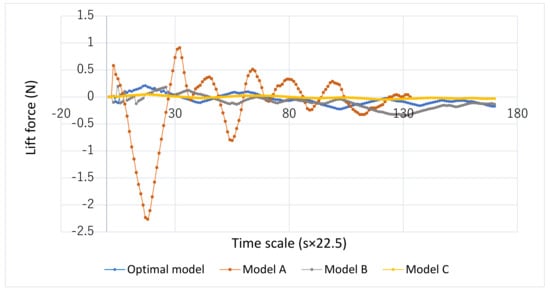
Figure 19.
Lift Force Plots for the Optimal Model and Models A, B and C.
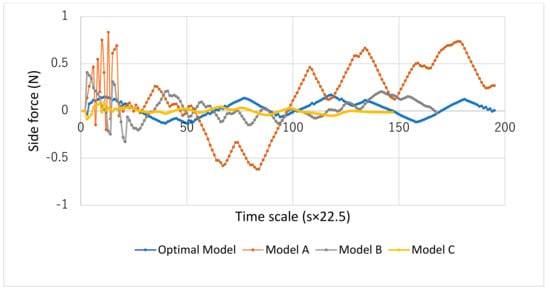
Figure 20.
Side Force Plots for Different Models.
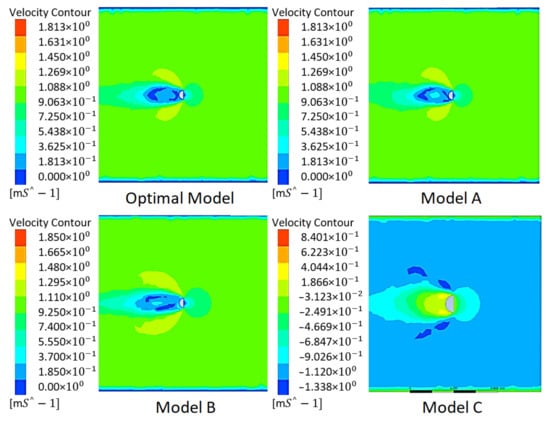
Figure 21.
Velocity Contours for the Optimal Model and Models A, B and C.
There is a common trend among the plots for all models. The lift and the side forces fluctuate between positive and negative values for all models, and this is due to the von Karman effect (Figure 19 and Figure 20). The lowest side and lift forces are observed in Model C where the flow velocity is half the optimal value and and are at their optimal value.
Negative cross-sectional area of the semi-cylinder which is affected by both and . On the other hand, the lift force is exerted on the horizontal cross-sectional area of the bluff body which is affected by variations in only. Thus, theoretically, the highest side force would be expected to be seen in Model A or Model B, while the highest lift force would be expected to be observed in Model A. The simulation results, however, are not in complete agreement with these theories.
In general, the highest lift force is observed for Model A, followed by Model B and then the Optimal Model, and the most uniform fluctuation is observed in Model A. Similarly, the highest side force is observed in Model A, followed by Model B and then the Optimal Model. These comparisons, however, are not true for all points in time.
The reason for the discrepancy between the theoretical and the simulation results is the fact that the theoretical formulae for hydrodynamic forces are independent of time. On the other hand, the simulation results shown in Figure 19 and Figure 20 are the products of transient analyses which change with time and are highly affected by the turbulence caused by vortex shedding behind and in the wake of the semi-cylinder. Changes in velocity are also observed around the semi-cylinder during vortex shedding which also causes variations in the hydrodynamic forces.
The velocity contours are shown at a specific flow time of in Figure 21. Model C shows the smallest vortices, due to its low lift and side forces. Model A, Model B and the Optimal Model show vortices similar in size.
These results may seem a bit contradictory with the numerical MATLAB optimization results. While it may seem that Model A produces the largest vibration amplitudes, this does not mean that it is the optimal model. This is because the optimal model is the one that produces the most power and not the one that has the highest vibration amplitudes. Power generation is dependent on the piezoelectricity of the setup. There exists a certain deformation of the cantilever beam, caused by the bluff body vibrations, which produces maximum output power. This deformation is not taken into consideration in the computational fluid dynamics analysis.
6. Conclusions
In this research, a power-generating system is designed. The power generation is the outcome of the deformation of a piezoelectric beam. This deformation is caused by the vibrations of a semi-cylindrical bluff body immersed in a river and exposed to water flow.
The design methodology begins by defining the modelling equations, which are functions of eleven design parameters. This mathematical model is outlined in MATLAB codes, which in turn are validated by experimental data.
An optimization study is conducted for the design parameters and the maximum harvested power is found to be around . The values of the optimal design parameters where maximum power is extracted are identified.
The key findings of this research lie in the identification of the effect of changing the design parameters on output power. The plots of the design parameters , , and versus power tend to have sharp peaks or drops around the optimal value, meaning that accuracy is required for these parameters. Other parameters such as , , , and have a smoother variation curve and a less drastic effect on power around their optimal values. fluctuates unstably throughout the variation plots. Lastly, has a lower threshold for producing power, known as the onset velocity, above which power tends to increase almost linearly, which proves that increasing this parameter is most effective in increasing output power.
In addition to the numerical simulation, a finite element analysis is carried out on the bluff body and the hydrodynamic forces and velocity profiles are observed. It is determined that the lift and side forces, and hence, the vibration amplitudes increase with increasing diameter of the bluff body, length of the bluff body and water velocity. This also translates into larger vortex size.
The future of this project lies in conducting an investigation to check the possibility of replacing the piezoelectric beam with a hybrid piezo-electromagnetic beam to produce more power. Furthermore, a real-life implementation strategy must be put in place, with a feasibility study of implementing the setup in high velocity environments (such as oceans) to produce considerably higher power outputs.
Author Contributions
Conceptualization, J.A., A.S. and C.H.; methodology A.S. and C.H.; software, C.H.; validation, C.H.; formal analysis, C.H.; investigation, J.A., A.S. and C.H.; resources, J.A., A.S. and C.H.; data curation, C.H.; writing—original draft preparation, C.H.; writing—review and editing, J.A., A.S. and C.H.; visualization, C.H.; supervision, J.A. and A.S.; project administration, J.A. All authors have read and agreed to the published version of the manuscript.
Funding
This research received no external funding.
Institutional Review Board Statement
Not applicable.
Informed Consent Statement
Not applicable.
Data Availability Statement
Not applicable.
Conflicts of Interest
The authors declare no conflict of interest.
References
- Arcadia. 15 Key Facts & Statistics about Power Plant Pollution. 2017. Available online: https://blog.arcadia.com/15-key-facts-statistics-power-plant-pollution/ (accessed on 14 October 2021).
- UCS USA. Coal and Air Pollution. 2017. Available online: https://www.ucsusa.org/resources/coal-and-air-pollution#:~:text=Air%20pollution%20from%20coal%2Dfired,environmental%20and%20public%20health%20impacts (accessed on 12 October 2021).
- The Switch. Hydropower Generation in the UK: In Depth Guide. 2020. Available online: https://theswitch.co.uk/energy/guides/renewables/hydroelectric-power (accessed on 6 June 2021).
- The Nature Conservancy. The Power of Rivers Finding Balance between Energy and Conservation in Hydropower Development. 2015. Available online: https://www.nature.org/media/freshwater/power-of-rivers-report.pdf (accessed on 6 June 2021).
- Barrero-Gil, A.; Pindado, S.; Avila, S. Extracting energy from Vortex-Induced Vibrations: A parametric study. Appl. Math. Model. 2011, 36, 3153–3160. [Google Scholar] [CrossRef]
- Harvard Natural Sciences Lecture Demonstrations. Vortex Shedding in Water. Available online: https://sciencedemonstrations.fas.harvard.edu/presentations/vortex-shedding (accessed on 6 March 2021).
- Al Jamal, H.; Dalton, C. The Contrast in Phase Angles between Forced and Self-Excited Oscillations of a Circular Cylinder. J. Fluids Struct. 2005, 20, 467–482. [Google Scholar] [CrossRef]
- Xu, W.; Qin, W.; Gao, X. Experimental Study on Streamwise Vortex-Induced Vibration of a Flexible, Slender Cylinder. Appl. Sci. 2018, 8, 311. [Google Scholar] [CrossRef]
- Leclercq, T.; De Langre, E. Vortex-induced vibrations of cylinders bent by the flow. J. Fluids Struct. 2018, 80, 77–93. [Google Scholar] [CrossRef]
- Soti, A.K.; Thompson, M.C.; Sheridan, J.; Bhardwaj, R. Electrical power generation from vortex-induced vibrations of a circular cylinder. In Proceedings of the 20th Australasian Fluid Mechanics Conference, AFMC 2016 Australasian Fluid Mechanics Society, Perth, Australia, 5–8 December 2016. [Google Scholar]
- Bernitsas, M.M.; Raghavan, K.; Ben-Simon, Y.; Garcia, E.M.H. Vortex induced vibration aquatic clean energy: A new concept in generation of clean and renewable energy from fluid flow. J. Offshore Mech. Arct. Eng. 2008, 130, 041101. [Google Scholar] [CrossRef]
- Hall-Stinson, A.; Lehrman, C.; Tripp, E. Energy Generation from Vortex Induced Vibrations. Bachelor’s Thesis, Worcester Polytechnic Institute, San Francisco, CA, USA, 2011. [Google Scholar]
- Sun, W.; Zhao, D.; Tan, T.; Yan, Z.; Guo, P.; Luo, X. Low velocity water flow energy harvesting using vortex induced vibration and galloping. Appl. Energy 2019, 251, 113392. [Google Scholar] [CrossRef]
- Qureshi, F.U.; Muhtaro, A.; Tuncay, K. Near-optimal design of scalable energy harvester for underwater pipeline monitoring applications with consideration of impact to pipeline performance. IEEE Sens. J. 2017, 17, 1981–1991. [Google Scholar] [CrossRef]
- The Green Age. Piezoelectric Materials. 2020. Available online: https://www.thegreenage.co.uk/tech/piezoelectric-materials/ (accessed on 10 June 2021).
- Woodford, C. Piezoelectricity. 2019. Available online: https://www.explainthatstuff.com/piezoelectricity.html (accessed on 12 May 2021).
- Yang, Z.; Zhou, S.; Zu, J.; Inman, D. High-Performance Piezoelectric Energy Harvesters and Their Applications. Joule 2018, 2, 642–697. [Google Scholar] [CrossRef]
- Roundy, S.; Wright, P.K. A piezoelectric vibration based generator for wireless electronics. Smart Mater. Struct. 2004, 13, 1131–1142. [Google Scholar] [CrossRef]
- Yang, Y.; Tang, L.; Li, H. Vibration energy harvesting using macro-fiber composites. Smart Mater. Struct. 2009, 18, 115025. [Google Scholar] [CrossRef]
- Shan, X.; Song, R.; Liu, B.; Xie, T. Novel energy harvesting: A macro fiber composite piezoelectric energy harvester in the water vortex. Ceram. Int. 2015, 41, S763–S767. [Google Scholar] [CrossRef]
- Mokhtari, F.; Latifi, M.; Shamshirsaz, M.; Khelghatdoost, M.; Rahmani, S. Modeling of electrospun PVDF/LiCl nanogenerator by the energy approach method: Determining piezoelectric constant. J. Text. Inst. 2017, 108, 1917–1925. [Google Scholar] [CrossRef]
- Javed, U.; Abdelkefi, A. Role of the galloping force and moment of inertia of inclined square cylinders on the performance of hybrid galloping energy harvesters. Appl. Energy 2018, 231, 259–276. [Google Scholar] [CrossRef]
- Sun, H.; Bernitsas, M.M. Bio-Inspired adaptive damping in hydrokinetic energy harnessing using flow-induced oscillations. Energy 2019, 176, 940–960. [Google Scholar] [CrossRef]
- Zhang, L.; Meng, B.; Xia, Y.; Deng, Z.; Dai, H.; Hagedorn, P.; Peng, Z.; Wang, L. Galloping triboelectric nanogenerator for energy harvesting under low wind speed. Nano Energy 2020, 70, 104477. [Google Scholar] [CrossRef]
- Zhu, H.; Zhao, Y.; Zhou, T. CFD analysis of energy harvesting from flow induced vibration of a circular cylinder with an attached free-to-rotate pentagram impeller. Appl. Energy 2018, 212, 304–321. [Google Scholar] [CrossRef]
- Zhu, H.; Tan, X.; Gao, Y.; Zhou, T.; Liu, W. Two-degree-of-freedom flow-induced vibration of two rigidly coupled tandem cylinders of unequal diameters. Ocean Eng. 2020, 216, 108142. [Google Scholar] [CrossRef]
- Hu, G.; Wang, J.; Su, Z.; Li, G.; Peng, H.; Kwok, K.C.S. Performance evaluation of twin piezoelectric wind energy harvesters under mutual interference. Appl. Phys. Lett. 2019, 115, 073901. [Google Scholar] [CrossRef]
- Shan, X.; Li, H.; Yang, Y.; Feng, J.; Wang, Y.; Xie, T. Enhancing the performance of an underwater piezoelectric energy harvester based on flow-induced vibration. Energy 2019, 172, 134–140. [Google Scholar] [CrossRef]
- Song, R.; Shan, X.; Lv, F.; Li, J.; Xie, T. A Novel Piezoelectric Energy Harvester Using the Macro Fiber Composite Cantilever with a Bicylinder in Water. Appl. Sci. 2015, 5, 1942–1954. [Google Scholar] [CrossRef]
- Wang, J.; Hu, G.; Su, Z.; Li, G.; Zhao, W.; Tang, L.; Zhao, L. A cross-coupled dual-beam for multi-directional energy harvesting from vortex induced vibrations. Smart Mater. Struct. 2019, 28, 12LT02. [Google Scholar] [CrossRef]
- Zhao, L.; Yang, Y. Enhanced aeroelastic energy harvesting with a beam stiffener. Smart Mater. Struct. 2015, 24. [Google Scholar] [CrossRef]
- Vocca, H.; Neri, I.; Travasso, F.; Gammaitoni, L. Kinetic energy harvesting with bistable oscillators. Appl. Energy 2012, 97, 771–776. [Google Scholar] [CrossRef]
- Zhang, L.; Abdelkefi, A.; Dai, H.; Naseer, R.; Wang, L. Design and experimental analysis of broadband energy harvesting from vortex-induced vibrations. J. Sound Vib. 2017, 408, 210–219. [Google Scholar] [CrossRef]
- Pan, D.; Ma, B.; Dai, F. Experimental investigation of broadband energy harvesting of a bi-stable composite piezoelectric plate. Smart Mater. Struct. 2017, 26, 035045. [Google Scholar] [CrossRef]
- Dai, H.L.; Abdelkefi, A.; Yang, Y.; Wang, L. Orientation of bluff body for designing efficient energy harvesters from vortex-induced vibrations. Appl. Phys. Lett. 2016, 108, 053902. [Google Scholar] [CrossRef]
- Shahruz, S. Design of mechanical band-pass filters for energy scavenging. J. Sound Vib. 2006, 292, 987–998. [Google Scholar] [CrossRef]
- Shahruz, S. Limits of performance of mechanical band-pass filters used in energy scavenging. J. Sound Vib. 2006, 293, 449–461. [Google Scholar] [CrossRef]
- Lai, Z.; Wang, S.; Zhu, L.; Zhang, G.; Wang, J.; Yang, K.; Yurchenko, D. A hybrid piezo-dielectric wind energy harvester for high-performance vortex-induced vibration energy harvesting. Mech. Syst. Signal Process. 2020, 150, 107212. [Google Scholar] [CrossRef]
- Bakhshandeh, A.; Rostami, M.; Armandei, M. Renewable energy harvesting by vortex-induced motions: Review and benchmarking of technologies. Renew. Sustain. Energy Rev. 2017, 70, 193–214. [Google Scholar]
- Moon, K.; Choe, J.; Kim, H.; Ahn, D.; Jeong, J. A method of broadening the bandwidth by tuning the proof mass in a piezoelectric energy harvesting cantilever. Sens. Actuators A Phys. 2018, 276, 17–25. [Google Scholar] [CrossRef]
- Zhu, H.J.; Wang, K.N. Wake adjustment and vortex-induced vibration of a circular cylinder with a C-shaped plate at a low Reynolds number of 100. Phys. Fluids 2019, 31, 103602. [Google Scholar]
- Abdelkefi, A.; Scanlon, J.M.; McDowell, E.; Hajj, M.R. Performance enhancement of piezoelectric energy harvesters from wake galloping. Appl. Phys. Lett. 2013, 103, 033903. [Google Scholar] [CrossRef]
- Blackburn, H.M.; Govardhan, R.N.; Williamson, C.H.K. A complementary numerical and physical investigation of vortex-induced vibration. J. Fluids Struct. 2001, 15, 481–488. [Google Scholar] [CrossRef]
- Sarpkaya, T. A critical review of the intrinsic nature of vortex-induced vibrations. J. Fluids Struct. 2004, 19, 389–447. [Google Scholar] [CrossRef]
- Williamson, C.H.K.; Govardhan, R. Vortex-induced vibrations. Annu. Rev. Fluids Mech. 2004, 36, 413–455. [Google Scholar] [CrossRef]
- Bearman, P.W. Circular cylinder wakes and vortex-induced vibrations. J. Fluids Struct. 2011, 27, 648–658. [Google Scholar] [CrossRef]
- Wu, X.; Ge, F.; Hong, Y. A review of recent studies on vortex-induced vibrations of long slender cylinders. J. Fluids Struct. 2012, 28, 292–308. [Google Scholar] [CrossRef]
- Lian, J.; Yan, X.; Liu, F.; Zhang, J. Analysis on Flow Induced Motion of Cylinders with Different Cross Sections and the Potential Capacity of Energy Transference from the Flow. Shock. Vib. 2017, 2017, 1–19. [Google Scholar] [CrossRef]
- Zhang, B.; Song, B.; Mao, Z.; Tian, W.; Li, B. Numerical investigation on VIV energy harvesting of bluff bodies with different cross sections in tandem arrangement. Energy 2017, 133, 723–736. [Google Scholar] [CrossRef]
- Ewere, F.; Wang, G.; Cain, B. Experimental investigation of galloping piezoelectric energy harvesters with square bluff bodies. Smart Mater. Struct. 2014, 23, 104012. [Google Scholar] [CrossRef]
- Zhang, M.; Zhao, G.; Wang, J. Study on Fluid-Induced Vibration Power Harvesting of Square Columns under Different Attack Angles. Geofluids 2017, 2017, 6439401. [Google Scholar] [CrossRef]
- Wang, J.; Tang, L.; Zhao, L.; Zhang, Z. Efficiency investigation on energy harvesting from airflows in HVAC system based on galloping of isosceles triangle sectioned bluff bodies. Energy 2019, 172, 1066–1078. [Google Scholar] [CrossRef]
- Zhu, H.; Tang, T.; Zhou, T.; Liu, H.; Zhong, J. Flow structures around trapezoidal cylinders and their hydrodynamic characteristics: Effects of the base length ratio and attack angle. Phys. Fluids 2020, 32, 103606. [Google Scholar] [CrossRef]
- Sirohi, J.; Mahadik, R. Harvesting Wind Energy Using a Galloping Piezoelectric Beam. J. Vib. Acoust. 2011, 134, 011009. [Google Scholar] [CrossRef]
- Liu, F.-R.; Zou, H.-X.; Zhang, W.-M.; Peng, Z.-K.; Meng, G. Y-type three-blade bluff body for wind energy harvesting. Appl. Phys. Lett. 2018, 112, 233903. [Google Scholar] [CrossRef]
- Liu, F.-R.; Zhang, W.-M.; Peng, Z.-K.; Meng, G. Fork-shaped bluff body for enhancing the performance of galloping-based wind energy harvester. Energy 2019, 183, 92–105. [Google Scholar] [CrossRef]
- Ewere, F.; Wang, G.; Frendi, A. Experimental Investigation of a Bioinspired Bluff-Body Effect on Galloping Piezoelectric Energy-Harvester Performance. AIAA J. 2018, 56, 1284–1287. [Google Scholar] [CrossRef]
- Kluger, J.; Moon, F.; Rand, R. Shape optimization of a blunt body Vibro-wind galloping oscillator. J. Fluids Struct. 2013, 40, 185–200. [Google Scholar] [CrossRef]
- Yang, Y.W.; Zhao, L.Y.; Tang, L.H. Comparative study of tip cross-sections for efficient galloping energy Shock and Vibration 17 harvesting. Appl. Phys. Lett. 2013, 102, 064105. [Google Scholar] [CrossRef]
- Amandolese, X.; Hemon, P. Vortex-induced vibration of a square cylinder in wind tunnel. Comptes Rendus Mécanique 2010, 338, 12–17. [Google Scholar] [CrossRef]
- Iungo, G.V.; Buresti, G. Experimental investigation on the aerodynamic loads and wake flow features of low aspect-ratio triangular prisms at different wind directions. J. Fluids Struct. 2009, 25, 1119–1135. [Google Scholar] [CrossRef]
- Sunden, B. A-to-Z Guide to Thermodynamics; Oxford University Press: Oxford, UK, 1998. [Google Scholar]
- Farshidianfar, A.; Dolatabadi, N. Modified higher-order wake oscillator model for vortex-induced vibration of circular cylinders. Acta Mech. 2013, 224, 1441–1456. [Google Scholar] [CrossRef]
- Diltz, N.; Gagnon, J.; O’Connor, J.; Wedell, J. Vortex Induced Vibration Energy Harvesting through Piezoelectric Transducers. Bachelor’s Thesis, Worcester Polytechnic Institute, San Francisco, CA, USA, 2017. [Google Scholar]
- Erturk, A. Electromechanical Modeling of Piezoelectric Energy Harvesters. Ph.D. Thesis, Virginia Polytechnic Institute and State University, Blacksburg, VA, USA, 2009. [Google Scholar]
Publisher’s Note: MDPI stays neutral with regard to jurisdictional claims in published maps and institutional affiliations. |
© 2021 by the authors. Licensee MDPI, Basel, Switzerland. This article is an open access article distributed under the terms and conditions of the Creative Commons Attribution (CC BY) license (https://creativecommons.org/licenses/by/4.0/).

