
Poland as the EU Leader in Terms of Photovoltaic Market Growth Dynamics—Behind the Scenes


Abstract
:1. Introduction
- (1)
- What is the impetus for such a sudden shift towards solar energy?
- (2)
- Which regions/voivodeships in Poland have the greatest potential and do they use it?
- (3)
- What is going on behind the scenes when individual buyers decide to buy solar PV installations?
2. Climate Crisis and Solar Energy
- Reduction of at least 40% of greenhouse gas emissions (compared to 1990 levels)
- Increase in the share of energy from renewable sources in total energy consumption to a minimum of 32%
- Increase in energy efficiency by at least 32.5%.
Photovoltaics in Poland
- (1)
- The members of the European Union are obliged to ensure a specific share of energy from renewable sources in the final gross energy consumption. The legal basis for Poland’s obligations regarding the share of energy from renewable energy sources is Renewable Energy Directive II of 2018 [58] on the promotion of the use of energy from renewable sources. As a result of the European climate policy, the draft of the Polish Energy Policy to 2040 had to be focused on renewable sources. According to the resolution adopted by the government on 2 February 2021, 1/3 of the total energy generated in Poland should be produced from renewable sources, including photovoltaics [59].
- (2)
- Numerous support programs available in Poland were an important motivating factor, especially for individual audiences, to invest in Photovoltaics. These have included My Electricity (My Current), Clean Air (Czyste Air), Energy Plus (Energia Plus), Prosumer (Prosument), or Agroenergia. Poland, under the Partnership Agreement, negotiated a total of EUR 170 billion in the European Union for the years 2021–2027. The amount of funds from which the Polish energy sector, including photovoltaic sources, may potentially benefit from the Cohesion Fund and the Just Transition Fund, is EUR 76 billion [60].
- (3)
- According to Lazard’s Levelized Cost of Energy Analysis (2019), in the last 10 years the Levelized Cost of Electricity (LCOE), which includes the construction, operation, and maintenance of a power plant during a period specified for the given technology, decreased for photovoltaics by 90% [61].
- (4)
- There has been continuous increase in energy prices, and with reference to global oil prices in Poland in December 2020 the price of electricity was 0.192 U.S. Dollars per kWh for households and 0.144 U.S. Dollars for businesses which includes all components of the electricity bill such as the cost of power, distribution, and taxes. In comparison, the average price of electricity in the world for that period is 0.137 U.S. Dollars per kWh for households and 0.122 U.S. Dollars for businesses [62]. Considering the high prices of electricity and the forecast continuous increase in energy prices, in particular for the consumer sector on the most expensive C tariff, this is a very attractive investment market. According to the Central Statistical Office, in 2020 the electricity bills of households increased by 11.7% year to year [63].
3. Materials and Methods
- (1)
- Infrastructure:
- (a)
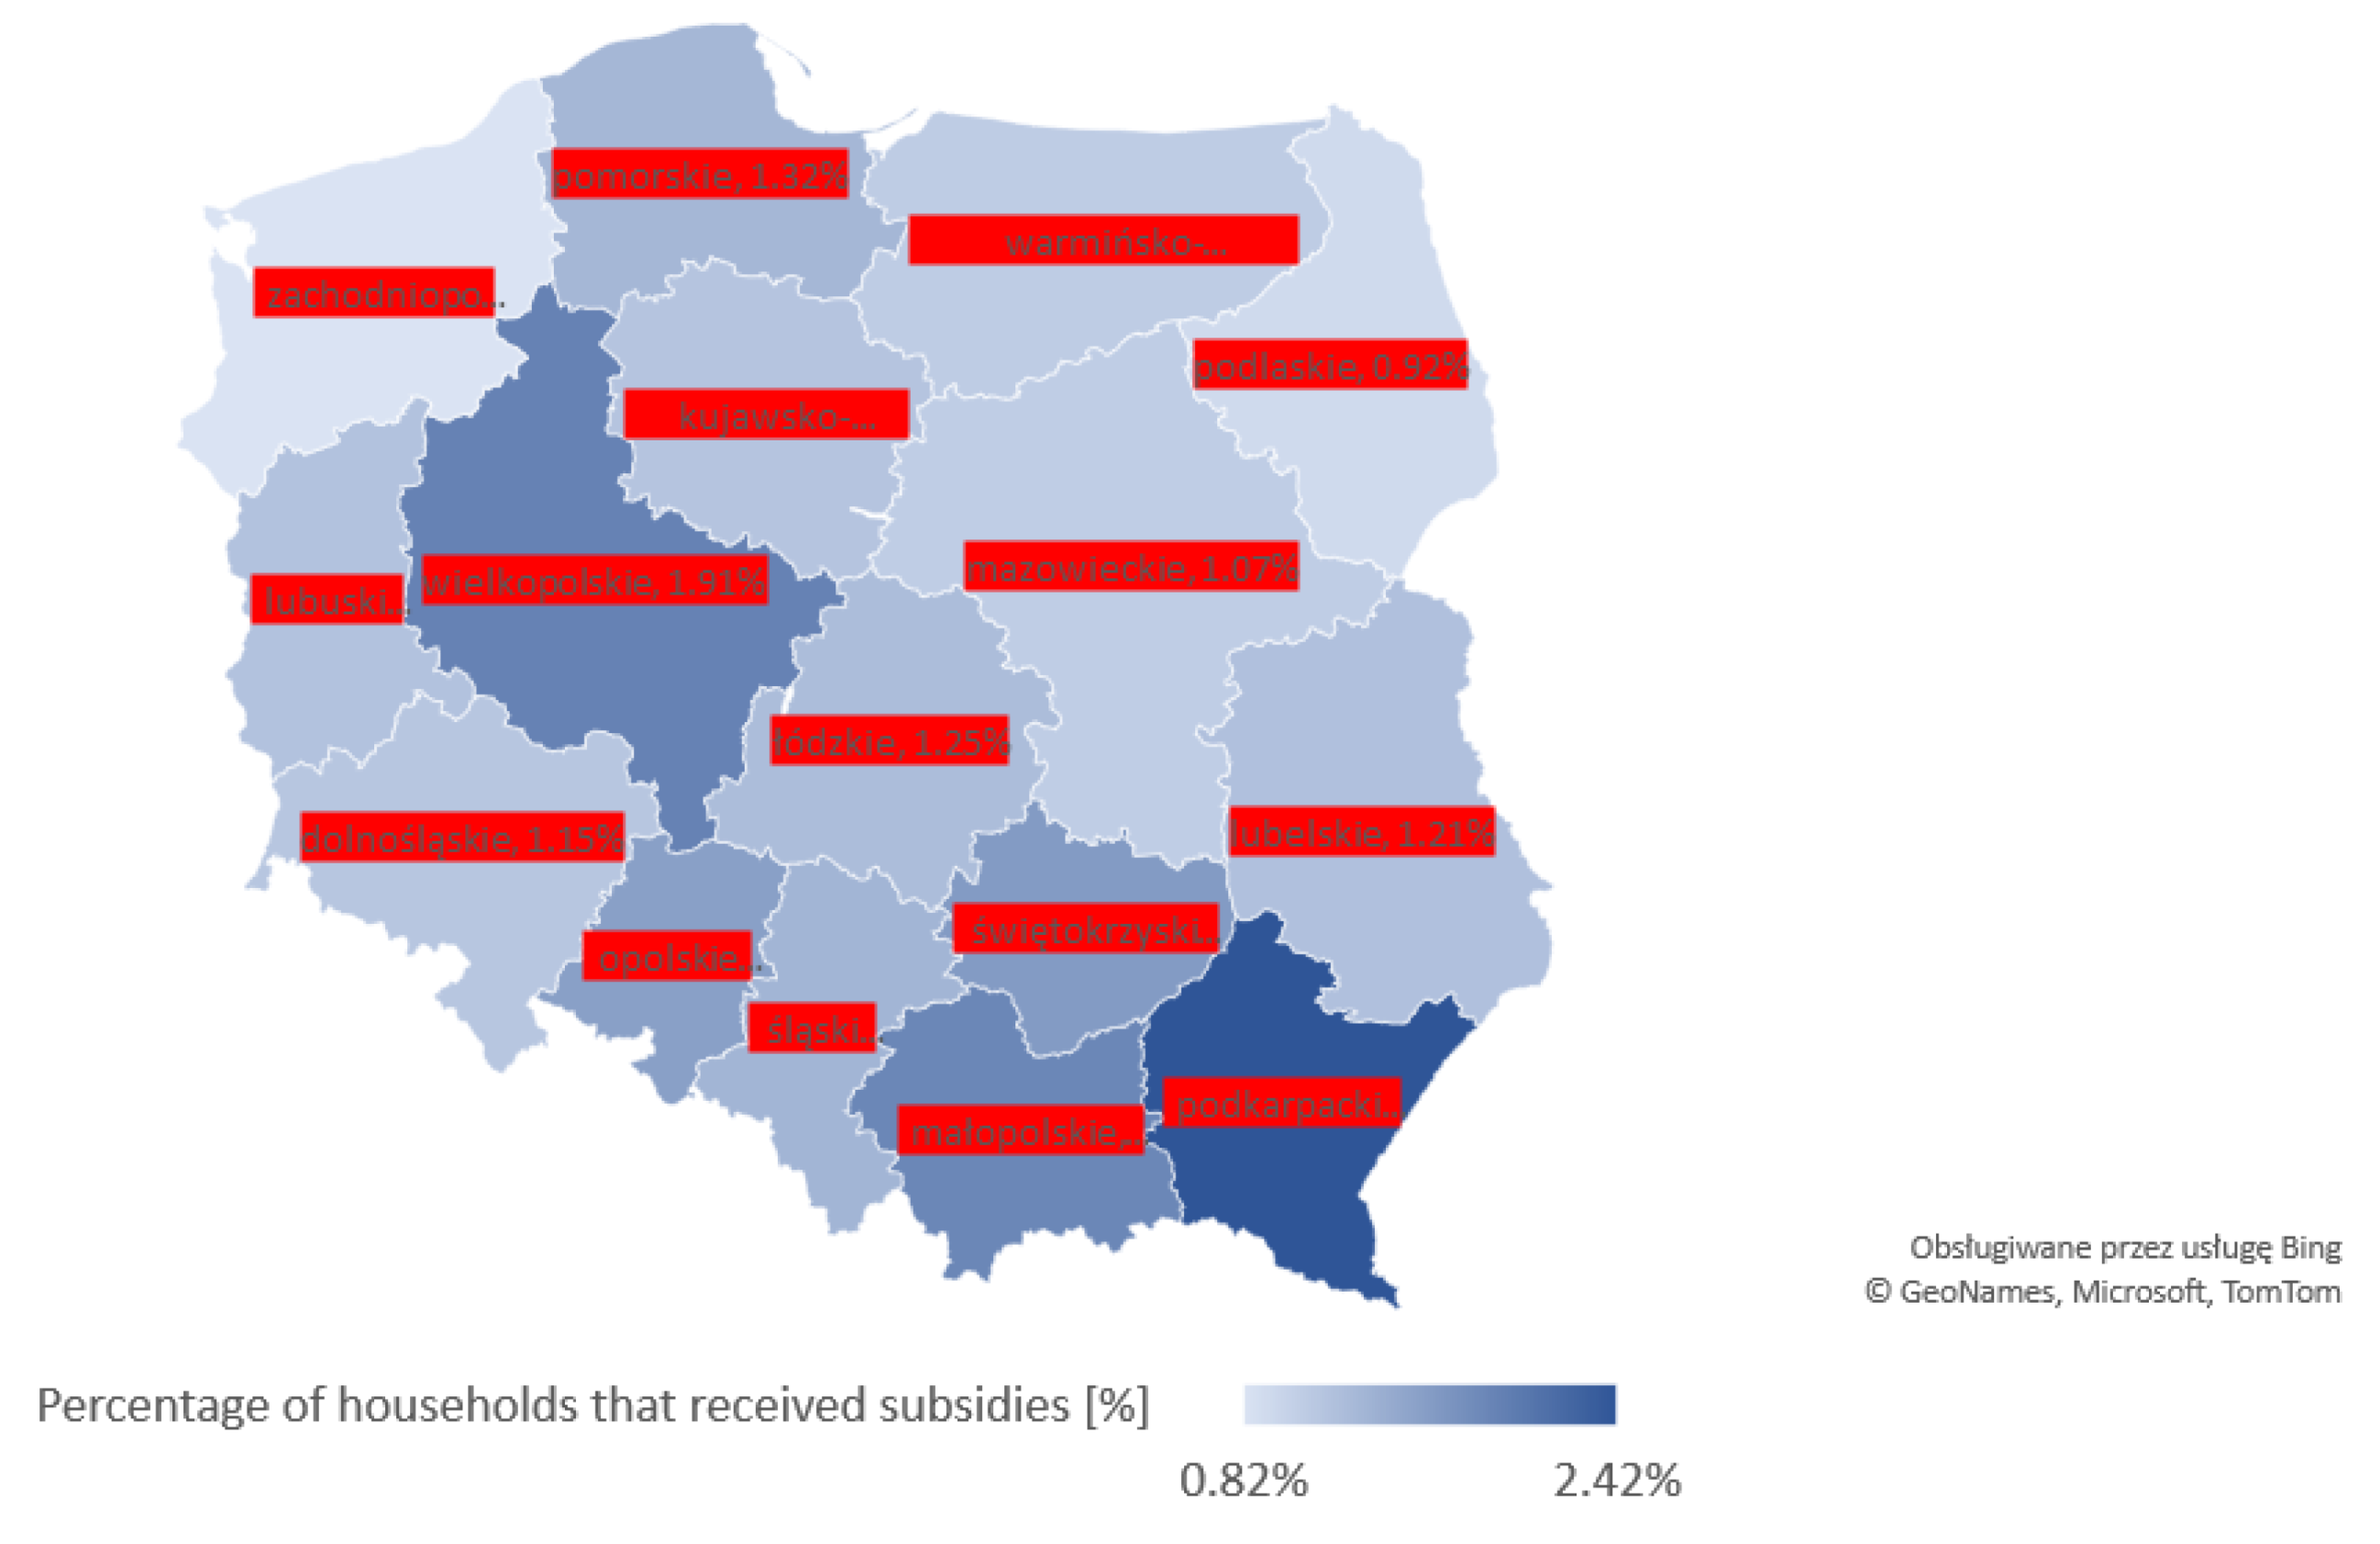
- the percentage of households that received subsidies
- (b)
- allocation of money for programs in individual voivodeships
- (c)
- available connection capacity [MW]
- (d)
- electricity consumption in (kWh) per capita.
- (2)
- Location:
- (a)
- total sunny hours per year
- (b)
- the average annual concentration of PM10.
- (3)
- Consumer profile:
- (a)
- gender
- (b)
- average life expectancy
- (c)
- place of residence: village, city
- (d)
- work: average monthly gross salary, number of employed persons, number of old-age and disability pensioners, unemployment rate
- (e)
- education: percentage of people with higher education,
- (f)
- family: number of marriages, number of divorces, natural increase.
4. Results
- (1)
- Are they people with higher education?
- (2)
- Are they low-carbon economy promoters?
- (3)
- Are they the inhabitants of the most polluted regions in Poland?
- (4)
- Are they low-income citizens from areas with high unemployment rates or low-income retirees and pensioners who are terrified by rising electricity prices?
- (5)
- Are they owners of the farms that consume the most electricity?
- (6)
- Are they inhabitants of areas with the highest number of sunny hours a year use this potential?
4.1. Infrastructure
4.2. Location
4.3. Consumer Profile
5. Discussion and Conclusions
- (1)
- What is the impetus for such a sudden shift towards solar energy?
- (2)
- Which regions/voivodeships in Poland have the greatest potential and do they use it?
- (3)
- What is going on behind the scenes when individual buyers decide to buy solar PV installations?
Author Contributions
Funding
Institutional Review Board Statement
Informed Consent Statement
Data Availability Statement
Conflicts of Interest
Appendix A

| Voivodeship | Seat of the Authorities | Electricity Consumption in (kWh) per Capita in 2019 | Allocation for Programs in Individual Voivodeships [mln PLN] | Available Connection Capacity [MW] | Percentage of Households That Received Subsidies [%] |
|---|---|---|---|---|---|
| podkarpackie | Rzeszów | 836.7 | 1661 | 190 | 2.42% |
| wielkopolskie | Poznań | 748.1 | 1070 | 2067 | 1.91% |
| małopolskie | Kraków | 781.3 | 1541 | 695 | 1.86% |
| świętokrzyskie | Kielce | 784.5 | 1106 | 115 | 1.63% |
| opolskie | Opole | 593.5 | 763 | 290 | 1.58% |
| śląskie | Katowice | 829.8 | 2365 | 1185 | 1.34% |
| pomorskie | Gdańsk | 839.4 | 1129 | 594 | 1.32% |
| łódzkie | Łódź | 815.2 | 1631 | 435 | 1.25% |
| lubelskie | Lublin | 722 | 1768 | 155 | 1.21% |
| lubuskie | Zielona Góra | 641.9 | 736 | 804 | 1.19% |
| kujawsko-pomorskie | Toruń | 823.9 | 1475 | 1456 | 1.17% |
| dolnośląskie | Wrocław | 739.5 | 870 | 975 | 1.15% |
| warmińsko-mazurskie | Olsztyn | 685.9 | 1228 | 110 | 1.08% |
| mazowieckie | Warszawa | 795.1 | 1670 | 415 | 1.07% |
| podlaskie | Białystok | 932.5 | 992 | 35 | 0.92% |
| zachodniopomorskie | Szczecin | 818.4 | 1311 | 743 | 0.82% |
Appendix B
| Voivodeship | Seat of the Authorities | Total Hours of Sunshine per Year | Voivodeship Area [km2] | Forests Area [%] | Annual Average Concentration of PM10 WHO Recommended Level = 20 | Percentage of Households That Received Fundin |
|---|---|---|---|---|---|---|
| podkarpackie | Rzeszów | 1734.60 | 17,845.76 | 0.382 | 34.9 | 0.0242 |
| wielkopolskie | Poznań | 1860.80 | 29,826.50 | 0.258 | 40.3 | 0.0191 |
| małopolskie | Kraków | 2492.26 | 15,182.79 | 0.287 | 56.7 | 0.0186 |
| opolskie | Opole | 2570.58 | 9411.87 | 0.267 | 36.9 | 0.0158 |
| świętokrzyskie | Kielce | 2446.67 | 11,710.50 | 0.283 | 34.6 | 0.0163 |
| lubuskie | Zielona Góra | 2524.00 | 13,987.93 | 0.493 | 32.4 | 0.0119 |
| dolnośląskie | Wrocław | 2161.90 | 19,946.70 | 0.298 | 45.5 | 0.0117 |
| pomorskie | Gdańsk | 2070.10 | 18,323.68 | 0.364 | 42.4 | 0.0132 |
| mazowieckie | Warszawa | 1599.30 | 35,558.47 | 0.235 | 41.0 | 0.0107 |
| kujawsko-pomorskie | Toruń | 2458.44 | 17,971.34 | 0.235 | 40.4 | 0.0125 |
| łódzkie | Łódź | 2038.30 | 18,218.95 | 0.215 | 34.6 | 0.0121 |
| lubelskie | Lublin | 2443.20 | 25,122.46 | 0.233 | 32.3 | 0.0119 |
| warmińsko-mazurskie | Olsztyn | 2316.19 | 24,173.47 | 0.317 | 31.7 | 0.0108 |
| podlaskie | Białystok | 2048.90 | 20,187.02 | 0.309 | 27.6 | 0.0092 |
| zachodniopomorskie | Szczecin | 1734.70 | 22,904.72 | 0.357 | 27.0 | 0.0082 |
| śląskie | Katowice | 2500.41 | 12,333.09 | 0.321 | 47.2 | 0.0134 |
Appendix C
| Voivodeship | Men | Women | Population Density per km2 | Cities | Urban Municipalities | Rural Municipalities | Urban-Rural Municipalities | Unemployment Rate 01/2021 | Percentage of Population with Higher Education% | Percentage of Pensioners and Retirees in the Voivodeship | Number of Marriages Contracted in 2020 | Number of Divorces in 2020 | Number of Births per 1000 Citizens | Average Life Expectancy Men 30 Years Old | Average Life Expectancy Men 45 Years Old | Average Life Expectancy Men 60 Years Old | Average Life Expectancy Women 30 Years Old | Average Life Expectancy Women 45 Years Old | Average Life Expectancy Women 60 Years Old | Average Monthly Gross Remuneration in PLN | Number of People Working in Thousands | Percentage of Households That Received SubsiDies |
|---|---|---|---|---|---|---|---|---|---|---|---|---|---|---|---|---|---|---|---|---|---|---|
| Podkarpackie | 1,038,436.00 | 1,087,465.00 | 119.13 | 51.00 | 16.00 | 109.00 | 35.00 | 0.094 | 26.20 | 21.91 | 7912.00 | 2024.00 | −2.10 | 46.30 | 32.40 | 20.10 | 53.80 | 39.10 | 25.10 | 4224.70 | 741,000.00 | 0.0242 |
| Małopolskie | 1,654,947.00 | 1,758,984.00 | 224.86 | 62.00 | 14.00 | 120.00 | 48.00 | 0.056 | 29.70 | 21.79 | 14,463.00 | 3833.00 | −1.00 | 46.20 | 32.20 | 19.90 | 53.10 | 38.50 | 24.70 | 4808.56 | 1,080,000.00 | 0.0191 |
| Opolskie | 472,035.00 | 508,736.00 | 104.21 | 36.00 | 3.00 | 35.00 | 33.00 | 0.072 | 24.10 | 21.42 | 3326.00 | 1089.00 | −4.90 | 45.70 | 31.80 | 19.30 | 52.60 | 38.00 | 24.20 | 4476.84 | 336,000.00 | 0.0186 |
| Świętokrzyskie | 596,713.00 | 633,331.00 | 105.03 | 44.00 | 5.00 | 58.00 | 39.00 | 0.089 | 27.80 | 25.41 | 4183.00 | 1367.00 | −6.40 | 44.60 | 30.90 | 19.10 | 52.80 | 38.20 | 24.50 | 4259.60 | 433,000.00 | 0.0158 |
| Wielkopolskie | 1,700,403.00 | 1,799,958.00 | 117.36 | 113.00 | 19.00 | 113.00 | 94.00 | 0.039 | 25.70 | 22.52 | 14,017.00 | 4108.00 | −1.20 | 45.30 | 31.30 | 19.10 | 52.10 | 37.60 | 24.00 | 4499.63 | 1,248,000.00 | 0.0163 |
| Śląskie | 2,163,440 | 2,344,638 | 365.53 | 71 | 49 | 96 | 22 | 0.051 | 27.30 | 26.27736255 | 16529 | 6114 | −4.9 | 44.9 | 31.1 | 19.1 | 51.5 | 37 | 23.6 | 4922.79 | 1,692,000 | 0.0119 |
| Kujawsko-pomorskie | 999,050 | 1,070,223 | 115.14 | 52 | 17 | 92 | 35 | 0.093 | 23.60 | 23.30886258 | 7681 | 3416 | −3.6 | 44.9 | 31.1 | 19 | 51.8 | 37.2 | 23.7 | 4301.08 | 602,000 | 0.0117 |
| Lubelskie | 1,015,218 | 1,088,124 | 83.72 | 48 | 20 | 165 | 28 | 0.085 | 29.40 | 24.90750434 | 7886 | 2662 | −4.4 | 45 | 31.3 | 19.3 | 53.1 | 38.5 | 24.8 | 4358.82 | 705,000 | 0.0132 |
| Lubuskie | 489,806 | 520,371 | 72.22 | 43 | 9 | 39 | 34 | 0.065 | 24.00 | 22.40765727 | 3511 | 1145 | −4 | 44 | 30.2 | 18.4 | 51.6 | 37 | 23.6 | 4333.15 | 304,000 | 0.0107 |
| Łódzkie | 1,161,475 | 1,287,238 | 134.4 | 46 | 18 | 131 | 28 | 0.064 | 26.80 | 25.94232154 | 8755 | 3123 | −6.1 | 43.6 | 30.2 | 18.6 | 51.6 | 37.2 | 23.8 | 4549 | 844,000 | 0.0125 |
| Mazowieckie | 2,595,672 | 2,832,359 | 152.65 | 89 | 35 | 225 | 54 | 0.053 | 38.60 | 21.90689405 | 21,179 | 8087 | −2 | 45.3 | 31.5 | 19.5 | 52.7 | 38.1 | 24.5 | 5942.59 | 1,611,000 | 0.0121 |
| Dolnośląskie | 1,389,444 | 1,509,081 | 145.31 | 91 | 35 | 78 | 56 | 0.058 | 32.40 | 23.39903917 | 10,816 | 4995 | −4.1 | 44.7 | 30.8 | 19 | 52 | 37.5 | 24.1 | 5040.29 | 937,000 | 0.0119 |
| Podlaskie | 571,499 | 605,077 | 58.28 | 40 | 13 | 78 | 27 | 0.081 | 27.80 | 23.00998831 | 4442 | 1400 | −3.5 | 45.4 | 31.7 | 19.6 | 53.6 | 39.1 | 25.3 | 4367.14 | 355,000 | 0.0108 |
| Pomorskie | 1,141,741 | 1,204,976 | 128.07 | 42 | 22 | 81 | 20 | 0.062 | 30.20 | 20.30457869 | 9430 | 2924 | −0.5 | 45.8 | 31.8 | 19.6 | 52.4 | 37.8 | 24.2 | 4838.67 | 840,000 | 0.0092 |
| Warmińsko-mazurskie | 692,514 | 728,000 | 58.76 | 50 | 16 | 66 | 34 | 0.106 | 20.70 | 21.56423661 | 4767 | 1884 | −3.3 | 44.2 | 30.5 | 18.6 | 51.8 | 37.2 | 23.8 | 4136.26 | 481,000 | 0.0082 |
| Zachodniopomorskie | 819,848 | 873,371 | 73.92 | 66 | 11 | 47 | 55 | 0.087 | 25.80 | 22.31849513 | 6148 | 2385 | −4.3 | 44.7 | 30.9 | 19 | 51.8 | 37.3 | 23.9 | 4479.46 | 504,000 | 0.0134 |
References
- Institute of Renewable Energy. Available online: https://www.ieo.pl/pl/aktualnosci/1466-europejski-przemysl-fotowoltaiczny-chce-wsparcia-w-ramach-europejskiego-zielonego-ladu (accessed on 14 August 2021).
- IPVF. Solare Europe Now. Available online: https://ipvf.fr/wp-content/uploads/2020/09/IPVF_SOLAR_EU_200911.pdf (accessed on 23 June 2021).
- Brauers, H.; Oei, P.Y. The political economy of coal in Poland: Drivers and barriers for a shift away from fossil fuels. Energy Policy 2020, 144, 111621. [Google Scholar] [CrossRef]
- Simon, F. Six EU Countries Join Call for 100% Renewable Energy Scenario. Available online: https://www.euractiv.com/section/energy/news/six-eu-countries-join-call-for-100-renewable-energy-scenario/ (accessed on 10 October 2021).
- Pietruszko, M. Introduction of photovoltaics in Poland. In Sixteenth European Photovoltaic Solar Energy Conference; Routledge: Abingdon-on-Thames, UK, 2020; pp. 2963–2966. [Google Scholar]
- Marinescu, N. Changes in Renewable Energy Policy and Their Implications: The Case of Romanian Producers. Energies 2020, 13, 6493. [Google Scholar] [CrossRef]
- Ferroni, F.; Hopkirk, R.J. Energy Return on Energy Invested (ERoEI) for photovoltaic solar systems in regions of moderate insolation. Energy Policy 2016, 94, 336–344. [Google Scholar] [CrossRef] [Green Version]
- Mardani, A.; Streimikiene, D.; Nilashi, M.; Arias Aranda, D.; Loganathan, N.; Jusoh, A. Energy consumption, economic growth, and CO2 emissions in G20 countries: Application of adaptive neuro-fuzzy inference system. Energies 2018, 11, 2771. [Google Scholar] [CrossRef] [Green Version]
- Kakaras, E.; Koumanakos, A.K.; Doukelis, A. Pressurized fluidized bed combustion (PFBC) combined cycle systems. In Combined Cycle Systems for Near-Zero Emission Power Generation; Elsevier: Amsterdam, The Netherlands, 2012. [Google Scholar]
- Knutel, B.; Pierzyńska, A.; Dębowski, M.; Bukowski, P.; Dyjakon, A. Assessment of Energy Storage from Photovoltaic Installations in Poland Using Batteries or Hydrogen. Energies 2020, 13, 4023. [Google Scholar] [CrossRef]
- Mondal, P.; Yadav, A. An overview on different methods of Domestic Waste Management and Energy generation in India. In Proceedings of the 2018 International Conference on Smart City and Emerging Technology (ICSCET), Mumbai, India, 5 January 2018; pp. 1–5. [Google Scholar]
- López-Menéndez, A.J.; Pérez, R.; Moreno, B. Environmental costs and renewable energy: Re-visiting the Environmental Kuznets Curve. J. Environ. Manag. 2014, 145, 368–373. [Google Scholar] [CrossRef] [PubMed]
- Eurostat, Renewable Energy Statistics. Available online: https://ec.europa.eu/eurostat/statistics-explained/index.php?title=Renewable_energy_statistics#Wind_and_water_provide_most_renewable_electricity.3B_solar_is_the_fastest-growing_energy_source (accessed on 10 October 2021).
- Ge, M.; Friedrich, J.; Vigna, L. 4 Charts Explain Greenhouse Gas Emissions by Countries and Sectors. 6 February 2020. Available online: https://www.wri.org/insights/4-charts-explain-greenhouse-gas-emissions-countries-and-sectors (accessed on 10 October 2021).
- Weißbach, D.; Ruprecht, G.; Huke, A.; Czerski, K.; Gottlieb, S.; Hussein, A. Energy intensities, EROIs (energy returned on invested), and energy payback times of electricity generating power plants. Energy 2013, 52, 210–221. [Google Scholar] [CrossRef]
- Standar, A.; Kozera, A.; Satoła, Ł. The Importance of Local Investments Co-Financed by the European Union in the Field of Renewable Energy Sources in Rural Areas of Poland. Energies 2021, 14, 450. [Google Scholar] [CrossRef]
- COP25 Summary Report. Available online: https://www.ieta.org/resources/Documents/IETA-COP25-Report_2019.pdf (accessed on 10 April 2020).
- European Commission. Available online: https://ec.europa.eu/info/strategy/priorities-2019-2024/european-green-deal_en (accessed on 17 June 2021).
- European Commission. Available online: https://ec.europa.eu/regional_policy/en/newsroom/news/2020/01/14-01-2020-financing-the-green-transition-the-european-green-deal-investment-plan-and-just-transition-mechanism (accessed on 10 June 2021).
- UNFCCC. Kyoto Protocol Reference Manual on Accounting of Emissions and Assigned Amount United Nations Framework Convention on Climate Change. 2008. Available online: http://unfccc.int/kyoto_protocol/items/3145.php (accessed on 13 September 2021).
- Vavrek, R.; Chovancová, J. Energy Performance of the European Union Countries in Terms of Reaching the European Energy Union Objectives. Energies 2020, 13, 5317. [Google Scholar] [CrossRef]
- EU COM. Communication from the Commission to the European Parliament, the Council, the European Economic and Social Committee and the Committee of the Regions A Roadmap for Moving to a Competitive Low Carbon Economy in 2050; European Commission (EU COM): Brussels, Belgium, 2011.
- Klepacka, A. Significance of renewable energy sources in sustainable development. Ann. Pol. Assoc. Agric. Agribus. Econ. 2019, 21, 55–64. [Google Scholar] [CrossRef]
- European Commission. Proposal for a Regulation of the European Parliament and of the Council on the Governance of the Energy Union, Amending Directive 94/22/EC, Directive 98/70/EC, Directive 2009/31/EC, Regulation (EC) No 663/2009, Regulation (EC) No 715/2009, Directive 2009/73/EC, Council Directive 2009/119/EC, Directive 2010/31/EU, Directive 2012/27/EU, Directive 2013/30/EU and Council Directive (EU) 2015/652 and Repealing Regulation (EU) No 525/2013: COM (2016) 759. Available online: https://eur-lex.europa.eu/legal-content/EN/TXT/?uri=CELEX%3A52016PC0759 (accessed on 1 August 2021).
- Veum, K.; Bauknecht, D. How to reach the EU renewables target by 2030? An analysis of the governance framework. Energy Policy 2019, 127, 299–307. [Google Scholar] [CrossRef]
- Bielski, S.; Marks-Bielska, R.; Zielińska-Chmielewska, A.; Romaneckas, K.; Šarauskis, E. Importance of Agriculture in Creating Energy Security—A Case Study of Poland. Energies 2021, 14, 2465. [Google Scholar] [CrossRef]
- Martinopoulos, G.; Tsalikis, G. Diffusion and adoption of solar energy conversion systems–The case of Greece. Energy 2018, 144, 800–807. [Google Scholar] [CrossRef]
- Martinopoulos, G. Are rooftop photovoltaic systems a sustainable solution for Europe? A life cycle impact assessment and cost analysis. Appl. Energy 2020, 257, 114035. [Google Scholar] [CrossRef]
- BP Statistical Review of World Energy, 68th ed. 2019. Available online: https://www.bp.com/content/dam/bp/businesssites/en/global/corporate/pdfs/energy-economics/statistical-review/bp-stats-review-2019-full-report.pdf (accessed on 12 July 2021).
- Bukowski, M.; Majewski, J.; Sobolewska, A. Macroeconomic Electric Energy Production Efficiency of Photovoltaic Panels in Single-Family Homes in Poland. Energies 2021, 14, 126. [Google Scholar] [CrossRef]
- IRENA. Solar Energy. Available online: https://www.irena.org/solar (accessed on 1 August 2021).
- Gulaliyev, M.G.; Mustafayev, E.R.; Mehdiyeva, G.Y. Assessment of Solar Energy Potential and Its Ecological-Economic Efficiency: Azerbaijan Case. Sustainability 2020, 12, 1116. [Google Scholar] [CrossRef] [Green Version]
- Jurasz, J.; Canales, F.A.; Kies, A.; Guezgouz, M.; Beluco, A. A review on the complementarity of renewable energy sources: Concept, metrics, application and future research directions. Sol. Energy 2020, 195, 703–724. [Google Scholar] [CrossRef]
- IEA. Key World Energy Statistics 2020; Statistics Report; International Energy Agency: Paris, France, 2020; Available online: https://www.iea.org/reports/key-world-energy-statistics-2020 (accessed on 1 August 2021).
- Ameli, N.; Brandt, N. Determinants of households’ investment in energy efficiency and renewables: Evidence from the OECD survey on household environmental behaviour and attitudes. Environ. Res. Lett. 2015, 10, 044015. [Google Scholar] [CrossRef]
- Niamir, L.; Ivanova, O.; Filatova, T.; Voinov, A.; Bressers, H. Demand-side solutions for climate mitigation: Bottom-up drivers ofhousehold energy behavior change in the Netherlands and Spain. Energy Res. Soc. Sci. 2020, 62, 101356. [Google Scholar] [CrossRef]
- Dubois, G.; Sovacool, B.; Aall, C.; Nilsson, M.; Barbier, C.; Herrmann, A.; Bruyère, S.; Andersson, C.; Skold, B.; Nadaud, F.; et al. It starts at home? Climate policies targeting household consumption and behavioral decisions are key to low-carbon futures. Energy Res. Soc. Sci. 2019, 52, 144–158. [Google Scholar] [CrossRef]
- Myojo, S.; Ohashi, H. Effects of consumer subsidies for renewable energy on industry growth and social welfare: The case of solar photovoltaic systems in Japan. J. Jpn. Int. Econ. 2018, 48, 55–67. [Google Scholar] [CrossRef]
- Wolske, K.S.; Todd, A.; Rossol, M.; McCall, J.; Sigrin, B. Accelerating demand for residential solar photovoltaics: Can simple framing strategies increase consumer interest? Glob. Environ. Chang. 2018, 53, 68–77. [Google Scholar] [CrossRef]
- Klepacka, A.M.; Florkowski, W.J.; Meng, T. Clean, accessible, and cost-saving: Reasons for rural household investment in solar panels in Poland. Resour. Conserv. Recycl. 2018, 139, 338–350. [Google Scholar] [CrossRef]
- Bloomberg, N.E.F. New Energy Outlook 2019; Bloomberg New Energy Finance: New York, NY, USA, 2019. [Google Scholar]
- Bódis, K.; Kougias, I.; Jäger-Waldau, A.; Taylor, N.; Szabó, S. A high-resolution geospatial assessment of the rooftop solar photovoltaic potential in the European Union. Renew. Sustain. Energy Rev. 2019, 114, 109309. [Google Scholar] [CrossRef]
- Energy Market Agency. Available online: https://www.are.waw.pl/ (accessed on 1 June 2021).
- Da Silva, M.G.; Muniz, A.R.C.; Hoffmann, R.; Lisbôa, A.C.L. Impact of greenhouse gases on surface coal mining in Brazil. J. Clean. Prod. 2018, 193, 206–216. [Google Scholar] [CrossRef]
- EMBER. Poland’s Wholesale Electricity Prices Rise to the Highest in Europe. Available online: https://ember-climate.org/commentary/2020/10/23/polands-electricity-prices-rise-to-the-highest-in-europe/ (accessed on 2 September 2021).
- Jurasz, J.K.; Dąbek, P.B.; Campana, P.E. Can a city reach energy self-sufficiency by means of rooftop photovoltaics? Case study from Poland. J. Clean. Prod. 2020, 245, 118813. [Google Scholar] [CrossRef]
- Dziennik Ustaw. Ustawa z Dnia 20 Maja 2016 r. o Inwestycjach w Zakresie Elektrowni Wiatrowych. Available online: https://isap.sejm.gov.pl/isap.nsf/DocDetails.xsp?id=WDU20160000961 (accessed on 2 August 2021).
- Schneider, D. Wysokie napiecie. Świat Nauki 1995, 12, 11–12. [Google Scholar]
- Igliski, B. Hydro energy in Poland: The history, current state, potential, SWOT analysis, environmental aspects. Int. J. Energy Water Resour. 2019, 3, 61–72. [Google Scholar] [CrossRef] [Green Version]
- Institute of Renewable Energy, Rynek Fotowoltaiki w Polsce 2021. Available online: https://ieo.pl/pl/raporty (accessed on 21 April 2021).
- Pietrzak, M.B.; Igliński, B.; Kujawski, W.; Iwański, P. Energy Transition in Poland—Assessment of the Renewable Energy Sector. Energies 2021, 14, 2046. [Google Scholar] [CrossRef]
- Directive (EU) 2015/1513 of the European Parliament and of the Council of 9 September 2015 Amending Directive 2009/28/EC on the Promotion of the Use of Energy from Renewable Sources. Available online: http://data.europa.eu/eli/dir/2015/1513/oj (accessed on 20 December 2020).
- Gnatowska, R.; Moryń-Kucharczyk, E. The Place of Photovoltaics in Poland’s Energy Mix. Energies 2021, 14, 1471. [Google Scholar] [CrossRef]
- Błoński, R. Dotacje dla Prosumentów Znowu Napędzają Rynek, ale to Nie Jedyny Czynnik. Available online: https://www.gramwzielone.pl/energia-sloneczna/106156/dotacje-dla-prosumentow-znowu-napedzaja-rynek-ale-to-nie-jedyny-czynnik (accessed on 11 September 2021).
- IEO Report. Available online: https://ieo.pl/en/pv-report (accessed on 1 September 2021).
- SolarPower Europe. Available online: https://www.solarpowereurope.org/ (accessed on 20 August 2021).
- Polskie Sieci Elektroenergetyczne. Available online: https://wysokienapiecie.pl/35154-potezny-rozwoj-fotowoltaiki-w-polsce/ (accessed on 22 March 2021).
- IRENA. Renewable Capacity Statistics 2021. Available online: www.irena.org/Statistics/ (accessed on 17 August 2021).
- European Commission. Directive (EU) 2018/2001 of the European Parliament and of the Council of 11 December 2018 on the Promotion of the Use of Energy from Renewable Sources (Recast); L328/82, O.J. 21.12.2018. European Commission (EU COM): Brussels, Belgium, 2018.
- Ministry of Climate and Energy. Energy Policy of Poland until 2040. 2018. Available online: https://www.gov.pl/attachment/62a054de-0a3d-444d-a969-90a89502df94 (accessed on 17 August 2021).
- Olczak, P.; Kryzia, D.; Matuszewska, D.; Kuta, M. “My Electricity” Program Effectiveness Supporting the Development of PV Installation in Poland. Energies 2021, 14, 231. [Google Scholar] [CrossRef]
- Lazard. Levelized Cost of Energy Analysis. 2019. Available online: https://www.lazard.com/ (accessed on 12 August 2021).
- GlobalPetrolProces.com. Available online: https://www.globalpetrolprices.com/ (accessed on 12 August 2021).
- GUS. Concise Statistical Yearbook of Poland. 2021. Available online: https://stat.gov.pl/files/gfx/portalinformacyjny/pl/defaultaktualnosci/5515/1/23/1/maly_rocznik_statystyczny_polski_2021_31.08.2021.pdf (accessed on 2 September 2021).
- Zdyb, A. Rooftop Low Angle Tilted Photovoltaic Installation under Polish Climatic Conditions. J. Ecol. Eng. 2021, 22, 223–233. [Google Scholar] [CrossRef]
- Zdyb, A.; Gulkowski, S. Performance assessment of four different photovoltaic technologies in Poland. Energies 2020, 13, 196. [Google Scholar] [CrossRef] [Green Version]
- Grębosz-Krawczyk, M.; Zakrzewska-Bielawska, A.; Glinka, B.; Glińska-Neweś, A. Why Do Consumers Choose Photovoltaic Panels? Identification of the Factors Influencing Consumers’ Choice Behavior regarding Photovoltaic Panel Installations. Energies 2021, 14, 2674. [Google Scholar] [CrossRef]
- Kata, R.; Cyran, K.; Dybka, S.; Lechwar, M.; Pitera, R. Economic and Social Aspects of Using Energy from PV and Solar Installations in Farmers’ Households in the Podkarpackie Region. Energies 2021, 14, 3158. [Google Scholar] [CrossRef]
- Drzymała, A.; Korzeniewska, E. Profitability of a hybrid heating system for a single-family house in Poland based on a heat pump and photovoltaics. J. Phys. Conf. Ser. 2021, 1782, 12006. [Google Scholar] [CrossRef]
- Kuceba, R.; Chmielarz, G.; Soltysiak, M. Vital Factors Stimulating Development and Competitiveness of Design and Construction Enterprises of Photovoltaic Farms. Energies 2021, 14, 3399. [Google Scholar] [CrossRef]

| Electricity Consumption in (kWh) per Capita in 2019 | Allocation for Programs in Individual Voivodeships [mln PLN] | Available Connection Capacity [MW] | Percentage of Households That Received Subsidies [%] | |
|---|---|---|---|---|
| Electricity consumption in (kWh) per capita in 2019 | 1 | |||
| Allocation for programs in individual voivodeships [mln PLN] | 0.854174 | 1 | ||
| Available connection capacity [MW] | −0.01052 | −0.14761 | 1 | |
| Percentage of households that received subsidies [%] | 0.684569 | 0.799847 | 0.03227 | 1 |
| Total Hours of Sunshine per Year | Forest Area [%] | Annual Average Concentration of PM10 WHO Recommended Level = 20 | Percentage of Households That Received Funding | |
|---|---|---|---|---|
| Total hours of sunshine per year | 1 | |||
| Forest area [%] | −0.559549102 | 1 | ||
| Annual average concentration of PM10 WHO recommended level = 20 | 0.317968684 | −0.237965124 | 1 | |
| Percentage of households that received funding | −0.842380014 | 0.863587964 | −0.06479021 | 1 |
| Men | Women | Population Density per km2 | Cities | Urban Municipalities | Rural Municipalities | Urban-Rural Municipalities | Unemployment Rate 01/2021 | % of Population with Higher ed. | % of Pensioners in the Voivod | nb of Marriages Contracted in 2020 | nb of Divorces in 2020 | nb of Births per 1000 Citizens | Av. Life Expectancy Men 30 y.o. | Av. Life Expectancy Men 45 y.o. | Av. Life Expectancy Men 60 y.o. | Av. Life Expectancy Women 30 y.o. | Av. Life Expectancy Women 45 y.o. | Av. Life Expectancy Women 60 y.o. | Av. Monthly Gross Rem. in PLN | Nb. of People Working | % of Households with Subsidies | |
|---|---|---|---|---|---|---|---|---|---|---|---|---|---|---|---|---|---|---|---|---|---|---|
| Men | 1 | |||||||||||||||||||||
| Women | 0.99991 | 1 | ||||||||||||||||||||
| Population density per km2 | 0.634688 | 0.63951 | 1 | |||||||||||||||||||
| Cities | 0.80874 | 0.807936 | 0.097936 | 1 | ||||||||||||||||||
| Urban municipalities | 0.881424 | 0.875304 | 0.331813 | 0.783085 | 1 | |||||||||||||||||
| Rural municipalities | 0.912842 | 0.908063 | 0.593884 | 0.637247 | 0.942078 | 1 | ||||||||||||||||
| Urban-rural municipalities | 0.728007 | 0.728735 | 0.02587 | 0.985077 | 0.664359 | 0.505122 | 1 | |||||||||||||||
| Unemployment rate 01/2021 | −0.73508 | −0.74194 | −0.36747 | −0.80159 | −0.46641 | −0.40011 | −0.83426 | 1 | ||||||||||||||
| % of population with higher ed.% | 0.443432 | 0.445045 | 0.783204 | 0.008836 | 0.211873 | 0.508756 | −0.04802 | −0.03734 | 1 | |||||||||||||
| % of pensioners in the voivodeship | −0.30213 | −0.30344 | −0.3263 | −0.08132 | −0.30633 | −0.25923 | −0.01295 | 0.324918 | 0.30253 | 1 | ||||||||||||
| Number of marriages in 2020 | 0.997363 | 0.998067 | 0.68294 | 0.778831 | 0.849058 | 0.898274 | 0.70102 | −0.74686 | 0.474428 | −0.31809 | 1 | |||||||||||
| Number of divorces in 2020 | 0.990411 | 0.991757 | 0.614181 | 0.843659 | 0.827927 | 0.850622 | 0.784778 | −0.81195 | 0.422035 | −0.26284 | 0.990687 | 1 | ||||||||||
| Number of births per 1000 citizens | 0.911012 | 0.908941 | 0.596002 | 0.654468 | 0.89901 | 0.90109 | 0.537737 | −0.59263 | 0.241032 | −0.62232 | 0.906116 | 0.86397 | 1 | |||||||||
| Average life expectancy men 30 y.o. | 0.343661 | 0.341213 | 0.525454 | −0.08835 | 0.411232 | 0.481933 | −0.21999 | −0.01721 | 0.065463 | −0.85955 | 0.358679 | 0.249817 | 0.67192 | 1 | ||||||||
| Average life expectancy men 45 y.o. | 0.23425 | 0.231072 | 0.485686 | −0.21378 | 0.329673 | 0.417083 | −0.34815 | 0.126341 | 0.077201 | −0.80241 | 0.24916 | 0.130988 | 0.576672 | 0.989335 | 1 | |||||||
| Average life expectancy men 60 y.o. | 0.252213 | 0.246644 | 0.537559 | −0.25522 | 0.379555 | 0.532173 | −0.41176 | 0.307206 | 0.344638 | −0.52626 | 0.261357 | 0.129182 | 0.522894 | 0.885976 | 0.925331 | 1 | ||||||
| Average life expectancy women 30 y.o. | −0.12902 | −0.13697 | 0.232135 | −0.53587 | 0.098326 | 0.251248 | −0.67122 | 0.712055 | 0.301173 | −0.15917 | −0.13072 | −0.25843 | 0.110178 | 0.603816 | 0.702863 | 0.879765 | 1 | |||||
| Average life expectancy women 45 y.o. | −0.09321 | −0.10119 | 0.258245 | −0.5094 | 0.129008 | 0.285836 | −0.6479 | 0.69022 | 0.326637 | −0.1612 | −0.09491 | −0.22321 | 0.139911 | 0.612098 | 0.708054 | 0.889871 | 0.99929 | 1 | ||||
| Average life expectancy women 60 y.o. | −0.03821 | −0.04625 | 0.300996 | −0.46322 | 0.165562 | 0.342092 | −0.60252 | 0.672554 | 0.430296 | −0.06593 | −0.04037 | −0.16571 | 0.147386 | 0.54971 | 0.644685 | 0.867443 | 0.987058 | 0.99105 | 1 | |||
| Average monthly gross remun. in PLN | 0.598975 | 0.608697 | 0.831716 | 0.271912 | 0.192809 | 0.345326 | 0.273422 | −0.72501 | 0.430575 | −0.46622 | 0.652931 | 0.643016 | 0.534404 | 0.360409 | 0.268696 | 0.134912 | −0.27047 | −0.25047 | −0.23947 | 1 | ||
| Nb. of people working in thousands | 0.992334 | 0.991521 | 0.534478 | 0.870341 | 0.908779 | 0.901682 | 0.794469 | −0.74769 | 0.362104 | −0.27335 | 0.981871 | 0.985944 | 0.898335 | 0.285983 | 0.172451 | 0.184389 | −0.18319 | −0.14816 | −0.09423 | 0.523704 | 1 | |
| %of households that received subsidies | −0.00411 | −0.01254 | 0.119183 | −0.31377 | 0.29343 | 0.317126 | −0.45829 | 0.475976 | −0.07302 | −0.55578 | −0.01694 | −0.13409 | 0.359397 | 0.825575 | 0.880353 | 0.894482 | 0.865627 | 0.863595 | 0.80299 | −0.21381 | −0.03042 | 1 |
Publisher’s Note: MDPI stays neutral with regard to jurisdictional claims in published maps and institutional affiliations. |
© 2021 by the authors. Licensee MDPI, Basel, Switzerland. This article is an open access article distributed under the terms and conditions of the Creative Commons Attribution (CC BY) license (https://creativecommons.org/licenses/by/4.0/).
Share and Cite
Rataj, M.; Berniak-Woźny, J.; Plebańska, M. Poland as the EU Leader in Terms of Photovoltaic Market Growth Dynamics—Behind the Scenes. Energies 2021, 14, 6987. https://doi.org/10.3390/en14216987
Rataj M, Berniak-Woźny J, Plebańska M. Poland as the EU Leader in Terms of Photovoltaic Market Growth Dynamics—Behind the Scenes. Energies. 2021; 14(21):6987. https://doi.org/10.3390/en14216987
Chicago/Turabian StyleRataj, Małgorzata, Justyna Berniak-Woźny, and Marlena Plebańska. 2021. "Poland as the EU Leader in Terms of Photovoltaic Market Growth Dynamics—Behind the Scenes" Energies 14, no. 21: 6987. https://doi.org/10.3390/en14216987
APA StyleRataj, M., Berniak-Woźny, J., & Plebańska, M. (2021). Poland as the EU Leader in Terms of Photovoltaic Market Growth Dynamics—Behind the Scenes. Energies, 14(21), 6987. https://doi.org/10.3390/en14216987