Article

Optimal Bi-Level Scheduling Method of Vehicle-to-Grid and Ancillary Services of Aggregators with Conditional Value-at-Risk

Department of Electronic, Electrical and Systems Engineering, University of Birmingham, Birmingham B15 2TT, UK
*
Author to whom correspondence should be addressed.
Energies 2021, 14(21), 7015; https://doi.org/10.3390/en14217015
Submission received: 26 September 2021 / Revised: 22 October 2021 / Accepted: 23 October 2021 / Published: 26 October 2021

Abstract

:
With the global net-zero strategy implementation, decarbonisation of transport by massive deployment of electric vehicles (EVs) has been considered to be an essential solution. However, charging EVs and integration into electricity grids is going to be a fundamental challenge to future electricity systems. Hence, in this situation, how to effectively deploy massive numbers of EVs, and in the meantime what can be developed to deliver vehicle-to-grid (V2G) services, become a fundamental yet interesting tech-economical issues. Furthermore, uncertainty in lack of vehicle availability and EV battery degradation could lead to revenue loss when using EVs as ancillary services aggregators. With such considerations, this paper presents a new optimised V2G aggregator scheduling service that has taken into consideration of a number of risks, including EV availability and battery degradation through conditional value-at-risk. The proposed method for V2G scheduling service, as an independent aggregator, is formulated as a bi-level optimisation problem. The performance of the proposed method is to be evaluated through case studies on the Birmingham International Airport parking lot with onsite renewable generation. Uncertainties of EVs and the differences in weekdays and weekends are also compared.

Graphical Abstract

1. Introduction

With the rapid development of electric vehicles (EVs), the role of EVs in the energy market has received ever increasing attention. The increase in the penetration rate of electric vehicles has led to greater challenges in EV charging management and scheduling, which will also affect the reliability of the grid system.
An EV can be seen as a stationary battery when it is parked or being charged. In addition to coordinated charging, there have been a number of emerging research works on vehicle-to-grid (V2G) in recent years. The optimisation principle of V2G is to maximise the benefit of grid connected vehicles through various ancillary services [1,2]. In addition, small-scale EV charging stations can be aggregated to participate into ancillary market for large EV fleets [3].
The economic advantages of V2G are eye-catching. It can provide additional income for car owners to offset the cost of running EVs and can further justify the economic benefits of replacing conventional combustion engines with EVs. From the perspective of the grid and energy suppliers, EV and V2G can help balancing the grid demand and supply, as well as providing reactive power compensation, which can improve the stability and reliability of the grid [4,5,6]. In the meantime, in [7,8], the authors have presented an integration of V2G and wind/solar energy.
However, the uncertainty of V2G may have a huge impact on the system performance that cannot be ignored, including unpredictable EV charging behaviors and the uncertainty of the electricity market price. Reference [9] clearly explained that participating in a demand response plan is a way to make electric vehicles more profitable. Moreover, the increase in EV charging load leads to grid voltage changes and frequency regulation, which increase the operating cost of the grid. But the authors did not consider the uncertainties in charging activities.
In [10], the authors proposed a multi-objective model to increase the power distribution system efficiency and the reliability of V2G. A framework was built as a smart power hub to develop electric car parking lots in [11]. Also, Gunter and other researchers established a multi-objective collaborative optimisation distribution method in the distribution network model. Consideration of the constraints of grid operation, combining charging facilities and renewable distributed power generation to provide low-cost charging for EV users was discussed in [12]. In [13,14] the authors considered voltage stability, carbon emissions and the behavior of other market participants. As use of renewable energy is crucial to reduce the environmental pollution caused when electricity is generated, [15,16] discussed plans for a renewable electric vehicle charging system. In order to maximise the aggregated revenue, [17,18] proposed that EV energy storage can be used in the distribution network to optimise the revenue of the aggregator. Refs. [19,20] analyzed the optimisation problem from the perspective of the electric vehicle owner rather than the system operator or aggregator. Conditional value at risk (CVaR) is used to mitigate the risk and uncertainties in modelling optimisation problems. The article [21,22,23] proposed a CVaR model for power loss in the distribution system, CVaR was used to measure the impact of uncertainty on the risk of EVA and the risk of renewable energy uncertainty. The Karush–Kuhn–Tucker (KKT) method is commonly used to decompose the problem to find the global optimal solution for bi-level optimisation problems [24]. For aggregated V2G services, past research did not address this as a risk in aggregated V2G scheduling. In this paper, a bi-level scheduling method can provide efficient interaction at each level and achieve the goals of each level, and this method can optimise the profit of aggregators and EV owners at the same time [25]; the contribution can be summarised as follows:
(1)
The optimisation method has taken into account the risk of loss of revenue due to lack of vehicle charging capacity to provide service and EV battery degradation, and the CVaR was used to mitigate the uncertainties. (CVaR, also known as expected shortfall, was originally used to evaluate the market and credit risk of investment portfolios [22,23]).
(2)
A preferred operating point will be suggested within the ancillary capacity, with consideration of the onsite renewable generation and the above risk.
This paper presents a bi-level scheduling model to maximise the profit by considering uncertainties in participated vehicles through CVaR in Section 2 and explain the details of the bi-level problem in Section 3. Section 4 combines the bi-level model with conditional value-at-risk, the impact of risk aversion parameters is also evaluated. Table 1 is the explanation of the abbreviations in the equation

2. Bi-Level Scheduling Method for Vehicle-to-Grid and Ancillary Services

A bi-level scheduling method is divided into two problems. The upper problem is calculated by subtracting the cost of the aggregator from revenue. The lower problem aims to maximise the profits of electric car owners. In addition to introducing and analyzing how to use the bi-level to optimise the design of charging stations, this method also considers uncertainties study methodology, risk management and the system adjustment signal, so that the accuracy of the results can be further improved.

2.1. Upper-Level Problem

In the upper-level model, when a renewable energy charging station charges an electric vehicle, it can provide services that trade with the grid. In Equation (1), F C S is the upper-level profit of aggregators. B and C are the upper-level income and the upper-level cost, respectively.
max F C S = B C
The upper-level cost ( C ) is composed of three parts, namely charging cost, distributed power generation cost and energy storage cost, as shown in Equation (2).
C = k c f c c f P N c f + k r d g c r d g P N r d g + k e s c e s p P N e s + k e s c e s e E N e s
where c c f ,   c r d g ,   c e s p   and   c e s e stand for capital cost of charging facility, renewable distributed generation, energy storage in power and the energy storage in energy rating, respectively. P N c f ,   P N r d g ,   P N e s ,   and   E N e s stands for installed capacity of charging of charging facility, charging of renewable distributed generation, energy storage power capacity and EVs. and energy rating capacity.
The upper-level income ( B ) is the sum of the charging power price and the power exchanged with the grid, including the maintenance costs of charging facilities, renewable distributed power generation and energy storage.
B = θ t = 1 T ( δ t c h P t c h δ t i n t P t i n t ) Δ t ( c c f m P N c f + c r d g m P N r d g + c e s m E N e s )
where δ t c h   and   δ t i n t are charging price and price of exchanged power between grid. P t c h   and   P t i n t stands total charging power of EVs and exchanged power between grid. c c f m ,   c r d g m   and   c e s m are the annual maintenance cost of charging facility, renewable distributed generation, and energy storage.
Preferred operating point at time t ( P O P i ( t ) ) consists of two parts: Positive preferred operating point ( P O P P o s , i ( t ) ) and negative preferred operating point ( P O P N e g , i ( t ) ) at time t.
P O P i ( t ) = P O P P o s , i ( t ) P O P N e g , i ( t )
The Equation (5) shows the cost of battery degradation ( D e g i ( t ) ), which is figure out by multiply the battery cost per kilowatt with all energy deliver from vehicle to grid. B a t C is battery replacement cost. M i n P i ( t )   and   R S R P i ( t ) stands for minimum additional power draw and responsive reserve power draw.
D e g i ( t ) = B a t C ( P O P N e g , i ( t ) + M i n P i ( t ) + R S R P i ( t ) )
The decision variables are P O P P o s , i , P O P N e g , i , M a x P i , M i n P i and R S R P i of per EV per hour in this model. The constrains of this model illustrated by Equations (6)–(15).
Firstly, Equations (6) and (7) limit the battery maximum charge during the parking time by the battery capacity, while it must be positive:
( t ( E ( F P D i ( t ) ) E f i ) + S O C I , i ) M C , i
( t ( E ( F P D i ( t ) ) E f i ) + S O C I , i ) 0
There is an assumption that make sure the state of charge should be reach to 80% of total capacity when the EV departure. The constraint is illustrated as Equation (8):
t = 1 T ( E ( F P D i ( t ) ) E f i ) + S O C I , i 80 % M C , i
where F P D i is final power draw at time t with considering the regulation and reserve service. E f i is the electric vehicle battery charger efficiency. M C , i is maximum battery capacity of the electric vehicle.
Beyond that, the variables of the first hour during a day show as inequalities (9)–(11):
( M a x P i + P O P P o s , i P O P N e g , i ) E f i + S O C I , i M C , i
( ( P O P P o s , i P O P N e g , i M i n P i R S R P i ) E f i + S O C I , i ) 0
( ( P O P P o s , i P O P N e g , i M i n P i R S R P i ) E f i + S O C I , i ) T r i p
The positive preferred operating point and a negative operating point each hour are limited by the maximum charge and discharge rate as in the following equation. These constraints also consider the regulation by additional power draw and response reserve of the system:
( P O P P o s , i ( t ) P O P N e g , i ( t ) ) M P i ( t )
M a x P i ( t ) + ( P O P P o s , i ( t ) P O P N e g , i ( t ) ) M P i ( t )
M i n P i ( t ) ( P O P P o s , i ( t ) P O P N e g , i ( t ) ) M P i ( t )
R S R P i ( t ) ( P O P P o s , i ( t ) P O P N e g , i ( t ) ) + M i n P i ( t ) M P i ( t )
The upper-level model consists of the main aim function which is limited in Equations (16)–(30). The main solution is to define the optimal renewable energy source charging station configuration design and pricing strategy according to the renewable energy source charging station aggregators’ perspective.
The equations of the upper-level model correspond to the maximum profit of the renewable energy charging station aggregator. The variables of the objective function can be divided into decision variables and operation variables. Decision variables include energy storage, energy storage power capacity, installed capacity of charging facility, installed capacity of renewable distributed generation, and charging tariff upper limit. Operation variables include total power output of renewable distributed generation, energy storage charging, energy discharging power, exchanged power with the power grid, and total power charging of EVs.
0 P N c f P m a x N c f
0 P N r d g P m a x N r d g
0 P N e s P m a x N e s
0 E N e s P m a x N e s
The constraints (16)–(19) set the maximum and minimum limits of charging facility, renewable distributed generation and energy storage charging capacity in an independent renewable energy source charging station, where P N c f , P N r d g , P N e s   ,   and   E N e s stands for installed capacity of charging of charging facility, charging of renewable distributed generation, energy storage power capacity and EVs. and energy rating capacity.
0 δ c h P m a x c h ;           d D         t T
In order to maintain the stability of the electric vehicle charging market, constraint (20) sets the charging price ( δ c h ) limit provided by the renewable energy charging station aggregator within a predetermined range. A benchmark can be added to determine price variability:
P m a x t r P i n t P m a x t r           d D         t T
Constraint (21) restricts the exchange of energy between the grid ( P t i n t ) and the electric vehicle charging station and cannot exceed the maximum capacity of the substation transformer:
0 P r d g P N r d g γ r d g           d D         t T
Constraint (22) set the limit of the maximum power that renewable charge stations can use from renewable distributed generation. Where P r d g   and   P N r d g stands for total power output of renewable distributed generation and installed capacity of charging of renewable distributed generation.
0 P c h P N c f           d D         t T
0 P e s c P N e s           d D         t T
0 P e s d P N e s           d D         t T
The above constraints (23)–(25) limit the charging and discharging of energy through charging facilities and energy storage. P c h ,   P e s c   and   P e s d stands for total charging power of EVs, energy storage charging power and energy storage discharging power.
E N e s S O C m i n e s E e s E N e s S O C m a x e s ,   d D         t T
E t e s = E t 1 e s + P t e s c η e s c Δ t P t e s d Δ t / η e s c ,   d D         t T
Constraints (26) and (27) illustrate the limits of energy storage through the state of charge when participating in auxiliary services. E e s is the energy of the storage, S O C e s is energy storage state of charge. η e s c is efficient of energy storage charging.
E t 0 e s = E 24 e s         d D
Constraints (28) ensure that the energy at the end of the case must be equal to the energy at the beginning of the case to ensure the sustainability of renewable charging stations.
P t r d g + P t i n t = P t c h + P t e s c P t e s d ,   d D         t T
The balance of the charging and the discharging system is restricted by constraints (29), where P r d g   and   P t i n t stands for total power output of renewable distributed generation and exchange of energy between the grid
P t c h η c f Δ t = v m = 1 M d v , t , m e v f v , d , t e v ,   d D         t T
Equation (30) links the upper model with the lower model by making the total energy demand of the EV owner equal to the energy provided to the EV.

2.2. Lower-Level Problem

In the lower-level model, the profit of electric vehicle owners can be maximised through the following objective function:
M a x   F t E V = U t E V C t E V
where F t E V is profit of electric vehicle owners; U t E V is the marginal utility and C t E V is the cost of electric vehicle users.
Taking into account the price provided by renewable charging stations, the behavior of electric vehicles participating in auxiliary services. In this paper, the profit of electric vehicle owners is calculated by subtracting the cost of charging the electric vehicle from the marginal utility. Reference [24] explained that the cost of EV users to charge their cars decreases with the increase of energy from renewable charging stations. The marginal utility ( U t E V ) and cost of electric vehicle users ( C t E V ) are shown in Equations (32) and (33) where d t e v is total charging of the EV. δ t E V is the charging price.
U t E V = m = 1 M u t E V d t e v
C t E V = m = 1 M δ t E V d t e v
The equations above are subject to:
m = 1 M d t E V d m a x E V 0         t T                       ( μ t 1 )
d m i n E V m = 1 M d t E V 0         t T                       ( μ t 2 )
Constraints (34) and (35) set the upper and lower limits of the total charging of the EV.
d t , m , v E V d m , v , m a x E V 0 ,   t T ,   m = 1 , M .                             ( μ t 3 )
d t , m , v E V > 0 ,   t T ,   m = 1 , M .                             ( μ t 4 )
Constraints (36) and (37) limit the charging of each EV block. Since there are lower-level discrete variables, this is a non-convex problem. Therefore, the proposed method in this paper applied Karush–Kush–Tucker (KKT) to convert the bi-level program into a single linear program.

2.3. Uncertainties Study Methodology

Assume that the behavior of electric vehicles obeys a truncated Gaussian distribution. Where S O C I , i is state of charge at the initial moment of the i th electric vehicle.
S O C I , i = f ( x ) = f T G ( x ; μ S O C , σ S O C 2 , ( S O C i m i n , S O C i m a x ) )   i
In this model, the time of EV arrival and departure from the charging point follows a truncated Gaussian distribution.
t i a r r = f ( x ) = f T G ( x ; μ a r r , σ a r r 2 , ( t n a r r , m i n , t n a r r , m a x ) )   i
t i d e p = f ( x ) = f T G ( x ; μ d e p , σ d e p 2 , ( t n d e p , m i n , t n d e p , m a x ) )   i
where t i a r r and t i d e p is EV arrival and departure time.
Constraint (41) indicates that the time to reach the charging point should be earlier than the departure time.
t i a r r < t i d e p     i
According to Equation (42), the EV parked in the parking lot at time t ( i t E V ) is calculated by the number of EVs at time t − 1 and the EV arriving/departing at time t.
i t E V = i t E V , a r r i t E V , d e p + i t 1 E V     i

2.4. Profit Risk Management of Electric Vehicle (EV) Charging Stations

Different types of EV and charging strategies cause the profit of charging stations to be a random variable. Therefore, the authors introduced a risk-neutral equation to avoid the bad profit distribution of EV charging stations. According to references [26,27], several methods have been widely used to solve the high profit variability and negative profit problems of charging stations, such as shortage probability, variance, expected shortage, etc. CVaR was chosen to mitigate the risk in engineered investments in the proposed method [21,22,23]. The mathematical expression of CVaR is as follows:
C V a R = ξ 1 1 α s = 1 N S ρ s η s
where ξ is the VaR, confidence level has been presented as α , ρ s and η s present probability and the difference between profit and the VaR non-negative variable. When the profit smaller than VaR, the η s present difference between them, otherwise, η s is zero.
The objective function of upper level can be expressed as:
M a x   P r o f i t + β   C V a r
subject to:
η s + P r o f i t ξ 0
η s 0
β is the risk-aversion parameter. With the increase of β, the objective of aggregators become more risk averse system. When β equals to zero, the objective of aggregators become risk neutral system.
Considering the objectives and constraints of conditional risk management respectively, it is a mixed-integer linear program that requires the application of high-performance solvers.

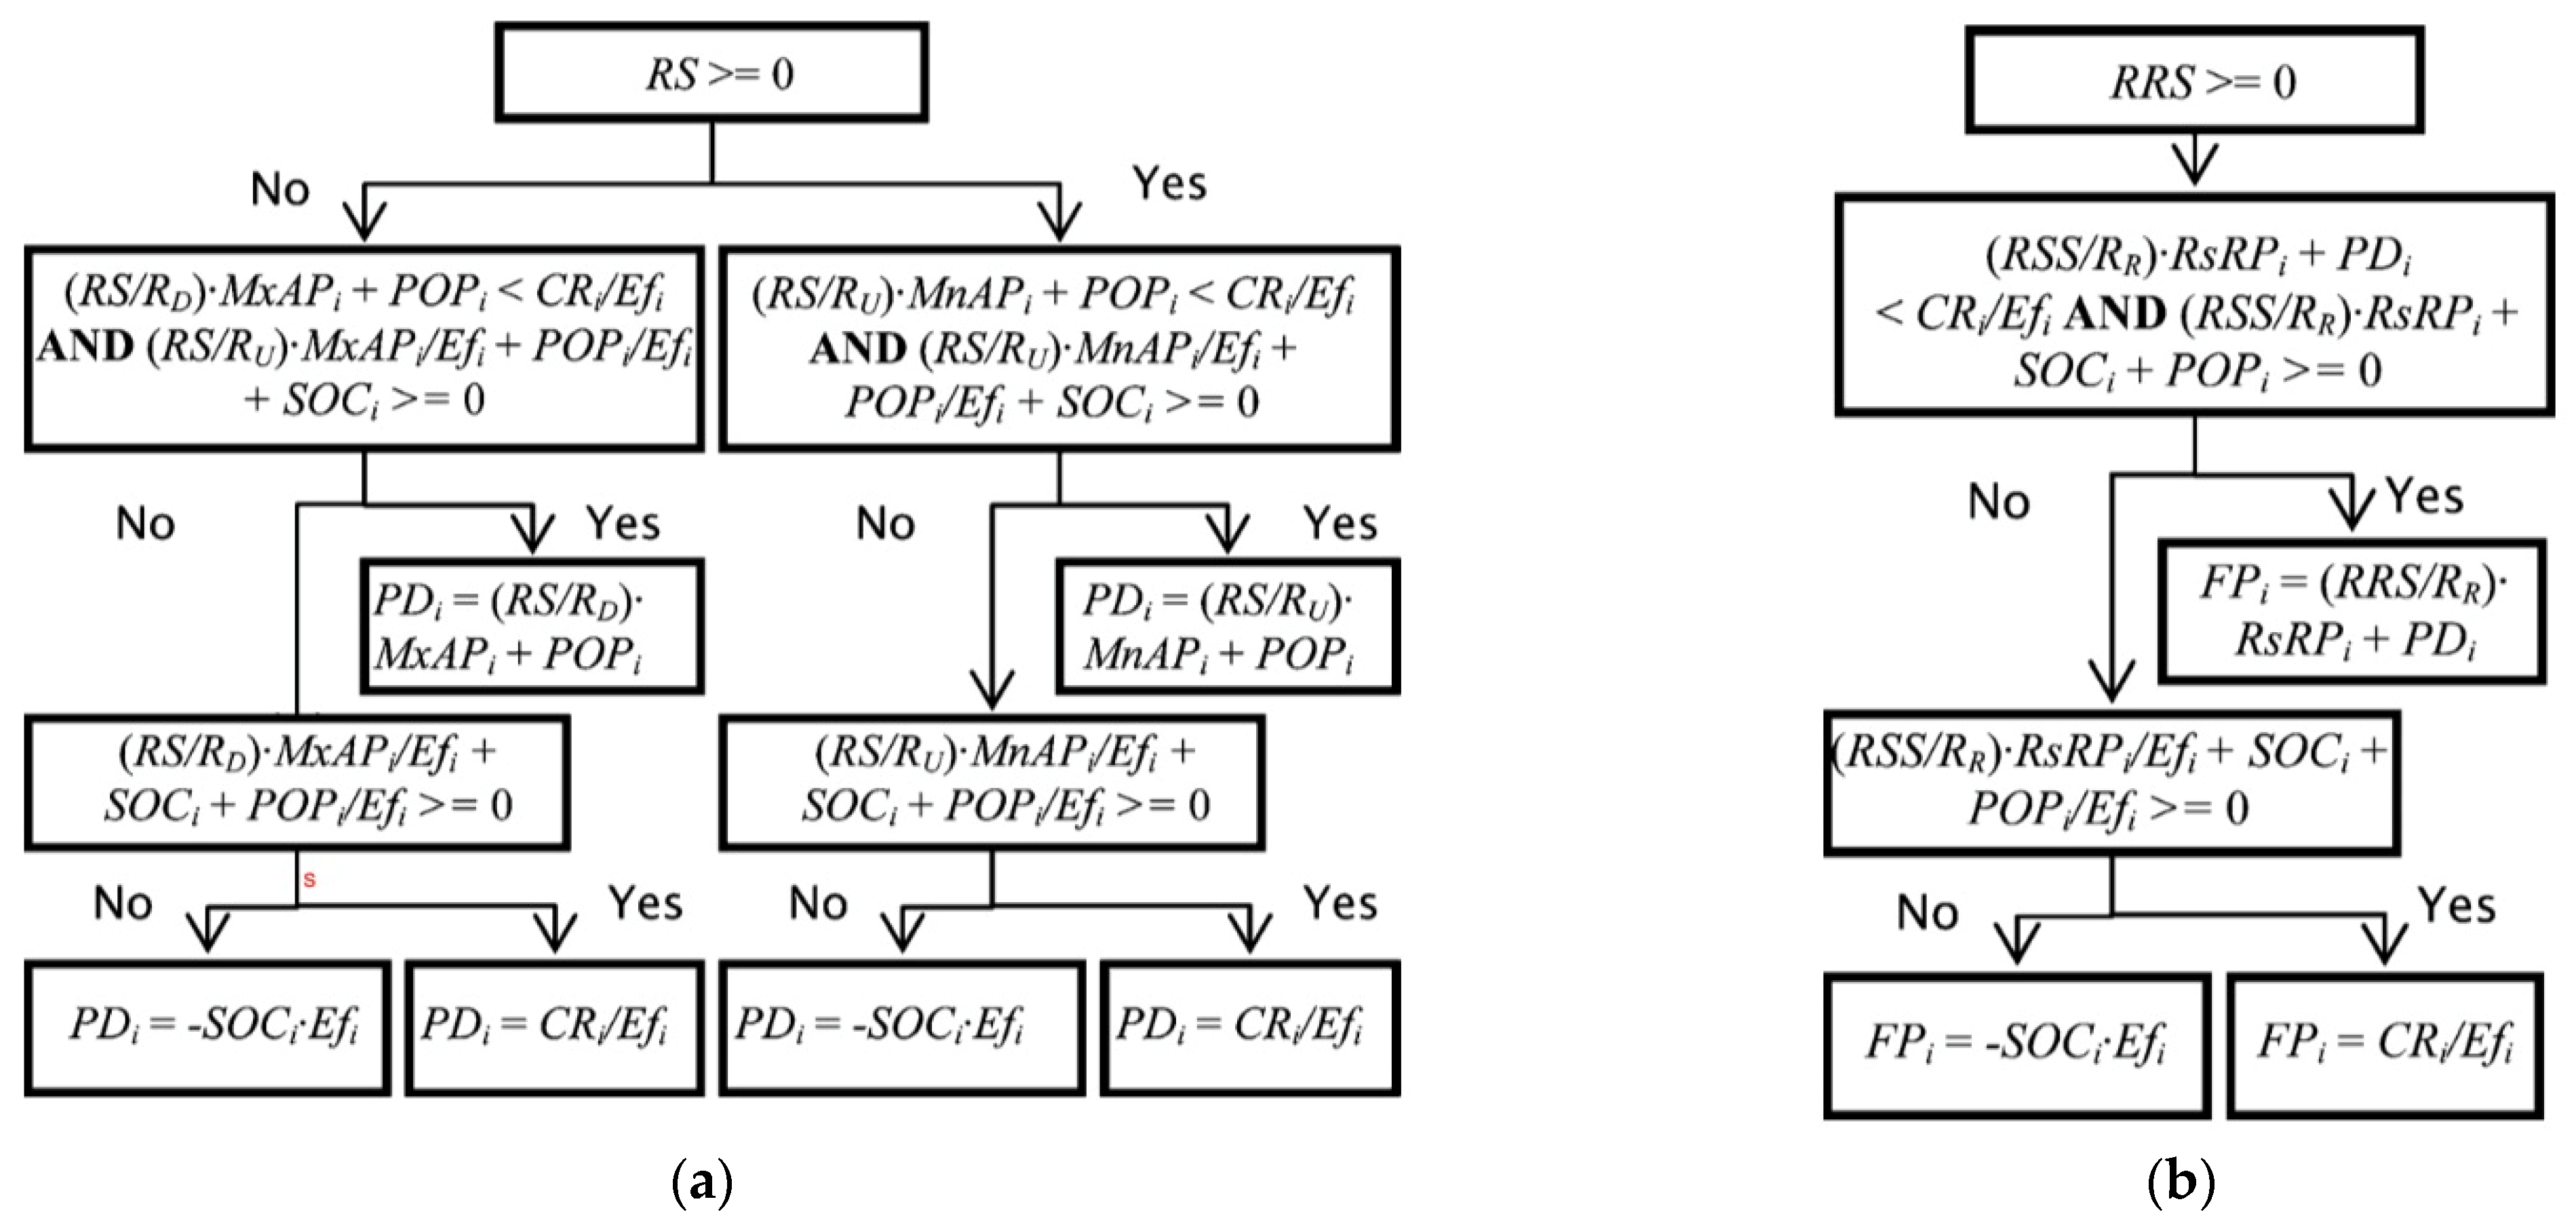
2.5. The System Adjustment Signal of Aggregator

The EV charging station is a special aggregator. The system adjustment signal is the key to this aggregator system [24]. EVs will respond to the signal by adjusting the behavior of charge/discharge [28]. Aggregators receive the signals from the energy market and analyse them by integrated computing, then send the charge/discharge signal to EVs in the parking lot [29].
Figure 1a,b below shows the regulatory scheduling is independent of responsive reserve scheduling. The results of two dispatches can be combined finally to obtain the behaviour of each kind of EV.

3. Solution to the Bi-Level Problem

The previous part introduced the method used to solve the bi-level problem in this research. First, the KKT condition can convert a lower-level model into a series of constraints of a higher-level model by adding a Lagrange multiplier variable. After transmission through KKT, the lower level becomes a non-linear constraint set. Therefore, the “linprog” that solves the single-stage problem is no longer applicable to the bi-level model [24]. The following sections explain the details of the function.
Since the Lagrangian function with Lagrangian multiplier is a non-linear problem, (34)–(37) can be expressed as:
μ v , t 1 · ( n = 1 N d v , t E V d , m a x E V ) = 0 ,     t T     m M
μ v , t 2 · ( d , m i n E V n = 1 N d v , t E V ) = 0 ,     t T     m M
μ v , t 3 · ( d t , v E V d v u b ) = 0 ,     t T     m M
μ v , t 4 · d t , v E V = 0 ,     t T     m M
μ v , t 1 0
μ v , t 2 0  
μ v , t 3 0
μ v , t 4 0
Constraints (47)–(54) are the simplified KKT conditions, which can combine with the upper level model. And the McCormick relaxation also can solve this problem. If z = a × b , where a [ a m i n , a m a x ] and b [ b m i n , b m a x ] , it can be equivalent as four constraints:
z a m i n b + b m i n a a m i n b m i n
z a m a x b + b m a x a a m a x b m a x
z a m i n b + b m a x a a m i n b m a x
z a m a x b + b m i n a a m a x b m i n
Besides the non-linear constraints, there are nonlinear elements in the objective function such as δ c h P c h .
B = θ t = 1 T ( δ t c h P t c h δ t i n t P t i n t ) Δ t ( c c f m P N c f + c r d g m P N r d g + c e s m E N e s )
z c h δ m a x c h P t c h + z t c f δ m a x c h P t N c f ,   t T
z c h z t c f ,   t T
z c h δ m a x c h P t c h ,   t T
z c f δ m a x c h P t N c f + P t N c f δ t c h δ m a x c h P m a x N c f ,   t T
z c f P m a x N c f δ t c h ,   t 1 , , T
z c f δ m a x c h P t N c f ,   t 1 , , T
z c h 0 ,   t 1 , , T
z c f 0 ,   t 1 , , T
Objectives with non-linear elements have been transferred to the standard mixed-integer linear program as constraints (55)–(67).

4. Case Study

In this paper, the case study is included using Birmingham International Airport as an example for a duration of 24 h. In this case, it is assumed there are 10,000 EVs. Suppose there are three types of electric vehicle in the parking lot: 30% Nissan Leaf (2011 model), 50% Tesla Model 3 (long range) and 20% Audi e-tron. The assumption is made against market share of battery electric vehicle in the UK by aggregating similar body type, engine and battery sizes [30]. A charge-discharge rate of 90% was selected.

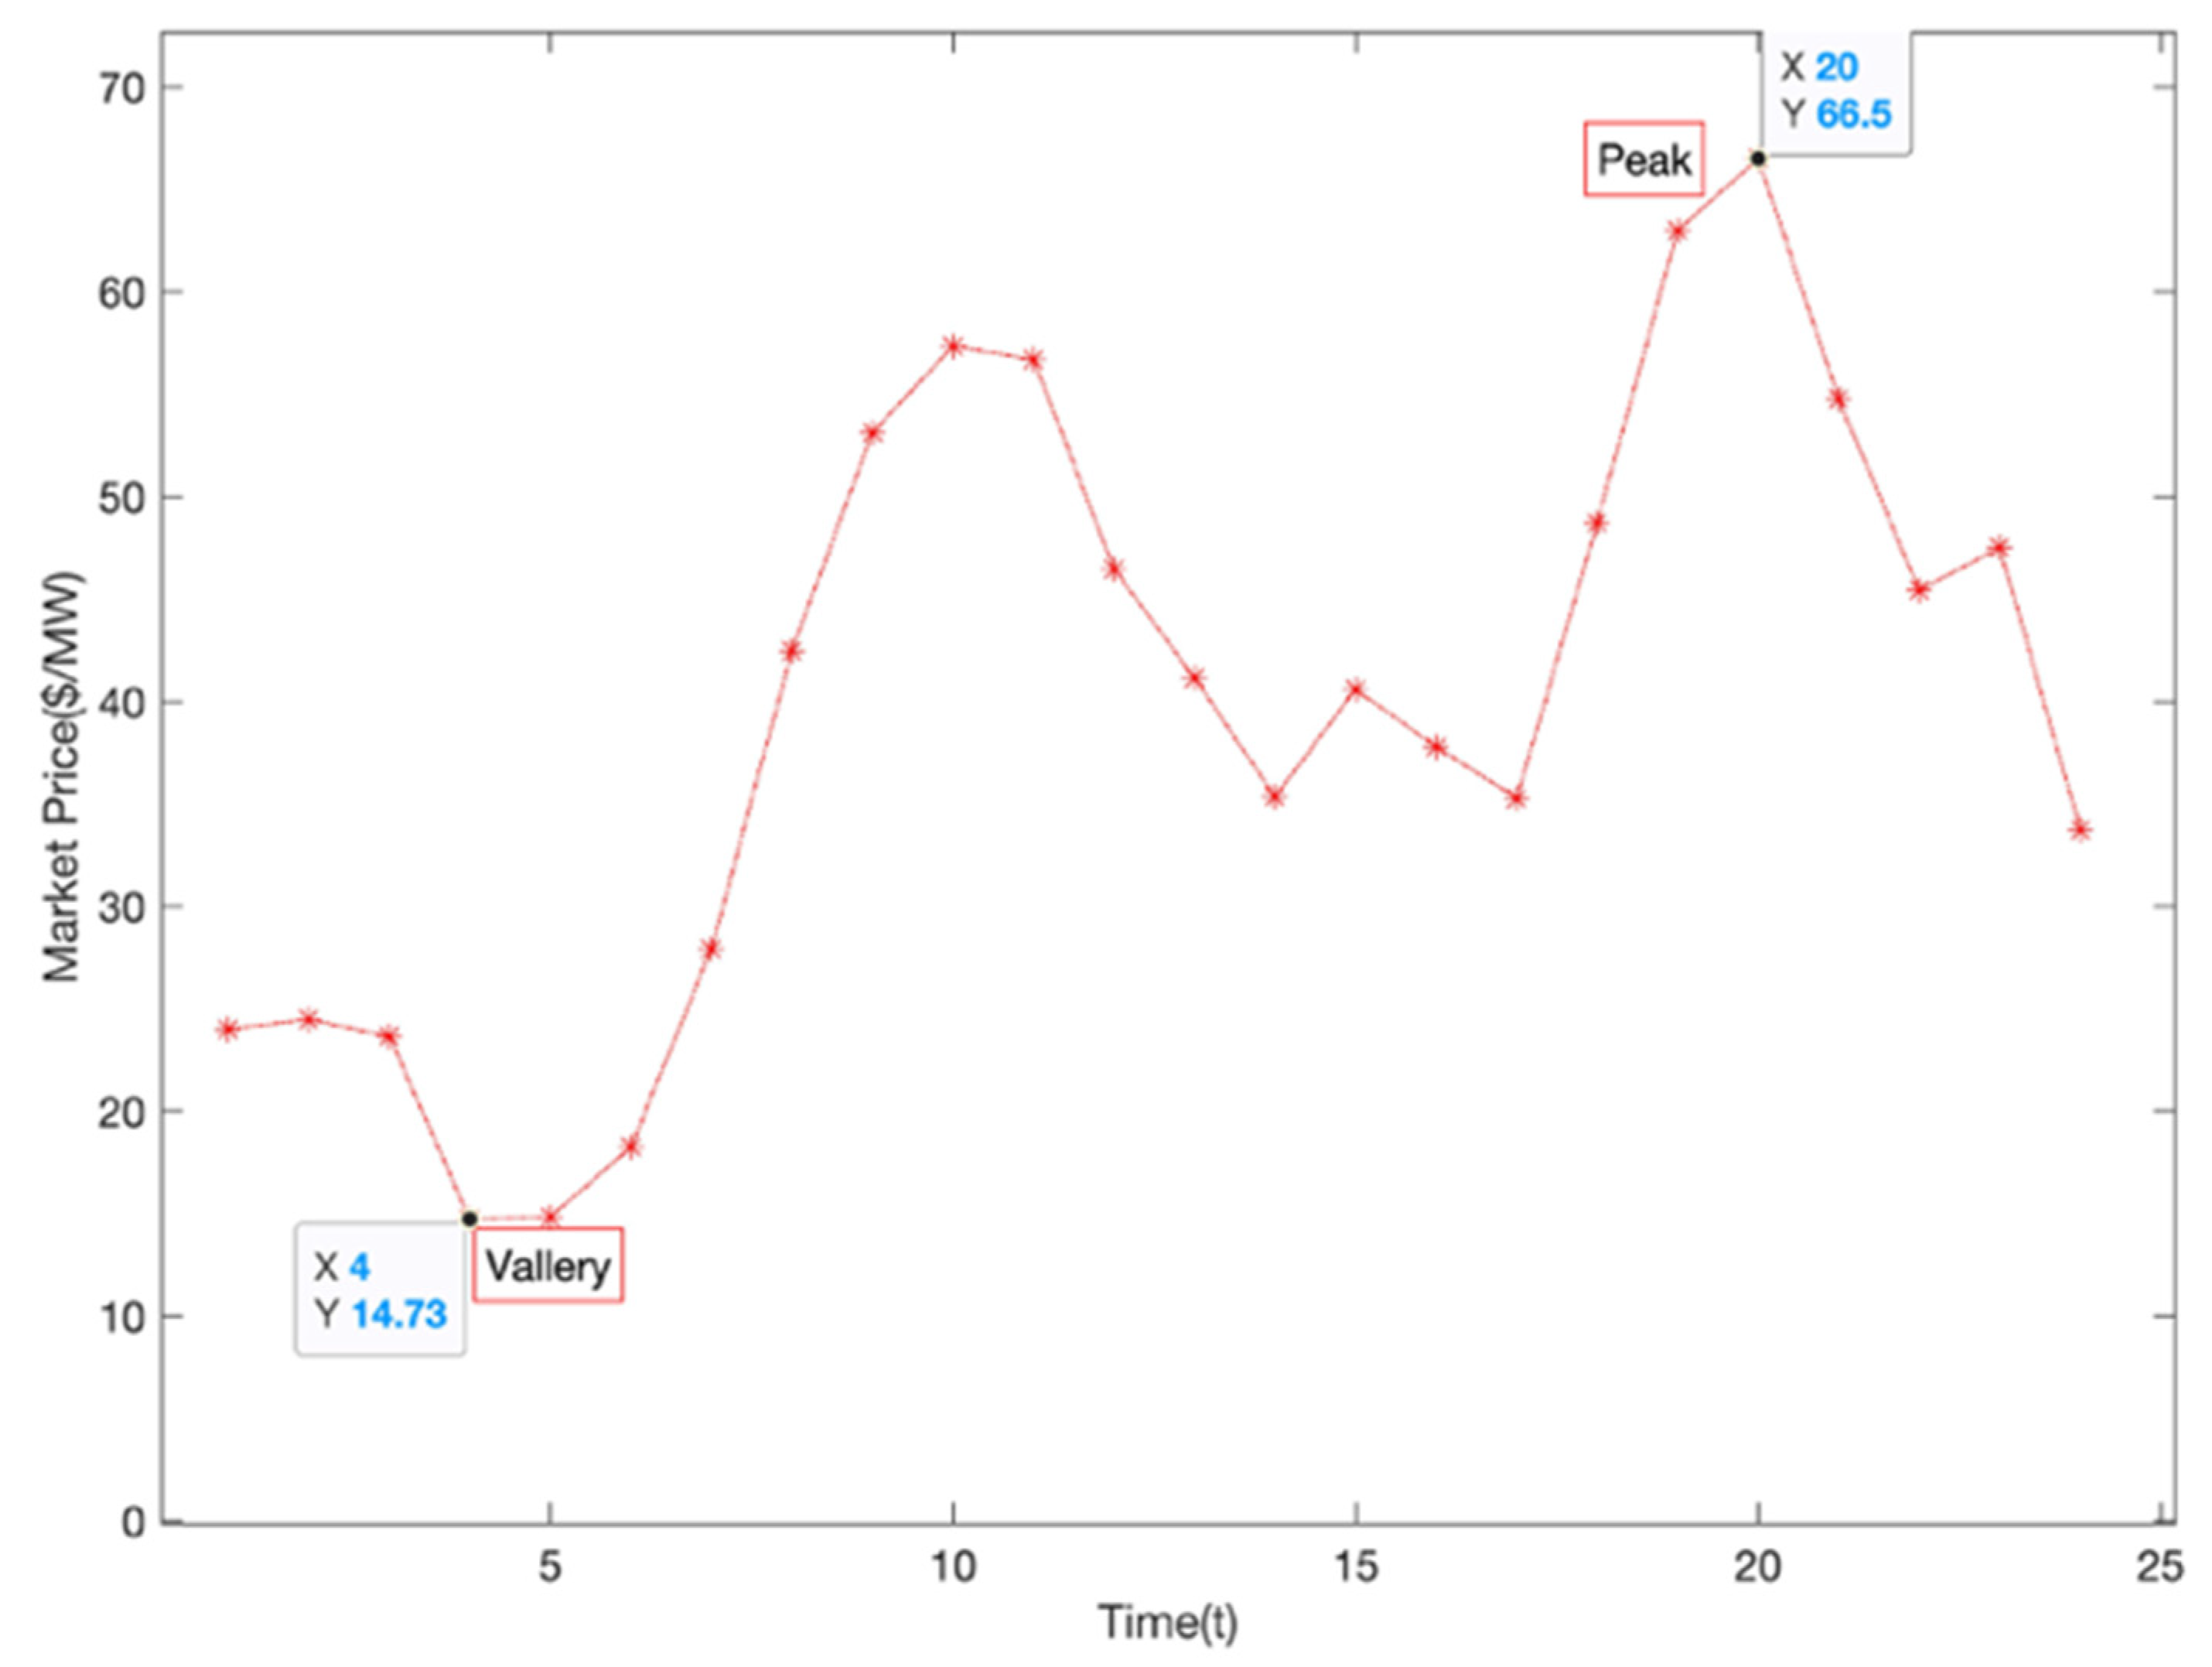
4.1. Electricity Spot Price Data

The electricity spot price is from the European Power Exchange (EPEX SPOT) on 11 February 2020 as shown in Figure 2 below. This is a representative day of an average market day and the weather was mild. The currency of the real-time electricity price is converted to U.S. dollars ($/MW) based on real-time exchange rates. Simulation and optimisation are completed by MATLAB.
Figure 2 above shows that at 4 a.m., the electricity price reached a trough value, which was 14.73 $/MW. and there were two peak electricity prices at 3.00 p.m. and 8.00 p.m. In the following analysis, the fluctuation of electricity prices will be combined to explain the charging behavior of EV users and the impact on the profit of aggregators.

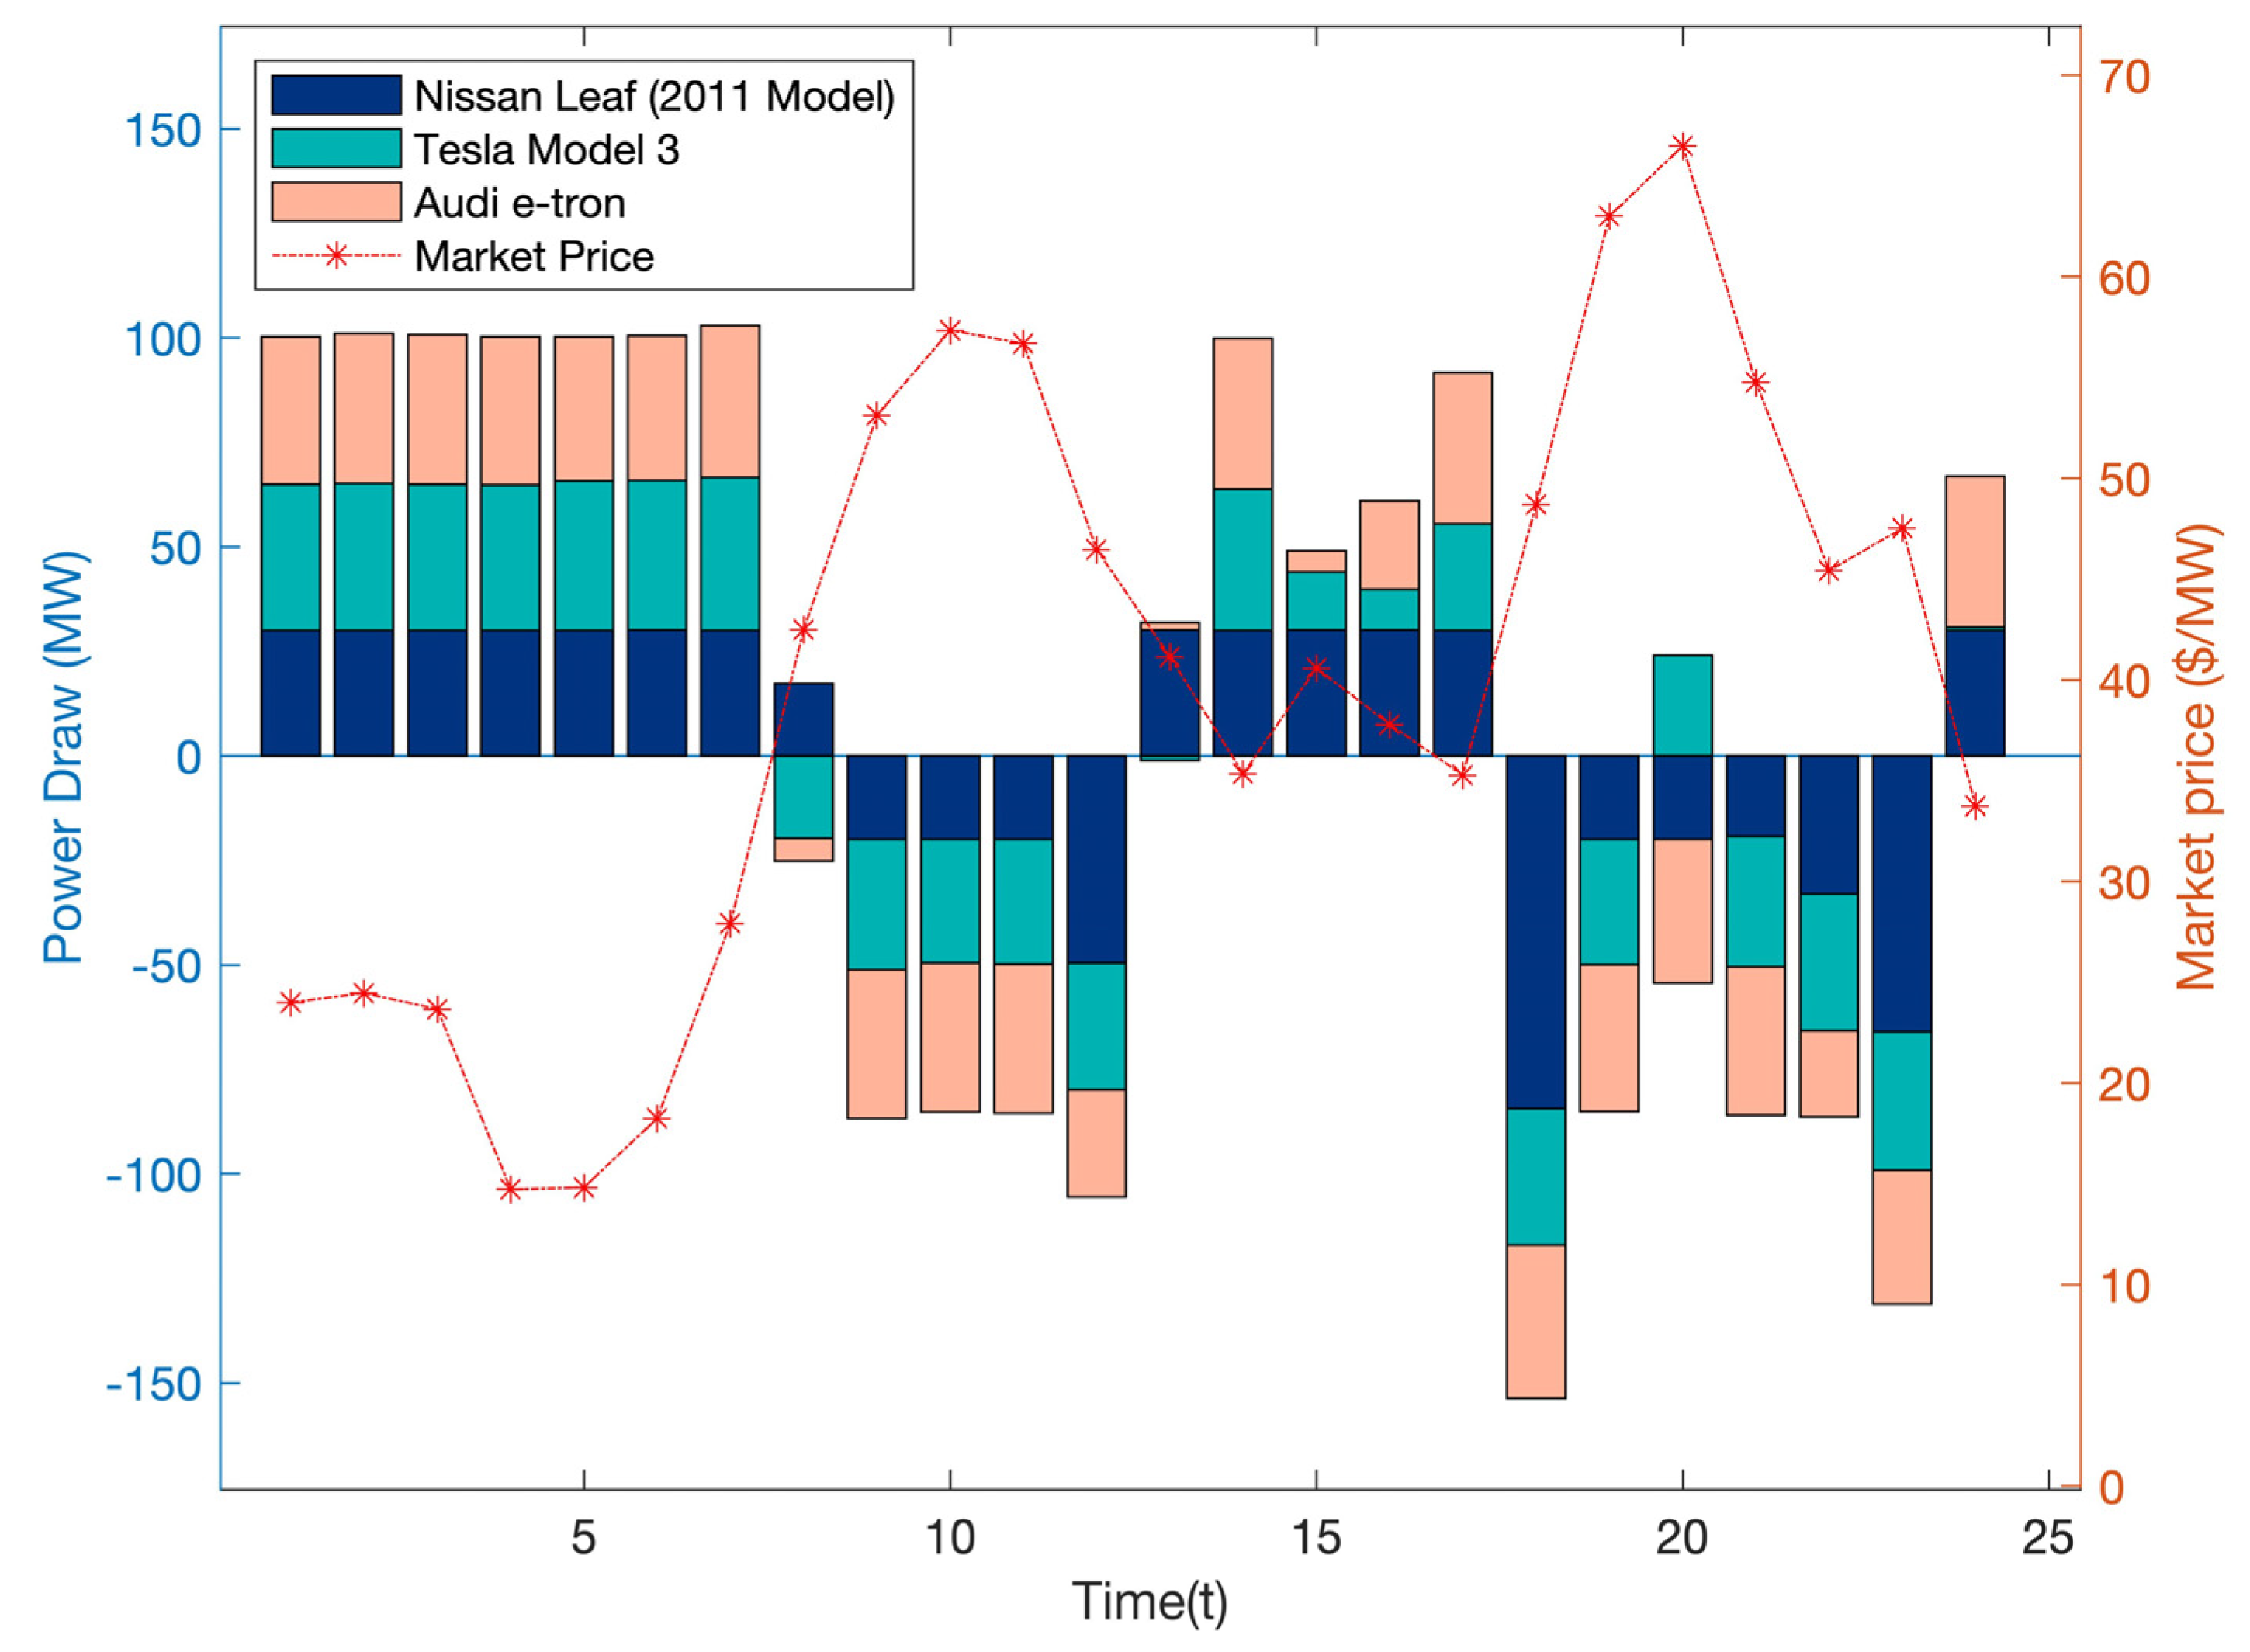
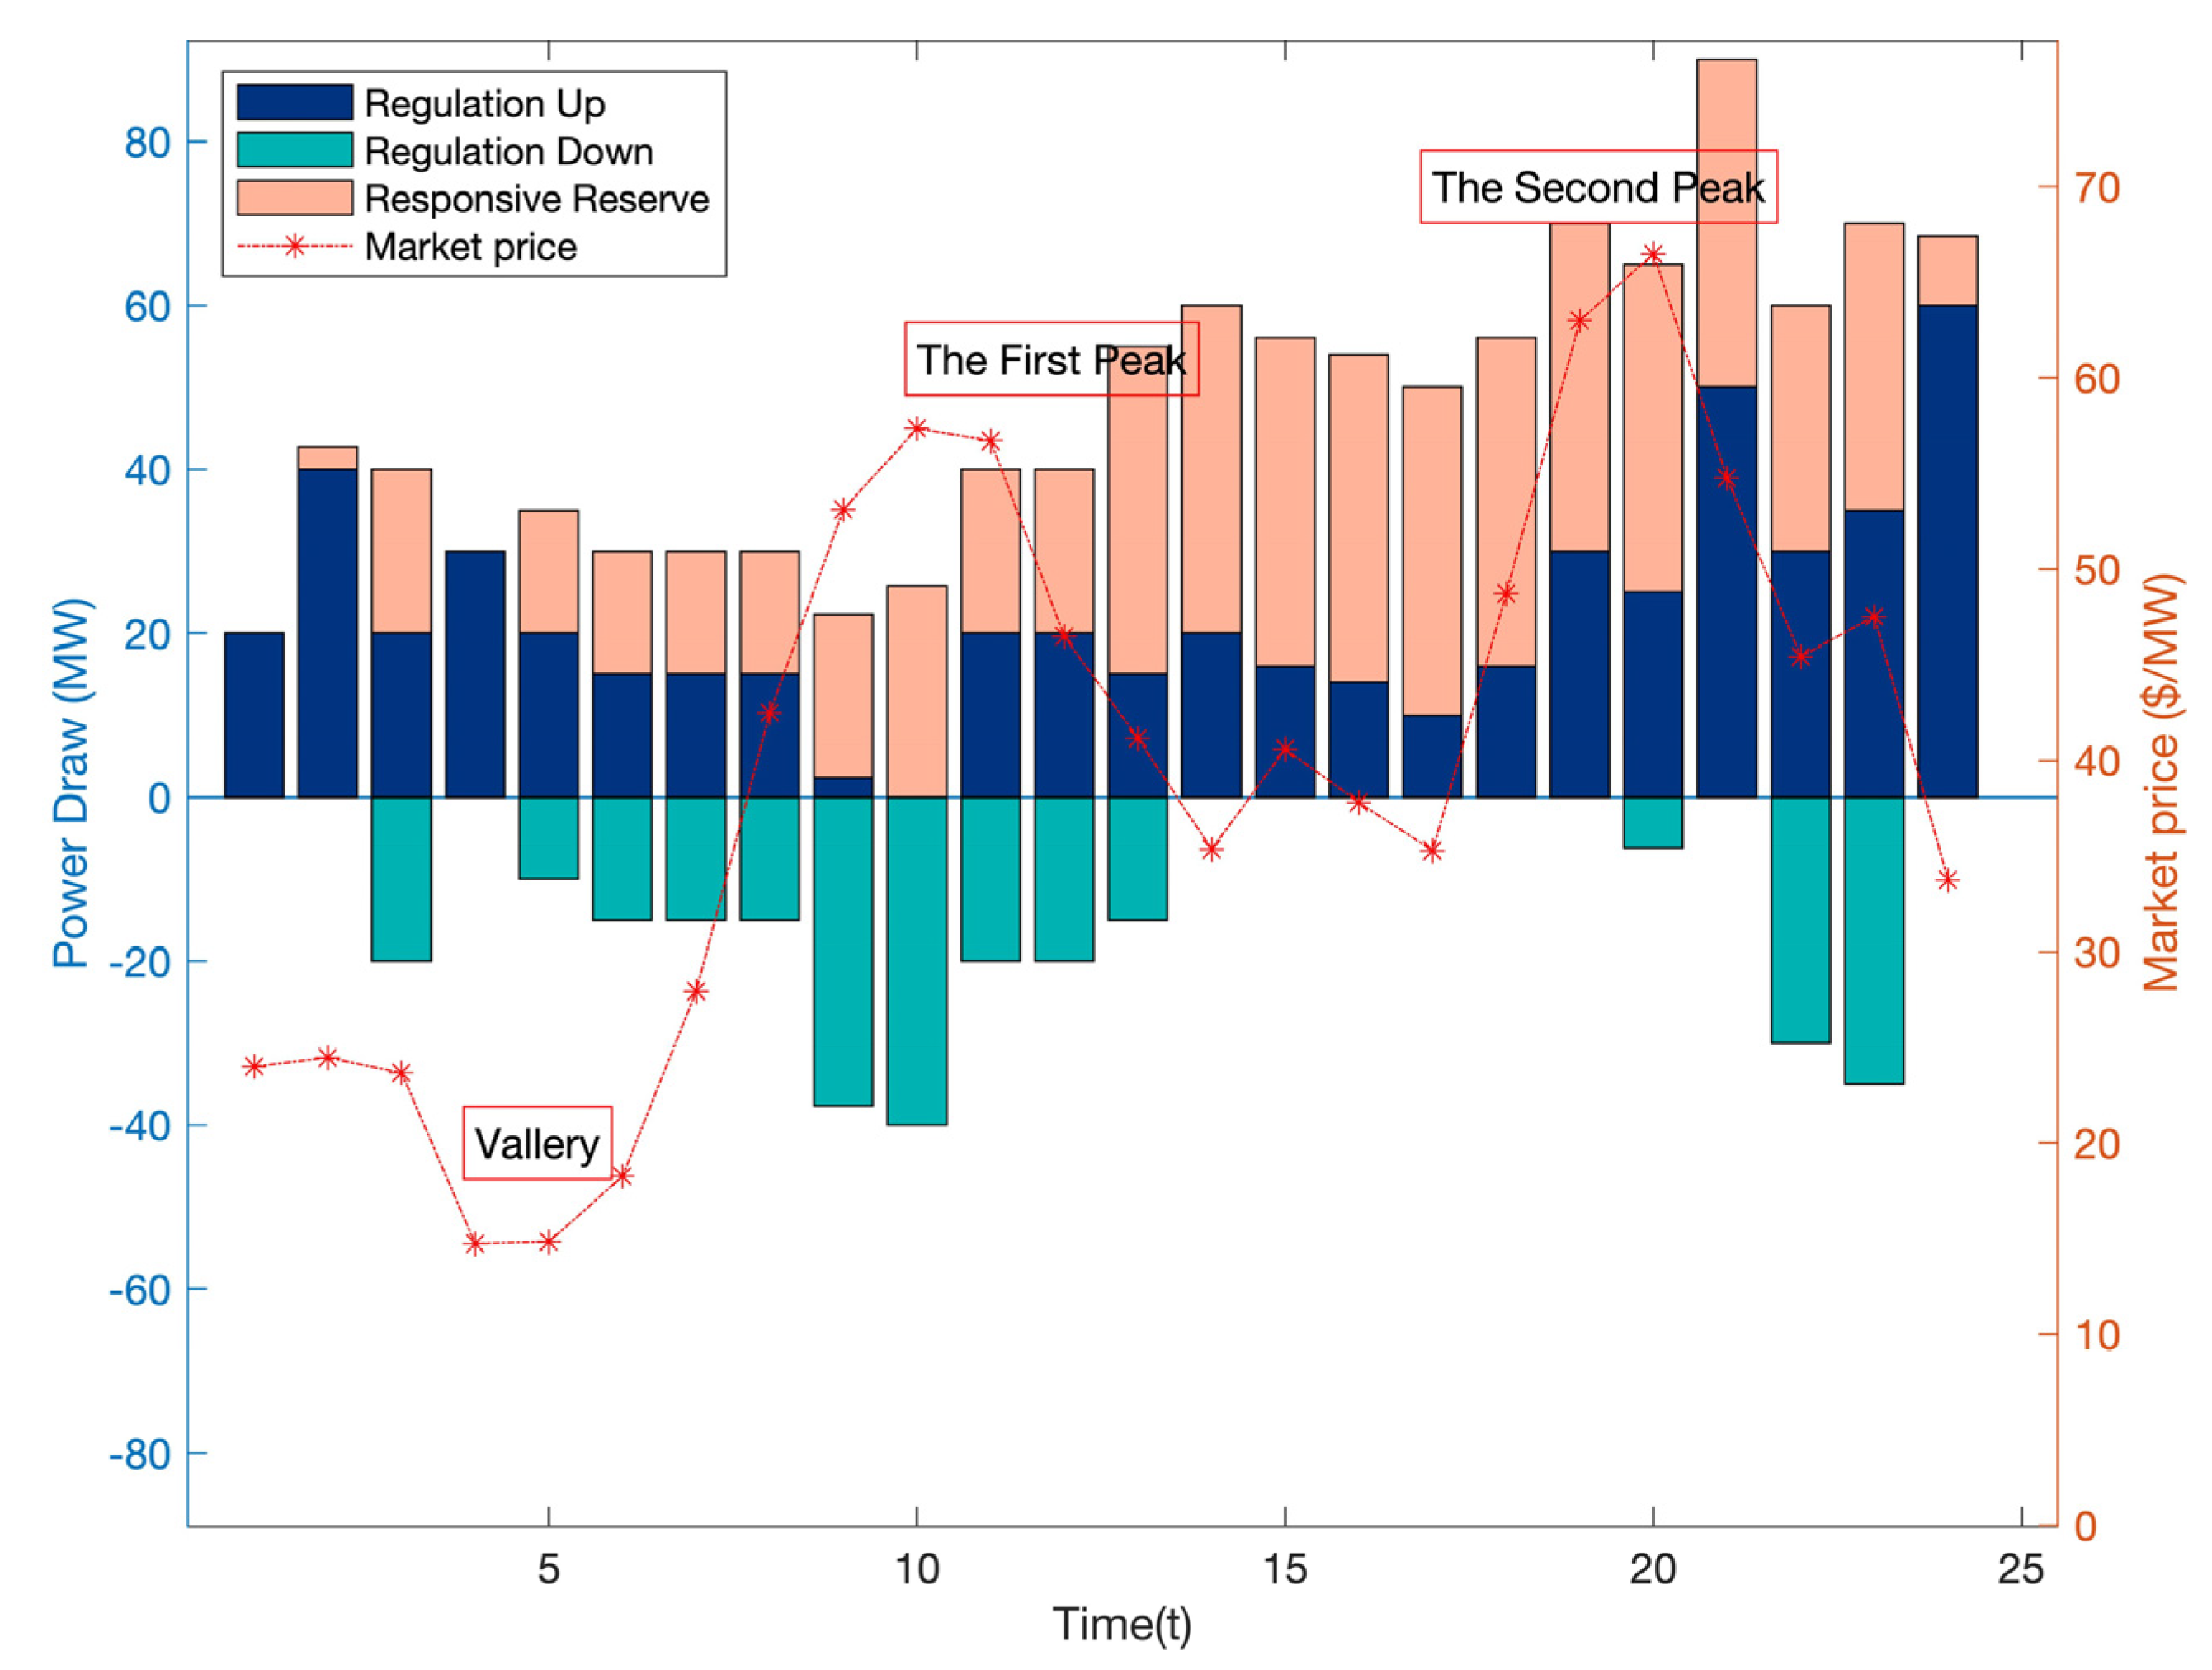
4.2. Application of a BASIC Bi-Level Service Scheduling Method

Based on the electricity market price shown in Figure 2, this paper conducts a bi-level model case study on three different brands of cars, in which the profit of electric vehicle owners needs to be considered. The result of the preferred operating point is shown in Figure 3.
In the first and second valleys of market prices, electric vehicles will be limited by battery capacity and maximum charge/discharge rates. According to the simulation results shown in Figure 3, if a bi-level model is adopted, the profit of electric vehicle owners must be considered. From midnight to 7 a.m., the load generated by the three types of car charging is similar, which means that the charging behavior of the three different types of cars during this period is similar. However, as time goes by, a large number of EVs migrate from residential areas to workplaces when they arrive at work. From 9.00 a.m. to 11.00 a.m., these three types of cars all participated in the V2G mode, which means that the EV is used as an energy storage device to reverse charge. This eased the grid load during this period. The changes in electricity market prices lead to changes in charging behavior, which resulting in different power draws. These changes are gradually reflected after 12.00 p.m. in Figure 4.

4.3. Uncertainties of EV Charging Behavior

The time when an electric vehicle is connected to the power grid and when it leaves the grid is random [9]. Due to uncertainty in the driving habits of EV owners, many studies have adopted truncated Gaussian distributions as input. The following equation describes the probability of occurrence of each EV behavior. Table 1 lists the probability distribution of electric vehicle behavior.
Electric car owners tend to charge during the low market price, the charging behavior of EV owners to Nissan Leaf (2011 model), Tesla Model 3 (long range) and Audi e-tron are similar according to the results, so a case will be presented on the Audi e-tron model only.
It can be seen from Figure 5 that the time for the EV to leave the original location and arrive at the second location is around 9 a.m., and the market price reaches the first peak at 10.30 a.m. within a day. As market prices rise, aggregators will decide to start V2G and sell energy at high prices. By contrast, around 8 p.m., although the market price reached the second peak on the day, the electric cars are usually still in a charging state.
The figure above shows the results of regulation up, regulation down and responsive reserve power scheduling. Since only a few electric vehicles choose to park overnight, the sensitivity is high at night. The overall trend is a negative correlation between market prices and liquidation behavior. By contrast, the relationship between charging behavior and market price is positively correlated.

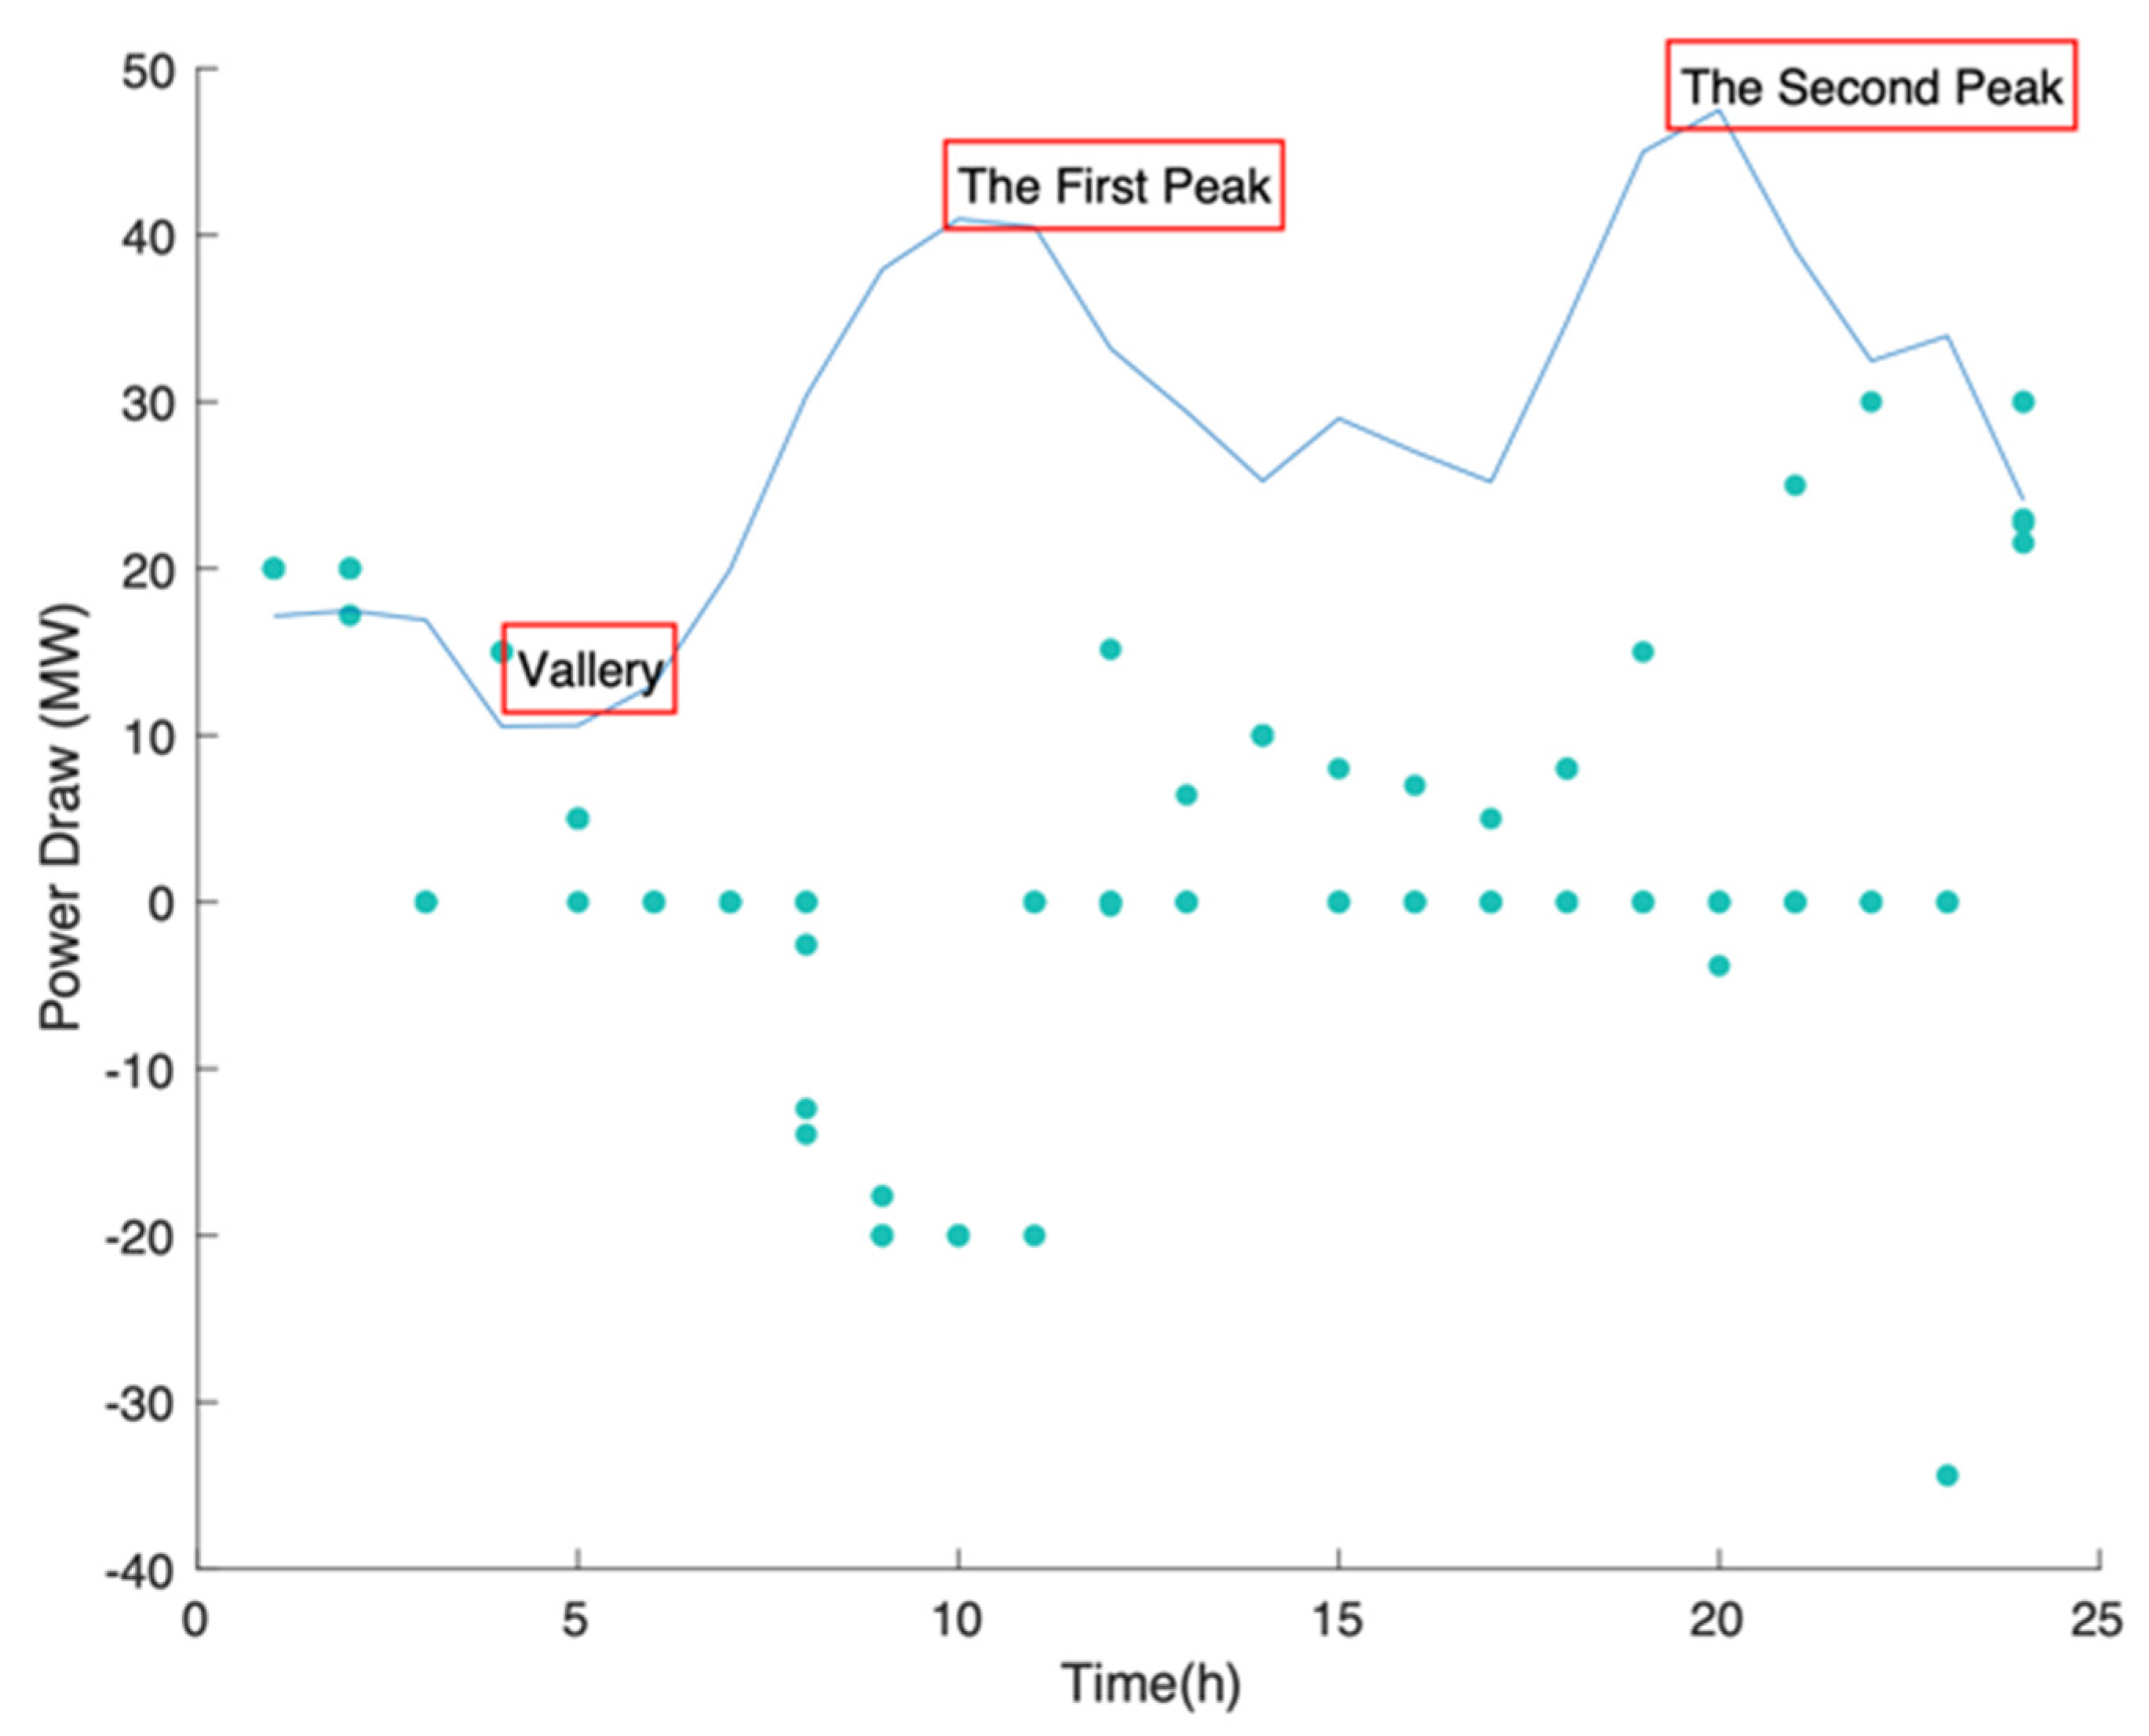
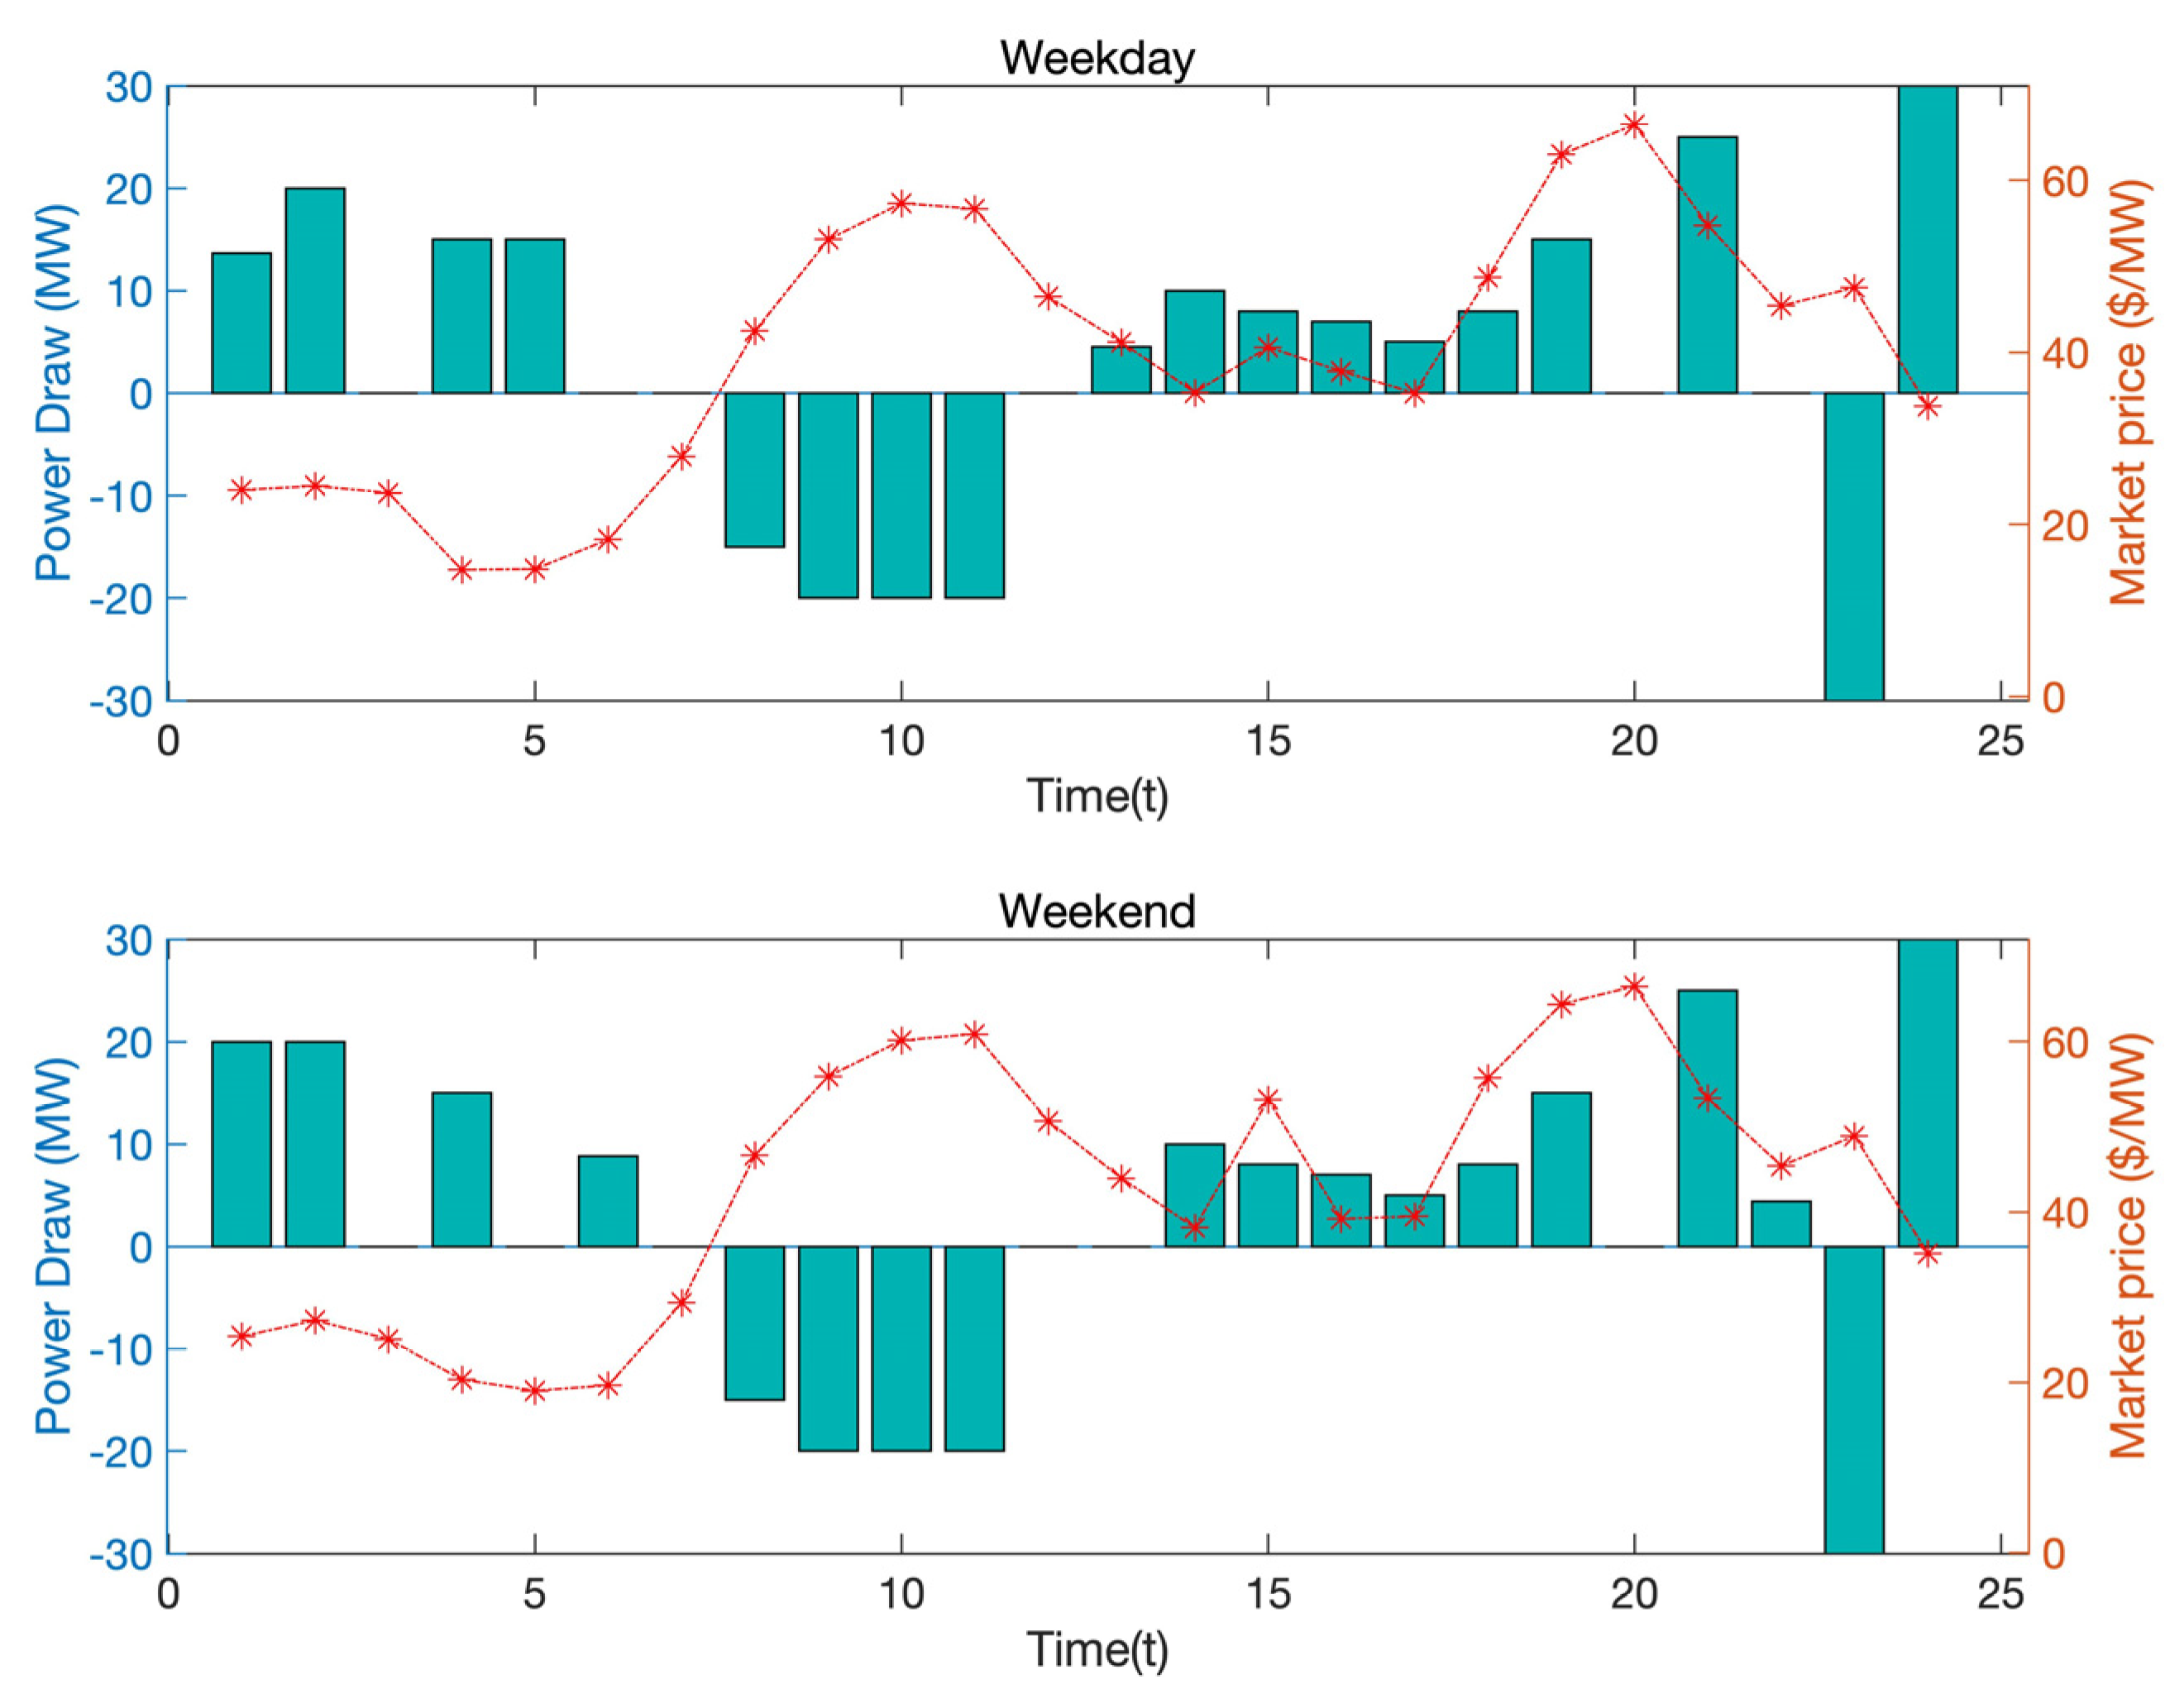
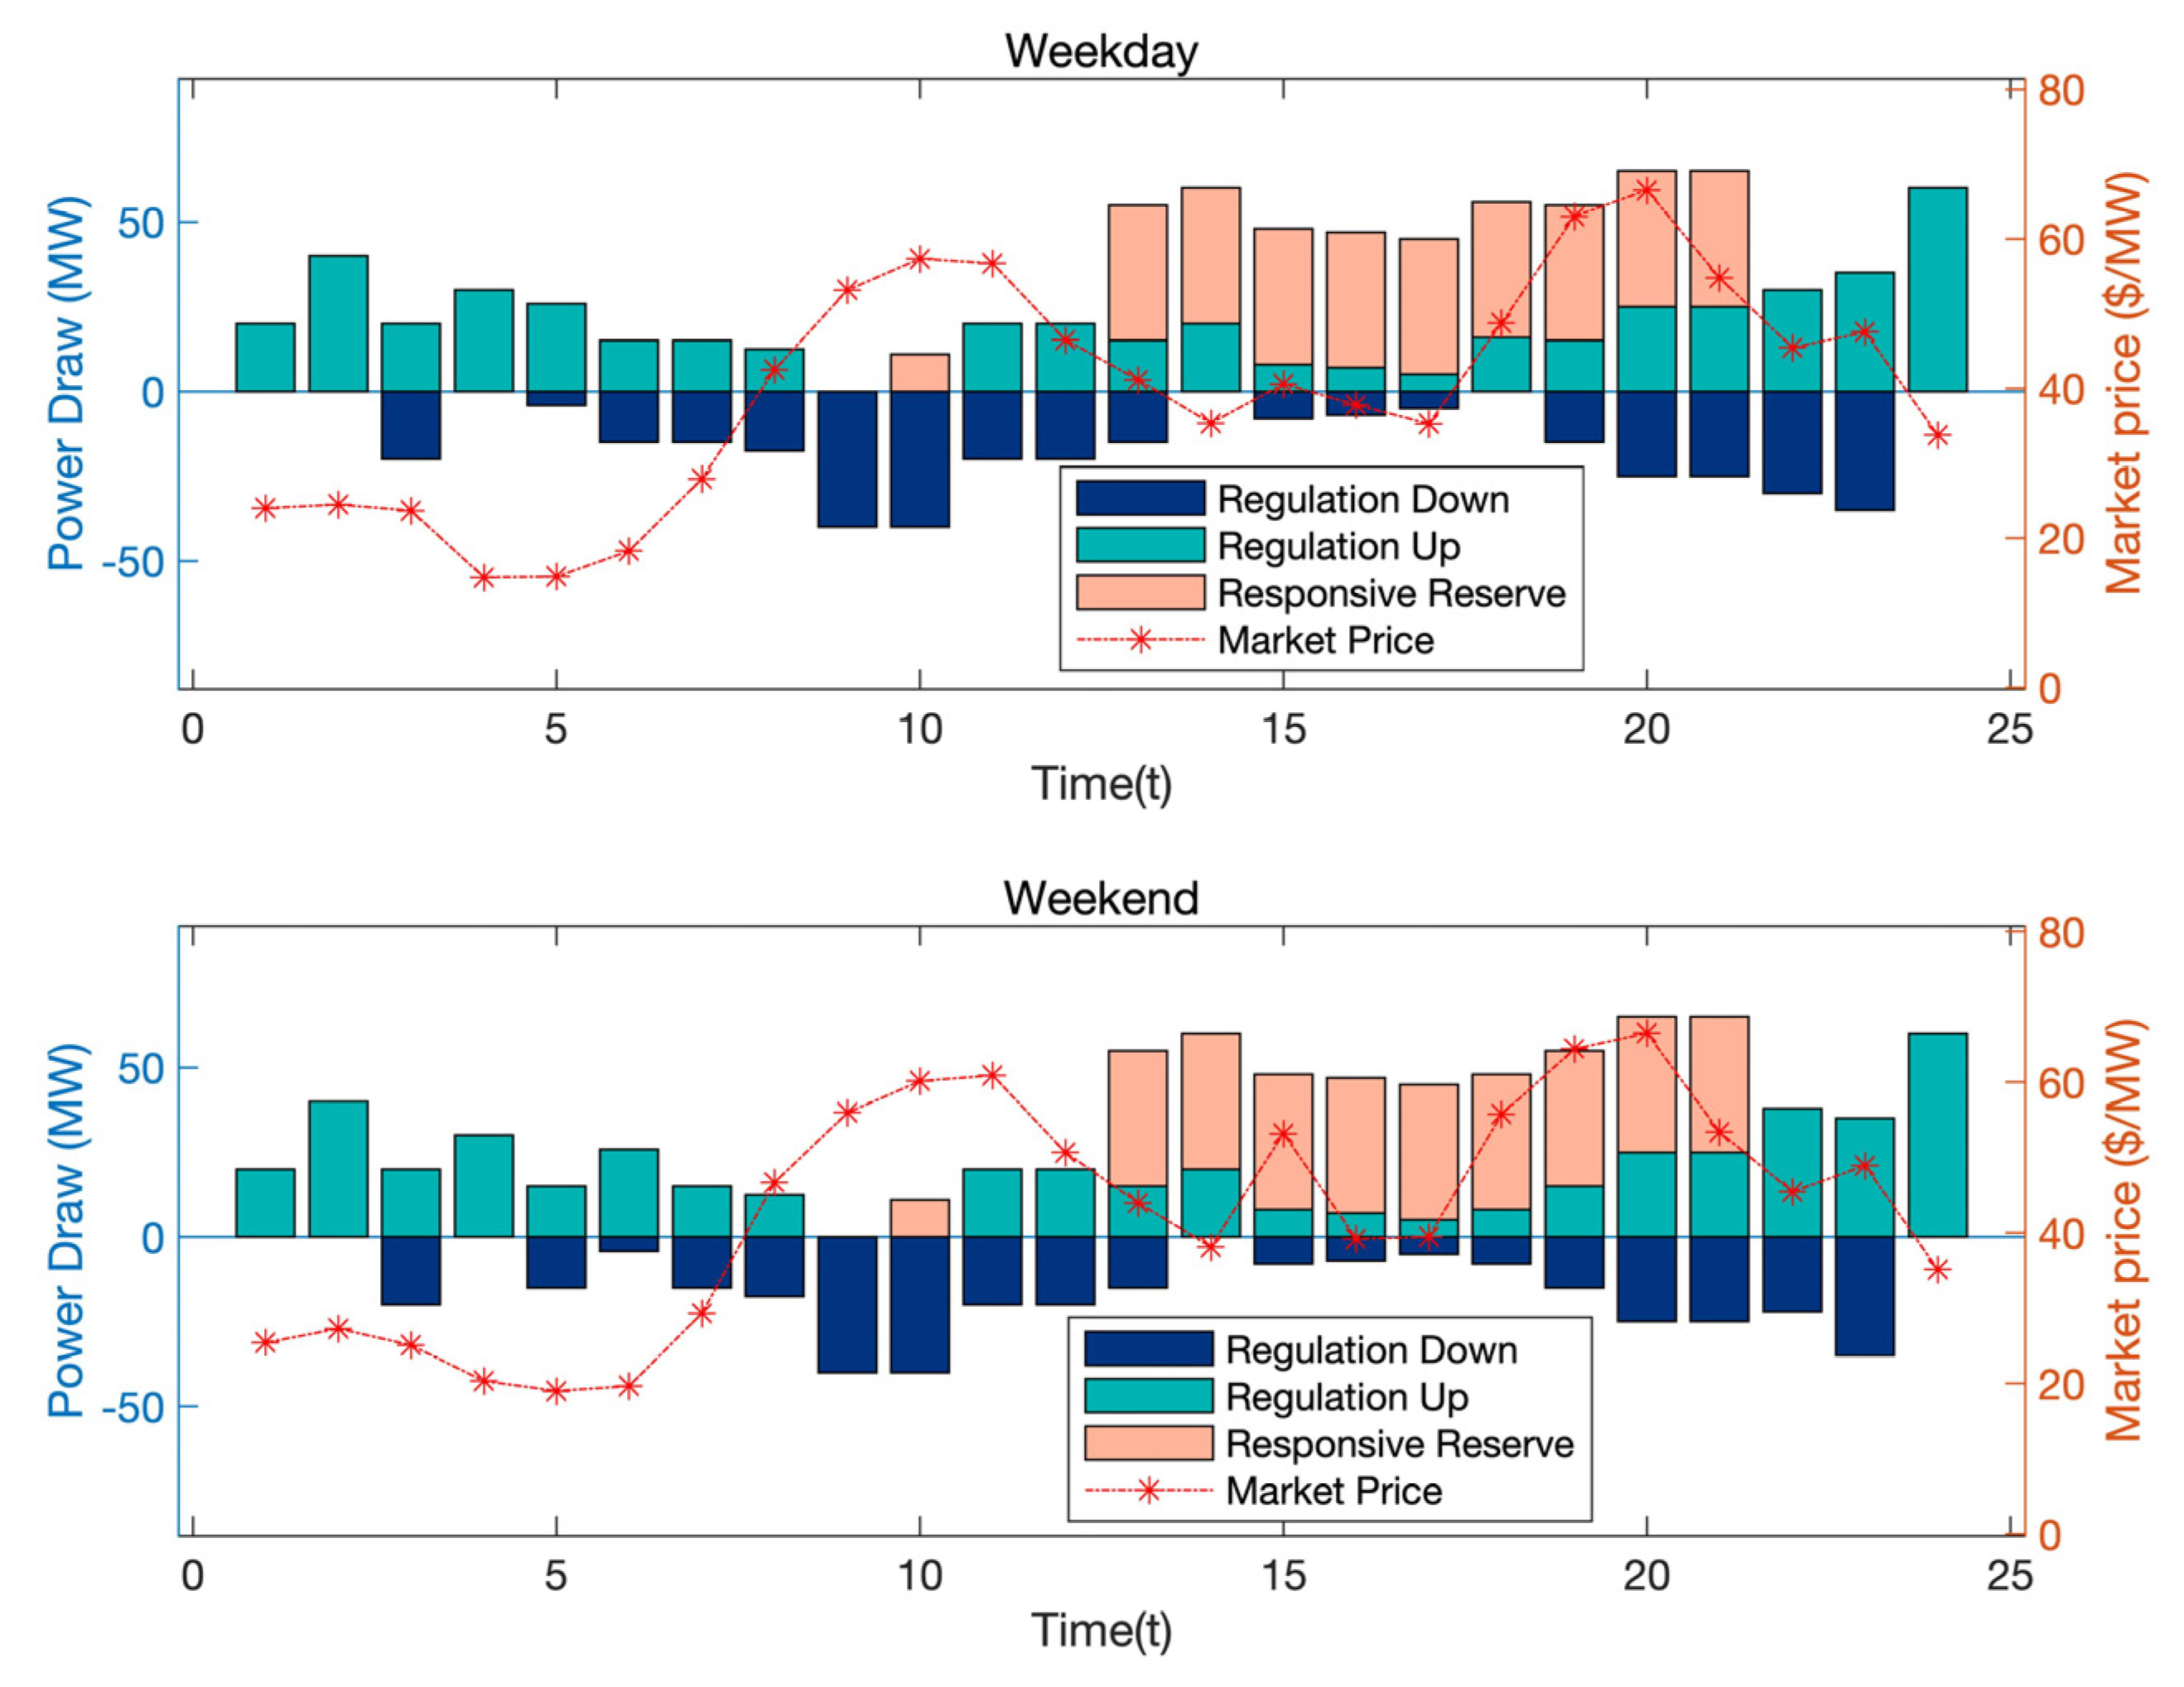
4.4. The Different Result of Peak Time and Workdays

The market price of Figure 6 comes from EPEX SPOT. This paper uses data from 11 February 2020 and 4 April 2020 (Easter). The average market price is greater than the working day. However, most families prefer to travel during weekends, which means more electric cars will be parked in the international airport parking lot. Therefore, the aggregator has more dispatchable electric vehicles during the holidays or weekends.
Figure 7 presents the simulation results for the impact of the number of EVs and market prices on the charging behavior of electric vehicles. The workday profit is $8947 approximately and $52,334 in weekends.
At the same time, Figure 8 shows the proportion of regulation down, regulation up and responsive reserve on weekdays and weekends. Compared to working days, the proportion of response reserves has increased by approximately 5%. The basic trend of electric vehicle behavior is the same as before. However, as passenger traffic increases during the weekends, aggregators can arrange more dispatchable electric vehicles. Therefore, the average power consumption is greater than the working day. When the number of electric vehicles reaches a certain level, the percentage of battery deregulation costs in total profits will decrease. In other words, aggregators will earn more profits during holidays than workdays.

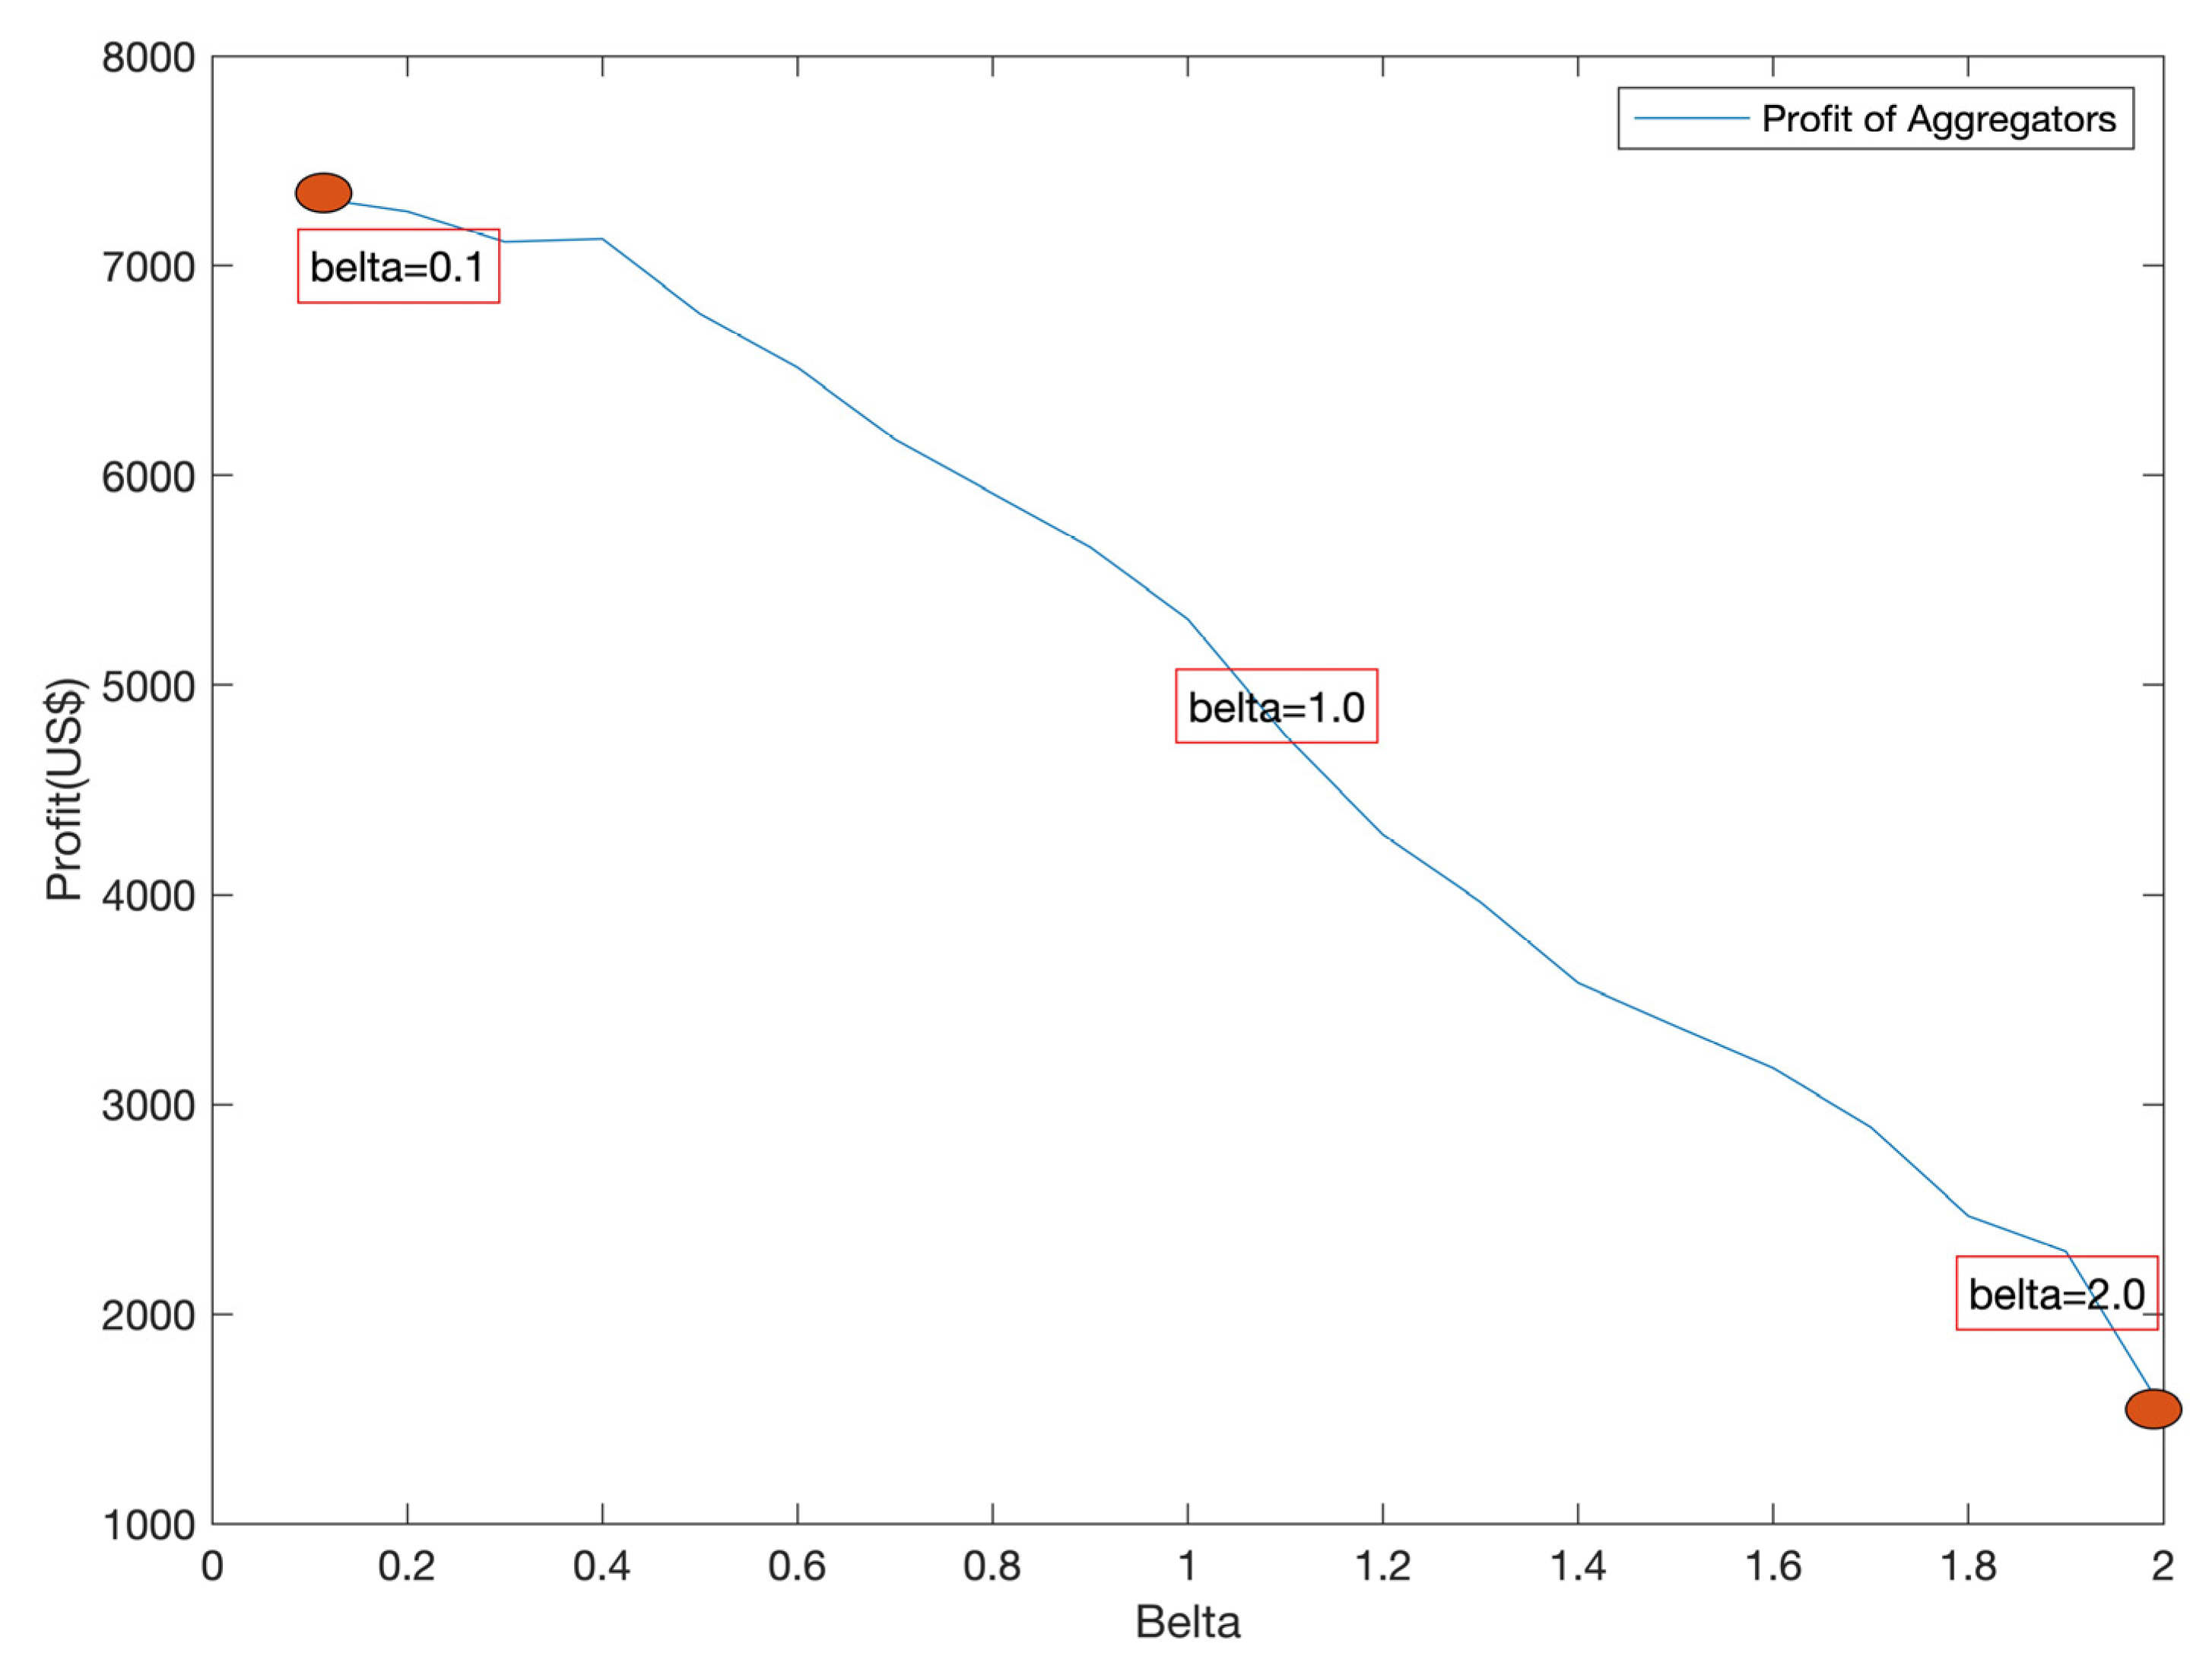
4.5. Conditional Risk Sensitivity Analysis

Figure 9 shows the influence of risk aversion parameters on the optimal project. Change the risk aversion parameter from 0.1 to 2.0 in the objective function of the upper-level model.
The daily profit of the parking lot is $7329 when the risk aversion parameter is equal to 0.1. As the risk aversion parameters decrease, the profit of the aggregator will decrease. The daily profit of the parking lot is only about $1536 when the risk aversion parameter is equal to 2.0. Aggregators can obtain more profits through lower risk aversion parameters. Therefore, it is recommended that the aggregator operate under lower risk aversion.

5. Conclusions

This paper addresses the challenges in risk mitigation of EV charging available and battery degradation via CVaR. EV users have different behaviors of using electric vehicles on weekdays and weekends, which leads to uncertainty in the charging behavior of EVs. The proposed model has considered the risk of loss of revenue due to lack of vehicle charging capacity to provide service and EV battery degradation. A bi-level optimisation was formulated to determine a preferred operating point of charging for an individual EV with consideration of the uncertainties. The KKT method was used to decompose the problem and the impact of risk aversion was also analyzed. The performance of the proposed method has been evaluated through a case study on the Birmingham International Airport parking lot with onsite renewable generation.
From the results of the case study, the profit of the aggregator on weekends is 5% greater than that on weekdays. According to different charging behaviors on weekdays and weekends, the aggregator can provide different modes of operation, such as providing incentives to encourage all electric cars parked in the parking lot and participate in ancillary services. Uncertainty research is an extension of the basic model that can make research more precise. As the risk aversion parameters decrease, the profit of the aggregator will decrease, which means that the profit of the aggregator is proportional to the risk coefficient. Therefore, finding a suitable risk coefficient for any aggregator can balance the profit and risk.

Author Contributions

Conceptualization, Y.W., Z.J. and J.L.; methodology, Y.W. and J.L.; software, Y.W. and Z.J.; validation, Y.W.; formal analysis, Z.J., J.L., X.Z. and R.Z.; investigation, Y.W., Z.J. and J.L.; resources, Y.W., Z.J., J.L., X.Z. and R.Z.; data curation, Y.W., Z.J. and J.L.; writing—original draft preparation, Y.W.; writing—review and editing, Z.J., J.L., X.Z. and R.Z.; supervision, J.L. and X.Z. All authors have read and agreed to the published version of the manuscript.

Funding

This research was sponsored by UKRI Engineering and Physical Sciences Research Council under research grant EP/N032888/1 and EP/L017725/1.

Institutional Review Board Statement

Not applicable.

Informed Consent Statement

Not applicable.

Data Availability Statement

Not applicable.

Conflicts of Interest

The authors declare no conflict of interest.

References

  1. Kempton, W.; Tomić, J. Vehicle-to-grid power implementation: From stabilizing the grid to supporting large-scale renewable energy. J. Power Sources 2005, 144, 280–294. [Google Scholar] [CrossRef]
  2. Liu, H.; Zhang, Y.; Zheng, S.; Li, Y. Electric Vehicle Power Trading Mechanism Based on Blockchain and Smart Contract in V2G Network. IEEE Access 2019, 7, 160546–160558. [Google Scholar] [CrossRef]
  3. Aluisio, B.; Conserva, A.; Dicorato, M.; Forte, G.; Trovato, M. Optimal operation planning of V2G-equipped Microgrid in the presence of EV aggregator. Electr. Power Syst. Res. 2017, 152, 295–305. [Google Scholar] [CrossRef]
  4. Khan, S.U.; Mehmood, K.K.; Haider, Z.M.; Bukhari, S.B.A.; Lee, S.J.; Rafique, M.K.; Kim, C.H. Energy management scheme for an EV smart charger V2G/G2V application with an EV power allocation technique and voltage regulation. Appl. Sci. 2018, 8, 648. [Google Scholar] [CrossRef] [Green Version]
  5. Kempton, W.; Udo, V.; Huber, K.; Komara, K.; Letendre, S.; Baker, S.; Pearre, N. A test of vehicle-to-grid (V2G) for energy storage and frequency regulation in the PJM system. Results Ind.-Univ. Res. Partnersh. 2008, 9–12. Available online: https://www1.udel.edu/V2G/resources/test-v2g-in-pjm-jan09.pdf (accessed on 14 September 2021).
  6. Triviño-Cabrera, A.; Aguado, J.A.; de la Torre, S. Joint routing and scheduling for electric vehicles in smart grids with V2G. Energy 2019, 175, 113–122. [Google Scholar] [CrossRef]
  7. Mouli, G.R.C.; Kefayati, M.; Baldick, R.; Bauer, P. Integrated PV charging of EV fleet based on energy prices, V2G, and offer of reserves. IEEE Trans. Smart Grid 2017, 10, 1313–1325. [Google Scholar] [CrossRef]
  8. Pillai, J.R.; Bak-Jensen, B. Integration of Vehicle-to-Grid in the Western Danish Power System. IEEE Trans. Sustain. Energy 2010, 2, 12–19. [Google Scholar] [CrossRef]
  9. Shafie-khah, M.; Heydarian-Forushani, E.; Osório, G.J.; Gil, F.A.; Aghaei, J.; Barani, M.; Catalão, J.P. Optimal Behavior of Electric Vehicle Parking Lots as Demand Response Aggregation Agents. IEEE Trans. Smart Grid 2016, 7, 2654–2665. [Google Scholar] [CrossRef]
  10. Moradijoz, M.; Moghaddam, M.P.; Haghifam, M.; Alishahi, E. A multi-objective optimization problem for allocating parking lots in a distribution network. Int. J. Electr. Power Energy Syst. 2013, 46, 115–122. [Google Scholar] [CrossRef]
  11. Hafez, O.; Bhattacharya, K. Optimal design of electric vehicle charging stations considering various energy resources. Renew. Energy 2017, 107, 576–589. [Google Scholar] [CrossRef]
  12. Fazelpour, F.; Vafaeipour, M.; Rahbari, O.; Rosen, M.A. Intelligent optimization to integrate a plug-in hybrid electric vehicle smart parking lot with renewable energy resources and enhance grid characteristics. Energy Convers. Manag. 2013, 77, 250–261. [Google Scholar] [CrossRef]
  13. Zhang, Y.; Zhang, Q.; Farnoosh, A.; Chen, S.; Li, Y. GIS-Based Multi-Objective Particle Swarm Optimization of charging stations for electric vehicles. Energy 2018, 169, 844–853. [Google Scholar] [CrossRef]
  14. Szinai, J.; Sheppard, C.J.; Abhyankar, N.; Gopal, A.R. Reduced grid operating costs and renewable energy curtailment with electric vehicle charge management. Energy Policy 2019, 136, 111051. [Google Scholar] [CrossRef]
  15. Aliasghari, P.; Mohammadi-Ivatloo, B.; Alipour, M.; Abapour, M.; Zare, K. Optimal scheduling of plug-in electric vehicles and renewable micro-grid in energy and reserve markets considering demand response program. J. Clean. Prod. 2018, 186, 293–303. [Google Scholar] [CrossRef]
  16. Rui, T.; Hu, C.; Li, G.; Tao, J.; Shen, W. A distributed charging strategy based on day ahead price model for PV-powered electric vehicle charging station. Appl. Soft Comput. 2019, 76, 638–648. [Google Scholar] [CrossRef]
  17. Gopal, A.R.; Park, W.Y.; Witt, M.; Phadke, A. Hybrid- and battery-electric vehicles offer low-cost climate benefits in China. Transp. Res. Part D Transp. Environ. 2018, 62, 362–371. [Google Scholar] [CrossRef]
  18. Choi, H.; Shin, J.; Woo, J. Effect of electricity generation mix on battery electric vehicle adoption and its environmental impact. Energy Policy 2018, 121, 13–24. [Google Scholar] [CrossRef]
  19. Rotering, N.; Ilic, M.D. Optimal Charge Control of Plug-In Hybrid Electric Vehicles in Deregulated Electricity Markets. IEEE Trans. Power Syst. 2010, 26, 1021–1029. [Google Scholar] [CrossRef]
  20. Vagropoulos, S.I.; Bakirtzis, A. Optimal Bidding Strategy for Electric Vehicle Aggregators in Electricity Markets. IEEE Trans. Power Syst. 2013, 28, 4031–4041. [Google Scholar] [CrossRef]
  21. Wu, H.; Shahidehpour, M.; AlAbdulwahab, A.; Abusorrah, A. A Game Theoretic Approach to Risk-Based Optimal Bidding Strategies for Electric Vehicle Aggregators in Electricity Markets with Variable Wind Energy Resources. IEEE Trans. Sustain. Energy 2015, 7, 374–385. [Google Scholar] [CrossRef]
  22. Wu, J.; Wu, Z.; Wu, F.; Tang, H.; Mao, X. CVaR risk-based optimization framework for renewable energy management in distribution systems with DGs and EVs. Energy 2018, 143, 323–336. [Google Scholar] [CrossRef]
  23. Paul, S.; Padhy, N.P. Resilient Scheduling Portfolio of Residential Devices and Plug-In Electric Vehicle by Minimizing Conditional Value at Risk. IEEE Trans. Ind. Inform. 2018, 15, 1566–1578. [Google Scholar] [CrossRef]
  24. Zeng, B.; Dong, H.; Xu, F.; Zeng, M. Bilevel Programming Approach for Optimal Planning Design of EV Charging Station. IEEE Trans. Ind. Appl. 2020, 56, 2314–2323. [Google Scholar] [CrossRef]
  25. Khan, S.U.; Mehmood, K.K.; Haider, Z.M.; Rafique, M.K.; Kim, C.-H. A Bi-Level EV Aggregator Coordination Scheme for Load Variance Minimization with Renewable Energy Penetration Adaptability. Energies 2018, 11, 2809. [Google Scholar] [CrossRef] [Green Version]
  26. Hu, J.; Li, H. A New Clustering Approach for Scenario Reduction in Multi-Stochastic Variable Programming. IEEE Trans. Power Syst. 2019, 34, 3813–3825. [Google Scholar] [CrossRef]
  27. Wang, Q.; Wang, J.; Guan, Y. Price-Based Unit Commitment with Wind Power Utilization Constraints. IEEE Trans. Power Syst. 2013, 28, 2718–2726. [Google Scholar] [CrossRef]
  28. Bai, X.; Qiao, W. Robust Optimization for Bidirectional Dispatch Coordination of Large-Scale V2G. IEEE Trans. Smart Grid 2015, 6, 1944–1954. [Google Scholar] [CrossRef] [Green Version]
  29. Clairand, J.-M.; Rodriguez-Garcia, J.; Alvarez-Bel, C. Smart Charging for Electric Vehicle Aggregators Considering Users’ Preferences. IEEE Access 2018, 6, 54624–54635. [Google Scholar] [CrossRef]
  30. Department for Transport. Vehicles Registered for the First Time by Make and Model: Great Britain and United Kingdom. London, UK, 2020. [Google Scholar]
Figure 1. (a) Relationship between preferred operating point and ancillary services capacities (battery power draw); (b) Relationship between preferred operating point and ancillary services capacities (battery power draw).
Energies 14 07015 g001
Figure 2. Market price of 11 February 2020 (Data from: EPEX SPOT).
Energies 14 07015 g002
Figure 3. Result of different operating point under 3 different kinds of electric vehicle (EV) in bi-level model.
Energies 14 07015 g003
Figure 4. The preferred operating point of Audi e-tron when considering uncertainties.
Energies 14 07015 g004
Figure 5. The regulation/responsive reserve result of Audi e-tron when considering uncertainties.
Energies 14 07015 g005
Figure 6. Comparison of preferred operating point of Audi e-tron.
Energies 14 07015 g006
Figure 7. Comparison of regulation and responsive reserve result of Audi e-tron.
Energies 14 07015 g007
Figure 8. Proportion of regulation and reserve result of Audi e-tron.
Energies 14 07015 g008
Figure 9. The profit of aggregators with the influence by risk aversion parameter.
Energies 14 07015 g009
Table 1. Probability distribution of electric vehicle behavior.
SymbolMeanStandard DeviationMaxMin
Initial State of Charge (%)50207020
Arrive time (h)84146
Departure time (h)1642412
Publisher’s Note: MDPI stays neutral with regard to jurisdictional claims in published maps and institutional affiliations.

