Article

Experimental Measurements of Wax Precipitation Using a Modified Method of Simultaneous Centrifugation and High-Temperature Gas Chromatography

1
Petroleum Engineering School, Southwest Petroleum University, Chengdu 610500, China
2
Petroleum, Oil and Lubricants Department, Army Logistics Academy, Chongqing 401311, China
*
Authors to whom correspondence should be addressed.
Energies 2021, 14(21), 7035; https://doi.org/10.3390/en14217035
Submission received: 21 September 2021 / Revised: 28 September 2021 / Accepted: 21 October 2021 / Published: 27 October 2021

Abstract

:
Wax precipitation and deposition are serious flow assurance problems. Wax precipitation is investigated simultaneously using centrifugation and high-temperature gas chromatography (C-HTGC) to obtain the amount and component distribution of precipitated wax in artificial waxy oil and diesel at different temperatures. However, the conventional C-HTGC method gives upper measurements of the amount of precipitated wax, as it ignores wax dissolved in crude oil in the centrifugal cake. A modified C-HTGC method was developed to obtain the precipitated solid fraction of crude oil, based on the mass balances of the non-crystallized fraction of the centrifuged cake. The weight, percent and carbon number distribution of precipitated solid wax crystals at different temperatures of artificial oil and 0# diesel were obtained. It was found that wax precipitation characteristics are affected by many factors, including the carbon number distribution of the oil, the sensitivity of alkane crystallization to temperature and the temperature of the waxy oil solution. The average carbon number of alkanes in precipitated wax crystals decreases with the decrease in temperature. The distribution of alkanes in solid wax crystals is roughly the same as that in 0# diesel but slightly heavier than in diesel. Alkanes with high carbon numbers precipitate simultaneously with those with low carbon numbers.

1. Introduction

With the decrease in onshore and offshore oil and gas resources, the development of global oil and gas resources in deep water will replace strategic regional oil and gas resources [1,2]. The deep-water environment not only has strict requirements for platforms, subsea production systems and offshore work, but also poses serious challenges in terms of the length of submarine pipeline, ranging from a few kilometers to hundreds of kilometers, required to connect each satellite well, marginal oilfield and central processing facility [3,4]. Due to the low-temperature environment of the seabed (deep-sea seabed temperature is approximately 4 °C) [5], when crude oil is extracted from reservoir flows through submarine mixed-transmission pipelines, the crude oil temperature near the pipe wall drops below the wax appearance temperature (WAT), and wax molecules dissolved in the crude oil near the pipe wall crystallize and deposit on the pipe wall or form an immobile layer due to the free surface energy. Wax deposition in pipeline transportation systems reduces the effective flowing area of the pipeline, reduces the transmission capacity of the pipeline and can even lead to plugging accidents in serious cases. Wax deposition in subsea oil pipelines is a significant flow assurance problem [6,7].
The concentration difference in wax molecules between the oil flow and the surface of the deposition layer is the driving force of molecular diffusion and directly causes an increase in the wax deposition layer thickness [7]. The concentration of wax molecules in pipelines depends on the temperature and solubility of the wax in the crude oil. The solubility of wax in crude oil at different temperatures can be obtained by calculating the amount of wax in the crude oil minus the wax precipitation amount. Obviously, in order to obtain the solubility of wax in crude oil, the wax precipitation curve for different temperatures of crude oil must first be obtained. Therefore, the wax precipitation amount in crude oil is the basis for studying the wax deposition law in waxy oil pipelines; it is of great importance for the study of wax deposition [8,9].
So far, a number of techniques have been used to measure the wax precipitation curve, including differential scanning calorimetry (DSC) [10,11,12], the Fourier-transform infrared spectroscopy method (FT-IR) [13], the nuclear magnetic resonance method (NMR) [14,15] and the filtration separation and centrifugal separation method [16,17]. The differential scanning calorimetry method obtains the wax precipitation at different temperatures by comparing the ratio of accumulated exhalation heat to the enthalpy of phase change of unit mass of wax in crude oil. Since the enthalpy of phase change of unit mass of wax in crude oil spans a wide range of values (100 J/g–297 J/g) [18], the DSC method can only give the range of wax precipitation content in crude oil on a curve, but not an exact figure. The Fourier-transform infrared spectrometry method (FTIR) measures the increase in the integrated absorbance from 715 cm−1 to 735 cm−1 on the wave band, which is related to the CH2 rocking band of n-alkanes and is assumed to be linearly positively related to the weight percent of precipitated solid wax. However, alkane CH2 content varies between different n-alkanes, so the same amount of increased absorption in this wave band only means the same amount of CH2 but does not correspond to the same amount of n-alkane precipitated. The linear relationship between the increase in the absorption and precipitated solid wax is not completely accurate. The nuclear magnetic resonance method (NMR) mainly includes 1H NMR and 13C NMR and provides information concerning hydrogen and carbon atoms of organic molecules in different position, which is used to analyze the structural characteristics of wax molecules and the composition of wax in crude oil. However, a low signal-to-noise ratio makes this method less precise.
The centrifugal separation method obtains the wax precipitation amount by weighting the precipitated solid wax crystals separated from liquid crude oil through a high-speed centrifuge. It is noted that the filter cake contains a small amount of residual liquid crude oil, as well as the precipitated solid wax crystals. Therefore, in order to obtain the wax precipitation of crude oil, it is necessary to analyze the filter cake and liquid by using nuclear magnetic resonance or high-temperature gas chromatography technology (HTGC) to determine the content of solid wax precipitated.
The conventional centrifugation and high-temperature gas chromatography (C-HTGC) method gives upper measurements of the amount of precipitated wax since it ignores the wax dissolved in the crude oil in the centrifugal cake. Therefore, a modified C-HTGC method was developed, based on the mass balances of the non-crystallized fraction in the centrifugal cake. This method was used to measure, at different temperatures, the amount and component distribution of the precipitated solid wax crystals of artificial waxy oil and 0# diesel, and the wax precipitation characteristics are obtained. At the same time, the basic data are provided for building a thermodynamic model of wax precipitation.

2. Experimental Study

2.1. Conventional C-HTGC Method

The conventional centrifugation and high-temperature gas chromatography method was used to measure the solid-phase wax crystal precipitation amount in different oil samples. There are five main steps, as shown in Figure 1.
(1) Cool a known mass of a crude oil sample, moil, to a definite experimental temperature, T, which is below the wax precipitation temperature, and keep the temperature constant for enough time to ensure wax sufficiently precipitates, at least two hours.
(2) Set and keep the centrifuge temperature at experimental temperature and separate. In order to ensure that all the precipitated solid wax crystals accumulate in the filter cake, a centrifugal time of at least 20 h should be guaranteed. In the experiment, different centrifugation times are used at different temperatures, with all times no less than 20 h, and the centrifugation time is extended appropriately with the decrease in temperature.
(3) After centrifugation, separate the supernatant from the lower filter cake and measure the mass of filter cake, mcake.
(4) Using high-temperature gas chromatography to analyze the centrifugal filter cake and oil sample, obtain the fraction of solid wax in the filter cake, FS,cake.
(5) The fraction of precipitated wax in oil sample, FS,oil, is calculated by the following Equation (1)
F S , oil = m cake · F S , cake m oil
Use of high-temperature gas chromatography to obtain the fraction of solid wax in the filter cake, FS,cake, is implemented in two steps. First, determine the starting carbon number (SCN), which is defined as the lowest carbon number of precipitated wax crystal components in cake. Then, the FS,cake, is calculated, assuming the component with a higher carbon number than SCN as the solid wax crystal. Roehner et al. [19] investigated the mass ratio of n-alkanes and non-n-alkanes in the centrifuge oil and cake with the same carbon number and proposed a method to determine the SCN. Martos et al. [20] assumed the SCN is 15 and the components with carbon number higher than 15 in filter cake are solid wax.
However, components with a higher carbon number than SCN are not only in solid wax crystals but also in liquid oil in cake. The conventional C-HTGC method gives upper measurements of the amount of precipitated wax, as it treats the component with a higher carbon number than SCN dissolved in crude oil in centrifugal cake as the solid wax crystal. Therefore, a modified C-HTGC method is developed, based on the mass balances of the non-crystallized fraction in the centrifuged cake.

2.2. Modified C-HTGC Method

Through the analyses above, the fraction of solid wax in the filter cake, FS,cake, measured by the HTGC is inaccurate due to liquid oil present in the centrifugal filter cake. The centrifugal separation of wax-precipitated oil consists of one feed stream and two output streams, as shown in Figure 2. There are four unknown variables: the mass of solid wax in the cooled oil, mS,oil; the mass of liquid in the cooled oil, mL,oil; the mass of solid wax in the cake, mS,cake; and the mass of liquid oil in the cake, mL,cake. In order to obtain these four unknown variables, four independent equations that relate these unknown variables are required. By analyzing the mass conservation before and after centrifugation, three equations can be obtained: (1) the mass of oil, moil, is the sum of the solid wax and liquid in the cooled oil; (2) the mass of the centrifuged cake, mcake, is the sum of liquid oil and solid wax in the cake; (3) the mass of solid wax in oil is equal to the cake.
m oil = m S , oil + m L , oil
m cake = m S , cake + m L , cake
m S , oil = m S , cake
The centrifugal separation process is thermostatic and adiabatic, so no further wax crystals precipitated and no precipitated wax crystal melting. Meanwhile, the separation process lasts for at least 20 h, and it is believed that the solids in the oil sample will be entirely in the cake after centrifugation [21,22].
The fourth equation can be obtained by considering the weight fraction of each component in the oil sample and centrifugal filter cake. The centrifugal separation process does not cause any new phase change, the liquid of the oil has the same composition as the liquid of the centrifugal cake, and the solid of the oil has the same composition as the solid of the centrifugal cake. The weight fraction of the components with carbon number i in the oil and centrifugal cake, W i | oil and W i | cake given as
W i | oil = m L , oil · w L , i + m S , oil · w S , i m oil
W i | cake = m L , cake · w L , i + m S , cake · w S , i m cake
where w L , i is the weight fraction of the components with carbon number i in the liquid phase and w S , i is the weight fraction of the components with carbon number i in the precipitated solid wax phase.
The component with carbon number i less than SCN will only exist in the liquid of oil and cake, i.e., w S , i = 0 when i < N C , N C is defined as the starting carbon number of wax crystal precipitation. Equations (5) and (6) can be written as
W i | oil ( i < N C ) = m L , oil · w L , i m oil
W i | cake ( i < N C ) = m L , cake · w L , i m cake
The weight fraction of the components with carbon number i in the liquid phase, w L , i , cancels out Equation (7) divided by Equation (8).
W i | cake ( i < N C ) W i | oil ( i < N C ) = m L , cake m L , oil · m oil m cake
Equation (9) is the fourth equation to solve for the four unknown variables. The weight fraction of component i in centrifugal filter cake W i | cake ( i < N C ) and oil sample W i | oil ( i < N C ) can be obtained by high-temperature gas chromatographic of centrifugal filter cake and oil sample. Component i refers to both n-alkanes and non-n-alkanes with a carbon number of i.
As shown in Equation (9), for the components with carbon number less than NC, the ratio of weight fraction of component in the centrifugal filter cake and in the oil sample is a constant, which is defined as a.
a = W i | cake ( i < N C ) W i | oil ( i < N C )
The content of solid wax crystals in centrifugal filter cake, FS,cake, and in oil sample, FS,oil, can be obtained by solving Equations (2)–(4) and (9) simultaneously.
F S , cake = 1 a 1 a m cake m oil
F S , oil = m cake m oil 1 a 1 a m cake m oil

2.3. Experimental Facility

The solid phase wax crystals are separated by an Avanti jxn-26 centrifuge made by Beckman Instruments, after precipitated from the oil sample. The centrifuge is equipped with a temperature control device to control the temperature of the centrifugal chamber, and then the constant-temperature adiabatic separation of the experimental oil sample is realized. Capacity of the centrifugal tube is 100 mL, which is equipped with a test-tube cover and O-ring to prevent volatilization of light components in the test process. Before loading the oil sample into the centrifugal tube, in order to ensure the oil sample is even, the sample is heated to 40 °C and held at a constant temperature for 2 h. Put the oil sample of certain quality into the centrifugal tube and install it on the rotating head of the centrifuge. Then, centrifugal separation is carried out after the temperature of the centrifugal chamber is adjusted to the set experimental temperature. Centrifugal speed is controlled at 28,000 rpm during centrifugal separation.
The carbon number distribution of both crude oil and centrifuged cake is measured by using gas chromatography. The measurements are taken using an Agilent-7890A GC equipped with a capillary column coated with HT750 (5 m × 0.53 mm × 0.09 µm). During the measurement process, furnace temperature starts at 30 °C, increasing temperature with heating rate of 1.5 °C/min to 90 °C, then with a heating rate of 3.5 °C/min up to 430 °C. Relationship between front and mass fraction is obtained by internal standard method of chromatographic analysis of the oil sample and centrifugal filter cake. Mass ratio of n-alkanes to non-n-alkanes in components with carbon number i can also be obtained by this chromatographic analysis.

3. Result and Discussion

3.1. Artificial Il

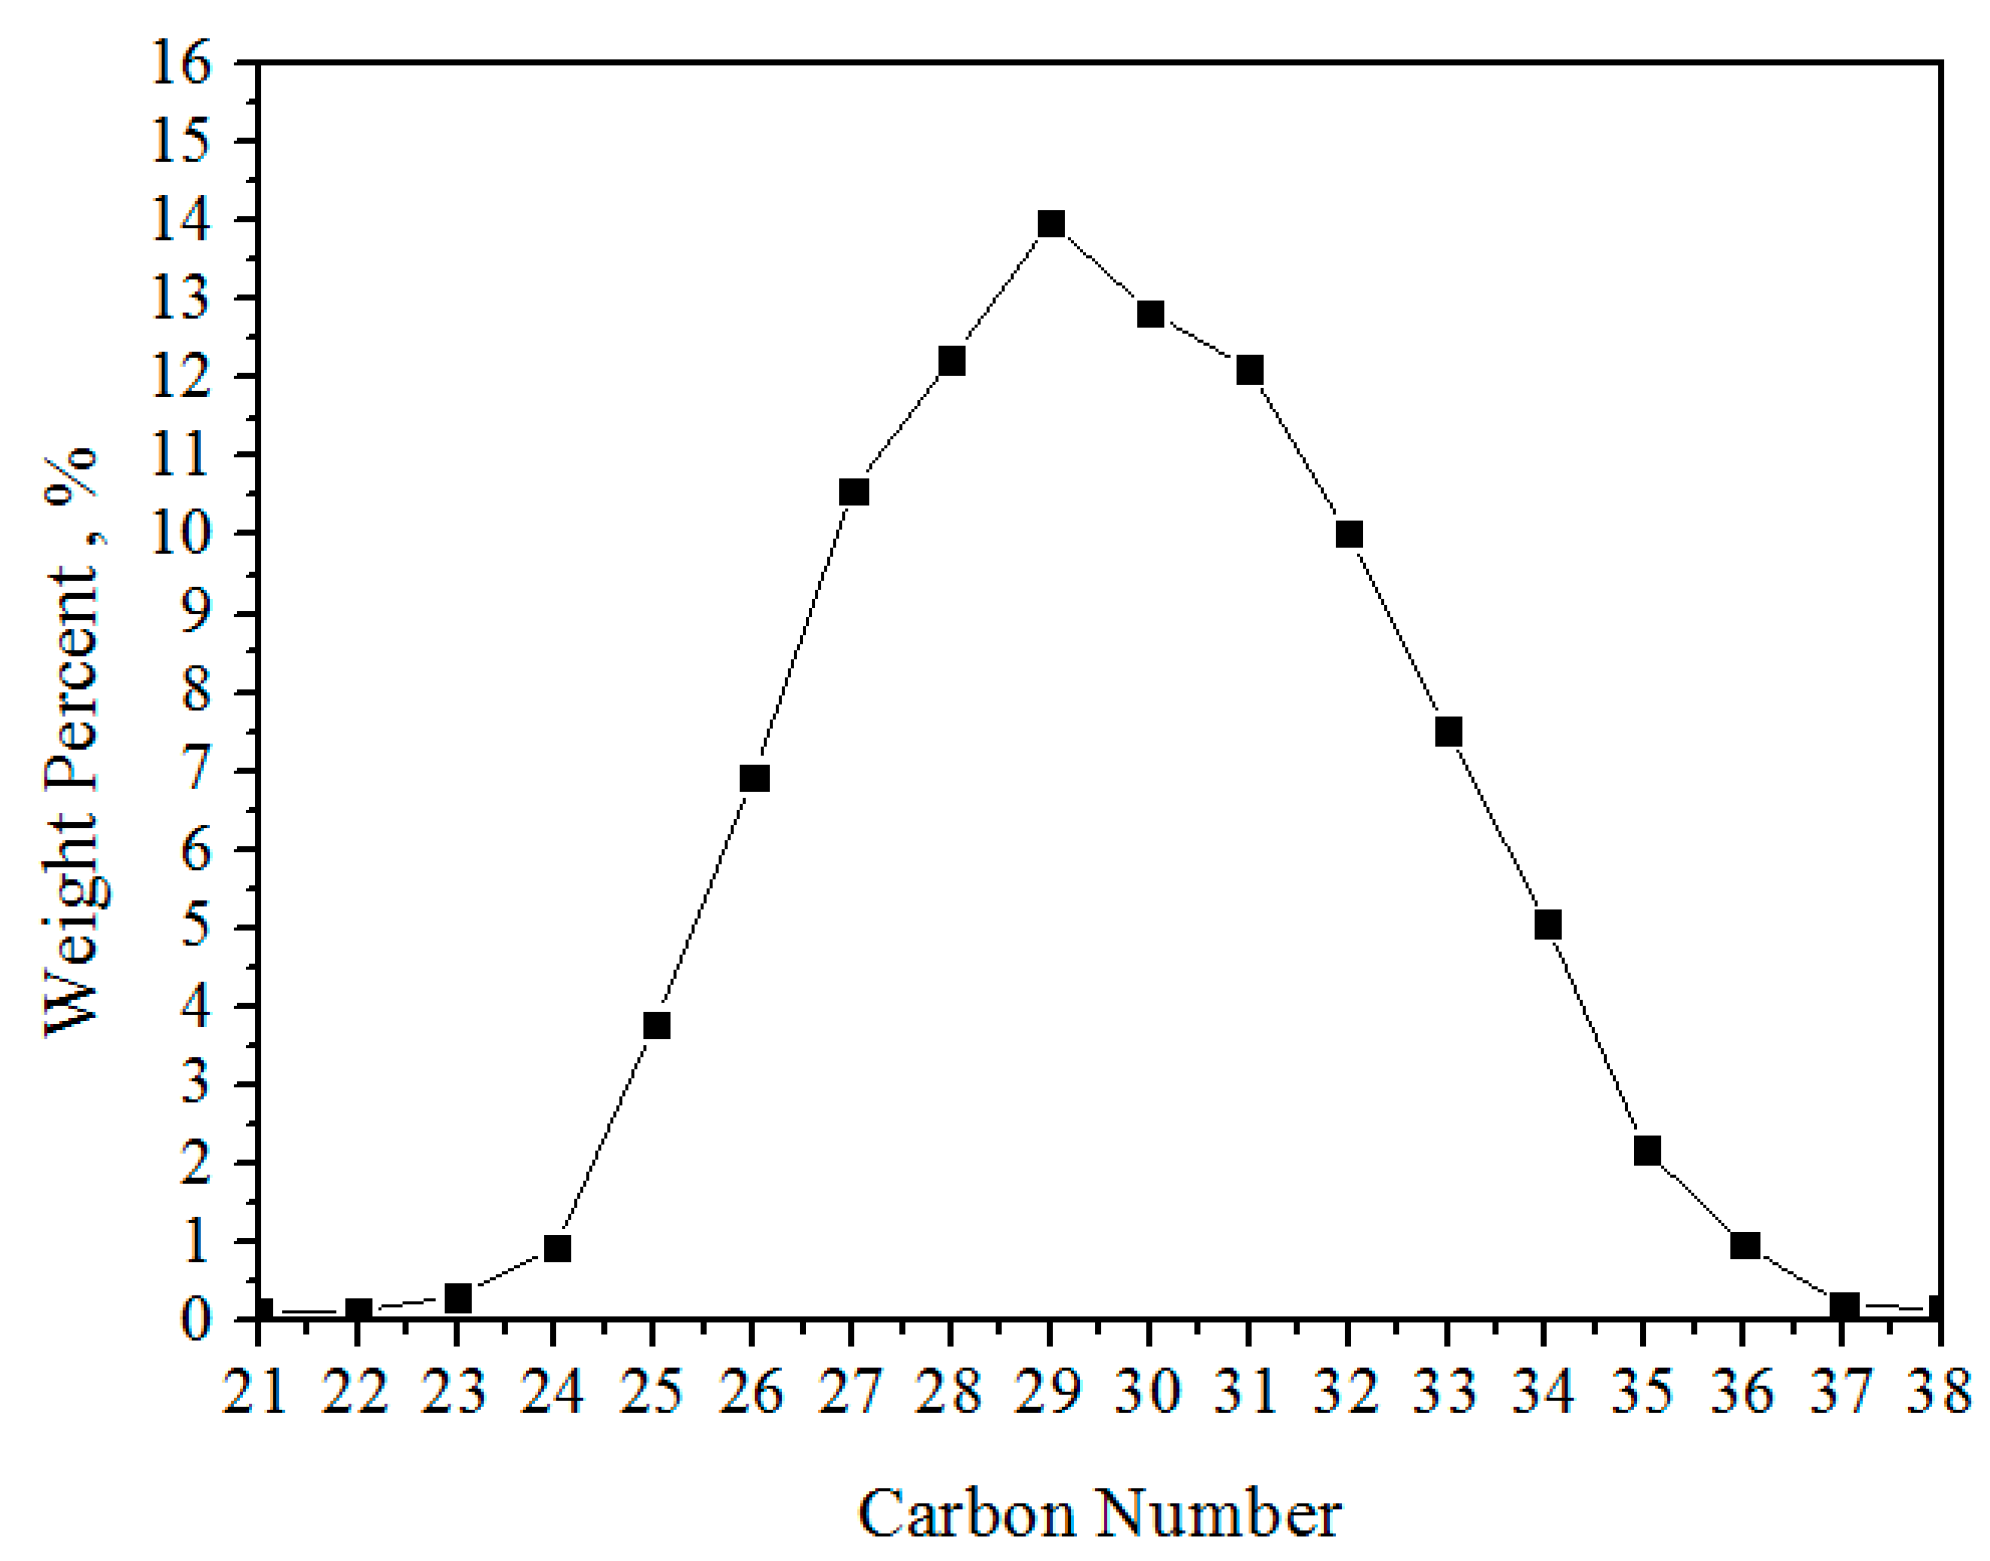
Exxsol D80 was used as a solvent oil, and paraffin as a solute. Three artificial waxy oil solutions with mass concentrations of 10%, 15% and 20% (mass percentage) were prepared. Exxsol D80 solvent oil is produced by Exxon Mobil Corporation. It is a colorless, tasteless and transparent liquid phase. It has characteristics of a narrow distillation range, low aromatics and sulfur content and good solubility. Its main carbon number is distributed between C11 and C15, as obtained through HTGC testing, and there is only a small distribution of C10 and below, as shown in Figure 3. Paraffin, used in the solute, is a coarse crystalline wax, which is mainly composed of n-alkanes. It was also tested by HTGC, as shown in Figure 4.

3.1.1. Wax Precipitation Amount

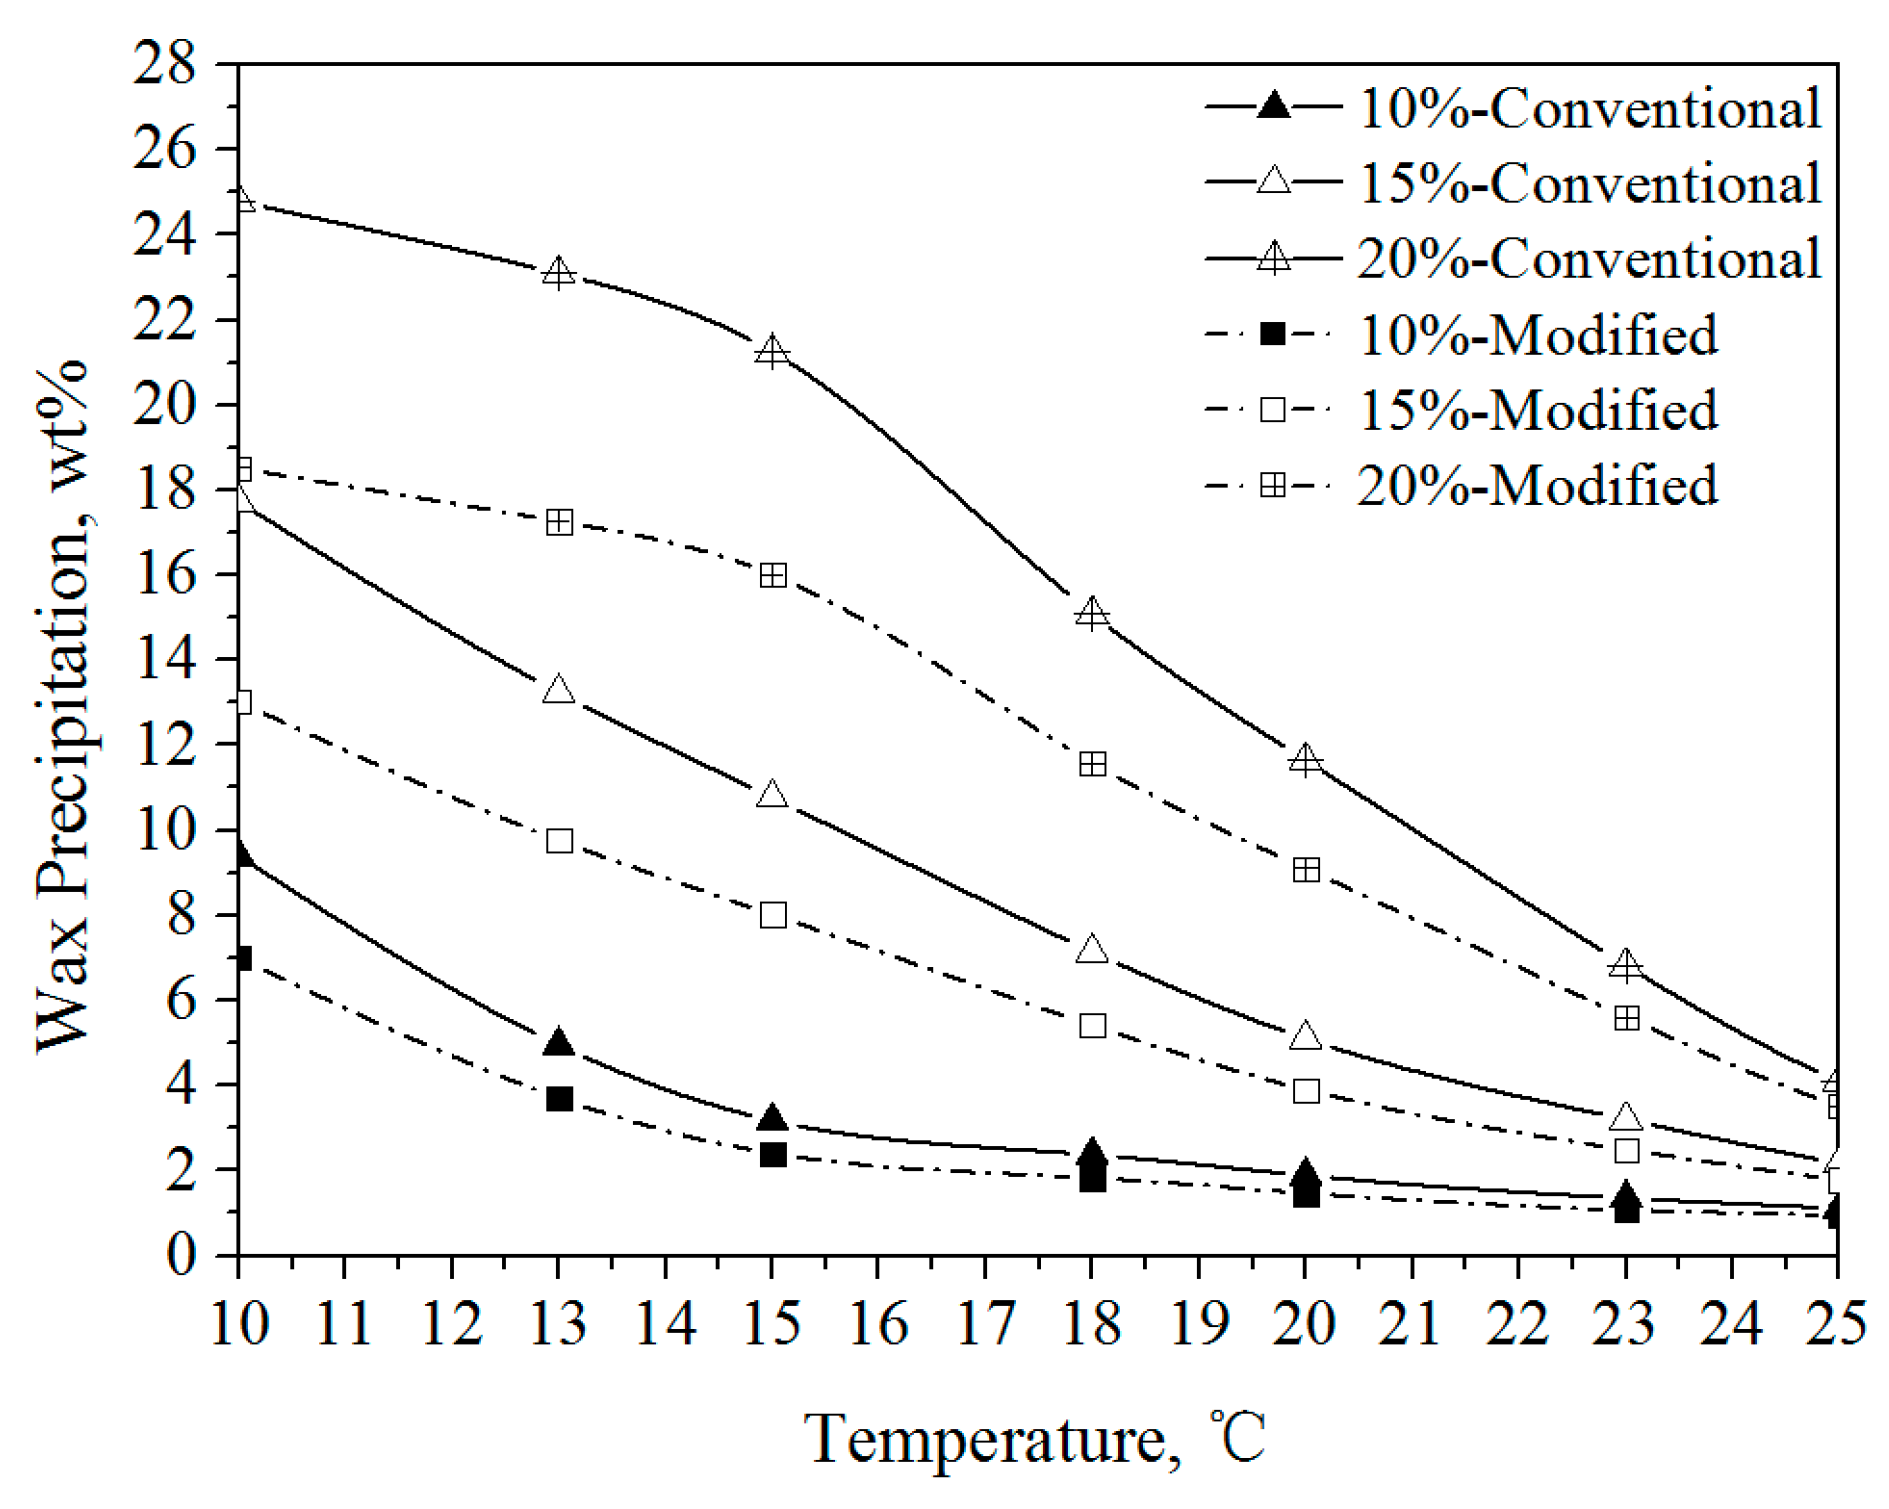
Mass fractions of precipitated solid wax crystals were measured through experimentation, with wax content of artificial oil of 10%, 15% and 20%, respectively, and temperatures ranging from 10 °C to 25 °C, as shown in Figure 5.
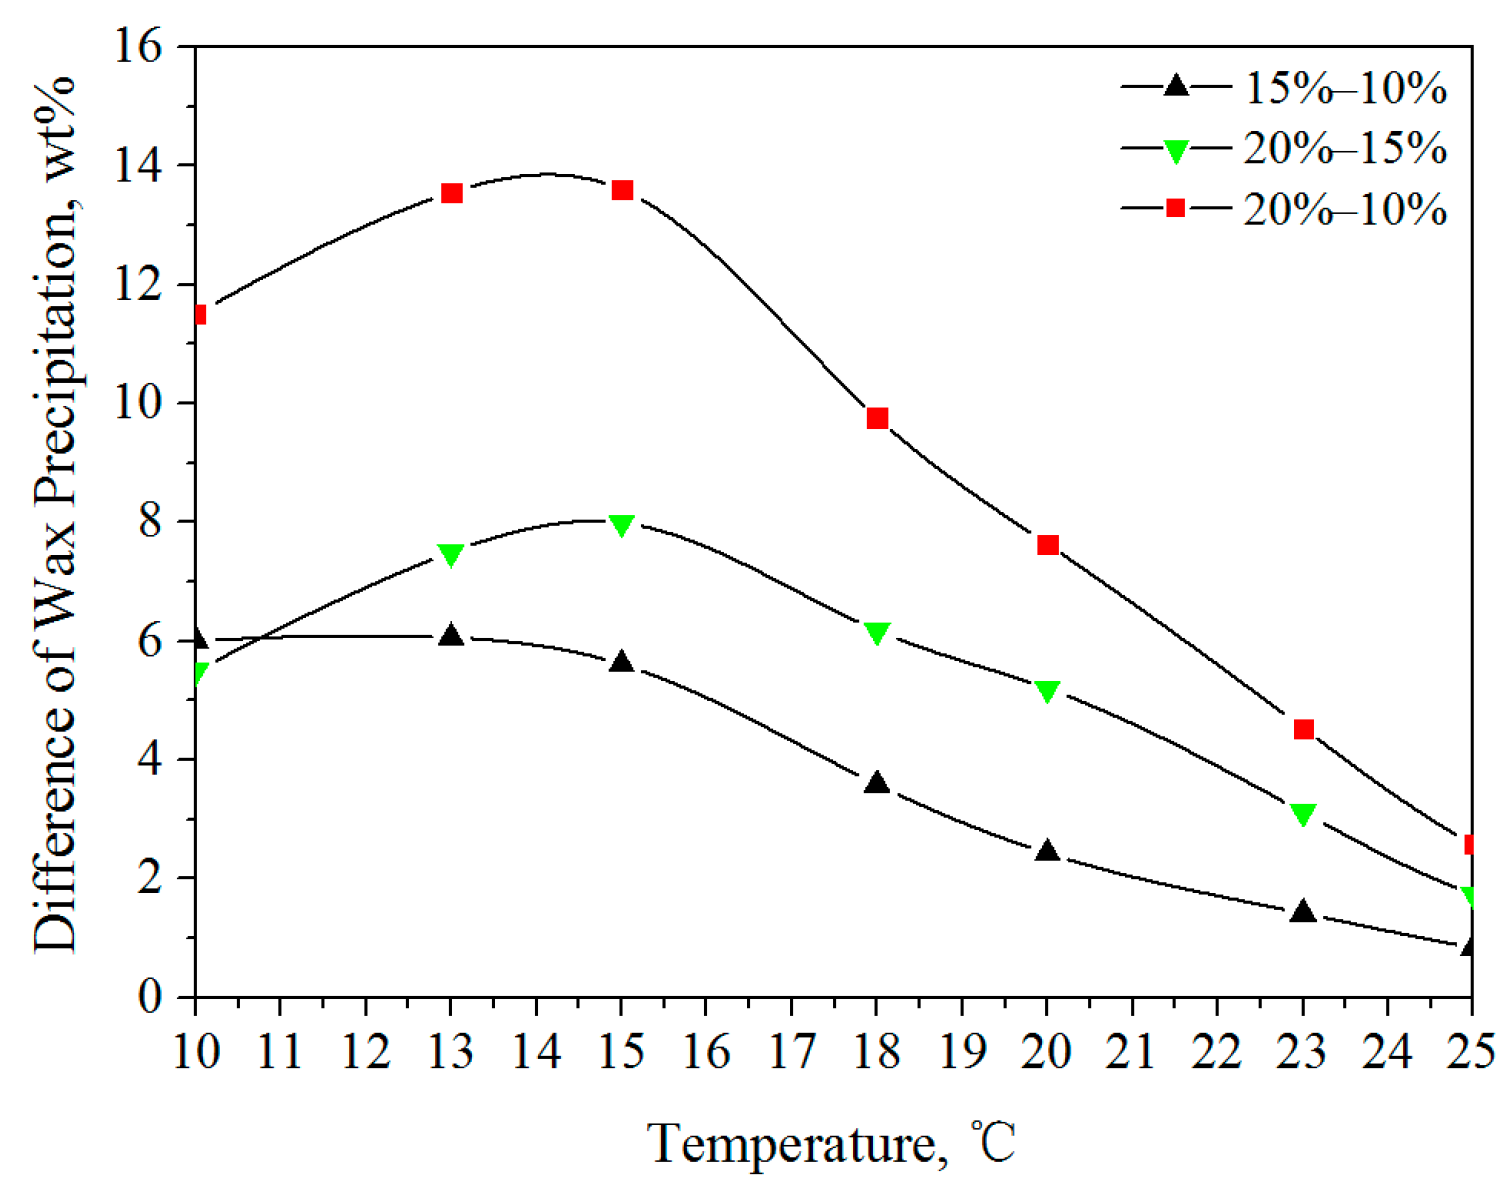
As shown in Figure 5, the conventional C-HTGC method gives a significant overprediction of the amount of precipitated wax for all the artificial oil samples at different temperatures. As discussed earlier, this overprediction is due to the fact that the conventional method treats components with a higher carbon number than SCN dissolved in crude oil in the centrifugal cake as a solid wax crystal. There were more precipitated wax crystals in the artificial oil solution with decreased temperature. The higher wax content of the artificial oil solution produced more precipitated wax crystals at the same temperature. When the temperature was 25 °C, the precipitated wax amount (1.78%) of the artificial oil with a wax content of 5% was 0.84% more than the precipitated wax amount (0.94%) at a concentration of 10%. When the temperature was 15 °C, there were 5.61% more precipitates. Figure 6 shows that the difference in wax precipitation was between 15% and 10% of the wax content in the artificial oil solution at different temperatures, and the differences between 20% and 15% and 20% and 10% of the wax content in the artificial oil solution are also given. As shown in Figure 6, as the temperature decreased, the difference in wax precipitation amount between the wax amount in the solution of 15% and 10% kept increasing, while the difference between 20% and 15% and 20% and 10% initially increased and then decreased. It is noted that the precipitated solid wax amount with the same concentration of artificial solution was different. The difference in the wax precipitation amount and the wax amount in the solution of 20% and 15% and the difference between 15% and 10% decreased gradually as the temperature decreased. This indicates that the amount of precipitated wax crystals in the artificial oil is not only related to the concentration and temperature of the solution.
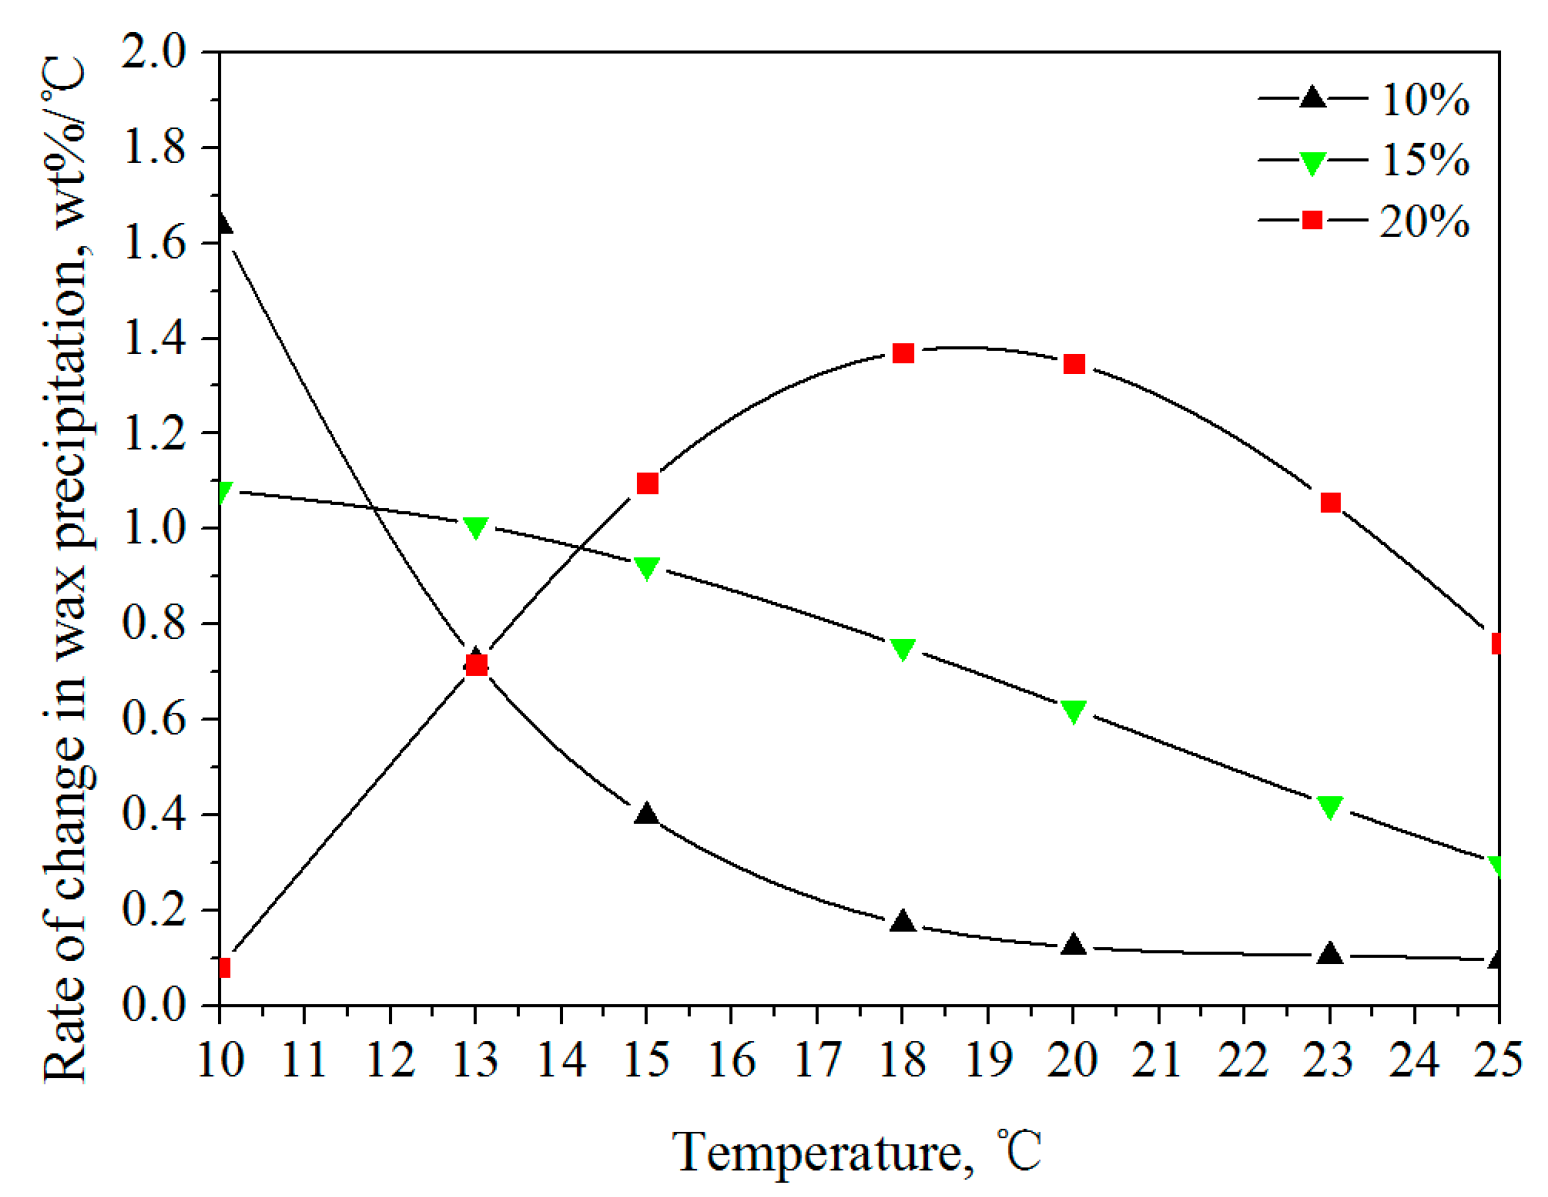
The wax deposition rate is closely related to the slope of the concentration curve, i.e., the rate of change in concentration with temperature, which is negatively correlated to the rate of change in wax precipitation with temperature [23]. Figure 7 gives the rate of change in wax precipitation at different temperatures. The rate of change was obtained using Origin software. The specific steps are: analysis-->mathematics-->differentiate-->open dialog, set derivative order to 1, and use the default values for other parameters. The rate of change increased with temperature and presented different trends for three oil samples. The rate of change decreased in samples with 10% and 15% concentration of waxy artificial oil. The rate of change increased and then decreased in samples with 20% concentration of waxy artificial oil. When the temperature was above 15 °C, the rate of change in samples with 20% concentration of waxy artificial oil was higher than 15% and 15% higher than 10%. This indicates that in the initial precipitation moment, the rate of precipitation of high-waxy concentration oil was faster than that of the low-concentration oil [24].

3.1.2. Composition Distribution of Solid Wax

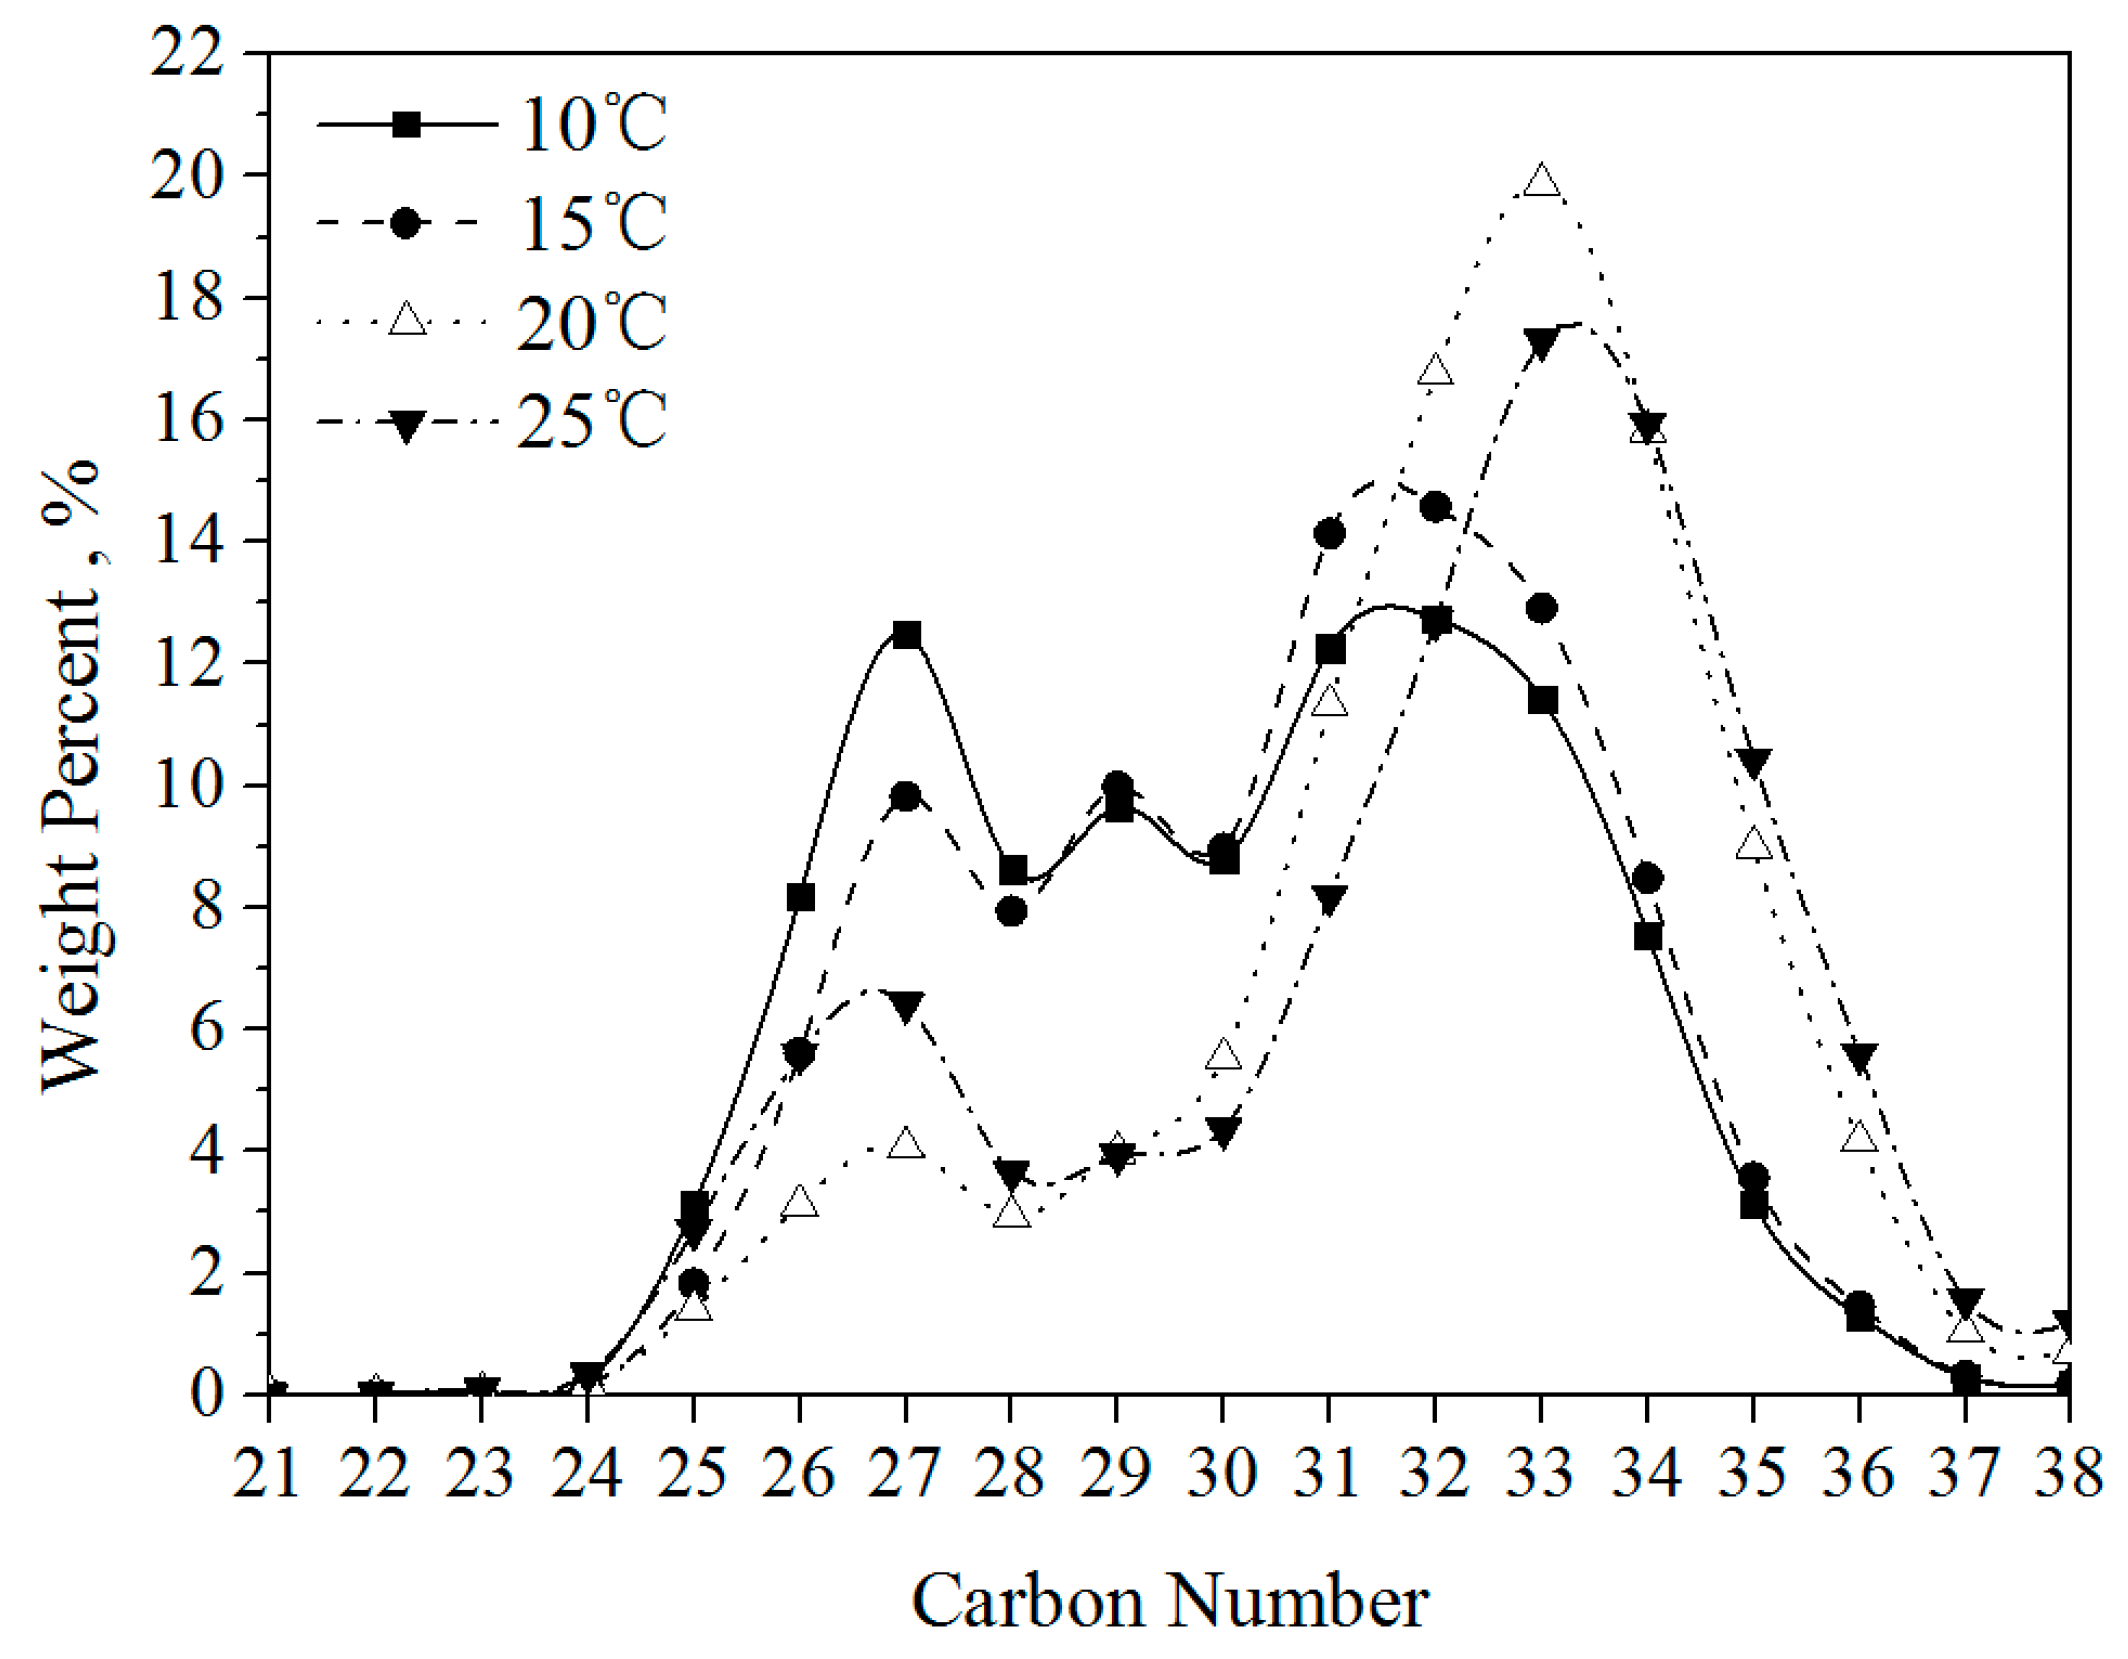
In order to better understand characteristics of the precipitated wax crystals, the component distribution of wax crystals was analyzed. Under temperatures of 25 °C, 20 °C, 15 °C and 10 °C, carbon number distributions of the solid wax crystals precipitated from 10%, 15% and 20% waxy artificial oil, as shown in Figure 8, Figure 9 and Figure 10.
As shown in Figure 8, Figure 9 and Figure 10, the carbon number distribution of precipitated solid wax crystals at different temperatures has a peak value. The carbon number distribution map of paraffin wax (Figure 3) shows that the content of C29 in paraffin wax was the highest. However, the peak appears higher than C29 at temperatures of 25 °C, 20 °C and 15 °C. With lower temperatures, the carbon number at the peak is decreased, gradually moving closer to C29, as shown in Figure 7, Figure 8 and Figure 9.
The wax precipitation characteristics at different temperatures are affected by many factors, including the temperature of the oil, the carbon number distribution of the paraffin in the artificial oil and the sensitivity of alkane crystallization to temperature. The higher the carbon number, the easier alkanes are to precipitate at high temperatures. Though the content of paraffin was low, it was more likely to precipitate than alkanes with lower carbon numbers, and its concentration increased in the precipitated wax crystals. The peak value moves towards the alkanes of low carbon number as the temperature decreases [25]. This suggests that wax precipitation is sensitive to temperature and the carbon number distribution of alkanes in paraffin plays a major role.
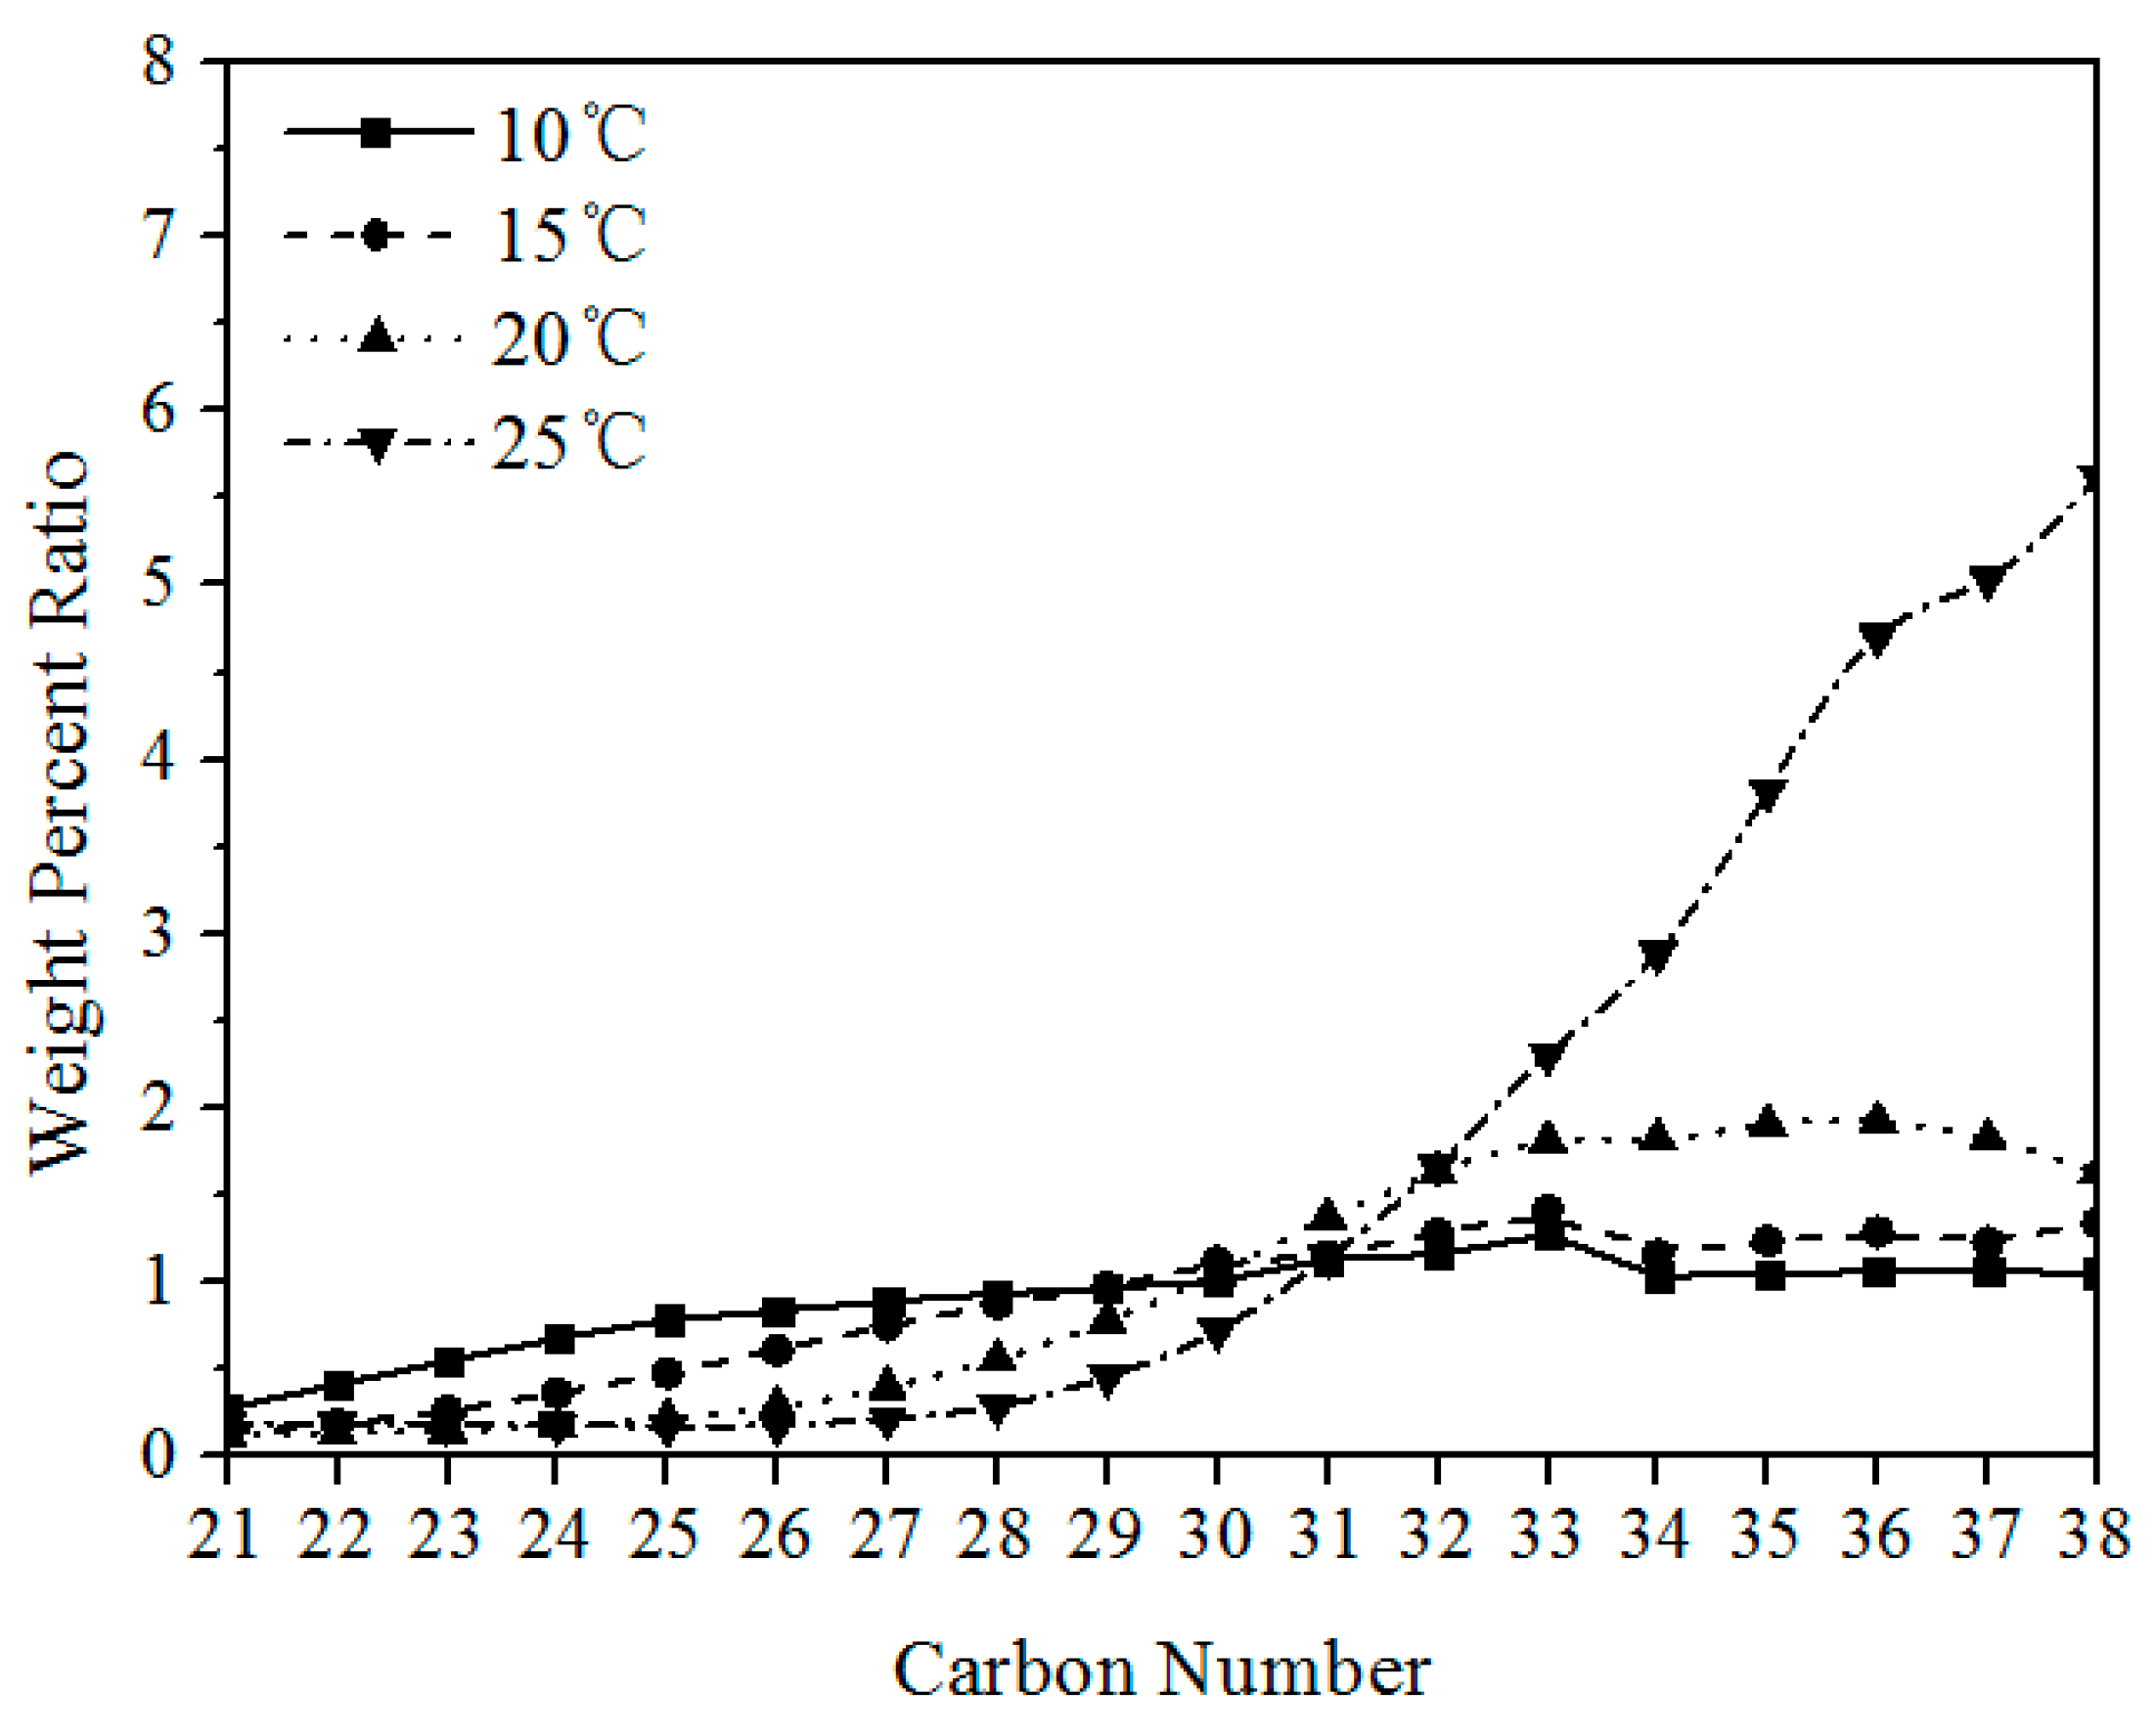
In order to further investigate the sensitivity of alkane crystallization to temperature with different carbon numbers and the influence of temperature on wax precipitation, we divided the percentage of alkanes with different carbon numbers in precipitated wax crystals at different temperatures by the corresponding percentage of paraffin, which eliminated the effect of the carbon number distribution (content) of paraffin in artificial oil. The calculation results are as shown in Figure 11, Figure 10, Figure 12 and Figure 13.
It can be seen clearly in Figure 10, Figure 11 and Figure 12 that the weight percent of alkanes with different carbon numbers in the precipitated solid wax crystals increased as the carbon number increased. The higher the carbon number, the easier each alkane is to precipitate [26]. However, precipitation was also affected by temperature. When the temperature was higher, alkanes with high carbon numbers were easy to precipitate, and the difference between alkanes with high carbon numbers and those with low carbon numbers was large. As the temperature decreased, the carbon number of easily precipitated alkanes decreased and the difference between alkanes with high carbon numbers and those low carbon numbers was smaller [27]. Therefore, the whole increasing trend is slowed down.

3.2. 0#. Diesel

0# diesel samples used in the experiment were provided by Lanzhou Petrochemical Refinery, with a cold filtration point of 1 °C, a freezing point of −6 °C and a relative density of 0.85. Diesel oil is classified according to the freezing point. The freezing point of 0# diesel is not higher than 0 °C. Table 1 and Figure 14 show the quality fractions of alkanes in 0# diesel obtained by high-temperature gas chromatography.
The mass fraction of solid wax crystals precipitated from 0# diesel oil at different temperatures was measured by high-speed centrifugal separation and high-temperature gas chromatography, as shown in Table 2 and Figure 15.
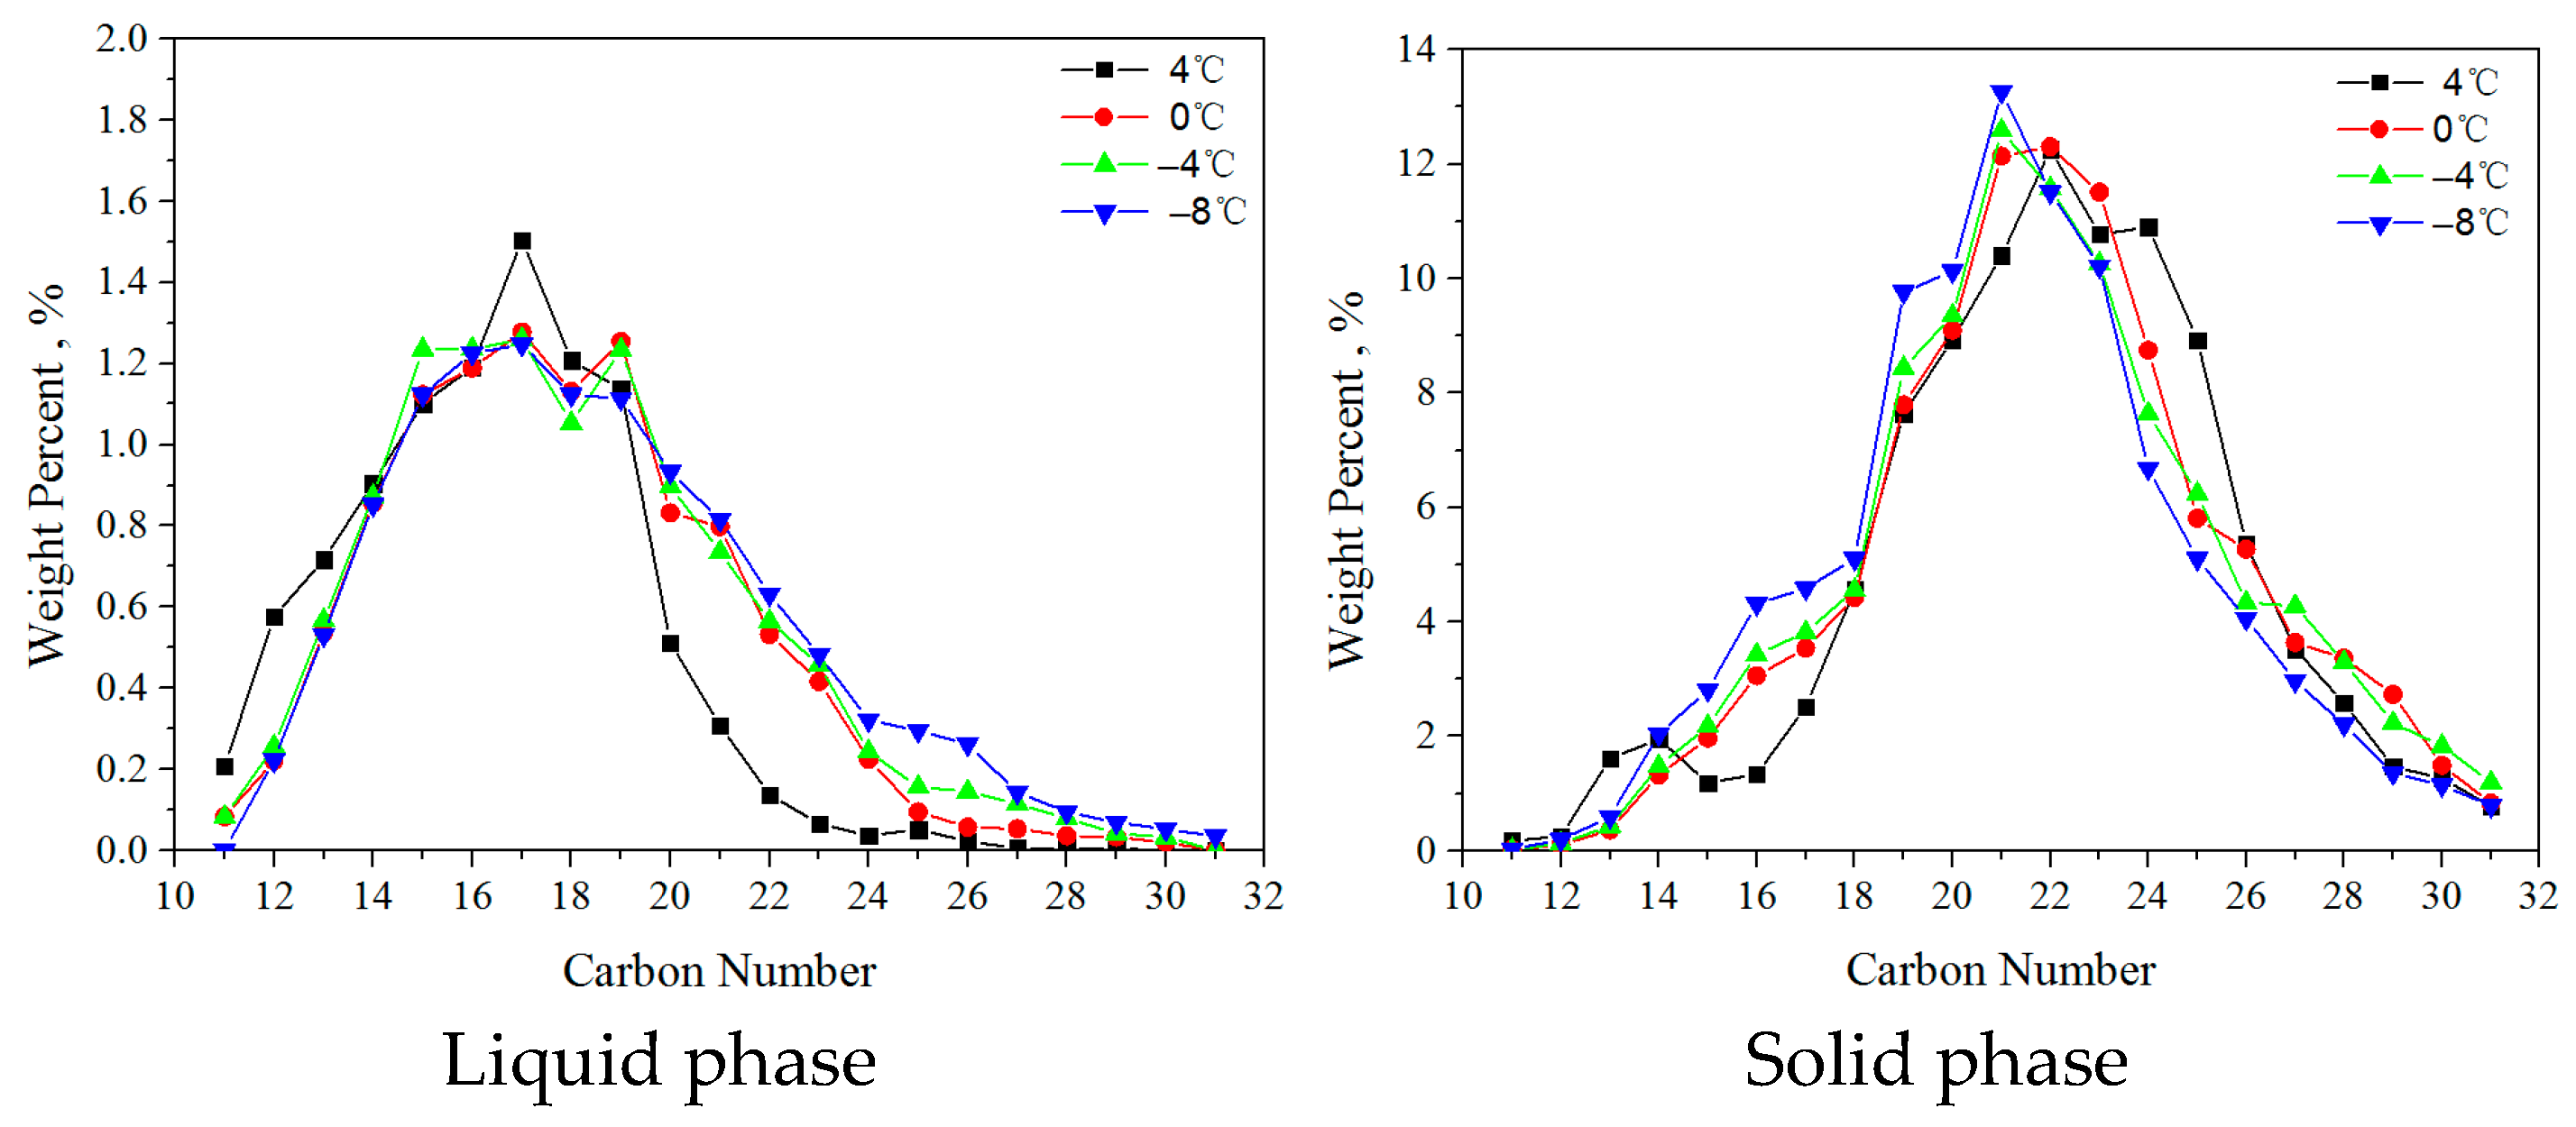
Liquid phase and solid phase compositions of 0# diesel at 4 °C, 0 °C, −4 °C and −8 °C, as shown in Table 3 and Figure 16.
As shown in the Table 3 and Figure 16, with decreased temperature, the average carbon number of alkanes in precipitated wax crystals decreased. This is because more alkanes with low carbon numbers are precipitated as the temperature decreases. Although alkanes with higher carbon numbers are still precipitated, their portion decreases [28].
Alkanes with high carbon numbers are more likely to precipitate. Several alkanes with the highest carbon number accounted for a small proportion of total alkanes. As a result, alkanes with high carbon numbers still accounted for a small proportion of solid wax crystals. At the same time, the alkanes with high carbon numbers precipitate simultaneously with low-carbon number alkanes [29]. The distribution of alkanes in solid wax crystals is roughly the same as that of diesel but slightly heavier than the diesel.
It was found that the content of alkanes with a carbon number of about 20 was the highest in the solid phase. Alkanes with higher carbon numbers precipitate more easily. If its content is high, the content in the solid phase will be greater under the effect of two factors. Therefore, alkanes with carbon numbers of about 20 are the easiest to precipitate because of the high content [30]. For alkanes with carbon numbers greater than 23, the content in most diesels is low. The content of the precipitated solid wax crystals is also low.

4. Conclusions

The high-speed centrifugal separation method and high-temperature gas chromatography method were used to measure the amount and component distribution of precipitated wax in artificial oil and diesel at different temperatures. It was found, by wax precipitation experiment with artificial waxy oil solution, that wax precipitation characteristics at different temperatures are affected by many factors, including the temperature of the artificial oil, the carbon number distribution of paraffin in the artificial oil and the sensitivity of alkane crystallization to temperature. As temperature was decreased, more wax crystals were precipitated in the artificial oil. At the same temperature, the higher the wax content in the oil, the more precipitated wax crystals there were. The difference between the wax precipitation amount of high-wax content solution and low-wax content solution first increased and then decreased. The difference in solid wax crystal amount in the solution with the same concentration was different. With decreasing temperature, the movement of the carbon number distribution peak value of solid wax crystals towards lower carbon numbers indicates that wax precipitation is sensitive to temperature. Furthermore, the carbon number distribution of paraffin plays a major role in this process. The weight percent of alkanes with different carbon numbers in the precipitated solid wax crystals increased along with the carbon numbers. The higher the carbon number, the easier each alkane is to precipitate. However, precipitation is also affected by temperature. Alkanes with high carbon numbers are easy to precipitate at high temperature. As the temperature decreases, the carbon numbers of easily precipitated alkanes decrease, the difference between high-carbon number alkanes and low-carbon number alkanes is smaller and the increasing trend slows. It has been found, in the wax precipitation experiment of 0# diesel, that the average carbon number of alkanes in precipitated wax crystals decreases with a decrease in temperature. Several alkanes with the highest carbon numbers account for a small proportion of total alkanes in solid wax crystals. The distribution of alkanes in solid wax crystals is roughly the same as that in diesel but slightly heavier than the diesel. The alkanes with high carbon numbers precipitate simultaneously with the low-carbon number alkanes.

Author Contributions

Methodology, H.L. and J.D.; Formal analysis, H.L., J.L., K.L., L.G.; Investigation, H.Y. and C.L.; Writing—review & editing, J.W. All authors have read and agreed to the published version of the manuscript.

Funding

This research was funded by the Natural Science Foundation of Chongqing, China (cstc2019jcyj-msxmX0268, cstc2019jcyj-msxmX0286, and cstc2019jcyj-ms-xmX0628).

Informed Consent Statement

Not applicable.

Conflicts of Interest

The authors declare no conflict of interest.

References

  1. Yang, J.; Wang, W.; Huang, H.; Wang, J.; Duan, J.; Wang, D.; Shi, G.; Gong, J.; Shi, B. A further discussion on solid-liquid equilibrium in complex synthetic paraffinic systems with the effects of solid-solid transition. Fluid Phase Equilib. 2017, 440, 9–18. [Google Scholar] [CrossRef]
  2. Sun, W.; Wang, W.; Gu, Y.; Xu, X.; Gong, J. Study on the wax/asphaltene aggregation with diffusion limited aggregation model. Fuel 2017, 191, 106–113. [Google Scholar] [CrossRef]
  3. Meighani, H.M.; Ghotbi, C.; Behbahani, T.J. A modified thermodynamic modeling of wax precipitation in crude oil based on PC-SAFT model. Fluid Ph. Equilib. 2016, 429, 313–324. [Google Scholar] [CrossRef]
  4. Morozov, E.V.; Falaleev, O.V.; Martyanov, O.N. New Insight into the Wax Precipitation Process: In Situ NMR Imaging Study in a Cold Finger Cell. Energy Fuels 2016, 30, 9003–9013. [Google Scholar] [CrossRef]
  5. Huang, Z.; Lee, H.S.; Senra, M.; Fogler, H.S. A fundamental model of wax deposition in subsea oil pipelines. AIChE J. 2011, 57, 2955–2964. [Google Scholar] [CrossRef] [Green Version]
  6. Quan, Q.; Wang, W.; Wang, P.; Duan, J.; Yang, J.; Yao, H.; Gong, J. Wax Deposition From Emulsion-water in Stratified Flow. Pet. Sci. Technol. 2015, 33, 749–755. [Google Scholar] [CrossRef]
  7. Japper-Jaafar, A.; Bhaskoro, P.T.; Mior, Z.S. A new perspective on the measurements of wax appearance temperature: Comparison between DSC, thermomicroscopy and rheometry and the cooling rate effects. J. Pet. Sci. Eng. 2016, 147, 672–681. [Google Scholar] [CrossRef]
  8. Duan, J.; Liu, H.; Jiang, J.; Xue, S.; Wu, J.; Gong, J. Numerical prediction of wax deposition in oil–gas stratified pipe flow. Int. J. Heat Mass Transf. 2017, 105, 279–289. [Google Scholar] [CrossRef]
  9. Han, S.; Huang, Z.; Senra, M.; Hoffmann, R.; Fogler, H.S. Method to Determine the Wax Solubility Curve in Crude Oil from Centrifugation and High Temperature Gas Chromatography Measurements. Energy Fuels 2010, 1753–1761. [Google Scholar] [CrossRef]
  10. Kok, M.V.; Létoffé, J.M.; Claudy, P.; Martin, D.; Garcin, M.; Volle, J.L. Comparison of wax appearance temperatures of crude oils by differential scanning calorimetry, thermomicroscopy and viscometry. Fuel 1996, 75, 787–790. [Google Scholar] [CrossRef]
  11. Chen, J.; Zhang, J.; Li, H. Determining the wax content of crude oils by using differential scanning calorimetry. Thermochim. Acta 2004, 410, 23–26. [Google Scholar] [CrossRef]
  12. Wang, W.; Huang, Q.; Wang, C.; Li, S.; Qu, W.; Zhao, J.; He, M. Effect of operating conditions on wax deposition in a laboratory flow loop characterized with DSC technique. J. Therm. Anal. Calorim. 2015, 119, 471–485. [Google Scholar] [CrossRef]
  13. Roehner, R.M.; Hanson, F.V. Determination of Wax Precipitation Temperature and Amount of Precipitated Solid Wax versus Temperature for Crude Oils Using FT-IR Spectroscopy. Energy Fuels 2001, 15, 756–763. [Google Scholar] [CrossRef]
  14. Alghanduri, L.M.; Elgarni, M.M.; Daridon, J.L.; Coutinho, J.A. Characterization of Libyan Waxy Crude Oils. Energy Fuels 2010, 24, 3101–3107. [Google Scholar] [CrossRef]
  15. Espada, J.J.; Coutinho, J.A.P.; Peña, J.L. Evaluation of Methods for the Extraction and Characterization of Waxes from Crude Oils. Energy Fuels 2010, 24, 1837–1843. [Google Scholar] [CrossRef]
  16. Coto, B.; Martos, C.; Peña, J.L.; Espada, J.J.; Robustillo, M.D. A new method for the determination of wax precipitation from non-diluted crude oils by fractional precipitation. Fuel 2008, 87, 2090–2094. [Google Scholar] [CrossRef]
  17. Mohamed, N.H.; Zaky, M.T. Separation of Microcrystalline Waxes from Local Crude Petrolatums using Solventâ “Antisolvent Mixtures. Pet. Sci. Technol. 2004, 22, 1553–1569. [Google Scholar] [CrossRef]
  18. Roenningsen, H.P.; Bjoerndal, B.; Hansen, A.B.; Pedersen, W.B. Wax precipitation from North Sea crude oils: 1. Crystallization and dissolution temperatures, and Newtonian and non-Newtonian flow properties. Energy Fuels 1991, 5, 895–908. [Google Scholar] [CrossRef]
  19. Roehner, R.M.; Fletcher, J.V.; Hanson, F.V.; Dahdah, N.F. Comparative Compositional Study of Crude Oil Solids from the Trans Alaska Pipeline System Using High-Temperature Gas Chromatography. Energy Fuels 2002, 16, 211–217. [Google Scholar] [CrossRef]
  20. Martos, C.; Coto, B.; Espada, J.J.; Robustillo, M.D.; Gómez, S.; Peña, J.L. Experimental Determination and Characterization of Wax Fractions Precipitated as a Function of Temperature. Energy Fuels 2008, 22, 708–714. [Google Scholar] [CrossRef]
  21. Jimiao, D.; Wei, W.; Huishu, L.; Jing, G. Modeling the characterization of the plus fractions by using continuous distribution function. Fluid Ph. Equilib. 2013, 345, 1–10. [Google Scholar]
  22. Martos, C.; Coto, B.; Espada, J.J.; Robustillo, M.D.; Peña, J.L.; Merino-Garcia, D. Characterization of Brazilian Crude Oil Samples To Improve the Prediction of Wax Precipitation in Flow Assurance Problems. Energy Fuels 2010, 24, 2221–2226. [Google Scholar] [CrossRef]
  23. Duan, J.; Deng, S.; Xu, S.; Liu, H.; Chen, M.; Gong, J. The effect of gas flow rate on the wax deposition in oil-gas stratified pipe flow. J. Pet. Sci. Eng. 2018, 162, 539–547. [Google Scholar] [CrossRef]
  24. Alcazar-Vara, L.A.; Buenrostro-Gonzalez, E. Experimental study of the influence of solvent and asphaltenes on liquid–solid phase behavior of paraffinic model systems by using DSC and FT-IR techniques. J. Therm. Anal. Calorim. 2012, 107, 1321–1329. [Google Scholar] [CrossRef]
  25. Do Carmo, R.P.; da Silva, V.M.; Fleming, F.P.; Daridon, J.L.; Pauly, J.; Tavares, F.W. Paraffin solubility curves of diesel fuels from thermodynamic model adjusted through experimental DSC thermograms. Fuel 2018, 230, 266–273. [Google Scholar] [CrossRef]
  26. Parsa, S.; Javanmardi, J.; Aftab, S.; Nasrifar, K. Experimental measurements and thermodynamic modeling of wax disappearance temperature for the binary systems n-C14H30 +n-C16H34, n-C16H34+n-C18H38 and n-C11H24+n-C18H38. Fluid Ph. Equilib. 2015, 388, 93–99. [Google Scholar] [CrossRef]
  27. Coto, B.J.A.P.; Coutinho, J.A.P.; Martos, C.; Robustillo, M.D.; Espada, J.J.; Pena, J.L. Assessment and Improvement of n-Paraffin Distribution Obtained by HTGC To Predict Accurately Crude Oil Cold Properties. Energy Fuels 2011, 25, 1153–1160. [Google Scholar] [CrossRef]
  28. Coutinho, J.A.P.; Dauphin, C.; Daridon, J.L. Measurements and modelling of wax formation in diesel fuels. Fuel 2000, 79, 607–616. [Google Scholar] [CrossRef] [Green Version]
  29. Kazmierczak, P.R.; Paredes, M.L.L.; Lima, E.R.A. Enhancing the objective function used to predict the composition of n -paraffin mixtures from calorimetric curves. Thermochim. Acta 2017, 650, 56–65. [Google Scholar] [CrossRef]
  30. Coutinho, J.A.P. A Thermodynamic Model for Predicting Wax Formation in Jet and Diesel Fuels. Energy Fuels 2000, 14, 625–631. [Google Scholar] [CrossRef]
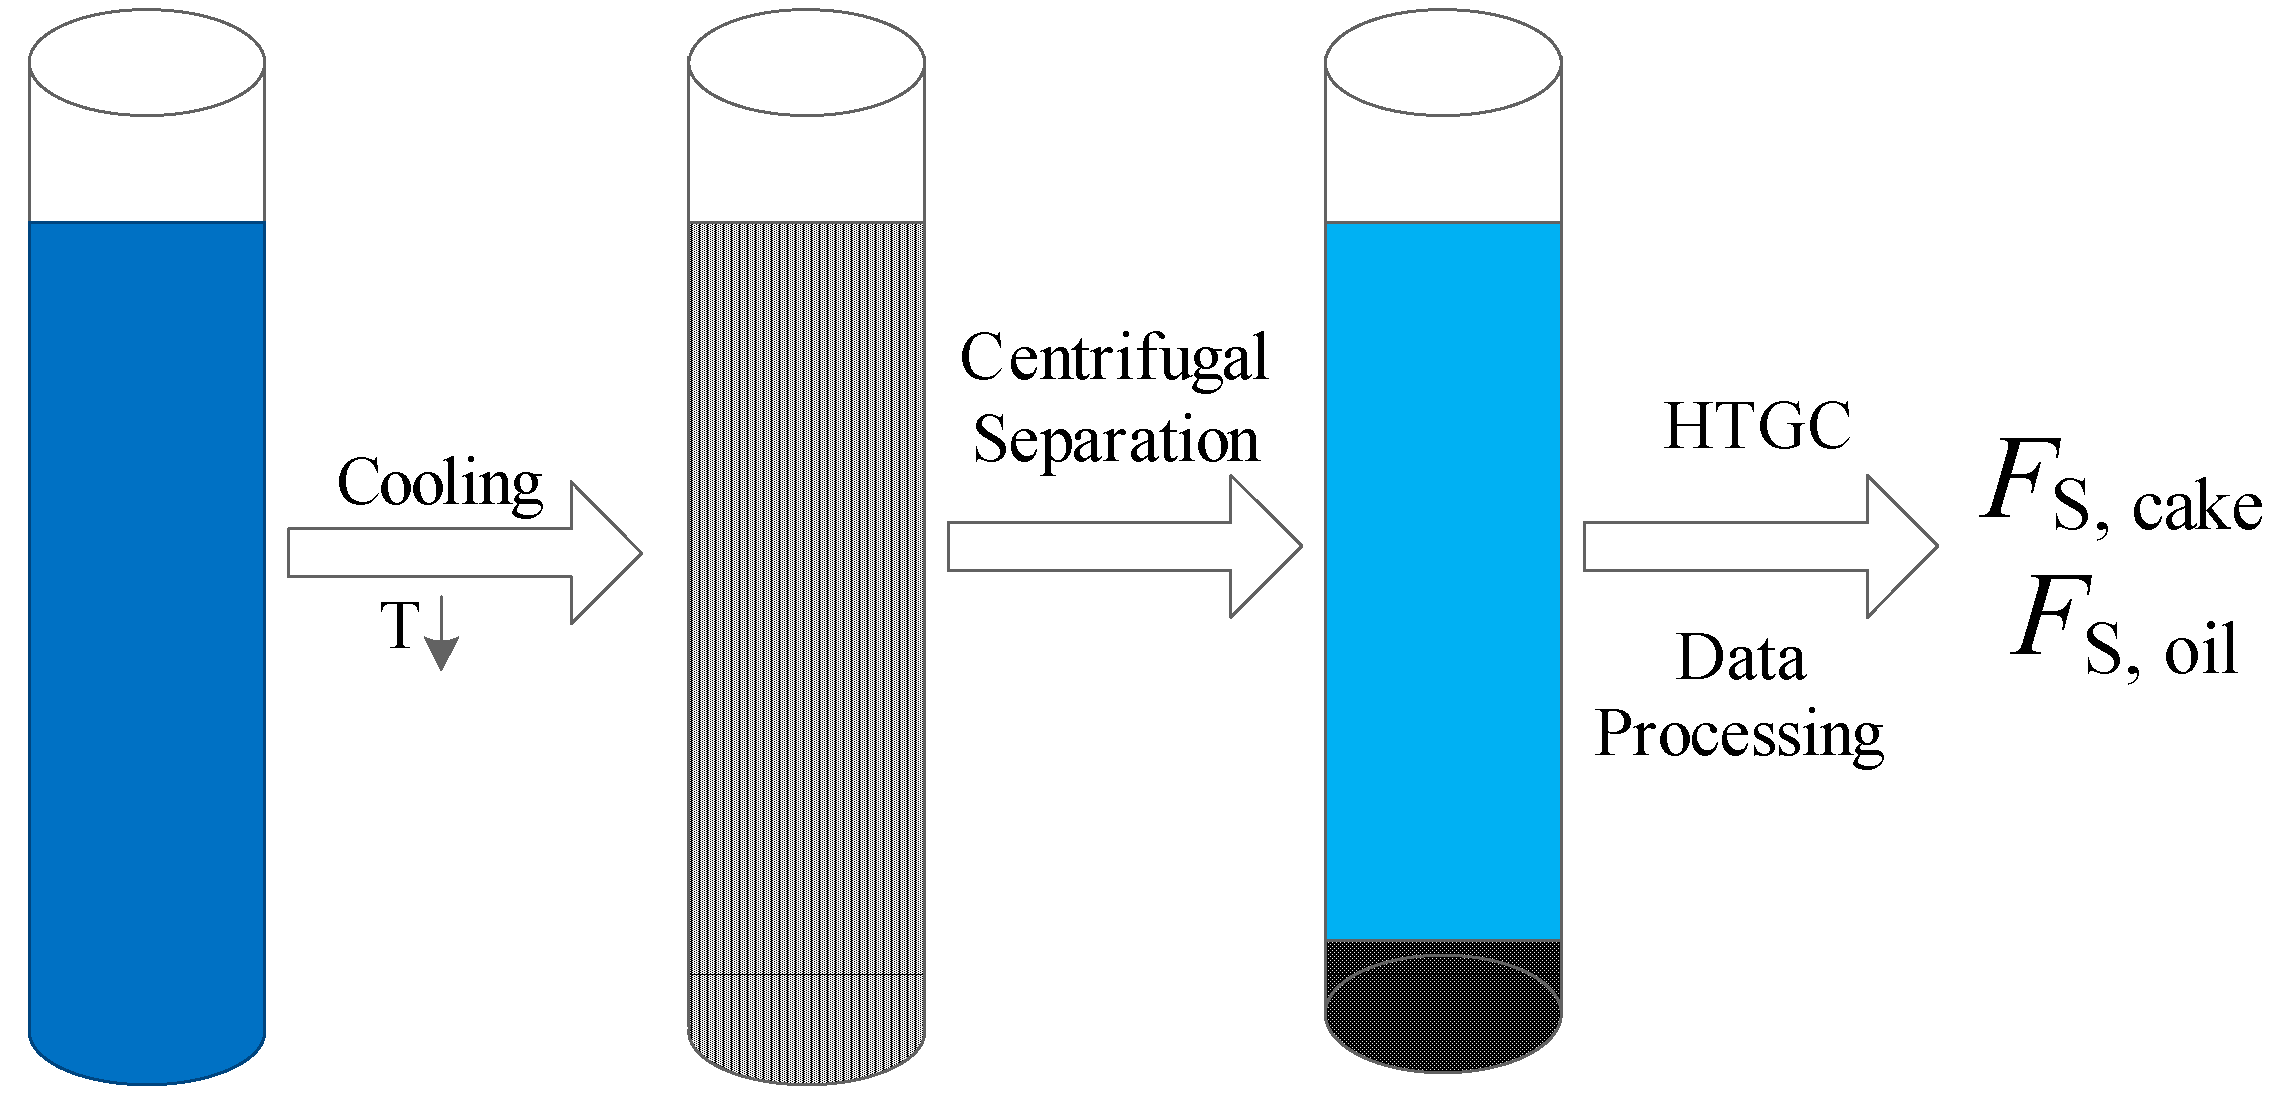
Figure 1. Sketch of the experimental procedure for determining the weight percent of precipitated wax in oil samples using the conventional C-HTGC method.
Energies 14 07035 g001
Figure 2. Analysis of the centrifugation process.
Energies 14 07035 g002
Figure 3. Carbon number distribution of artificial oil.
Energies 14 07035 g003
Figure 4. Carbon number distribution of wax.
Energies 14 07035 g004
Figure 5. The amount of wax precipitated at different temperatures using the conventional and modified methods.
Energies 14 07035 g005
Figure 6. The difference in wax precipitated at different temperatures.
Energies 14 07035 g006
Figure 7. The rate of change in wax precipitation at different temperatures.
Energies 14 07035 g007
Figure 8. The carbon number distribution of precipitated wax at 25 °C, 20 °C, 15 °C and 10 °C for 10% artificial oil.
Energies 14 07035 g008
Figure 9. The carbon number distribution of precipitated wax at 25 °C, 20 °C, 15 °C and 10 °C for 15% artificial oil.
Energies 14 07035 g009
Figure 10. The carbon number distribution of precipitated wax at 25 °C, 20 °C, 15 °C and 10 °C for 20% artificial oil.
Energies 14 07035 g010
Figure 11. The weight percent ratio of each carbon number in precipitated wax at different temperatures of 10% artificial oil.
Energies 14 07035 g011
Figure 12. The weight percent ratio of each carbon number in precipitated wax at different temperatures of 15% artificial oil.
Energies 14 07035 g012
Figure 13. The weight percent ratio of each carbon number in precipitated wax at different temperatures of 20% artificial oil.
Energies 14 07035 g013
Figure 14. The paraffin distribution of 0# diesel.
Energies 14 07035 g014
Figure 15. The amount of wax precipitated at different temperatures of 0# diesel.
Energies 14 07035 g015
Figure 16. The normal paraffin distribution of liquid and solid phase at different temperatures.
Energies 14 07035 g016
Table 1. Distribution of alkanes in 0# diesel of the Lanzhou Petrochemical Refinery.
Alkane ComponentWeight Fraction %Alkane ComponentWeight Fraction %Alkane ComponentWeight Fraction %
C100.092C181.038C250.196
C110.332C190.954C260.129
C120.512C200.821C270.085
C130.956C210.637C280.062
C141.212C220.359C290.028
C151.235C230.332C300.020
C161.252C240.235C310.092
C171.137
Table 2. Wax crystals precipitated from 0# diesel oil at different temperatures.
Temperature, °C420−2−4−6−8
Wax precipitate, wt%0.1821.0341.7643.1885.1877.96311.210
Table 3. Liquid phase and solid phase compositions of 0# diesel at different temperatures.
Alkane Component4 °C0 °C−4 °C−8 °C
Liquid Phase
xiL
Solid Phase
xiS
Liquid Phase
xiL
Solid Phase
xiS
Liquid Phase
xiL
Solid Phase
xiS
Liquid Phase
xiL
Solid Phase
xiS
C110.2080.1750.0830.0180.0820.0180.0400.027
C120.5760.2510.2210.1040.2560.1290.2220.193
C130.7171.6140.5380.3670.5670.4330.5310.595
C140.9031.9480.8561.3200.8731.4800.8522.039
C151.1021.1861.1231.9641.2352.1781.1232.810
C161.1901.3421.1893.0601.2363.4291.2254.315
C171.5052.5181.2783.5371.2593.8161.2474.584
C181.2084.5591.1314.4231.0534.5601.1235.104
C191.1377.6441.2547.7911.2348.4431.1139.762
C200.5128.9280.8329.0940.8979.3500.93310.126
C210.30810.4030.79812.1380.73612.5840.81513.263
C220.13712.2550.53212.3020.56511.5700.63111.508
C230.06610.7670.41611.5080.45710.2550.48210.211
C240.03610.9000.2248.7480.2437.6400.3216.679
C250.0518.9230.0955.8100.1566.2420.2955.104
C260.0235.3560.0575.2670.1454.3350.2624.055
C270.0053.5280.0533.6430.1154.2760.1432.967
C280.0062.5790.0363.3670.0793.2940.0952.205
C290.0031.4700.0332.7340.0422.2320.0691.357
C300.0021.2670.0201.4940.0331.8330.0521.150
C310.0000.7760.0000.8320.0001.1940.0350.786
Non-alkane component88.4310.48088.7370.71089.2311.16090.3051.611
Publisher’s Note: MDPI stays neutral with regard to jurisdictional claims in published maps and institutional affiliations.