Article

Unlocking the UK Continental Shelf Electrification Potential for Offshore Oil and Gas Installations: A Power Grid Architecture Perspective

1
Department of Electronic and Electrical Engineering, Faculty of Engineering, University of Strathclyde, Glasgow G1 1XQ, UK
2
Net Zero Technology Center, Aberdeen AB15 4ZT, UK
*
Author to whom correspondence should be addressed.
Energies 2021, 14(21), 7096; https://doi.org/10.3390/en14217096
Submission received: 6 September 2021 / Revised: 11 October 2021 / Accepted: 19 October 2021 / Published: 30 October 2021
(This article belongs to the Special Issue Advanced Development on Solar, Wind and Tidal Energy)

Abstract

:
Most of the UK Continental Shelf (UKCS) oil and gas (OG) installations have traditionally adopted in situ power generation, which is not only inefficient but also generating about 70% of the offshore CO2 emissions. The offshore wind and energy storage technologies for deep water are developing at a fast pace, enabling great opportunities for the OG installations located in the North Sea. In this paper, a pathway for the UKCS offshore OG installations electrification is introduced. The aim is to provide different power architectures that facilitate the OG installations’ electrification, while benefiting from the existing and planned UK offshore wind power. Four hypothetical case studies (based on real data) were created, along the UKCS, where the corresponding power architectures were proposed. The selection of each architecture power component (e.g., transformers, converters and cables), as well as the transmission and distribution technology (e.g., AC or DC), is also provided and justified. Further, an overview cost estimation is carried out to predict the architecture capital cost. It is concluded that the four architectures can be mimicked not only along the UKCS but also worldwide, promoting the UKCS potential for a world-leading offshore energy hub and fostering the UK offshore wind-energy resources.

Graphical Abstract

1. Introduction

Amongst the United Nations (UN) 17 Sustainable Development Goals (SDGs), set to be achieved by 2030, Goal 7 and Goal 9 are related to energy sustainability [1]. Goal 7 is to “Ensure access to affordable, reliable, sustainable and modern energy for all”, and Goal 9 is to “Build resilient infrastructure, promote inclusive and sustainable industrialization and foster innovation”. Meanwhile, the UK has set a net-zero carbon emission target by 2050 [2]. The climate change committee concluded in 2019 that an energy transition to net-zero in the UK by 2050 is affordable and achievable but also challenging [3]. Historically, in the UK, the major reduction in greenhouse gas (GHG) emissions, which fell by over 43% since 1990, has been achieved in the electricity generation sector by phasing out coal and increasing dependency on cleaner energies, such as gas and nuclear. However, the UK Energy Research Centre (UKERC) has produced a review looking at five key areas, namely electricity, gas, heat, transport and public engagement. Hence, electricity generation is playing a major role in decarbonisation by increasing the use of renewable energy resources. The main source of renewable energy in the UK is wind—particularly offshore. The UK is now an offshore wind global leader, with an aspiration of reaching 75 GW generation by 2050 [3].
With all this effort toward net-zero, a key challenge is the emissions generated from the offshore OG installations. In 2018, for example, the OG production generated around 13.2 million tonnes of CO2 emissions per annum in the UK—with similar figures for refineries [4]. Around 74% of these emissions are the result of electricity generation, as installations rely on their own produced gas for fuel in open-cycle turbines. This in situ electricity generation is significantly more carbon-intensive than electricity supplied from the onshore transmission networks. During 2019, operators paid up to £25.5/tonne of CO2 released [5]. Higher CO2 prices in future are most likely, which will further incentivise the decarbonisation of operations.
Many energy users will still need liquid and gaseous fuels for the foreseeable future, for both energy and feedstock, including beyond 2050. Therefore, more reliable and decarbonised OG production options are inevitable. Amongst several pathways for OG operators to contribute to the net-zero UK emissions target, proposed by Oil and Gas UK (OGUK), is to develop a world-leading low-carbon offshore industry that only has 0.5 million tonnes of GHG emissions by 2050—to allow for flares. A key contributor to this target is replacing the in situ power generators with green power sources [6].
There exist some platforms (PFs) that are powered from onshore grids via High Voltage Direct Current(HVDC) or High Voltage Alternating Current (HVAC) links in the North Sea, specifically in the Norwegian Continental Shelf (NCS). The main data for some HVDC-based onshore powered OG Platform (OG-PF) projects are given in Table 1. The HVAC is preferred over HVDC transmission in some projects, as summarised in Table 2.
Powering the OG PFs from the nearby offshore wind farms has been studied in [13,14,15,16]. These are theoretical studies considering several scenarios utilising the existing nearby offshore wind farms to reduce the CO2 and NOx emissions. Additionally, in Reference [17], combinations between a small offshore wind farm and solar panels are suggested to power an OG PF of 10 MW power demand. Apart from the theoretical studies, the Norwegian government has approved funding of up to US$256 million to support a project that would develop the world’s first floating offshore wind farm to power offshore oil and gas installations in the Norwegian Continental Shelf (NCS) [18]. The offshore wind farm will consist of 11 floating wind turbines with a total capacity of 88 MW, enough to meet around 35% of the annual electricity needed for the five existing oil and gas platforms at the Gullfaks and Snorre fields.
This paper aims to provide less-carbon-intensive electrification solutions of the UK Continental Shelf (UKCS) offshore OG installations by proposing four different power-grid architectures that can be deployed and mimicked along the UKCS, hence allowing reduced dependency on gas turbines (GTs). The UKCS comprises those areas of the seabed and subsoil beyond the territorial sea over which the UK exercises sovereign rights of exploration and exploitation of natural resources. This includes parts of the North Sea, the North Atlantic, the Irish Sea and the English Channel. Without loss of generality, this paper will focus on the North Sea part of the UKCS. The four architectures are summarised as follows:
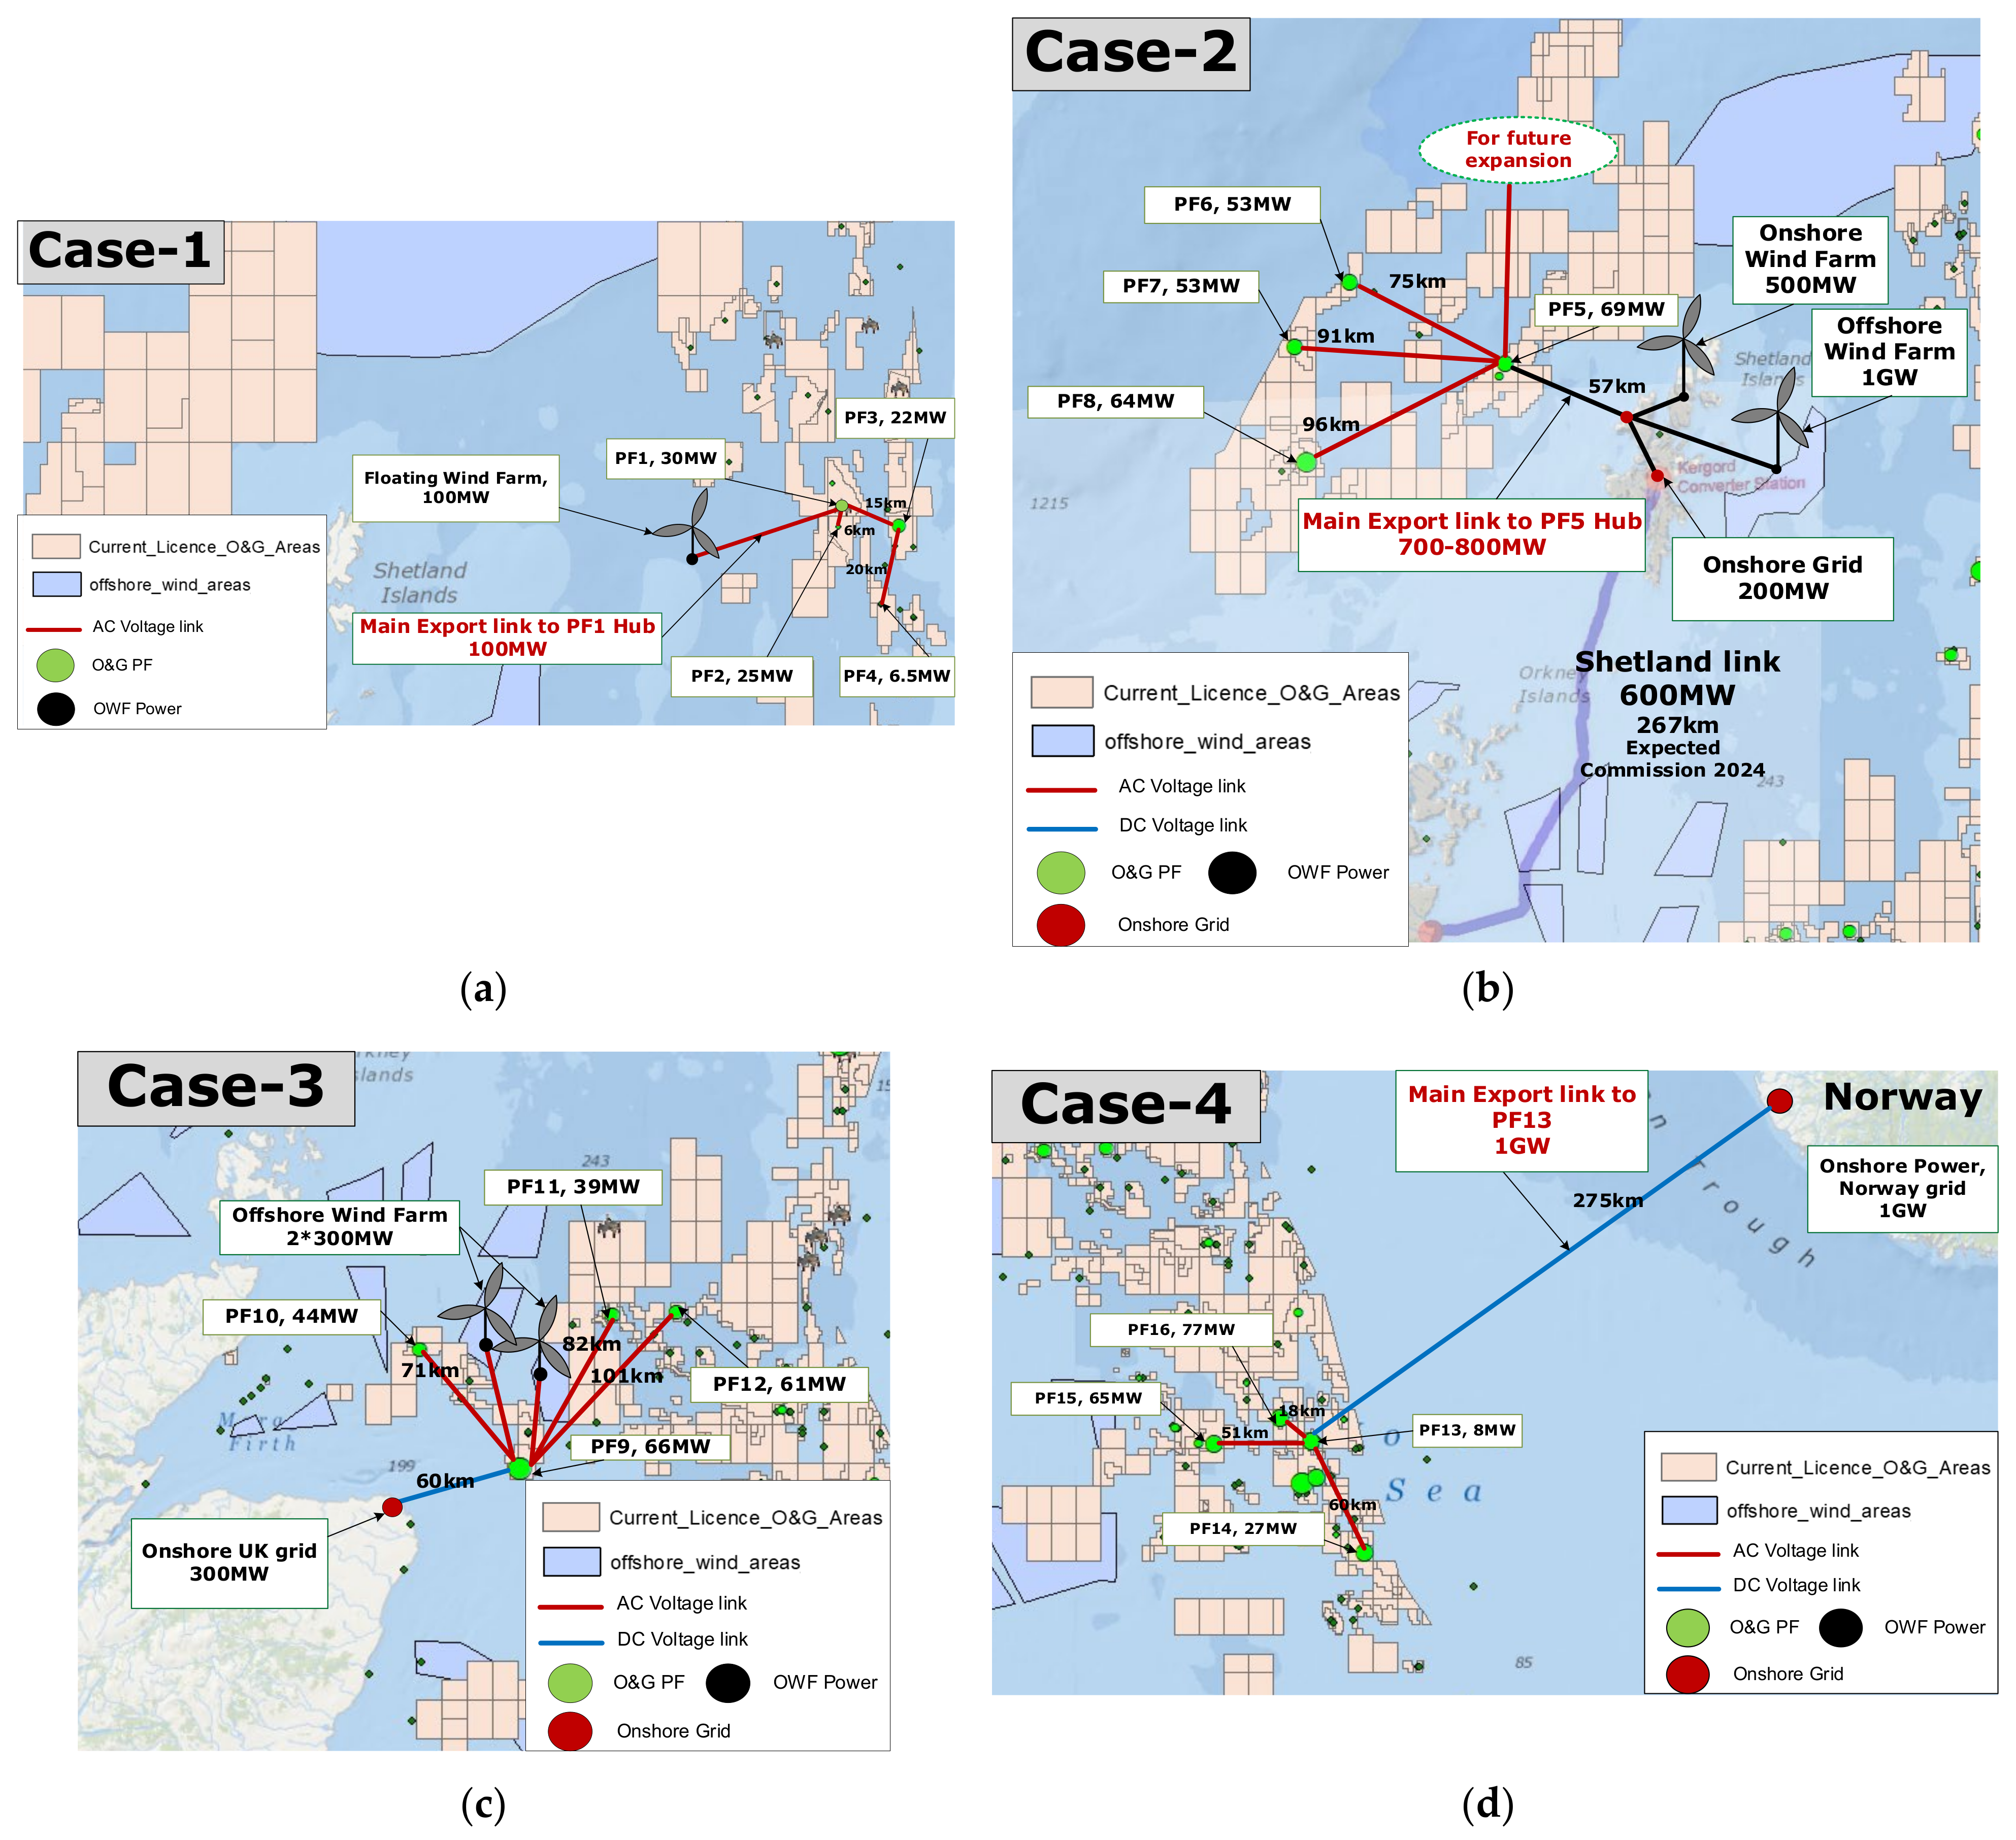
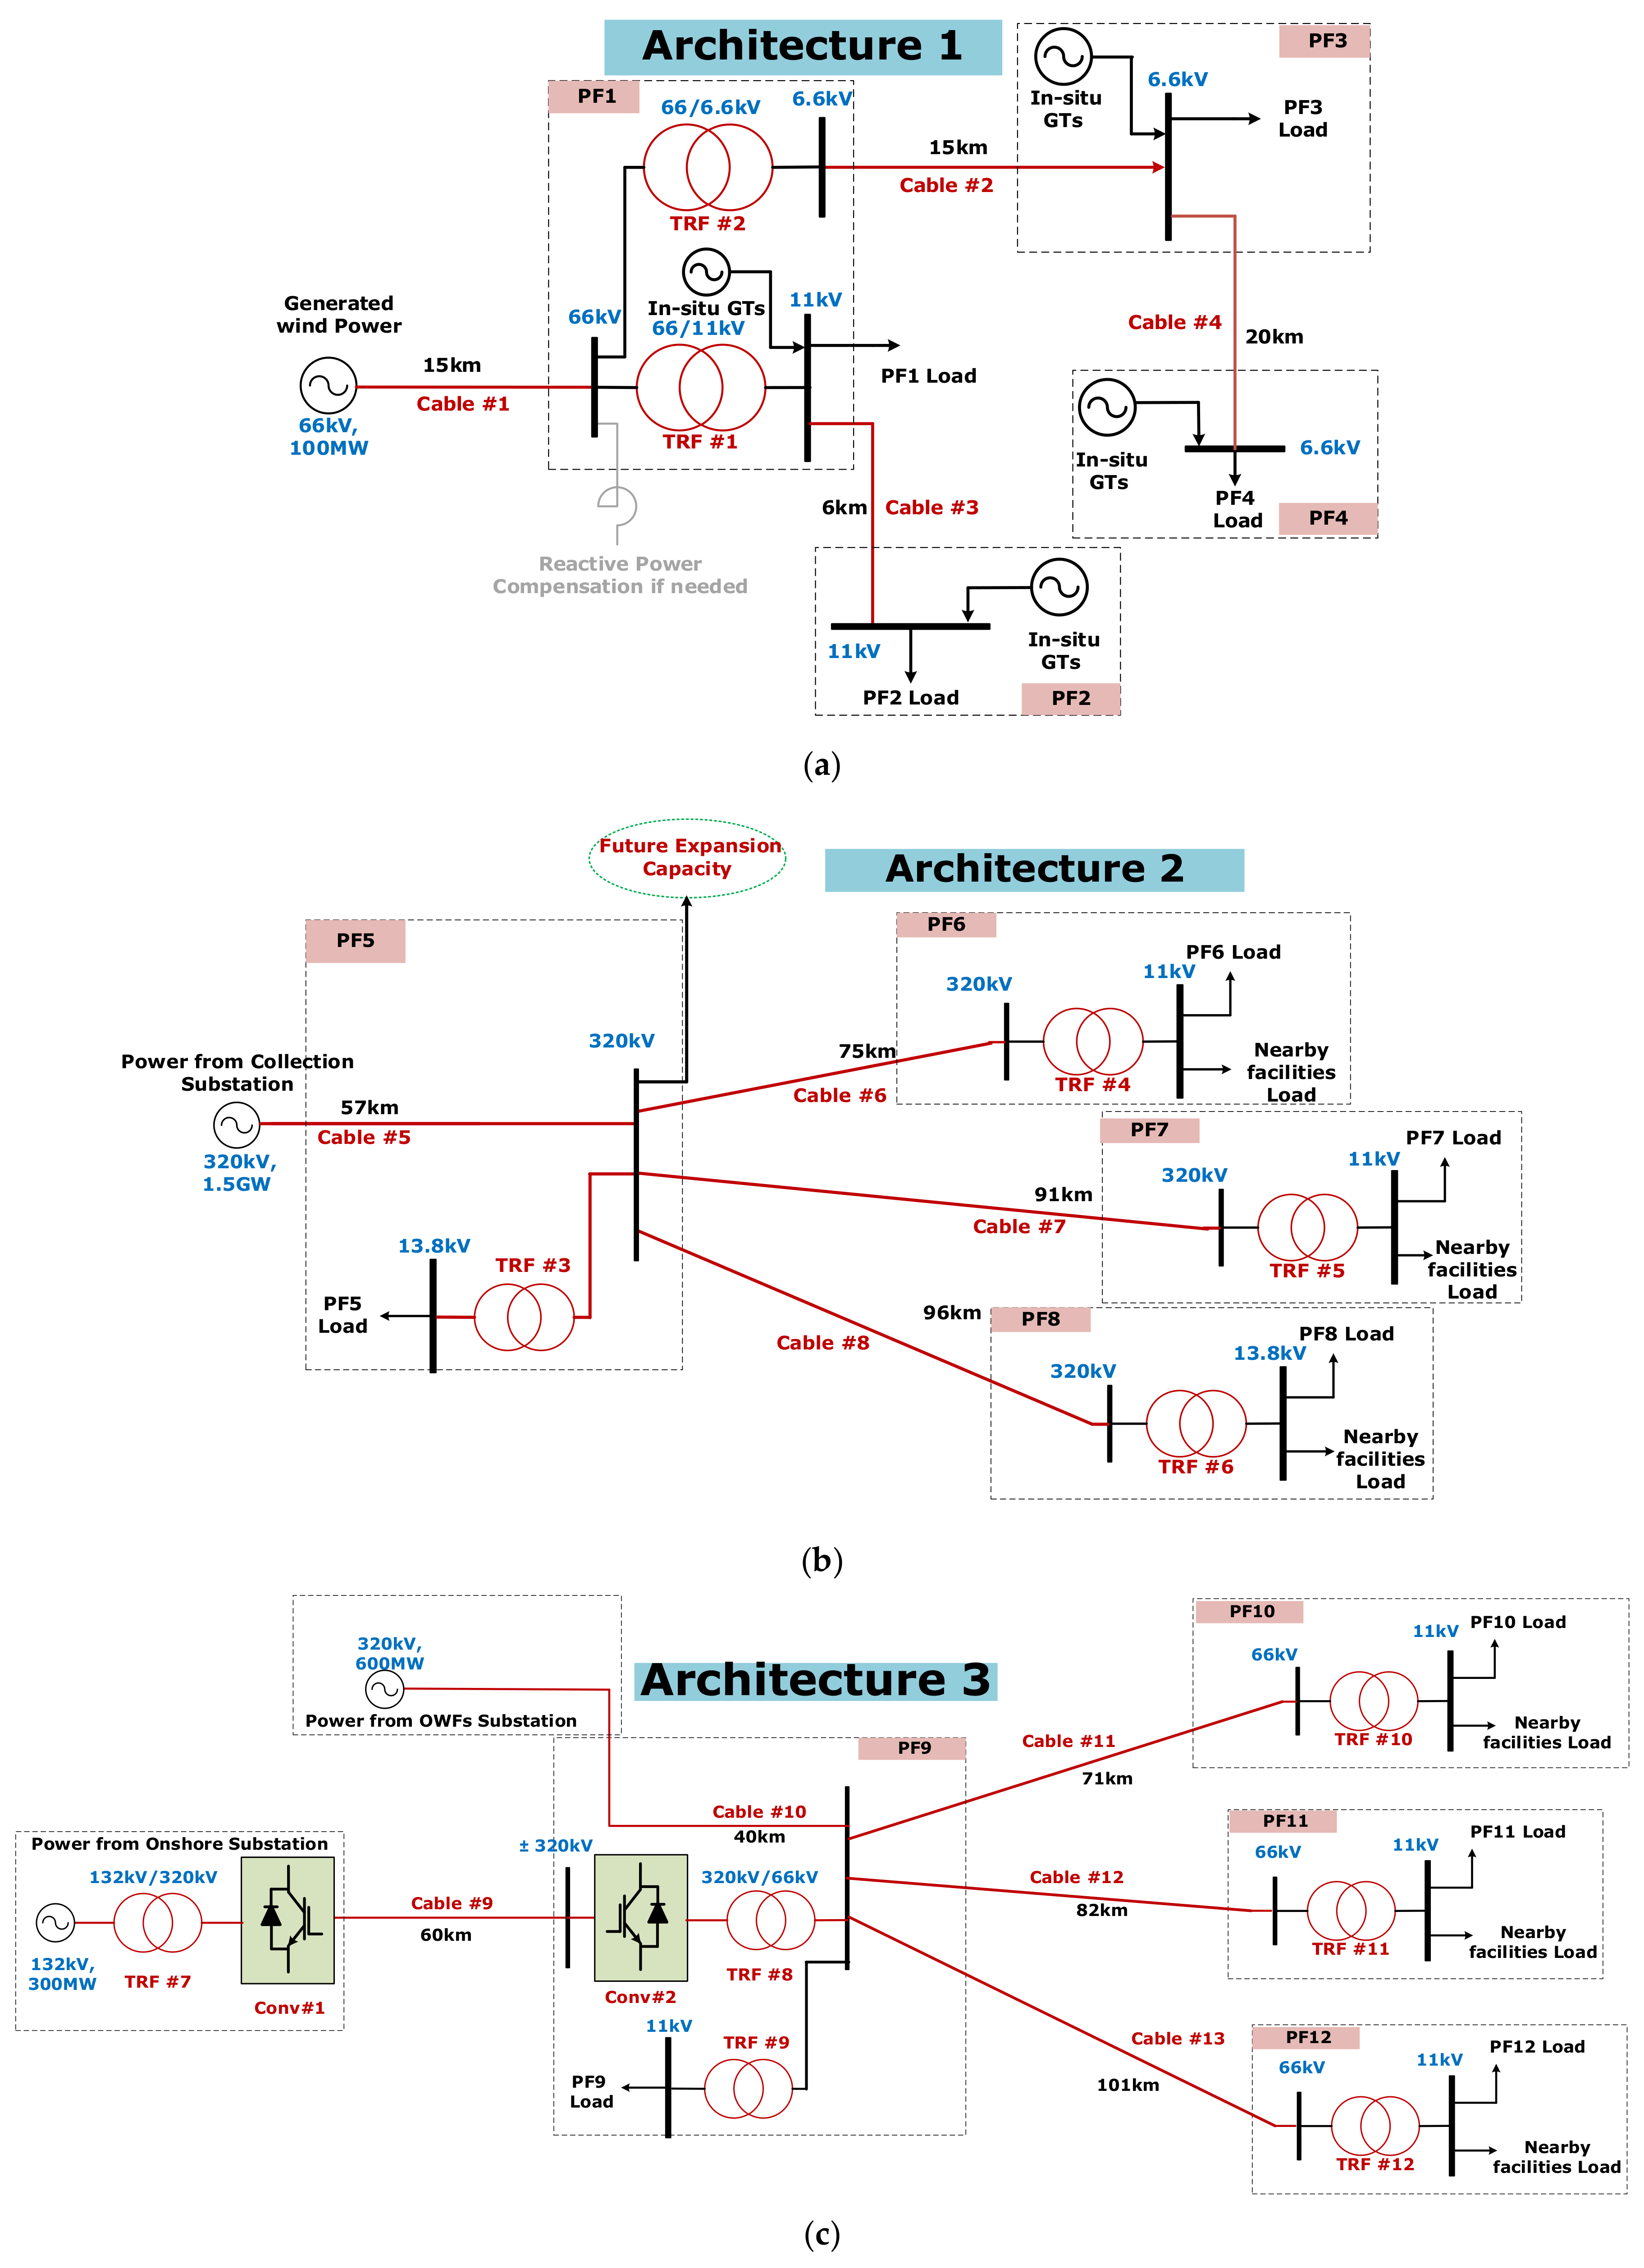
  • Architecture 1: Utilise the installation of a local floating wind-farm feeding a network of isolated OG PFs.
  • Architecture 2: Create a power hub fed from large-scale wind farms; therefore, access to clean energy is made possible.
  • Architecture 3: Create a network of offshore wind power, onshore grid power and OG PFs. The power direction and amount are fully controlled and flexible.
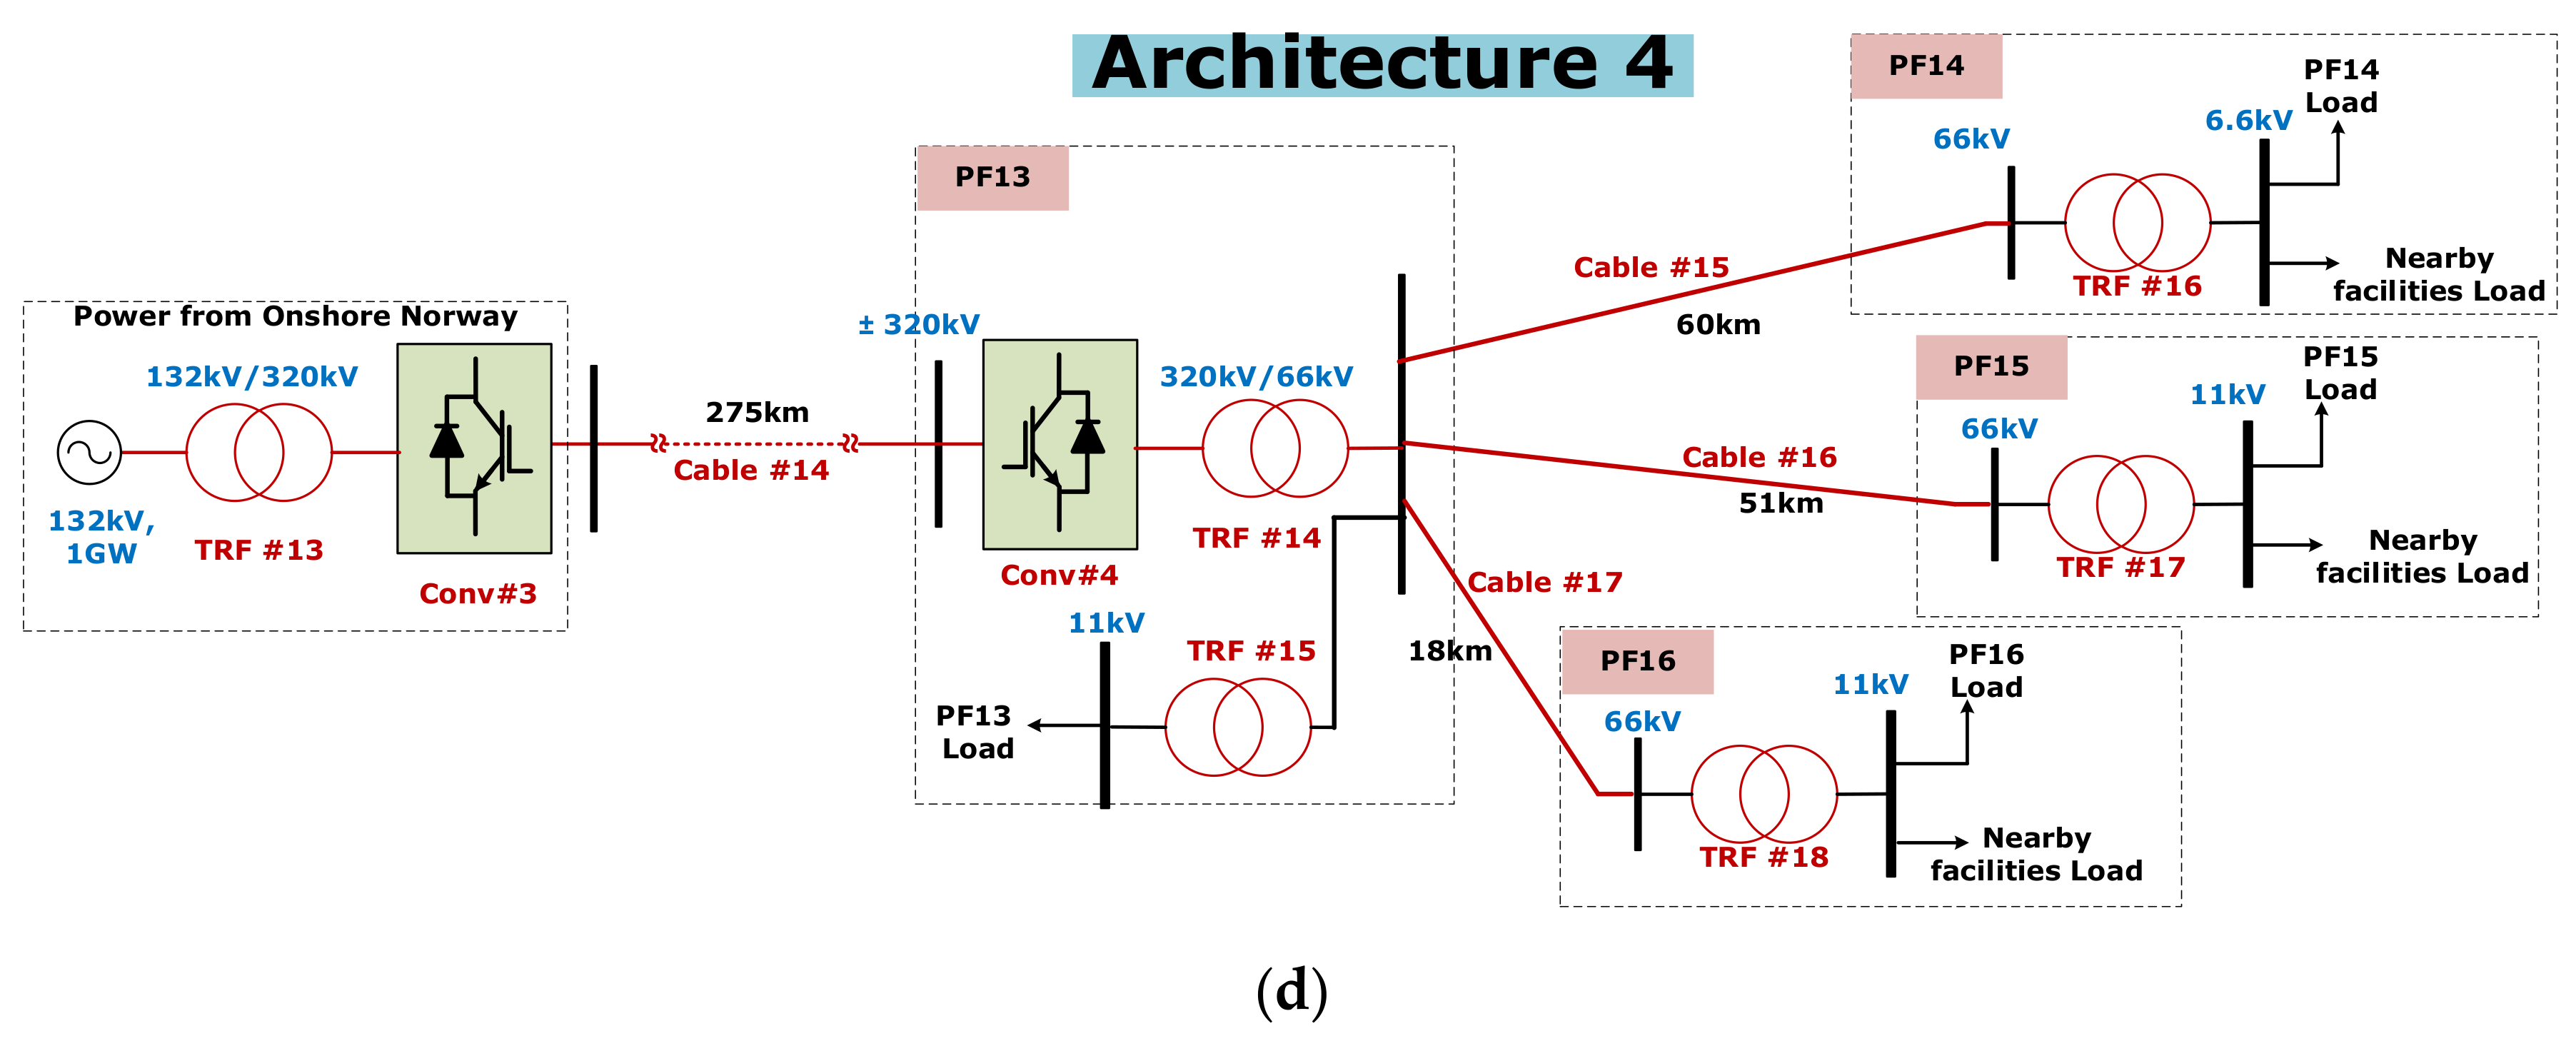
  • Architecture 4: Providing the possibility of connecting remote OG PFs to other nearby countries’ grids—Norway, for example.
As a result, this paper provides different power architecture alternatives that facilitate the OG PFs’ electrification, while benefiting from the existing and planned UK offshore wind power. To demonstrate the proposed architectures, four hypothetical case studies were created along the UKCS, where the corresponding architecture fits. The selection of each architecture power component (e.g., transformers, converters, cables, etc.), as well as the transmission and distribution technology (e.g., AC or DC), is also provided and justified. Further, an overview Capital Expenditure (CapEx) estimation is carried out. It is worth mentioning that, although the four case studies are hypothetical, the study is based on actual up-to-date Geographic Information System (GIS) maps and data for both the OG installations and the offshore wind licenced areas. Finally, the PFs’ actual names and operators for each power architecture were anonymised and disguised for non-disclosure agreement (NDA) confidentiality reasons.

2. Offshore OG-PF Electrical Demand

2.1. Typical Offshore OG-PF Load Types

Offshore electric loads are similar to concentrated industrial onshore loads. However, the space limitation, cost of maintenance and distance to the utility grid differentiate them from their onshore counterparts. The offshore loads can be classified based on power consumption, distance from shore, operational requirements, load cycles and depth of operation [19]. Generally, offshore OG operations can be classified into two main types: surface operations and subsea operations. The total OG-PF electrical power demand can range from 10 MW to several hundreds of MW [20]. A lot of specialised, heavy types of equipment are used for drilling and oil/gas extraction. This includes equipment such as a crane and hoisting system, large engines, turntables and pumps. Once the oil/gas is being produced, power is needed to extract, separate, produce and store the oil/gas. This includes the use of a large electric motor to drive pumps and compressors. The OG PF also must provide employees with their energy needs while they are housed on the OG PF. Large generators need the power to desalinate water, power-washing machines, provide a heating source for cooking and even process waste [21]. OG PFs resemble mini-cities unto themselves. Generally, any OG PF’s load profile is fairly constant except for the moments where a large motor is connected/disconnected [20].

2.2. Estimating the OG PF’s Load Demand

It is quite challenging to identify the actual power demand for each OG PF in the UKCS, as most of these data need to be provided from the operators themselves and will be NDA data. However, a simple methodology for estimating the power demand of the OG PF from its CO2 emission environmental report is adopted. Although it is an estimation method, the comparison with real data from operators proved its effectiveness, and it alleviates the need for a prolonged process of obtaining the actual data. The method is based on breaking down the total platform CO2 emission based on the method provided in the environmental report by OGUK [4]. These emissions are not only generated from the on-platform electricity generation but other sources as well. These sources can be varied from heating, flaring and venting. Nevertheless, still, electric power generation is the major CO2 emission source. As a result, it can be concluded that the percentage of CO2 emission due to power generation is 74% of CO2 total emissions (9.7 million tonnes) in 2018, for example. For simplicity, all the offshore OG installations will be assumed to have GTs. This may slightly affect the estimated power, as oil-based generators have higher emissions per kWh. For offshore, the GTs emission intensity factor (i.e., the corresponding CO2 amount per kWh) is 460 g CO2/kWh [22]. Therefore, the total UKCS’s consumed power in 2018 can be calculated as follows:
P e s t = C O 2   e m i s s i o n   i n   t o n n e s × 0.71 e m i s s i o n   f a c t o r × 8760 = 9.7 × 10 6 460 × 8760 = 2.4
where P e s t is the estimated average load demand power over one year period. The obtained number means that the electricity load is only as high as 2.4 GW. However, if the heat-load requirement is to be obtained from the electric supply, this load demand will be increased. The Digest of UK Energy Statistics (DUKES) proposed the 1/3:2/3 method to apportion fuel used to heat and power assumes that twice as many units of fuel are required to generate each unit of electricity than are required to generate each unit of heat in the GT [23]. As a result, the estimated total power with heat inclusive is calculated as follows:
P t o t = 1.5 × P e s t = 3.6
where P t o t is the total average estimated power demand, including the heat load. Following the same approach, the targeted OG PF electrical demand can be estimated. The CO2 emission figures are public domain, which can be used to estimate the PF power demand. This method has only been introduced here as an alternative for power-demand calculations for the OG PFs when it is difficult to access the real PF data. Nevertheless, the data used in this paper are real, but we anonymised the corresponding PF name and operator.

3. The UK Offshore Wind

By 2030, offshore wind will provide almost 7% of the EU electricity, and almost 91% of this contribution will be supplied from the North Sea [24]. Generally, the North Sea wind resources nearby offshore OG PFs are often excellent due to higher average wind speed and lower turbulence intensity and wind shear compared to most onshore wind-farm sites [24]. In the UK, the tendency to install and utilise offshore wind energy is in continuous increase with the aspiration to reach 40 and 75 GW by 2030 and 2050, respectively. For example, offshore wind-energy production rose from 16.4 to 20.9 TWh (27% increase) between 2016 and 2017 [25]. Moreover, offshore wind is set to power more than 30% of British electricity by 2030 [26]. The UK, in general, has the highest offshore wind installed capacity of 10 GW installed capacity cumulative share by EU countries in 2020. Moreover, to harness more offshore wind energy in deep water (60–900 m water depth), fast development in floating wind technology is needed. A 30 MW pilot floating offshore wind farm (OWF) project comprising five of Equinor’s Hywind turbines is fully commissioned in Scotland’s North Sea. The floating wind project MW sizes are still less than 100 MW, according to Equinor; in the next phase of technology, maturity levels of 200–500 MW are expected by 2026, and the GW level is expected to be unlocked by 2030. The current levelised cost of energy (LCOE) for floating wind projects is £85/MWh and by 2023, with expectations to achieve a 50% reduction in CapEx and reach LCOE of £36–54/MWh for future floating wind projects [6]. Conversely, fixed bottom technology in shallow water (up to 60 m water depth) is well established, and its LCOE in 2019 is £39.5/MWh. It is worth mentioning that advancement in floating wind technology will not only provide green energy to the UK power grid but also will allow access to deep-water OG resources [27]. For example, the OGUK estimates the net OG resources in the Shetland area by 25% of the UK reservoir. This area is one of the best offshore wind locations in the North Sea, but its water is deep; therefore, it can ultimately benefit from floating wind technology maturity and cost reduction. As a result, this paper will shed light on the possible offshore power architectures, allowing us to tap into these energy resources.

4. The Hypothetical Case Studies

In the previous sections, a summary of the UKCS OG PF’s nature and the offshore wind-energy resources were introduced. In this section, four case studies corresponding to the proposed power architectures will be introduced. The main theme of these power architectures is to provide less carbon emission power solutions with reduced cost and increased dependence on offshore wind energy. These solutions are viable for both the brownfields (i.e., OG field that is near the end of service time) and green fields (i.e., OG field at the start of service time). The four case studies are illustrated in Figure 1 while their description is given in Table 3.
For the sake of illustration, 16 OG PFs distributed along the UKCS are used, as shown in Figure 1. The related load demand and AC voltage rating for these PFs are summarised in Table 4 and were used during the power architectures’ designs. The primary focus of this study is to provide power sources to the UKCS OG PFs. Therefore, distributing the power inside the platform itself and how the platform will operate this power in terms of transients, contingencies and energy storage fall beyond the scope of this study. These kinds of studies require full engagement of the OG-PF operators to provide their detailed operation and needs. Additionally, incorporating offshore wind as a primary power source requires energy storage to ride through power fluctuation. The straightforward energy storage is batteries. However, hydrogen cells and carbon capture and storage can play a future major role [6]. Additionally, for isolated systems, similar to Case-1, the GTs can help to overcome these fluctuations. A challenge to that is the GHG emissions, but studies show that the best solution for incorporating these in situ GTs is to operate them in ON/OFF mode; therefore, the total emissions will be reduced by 70% compared to their continuous ON operation without loading [28].

5. Wind Farms’ Layout and Power Densities

Based on the proposed case studies, apart from Case-4, all the cases rely on wind energy either partially or totally. Therefore, exploring the relevant power layout for the corresponding wind farms is important.

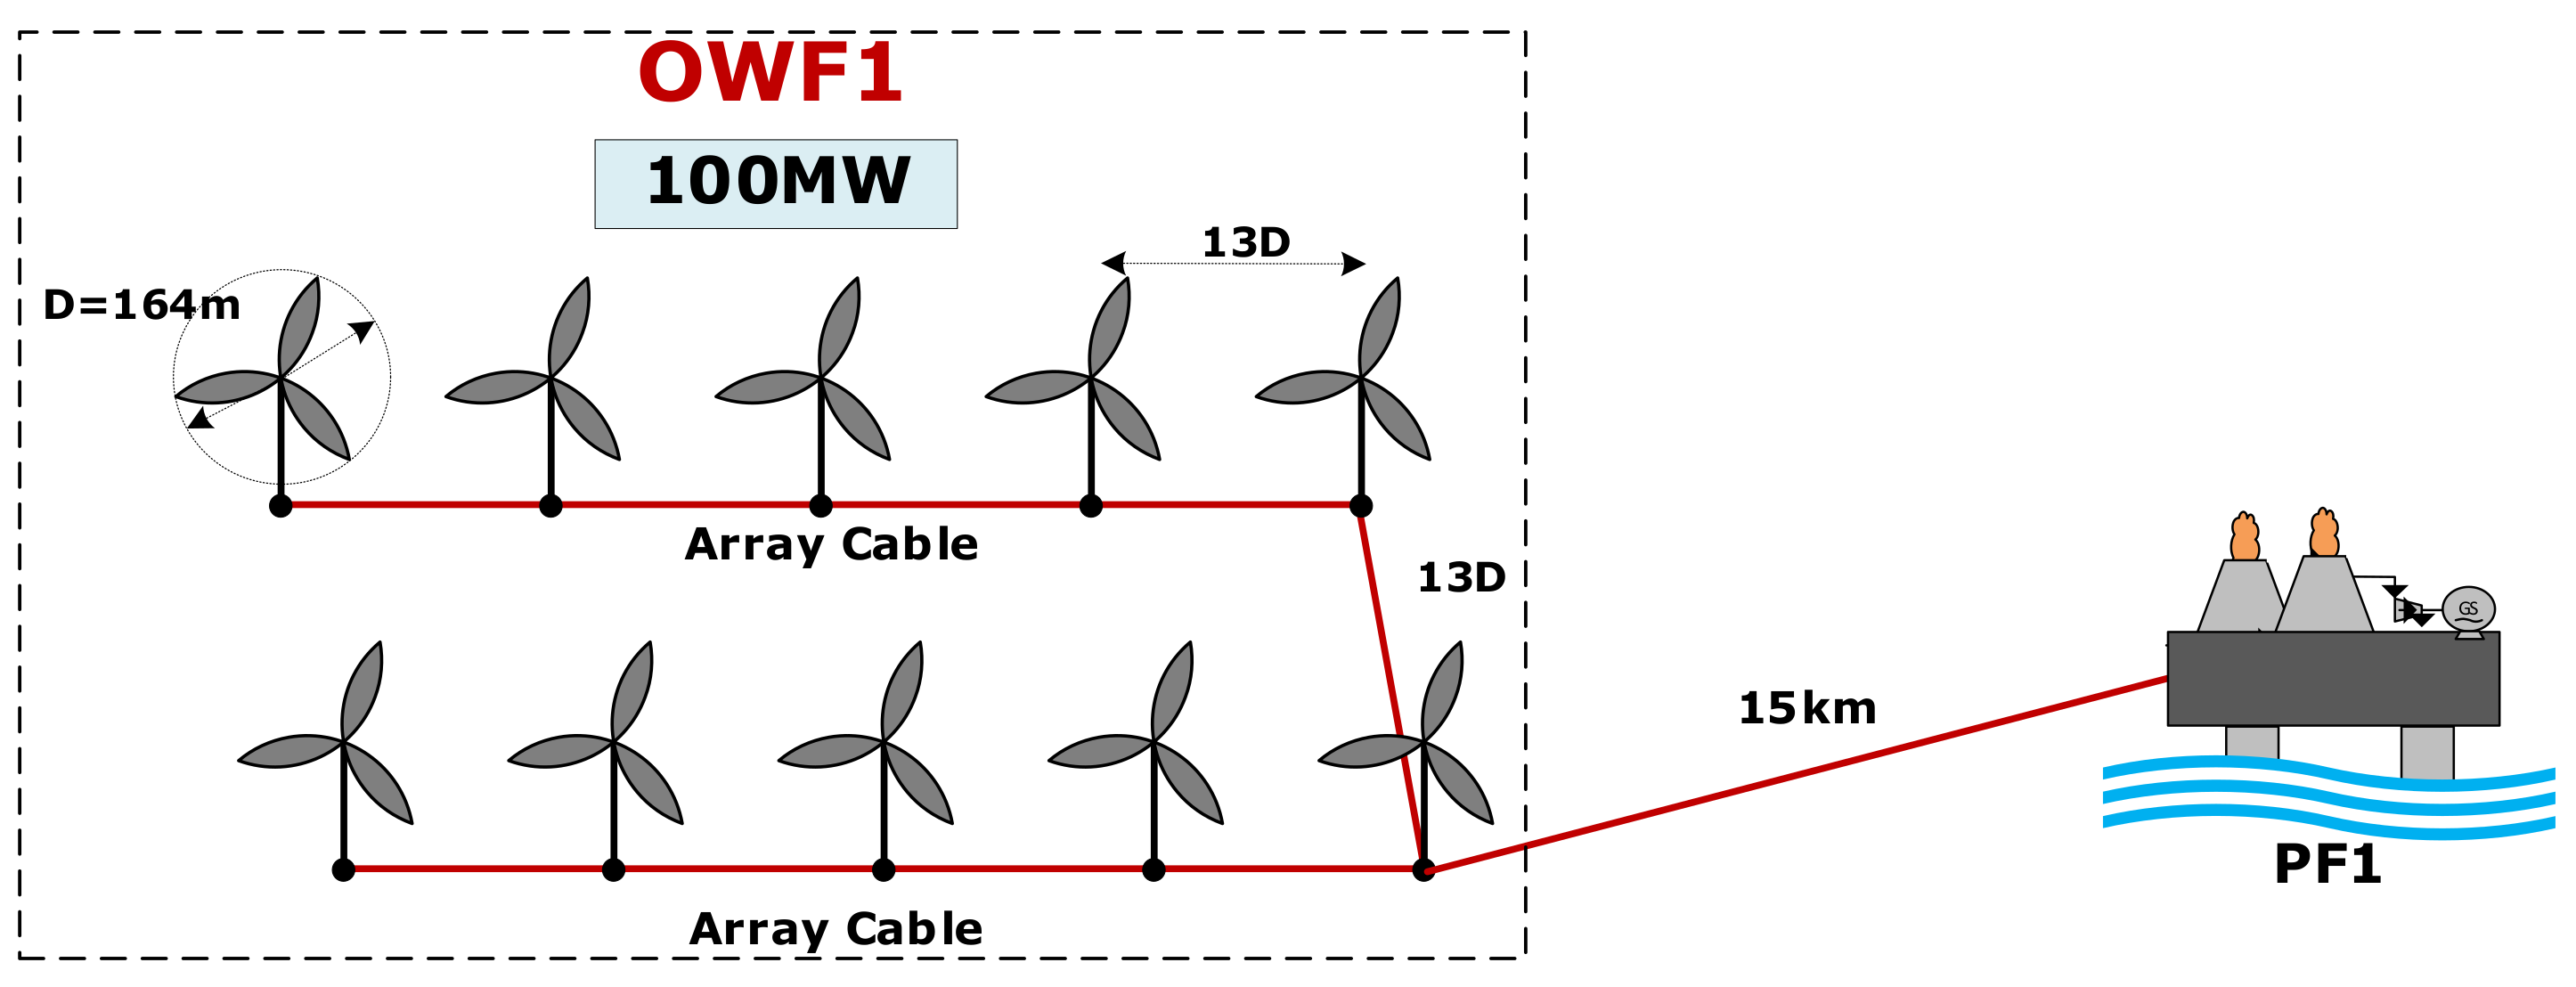
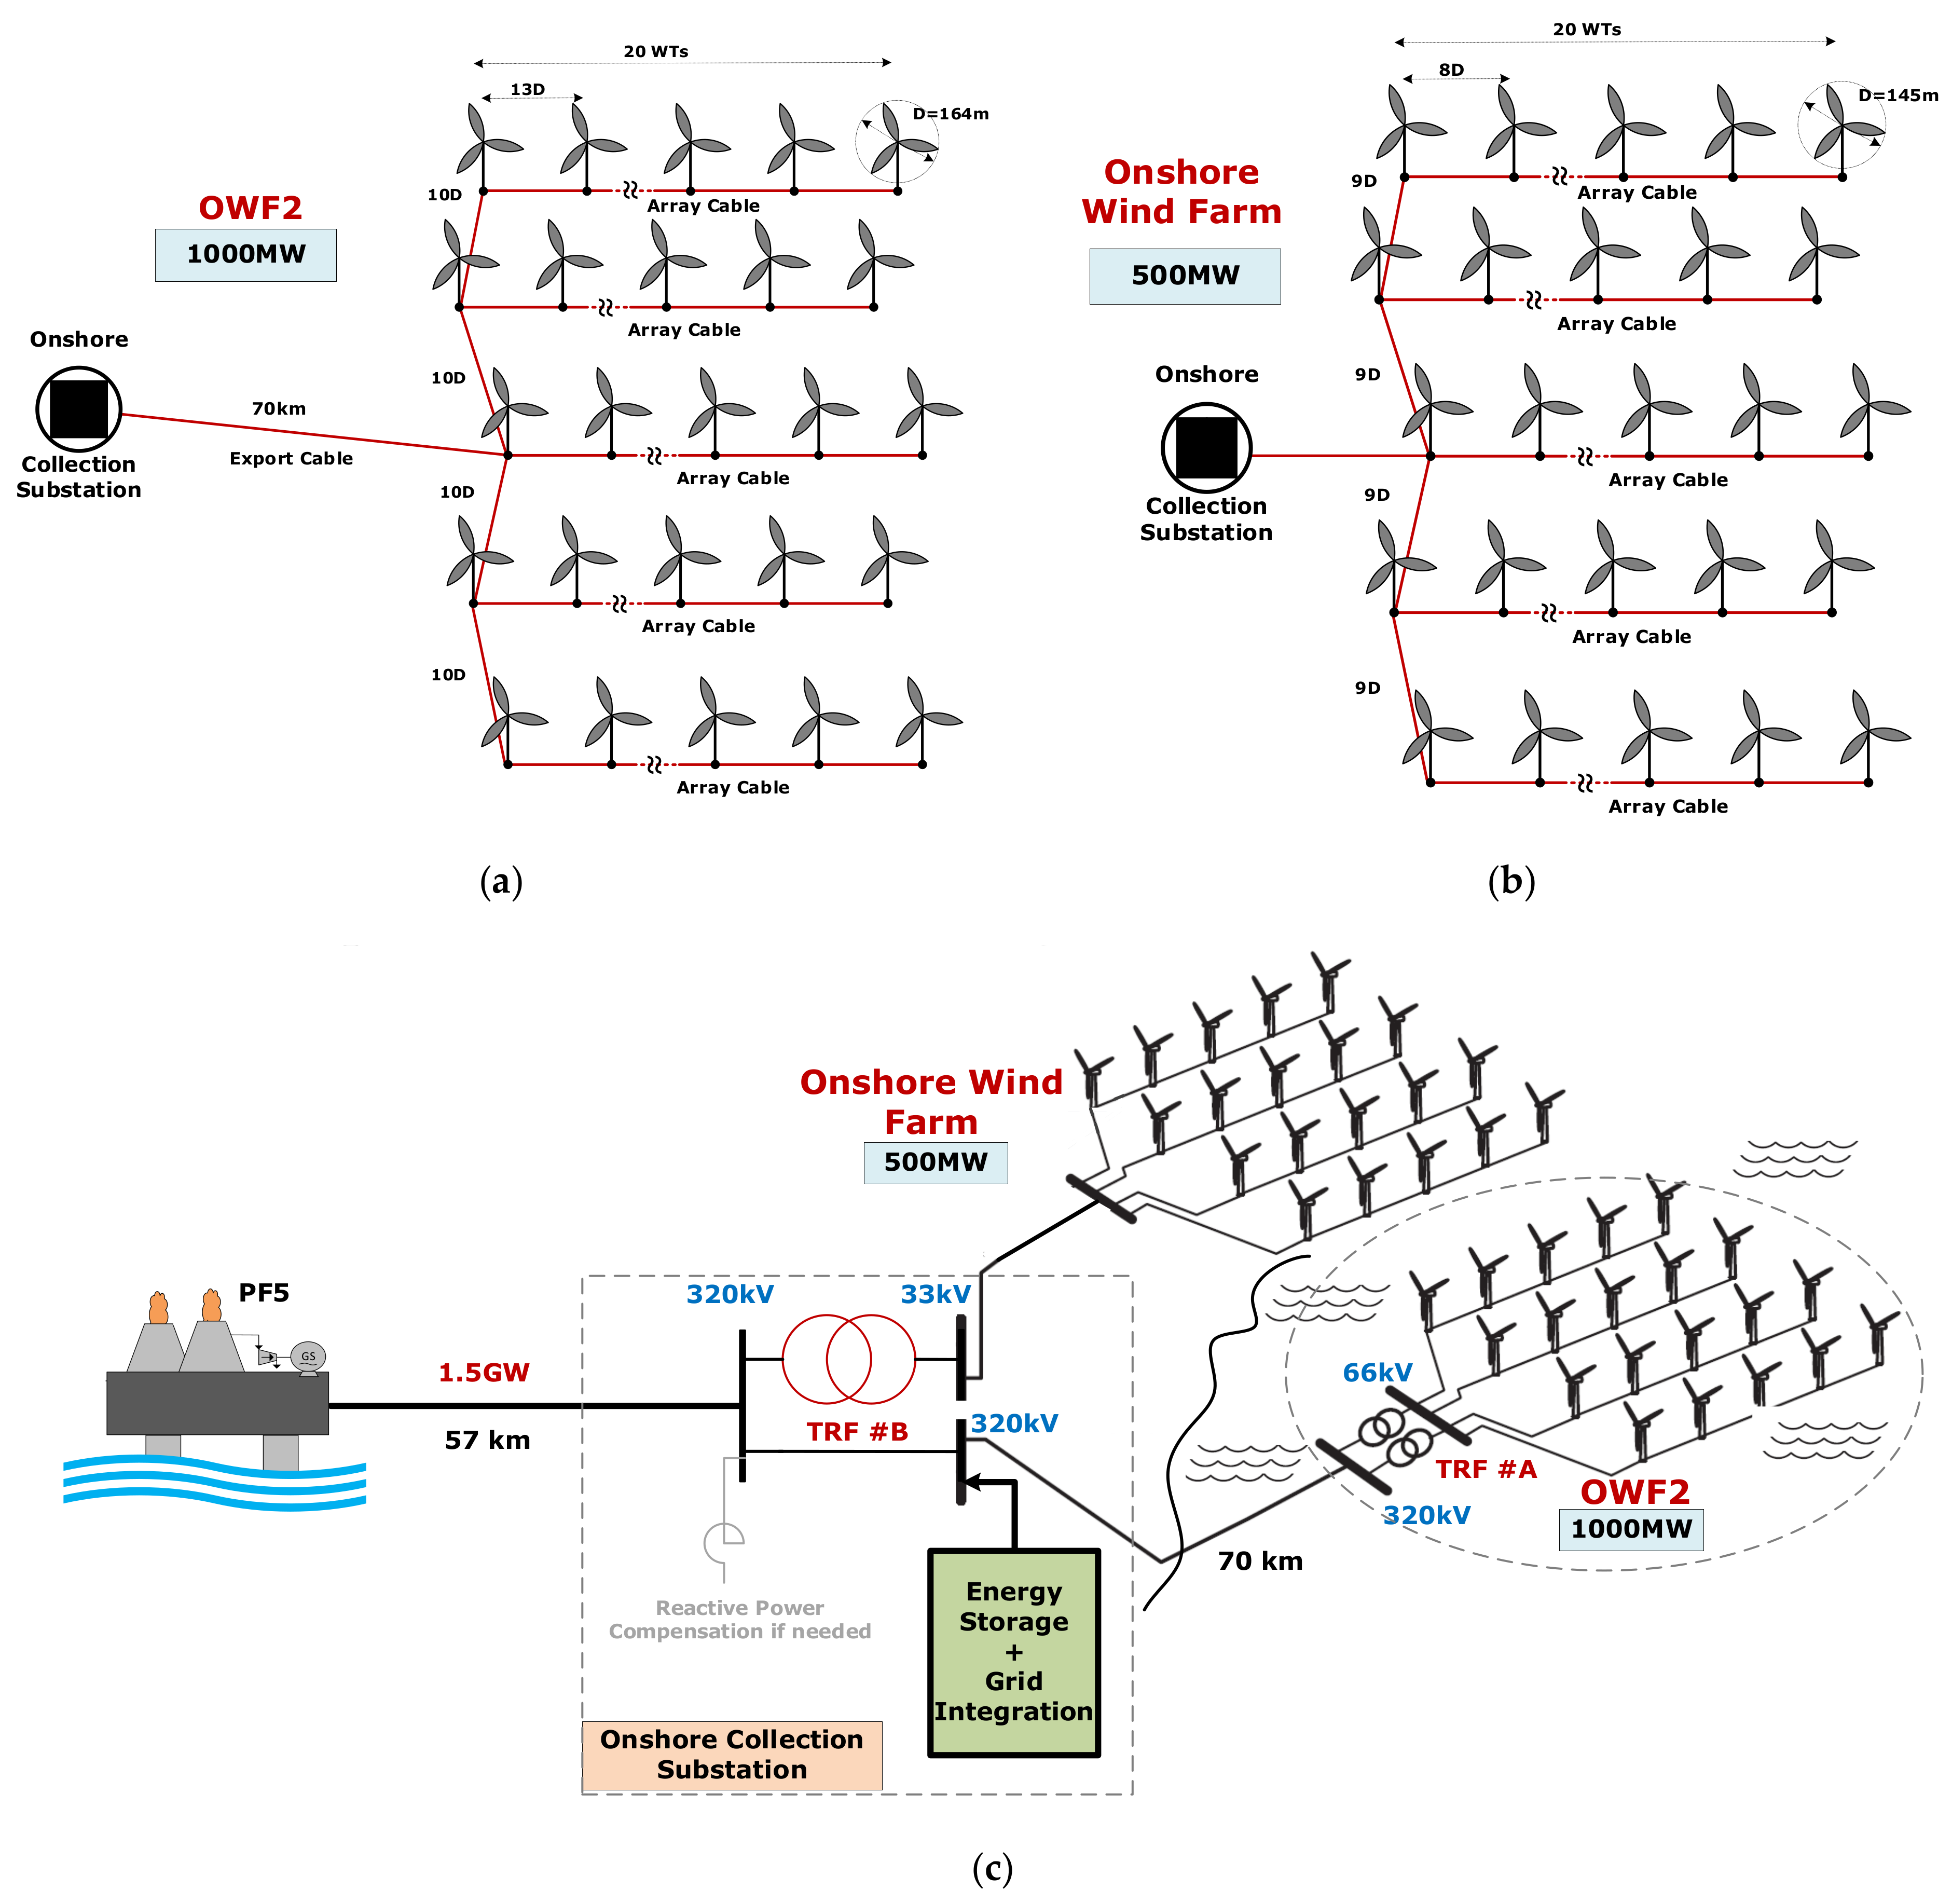
5.1. Offshore Wind Farms

On average, the capacity densities for European wind farms in the North Sea range from 5.0 to 5.4 MW/km2 (London array, for example, is 5.2 MW/km2); this comprises all the areas required for the farm, including the safety-area operation and turbines layout [29]. It is worth mentioning that, in some cases, the capacity density is much lower; for example, the Hywind project in Scotland has a capacity density of 2.0 MW/km2. The capacity factor is assumed to be Cp = 0.45; hence, the available power from the wind farm will be 45% of the installed capacity. For all the cases under study, the water depth is higher than 60 m; hence, floating wind turbines are adopted. For sake of illustration, the Wind Turbine (WT) V164-10.0 MW provided by Mitsubishi Heavy Industries (MHI) Vestas Offshore Wind is used with a rotor diameter of 164 m [30]. A summary of the case’s specifications is detailed in Table 5.
A common practice in the wind turbine layout is based on a wind farm consisting of a rectangular grid of turbines, spaced with a distance range between 3 and 13 turbine diameters in both the crosswind and downwind directions [31]. Normally for large wind turbines, a turbine spacing of 13 rotor diameters (13D) in the prevailing wind direction and 10D in the crosswind direction is utilised. The detailed layout configurations for the OWFs along with the proposed distance from the selected OG PF power hub are shown in Figure 2, Figure 3 and Figure 4 for Case-1, Case-2 and Case-3, respectively.

5.2. Onshore Wind Farm

Since the power demand of Case-2 is large, a diversified power source is required to increase supply security. Most of the power would be supplied from OWF2, and a small onshore wind farm would be adopted, taking the advantage of Shetland as one of the best onshore wind locations in Europe [32]. The power density factor in Shetland is assumed to be 4.5 MW/km2; similarly, the Viking project is around 3.5 MW/km2 [33]. As a result, the required area for the proposed wind farm is estimated as being ≈110 km2. The main specifications for the proposed onshore wind farm are summarised in Table 6. The adopted WT is SG 5.0-145 by Siemens Gamesa, with rotor diameter D = 145 m [34]. The proposed layout of the onshore wind farm is depicted in Figure 3b.

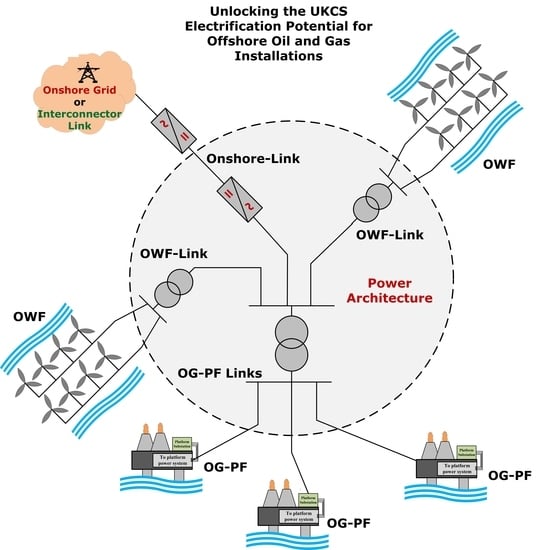
6. Proposed Power Architectures for UKCS Offshore OG PFs’ Electrification

In Figure 1, four case studies covering the proposed electrification scenarios for the UKCS were introduced. The corresponding power architectures for these cases are illustrated in Figure 5. All the wind farms’ power is lumped into one AC power source at the rated collection power and voltage for simplicity.
The power architectures require installing new cables and transformers; these are numbered in each power architecture, as shown in Figure 5. To facilitate these component selections and to envisage the relevant costs, the following assumptions are made:
  • In all the proposed architectures, one of the platforms is selected (based on the available space on it and the closeness to other platforms) to be a power hub. Hence, hub and designed architectures are adopted.
  • All the power generated from the wind farms is transmitted to the prospective power hub in AC. The power distribution from the main power hub to the nearby OG PFs is AC; therefore, minimal on-board modifications and components are required (in comparison with HVDC or low-frequency AC transmission).
  • As a result, in the proposed architectures, all the cables are AC 3-phase cables, except Cable#9 and Cable#14 are DC cables.
  • The power factor (pf) is 0.9 and balanced three-phase AC systems.
  • The AC cables are of XLPE 3-core type, hence no more than 320 kV transmission voltage is used. The conductor type is Aluminum (although its conductivity is lower than copper but it is generally cheaper).
  • The cables’ selection is based on real manufacturer data for AC and DC cables; for example, see References [35,36].
  • For Case-3, the HVDC link is adopted to connect PF9 with the onshore grid. Thus, facilitating bi-directional power is made easier and controllable. Whenever there is a surplus power generated from the OWFs, the power flow can be reversed and fed to the grid. On the other hand, the HVDC link in Case-4 is the viable option to transmit bulk power at a long distance.
  • In both Case-3 and Case-4, the HVDC adopted technology is voltage source converter based; hence, minimum filtering and reactive power are needed with black-start and power-reversal capabilities [36].
  • All the proposed architectures require the minimum possible components, thus reducing the required on-platform space and footprint. Nevertheless, if the platform has limited space and/or the isolation requirement exceeds the available space, attaching a bridge link PF to the existing OG PF is possible.
  • Although subsea transformers are now available and possible for deep water (>3000 m), they are not considered in the main theme of the architecture. This is because their cost is five times the top-side transformer; hence, they may increase the cost significantly. Nevertheless, they may be considered as a design option if preferred by the operators or when there is not enough space on the platform and it is not possible to attach a bridge-linked PF to it.
  • The list of the selected cables and transformers are detailed in Table A1, Table A2, Table A3, Table A4, Table A5, Table A6, Table A7, Table A8, Table A9, Table A10, Table A11 and Table A12 in Appendix A based, on the architectures’ ratings and manufacturers’ data [35,36,37].

7. CapEx for the Proposed Power Architectures

The proposed power architectures cost, mainly Capital Expenditure (CapEx), is a contribution of the following shares (based on the individual power architecture):
  • The wind farm (onshore/offshore).
  • The cables (AC/DC).
  • The transformers.
  • The VSC–HVDC converters.

7.1. Offshore Wind Farms

The cost of a 10 MW WT is about £10 million [38], which includes the WT components. Additionally, there is a balance of plant cost, which includes all the components of the wind farm, except the turbines, including transmission assets built as a direct result of the wind farm. The average industry benchmarks for floating wind are in the range of £4 million/MW installation capacity, excluding export cables cost. In this study, an average value of £4 million/MW was sufficient, considering that the export cables are excluded. It is worth mentioning that the floating wind balance of the plant is much higher than fixed-bottom designs, which generally range between £2 million and £2.25 million/MW.
The installation and commissioning cost about £650 million for a 1 GW wind farm. This includes the installation of the balance of plant and turbines, offshore logistics, the developer’s insurance, construction project management and spent contingency. The estimated total cost for the proposed OWFs is illustrated in Table 7.

7.2. Onshore Wind Farms

The average onshore WT costs £1 million/MW, the balance of the system costs £1.5 million/MW and the installation and commission costs £0.5 million/MW [39]. The WT almost cost the same as OWF turbines, but, unlike the OWF turbines, the balance of plant is cheaper. However, the legislations are discouraging the spread of land-based onshore wind; hence, the overall output power is generally lower than the OWFs and the wind turbine rating are smaller. Table 8 shows the estimated costs for the proposed onshore wind farm.

7.3. Cables Cost

Although the cables costs may differ from one manufacturer to another, the average costs are extracted from the UK “National Grids 2015 Electricity Ten Year Statement” for AC and DC cables cost estimations [40]. Generally, the cable price is a function of the amount of power transported by the cable, the conductor type, the transportation voltage (AC/DC) and the associated distance; in contrast, the trenching and laying prices are primarily a function of cable distance. Therefore, Table 9 provides the average costs as a pilot for power architectures CapEx envisage. The AC and DC cables’ cost estimations are depicted in Table 10 and Table 11, respectively, for the four architectures.

7.4. Transformers Cost

The transformer cost is highly dependent on the rated Volt-Ampere (VA) capacity. In Reference [31], an approximated cost model was provided. The costs in M£ can be estimated from the following approximated formula:
C o s t T R = 0.0315 × S T R 0.7592
where C o s t T R is the transformer cost in million £, and S T R is the transformer rating in MVA. The transformers’ cost summary for all architectures is illustrated in Table 12.

7.5. VSC–HVDC Cost

The Voltage Source Converter based HVDC (VSC–HVDC) cost is dependent on the DC voltage level, along with the transmitted power. The average costs for the utilised converters in Architectures 3 and 4 are as depicted in Table 13, based on Reference [40].

8. Discussion

In the previous sections, four different power architectures were introduced and designed with the relevant CapEx estimation (without including bridge link PF installation cost). It is evident that each architecture can be mimicked along the UKCS, but at different power levels. The estimated CapEx cost for each architecture based on the presented calculation in Section 7 is given in Table 14.
The higher the power of the OWF, the better price per MW, as illustrated for Architectures 1 and 2. The total cost shows clear domination of the cost of the OWFs which comprised floating wind technology due to the water-depth limit for the fixed-bottom counterpart. Moreover, whenever the HVDC technology is adopted, the electrical system price is increased, and it will accordingly reflect on the overall price, as in Architecture 3 [41]. Due to the long distance and the amount of power transferred, in Architecture 4, the total cost is dominated by the HVDC system components. The HVDC converters and DC cables are the most expensive components, dominating 40% and 34% of Architecture 4’s total cost, respectively. Due to the bulk amount of power at PF13, a bridge link PF is highly likely inevitable. Additionally, other alternative transmission systems may be considered, for example, transmitting the 1 GW power via two parallel 500 MW HVDC systems. Therefore, the reliability degree is increased.
It is of paramount importance to highlight that these costs excluded the land cost or lease and the legislation and authority fees. Therefore, the cost of Architecture 4 may seem much lower in comparison with that of other architectures. Table 14 summarizes the architectures’ costs, along with the power capacity, indicating a best initial guess for the OG industry and paving the path for greener highly reliably electricity alternatives.
In all the proposed architectures, adding the proposed grids cables and transformers to the existing platform grids changes the short-circuit fault levels. This requires modifications to the older protection systems at each platform. Additionally, retrofitting switchboards and cubicles is necessary to implement the proposed architectures. This would cost around £10 million and would be added to the total estimated cost. This includes retrofitting switchboards, cubicles and protection.

9. Conclusions and Future Directions

Four different power architectures were introduced in this paper, aiming to provide a solution for a wide range of offshore OG installations. The provided solutions varied from powering isolated remote OG PFs by dedicated local OWF to importing bulk power from nearby countries. Most of the proposed solutions are oriented around offshore wind-energy utilisation; therefore, a green and more sustainable power source is provided for OG PFs. By creating small power hubs that will import energy from different power sources and then distribute it to the nearby OG PFs, a massive reduction of CO2 emissions is evident. Therefore, an electrification solution is available for the OG operators in the UKCS to meet the UK net-zero targets. However, many challenges are facing the progression of these solutions and need to be addressed in the near future:
  • Energy storage: With OWF capacities reaching 60% in the North Sea, it is still extremely important to provide some sort of energy storage [42]. A promising solution that can be integrated with OWFs is green hydrogen-energy storage, which not only will be green but also will provide supply security for OG operations.
  • Electric component footprint: Due to the limited space on the top side of the OG PFs, two alternative approaches can be adopted to overcome the limited space: either create the power hubs by using subsea technology, which is gaining potential and maturity, or utilise nearby gravity-based decommissioned platforms as a power hub.
  • Regulations: It needs to be clear who will control and own the operation of these assets and OWFs. Therefore, government legislations need to organize and protect all parties for smoother operation. Therefore, a clear pathway for standardization is inevitable for the net-zero race.
To unlock the UKCS’s potential for a world-leading offshore energy hub and foster the UK’s unique offshore wind-energy resources, not only is innovative green technology essential, but so are flexible and clear regulations and standardization.

Author Contributions

Conceptualization, M.E. and K.A.; analysis, M.E.; funding acquisition, G.R. and G.J.; investigation, M.E., K.A., G.B., G.R. and G.J.; methodology, M.E., K.A. and G.B.; project administration, K.A.; resources, G.R. and G.J.; software, M.E.; supervision, K.A. and G.B.; writing—review and editing, M.E. and K.A. All authors have read and agreed to the published version of the manuscript.

Funding

This research was funded by the Net Zero Technology Centre, grant number MD-P-040.

Data Availability Statement

Data sharing is not applicable.

Acknowledgments

The authors of this article would like to thank Iain Craik from Lloyd’s Registers, UK; and Lee Senoussi from Sealand, UK, for the information and the help provided during the course of the project.

Conflicts of Interest

The authors declare no conflict of interest.

Appendix A. Cables and Transformers Ratings

The following tables summarize the details of the selected cable, transformers and VSC–HVDC converters for all the proposed architectures.
Table A1. Cables design for Architecture 1.
CablePower Rating
(MW)
Rated Phase
Voltage (kV)
Rated
Current (A)
Number of Circuits per PhaseMaximum Current per Circuit (A)Cross-Sectional Area (mm2)
Cable#1100 66 / 3 9722540500
Cable#220 6.6 / 3 19504540500
Cable#310 11 / 3 5851660800
Cable#46.5 6.6 / 3 6301660800
Table A2. Transformers design for Architecture 1.
TransformerPower Rating
(MVA)
Voltage Rating (kV)Number WindingEstimated Weight
(t)
Dimensions
L × W × H
(m)
Location
TRF#155 66 / 11 210072.95.5PF1
TRF#255 66 / 6.6 210072.95.5PF1
Table A3. Cables design for Architecture 2.
CablePower Rating
(MW)
Rated Phase
Voltage (kV)
Rated
Current (A)
Number of Circuits per PhaseMaximum Current per Circuit (A)Cross-Sectional Area (mm2)
Cable#51500 320 / 3 300757201000
Cable#675 320 / 3 1501430300
Cable#775 320 / 3 1501430300
Cable#885 13.8 / 3 390057201000
Table A4. Transformers design for Architecture 2.
TransformerPower Rating
(MVA)
Voltage Rating (kV)Number of UnitsPower Rating
(MVA)
per Unit
Estimated Weight per Unit
(t)
Dimensions
per Unit
L × W × H
(m)
Location
TRF#395320/1111001447.83.35.8PF5
TRF#478320/111801107.43.15.8PF6
TRF#578320/111801107.43.15.8PF7
TRF#685320/13.82801107.43.15.8PF8
Table A5. AC-cables design for Architecture 3.
CablePower Rating
(MW)
Rated Phase
Voltage (kV)
Rated
Current (A)
Number of Circuits per PhaseMaximum Current per Circuit (A)Cross-Sectional Area (mm2)
Cable#10600 320 / 3 12002660800
Cable#1144 66 / 3 4281485400
Cable#1239 66 / 3 3791430300
Cable#1361 66 / 3 5901660800
Table A6. DC-cables design.
CablePower Rating
(MW)
Rated DC
Voltage (kV)
Rated
Current (A)
Maximum Current
per Circuit (A)
Cross-Sectional Area (mm2)
Cable#9300 ± 320 469523150
Table A7. Transformers design for Architecture 3.
TransformerPower Rating
(MVA)
Voltage Rating (kV)Number of UnitsPower Rating (MVA)
per Unit
Estimated Weight per Unit
(t)
Dimensions
per Unit
L × W × H
(m)
Location
TRF#7310132/320131032613.17.37.7Onshore SS
TRF#8930320/66331018513.17.37.8PF9
TRF#910066/1111001447.83.46.1PF9
TRF#104066/11140766.92.95.4PF10
TRF#115066/111508772.95.5PF11
TRF#128066/111801187.43.15.8PF12
Table A8. VSC/HVDC-converters design for Architecture 3.
VSC-HVDCPower Rating
(MW)
Rated DC
Voltage (kV)
Converter Model Power Capability
(MW)
Number of UnitsTransmission Distance
Conv#1300 ± 320 M74051Onshore
Conv#2300 ± 320 M7405157 km
Table A9. AC-cables design for Architecture 4.
CablePower Rating
(MW)
Rated Phase
Voltage (kV)
Rated
Current (A)
Number of Circuits
per Phase
Maximum Current per Circuit (A)Cross-Sectional Area (mm2)
Cable#1530 66 / 3 2901335185
Cable#1675 66 / 3 7302430300
Cable#1790 66 / 3 8752540500
Table A10. DC-cable design for Architecture 4.
CablePower Rating
(MW)
Rated DC
Voltage (kV)
Rated
Current (A)
Maximum Current per Circuit (A)Cross-Sectional Area (mm2)
Cable#11000 ± 320 1562.516441000
Table A11. Transformers design for Architecture 4.
TransformerPower Rating
(MVA)
Voltage Rating (kV)Number of UnitsPower Rating
(MVA)
per Unit
Estimated Weight per Unit
(t)
Dimensions
per Unit
L × W × H
(m)
Location
TRF#131000132/320335032613.17.37.7Onshore
TRF#141000320/66335032613.17.37.7PF13
TRF#1512.566/11112.5566.72.74.8PF13
TRF#1631.566/6.6131.5686.82.85.4PF14
TRF#178066/111801187.43.15.8PF15
TRF#1810066/1111001447.83.36.1PF16
Table A12. VSC/HVDC-converters design for Architecture 4.
VSC-HVDCPower Rating
(MW)
Rated DC
Voltage (kV)
Converter Model Power Capability
(MW)
Number of UnitsTransmission Distance
Conv#11000 ± 320 M912201Onshore
Conv#21000 ± 320 M912201275 km

References

  1. United Nations. Take Action for the Sustainable Development Goals. Available online: https://www.un.org/sustainabledevelopment/sustainable-development-goals/ (accessed on 15 July 2021).
  2. Vella, H. Ten Steps to net zero: As the goal to reach net zero in the UK rapidly approaches, we examine Boris Johnson’s 10-point plan for a green industrial revolution. Eng. Technol. Mag. 2021, 16, 20–25. [Google Scholar] [CrossRef]
  3. Climate Change Committee. Progress in Preparing for Climate Change. Available online: https://www.theccc.org.uk/publication/progress-in-preparing-for-climate-change-2019-progress-report-to-parliament/ (accessed on 1 June 2021).
  4. OGUK’s Environment Report. Available online: https://oilandgasuk.co.uk/wp-content/uploads/2019/08/Environment-Report-2019-AUG20.pdf (accessed on 1 July 2020).
  5. OGUK’s Economic Report. Available online: https://oilandgasuk.co.uk/wp-content/uploads/2019/09/Economic-Report-2019-OGUK.pdf (accessed on 1 July 2020).
  6. UK’s 2019 Energy Transition Outlook. Available online: https://oilandgasuk.co.uk/wp-content/uploads/2019/03/OGUK-Energy-Transition-Outlook-2018.pdf (accessed on 1 July 2020).
  7. Troll, A. Available online: https://new.abb.com/systems/hvdc/references/troll-a (accessed on 10 July 2020).
  8. Valhall. Available online: https://new.abb.com/systems/hvdc/references/valhall (accessed on 10 July 2020).
  9. Sverdrup, J. Available online: https://new.abb.com/systems/hvdc/references/johan-sverdrup (accessed on 10 July 2020).
  10. Thibaut, E.; Leforgeais, B. Martin Linge electric power from shore. In Proceedings of the Abu Dhabi International Petroleum Conference and Exhibition, Abu Dhabi, United Arab Emirates, 11–14 November 2012. [Google Scholar]
  11. ABB Commissions Cable Link to Deliver Clean Power to Goliat Offshore Oil Field. Available online: http://www.abb.com/cawp/seitp202/7293e63bf1fd8881c1257f0d00292ff8.aspx (accessed on 20 July 2020).
  12. Gjøa Receives Power from Shore. Available online: http://www.abb.co.uk/cawp/seitp202/b6dcda123bb5d28bc125778500352b28.aspx (accessed on 20 July 2020).
  13. Shi, G.; Peng, S.; Cai, X.; Chen, Z.; He, W. Grid integration of offshore wind farms and offshore oil/gas platforms. In Proceedings of the 7th International Power Electronics and Motion Control Conference, Harbin, China, 2–5 June 2012; pp. 1301–1305. [Google Scholar]
  14. Hadiya, M. Case Study of Offshore Wind Farm Integration to Offshore Oil and Gas Platforms as an Isolated System-System Topologies, Steady State and Dynamic Aspects. Master’s Thesis, Institute for Norwegian University of Science and Technology, Gjøvik, Norway, 2011. [Google Scholar]
  15. He, W.; Uhlen, K.; Hadiya, M.; Chen, Z.; Shi, G.; del Rio, E. Case study of integrating an offshore wind farm with offshore oil and gas platforms and with an onshore electrical grid. J. Renew. Energy 2013, 2013, 607165. [Google Scholar] [CrossRef] [Green Version]
  16. Svendsen, H.G.; Hadiya, M.; Øyslebø, E.V.; Uhlen, K. Integration of offshore wind farm with multiple oil and gas platforms. In Proceedings of the 2011 IEEE Trondheim PowerTech, Trondheim, Norway, 19–23 June 2011; pp. 1–3. [Google Scholar]
  17. Tiong, Y.K.; Zahari, M.A.; Wong, S.F.; Dol, S.S. The Feasibility of Wind and Solar Energy Application for Oil and Gas Offshore Platform; IOP Conference Series: Materials Science and Engineering; IOP Publishing: Bristol, UK, 2015; Volume 78, p. 012042. [Google Scholar]
  18. Gusatu, L.F.; Yamu, C.; Zuidema, C.; Faaij, A. A Spatial Analysis of the Potentials for Offshore Wind Farm Locations in the North Sea Region: Challenges and Opportunities. ISPRS Int. J. Geo Inf. 2020, 9, 96. [Google Scholar] [CrossRef] [Green Version]
  19. Fard, R.N.; Tedeschi, E. Integration of distributed energy resources into offshore and subsea grids. CPSS Trans. Power Electron. Appl. 2018, 3, 36–45. [Google Scholar] [CrossRef]
  20. He, W.; Jacobsen, G.; Anderson, T.; Olsen, F.; Hanson, T.D.; Korpås, M.; Toftevaag, T.; Eek, J.; Uhlen, K.; Johansson, E. The Potential of Integrating Wind Power with Offshore Oil and Gas Platforms. Wind Eng. 2010, 34, 125–137. [Google Scholar] [CrossRef]
  21. Årdal, A.R.; Sharifabadi, K.; Bergvoll, Ø.; Berge, V. Challenges with integration and operation of offshore oil & gas platforms connected to an offshore wind power plant. In Proceedings of the 2014 Petroleum and Chemical Industry Conference Europe, Amsterdam, The Netherlands, 3–5 June 2014; pp. 1–9. [Google Scholar]
  22. UK Parliament. Fossil Fuelled Power Stations: Carbon Emissions and Nitrogen Oxides. Available online: https://questions-statements.parliament.uk/written-questions/detail/2015-11-26/17799 (accessed on 31 August 2020).
  23. The Department for Business Energy & Industrial Strategy (BEIS). 2019 Government Greenhouse Gas Conversion Factors for Company Reporting. Available online: https://assets.publishing.service.gov.uk/government/uploads/system/uploads/attachment_data/file/829336/2019_Green-house-gas-reporting-methodology.pdf (accessed on 31 August 2020).
  24. Ulsund, R. Offshore Power Transmission: Submarine High Voltage Transmission Alternatives. Master’s Thesis, Institutt for Elkraftteknikk, Trondheim, Norway, 2009. [Google Scholar]
  25. Sorknæs, P.; Lund, H.; Skov, I.R.; Djørup, S.; Skytte, K.; Morthorst, P.E.; Fausto, F. Smart Energy Markets—Future electricity, gas and heating markets. Renew. Sustain. Energy Rev. 2020, 119, 109655. [Google Scholar] [CrossRef]
  26. Kota, S.; Bayne, S.B.; Nimmagadda, S. Offshore wind energy: A comparative analysis of UK, USA and India. Renew. Sustain. Energy Rev. 2015, 41, 685–694. [Google Scholar] [CrossRef]
  27. Johnston, B.; Foley, A.; Doran, J.; Littler, T. Levelised cost of energy, A challenge for offshore wind. Renew. Energy 2020, 160, 876–885. [Google Scholar] [CrossRef]
  28. Korpås, M.; Warland, L.; He, W.; Tande, J.O.G. A Case-Study on Offshore Wind Power Supply to Oil and Gas Rigs. Energy Proc. 2012, 24, 18–26. [Google Scholar] [CrossRef] [Green Version]
  29. Borrmann, R.; Rehfeldt, K.; Wallasch, A.-K.; Lüers, S. Capacity Densities of European Offshore Wind Farms. Available online: https://www.windguard.com/publications-wind-energy-statistics.html?file=files/cto_layout/img/unternehmen/veroeffentlichungen/2018/Capacity%20Density%20of%20European%20Offshore%20Windfarmslr.pdf (accessed on 10 January 2020).
  30. V164-10.0MW Wind Turbine. Available online: https://www.vestas.com/en/products/offshore%20platforms/v164_10_0_mw#!grid_0_content_0_Container (accessed on 10 January 2020).
  31. Parker, M.A.; Anaya-Lara, O. Cost and losses associated with offshore wind farm collection networks which centralise the turbine power electronic converters. IET Renew. Power Gener. 2013, 7, 390–400. [Google Scholar] [CrossRef] [Green Version]
  32. Enevoldsen, P.; Permien, F.-H.; Bakhtaoui, I.; Krauland, A.-K.V.; Jacobson, M.Z.; Xydis, G.; Sovacool, B.K.; Valentine, S.V.; Luecht, D.; Oxley, G. How much wind power potential does europe have? Examining european wind power potential with an enhanced socio-technical atlas. Energy Policy 2019, 132, 1092–1100. [Google Scholar] [CrossRef]
  33. Viking Energy. Harnessing Shetland’s Natural Resources. Available online: https://www.vikingenergy.co.uk/the-project (accessed on 1 February 2020).
  34. Onshore Wind Turbine (SG 5.0-145) Manufactured by Siemens Gamesa. Available online: https://www.siemensgamesa.com/en-int/products-and-services/onshore/wind-turbine-sg-5-0-145 (accessed on 1 February 2020).
  35. XLPE Submarine Cable Systems, ABB. Available online: https://new.abb.com/docs/default-source/ewea-doc/xlpe-submarine-cable-systems-2gm5007.pdf (accessed on 15 March 2020).
  36. HVDC Light-It’s Time to Connect. Available online: https://vdocument.in/hvdc-light-its-time-to-connect-abb-s-time-to-connect-1-introducing-hvdc.html (accessed on 15 March 2020).
  37. Siemens Power Engineering Guide, Transformers, 4th ed. Available online: http://www.tekhar.com/Programma/Siemens/Commutacia/High_voltage/pdf_pict/5_transformers.pdf (accessed on 20 March 2020).
  38. Crown Estate and the Offshore Renewable Energy Catapult. Guide to an Offshore Wind Farm. Available online: https://www.thecrownestate.co.uk/media/2861/guide-to-offshore-wind-farm-2019.pdf (accessed on 10 February 2020).
  39. National Renewable Energy Laboratory (NREL). 2019 Cost of Wind Energy Review. Available online: https://www.nrel.gov/docs/fy18osti/72167.pdf (accessed on 10 February 2020).
  40. Electricity Ten Year Statement 2015, Appendix E. Available online: https://www.nationalgrideso.com/document/47036/download (accessed on 1 March 2020).
  41. Elgenedy, M.A.; Ahmed, K.H.; Aboushady, A.A.; Abdelsalam, I. DC–DC converter concept allowing line commutated converters and voltage source converters based HVDC systems connectivity. IET Power Electron. 2020, 13, 3294–3304. [Google Scholar] [CrossRef]
  42. Elgenedy, M.A.; Massoud, A.M.; Ahmed, S. Energy in smart grid: Strategies and technologies for efficiency enhancement. In Proceedings of the 2015 First Workshop on Smart Grid and Renewable Energy (SGRE), Doha, Qatar, 22–23 March 2015; pp. 1–6. [Google Scholar]
Figure 1. Four hypothetical case studies: (a) Case-1, (b) Case-2, (c) Case-3 and (d) Case-4.
Energies 14 07096 g001
Figure 2. Case-1 OWF layout.
Energies 14 07096 g002
Figure 3. Case-2 wind farms’ layout and collection grid: (a) OWF WTs’ layout, (b) onshore wind farm WTs’ layout and (c) power collection layout.
Energies 14 07096 g003
Figure 4. Case-3 OWFs WTs and power collection layout.
Energies 14 07096 g004
Figure 5. Proposed power architectures: (a) Architecture 1, (b) Architecture 2, (c) Architecture 3 and (d) Architecture 4.
Energies 14 07096 g005aEnergies 14 07096 g005b
Table 1. Some of HVDC technology projects for offshore platforms power from Norwegian shore [7,8,9].
ProjectPower (MW)HVDC Transmission Voltage (kV)Submarine Cable Length (km)Manufacturer
Troll-A18812070ABB
Valhall78150292ABB
Johan Sverdrup100160200ABB
Table 2. Some of HVAC technology projects for offshore platforms power from Norwegian shore [10,11,12].
ProjectPower (MW)HVAC Transmission Voltage (kV)Submarine Cable Length (km)Manufacturer
Martin Linge55300161Siemens
Gjøa409098.5ABB
Goliat75132105.5ABB
Table 3. Hypothetical case studies’ descriptions.
Case-1
  • Located at the north of the North Sea, isolated OG PFs’ grid system, incorporating small local floating wind farm feeding PF1. See Figure 1a.
  • Partial dependency on OWFs.
  • Open mesh network to increase reliability and decrease the system complexity.
Case-2
  • Located in the West of Shetland and requires a large future power demand. See Figure 1b.
  • PF5 will be a power hub fed from Shetland shore that is fed from three energy sources: onshore wind, offshore wind and HVDC link with UK grid.
Case-3
  • Located at the west of the Central North Sea closer to the UK shores. See Figure 1c.
  • PF9 will be considered as a power hub; a link from onshore is fed to it in addition to offshore wind farm links.
Case-4
  • Located at the east of the Central North Sea closer to the nearby country shores. See Figure 1d.
  • PF13 will be considered as a power hub; an HVDC power link from Norway is fed to it and then the power is distributed to the nearby platforms and facilities.
Table 4. Load demand and AC voltage rating for the utilised OG PFs.
OG PF NameLoad
Demand
(MW)
Voltage/FrequencyOG PF NameLoad
Demand
(MW)
Voltage/Frequency
PF13011 kV/60 HzPF96611 kV/60 Hz
PF22511 kV/60 HzPF104411 kV/60 Hz
PF3226.6 kV/60 HzPF113911 kV/60 Hz
PF46.56.6 kV/60 HzPF126111 kV/60 Hz
PF56913.8 kV/60 HzPF13811 kV/60 Hz
PF65311 kV/60 HzPF142711 kV/60 Hz
PF75311 kV/60 HzPF156511 kV/60 Hz
PF86413.8 kV/60 HzPF167711 kV/60 Hz
Table 5. Specs of the offshore wind farms.
Wind Farm Water DepthAverage Wind SpeedArea RequiredTotal Power CapacityNumber of WTs
OWF1≈140 m≈9–10 m/s≈20 km2100 MW10
OWF2≈100 m≈9–10 m/s≈388 km21000 MW100
OWF360–100 m≈9–10 m/s≈105 km2300 MW30
OWF460–100 m≈9–10 m/s≈102 km2300 MW30
Table 6. Specs of the onshore wind farm for Case-2.
Wind Speed≈7–8 m/s
Area Required≈110 km2
Individual WT Rating5 MW (SG 5.0-145)
Number of WTs100
Total Power Capacity500 MW
Table 7. Specs of the offshore wind farms.
Wind Farm Costs in £M C o s t
in £M
WTsBalance of PlantInstallation and Commissioning
OWF110040065565
OWF2100040006505650
OWF330012001951695
OWF430012001951695
Table 8. Onshore wind-farm cost estimation.
Onshore Wind FarmCosts in £M C o s t
in £M
Wind TurbineBalance of SystemInstallation and Commissioning
500 MW5007502501500
Table 9. Average AC and DC cables’ cost.
AC Cables
Voltage Rating at 300 MW 1<150 kV320 kV
Cable cost0.5 £M/km0.8 £M/km
Trenching and laying cost0.33 £M/km
DC Cables
Power Rating at 320 kV300 MW1000 MW
Cable cost0.423 £M/km0.565 £M/km
Trenching and laying cost0.3 £M/km
1 The maximum cable power is 300 MW; see Appendix A for cables selection for each architecture, along with the number of associated cables at each power level.
Table 10. AC-cable and trenching cost estimation.
ArchitectureCables IDCosts in £M C o s t
in £M
CableTrenching and Laying
Architecture 1#1 to #42818.546.5
Architecture 2#5 to #8437.6180.5618.1
Architecture 3#10 to #13191110.22301.22
Architecture 4#15 to #179965.34164.34
Table 11. DC-cable and trenching cost estimation.
ArchitectureCables IDCosts in £M C o s t
in £M
CableTrenching and Laying
Architecture 3#913.81831.8
Architecture 4#14155.3782.5237.87
Table 12. Transformers’ cost estimation.
ArchitectureTransformer IDCost in £M
Architecture 1 #1 and #21.32
Architecture 2#3 to #64.53
Architecture 3#7 to #1213.31
Architecture 4#13 to #1817.6
Table 13. HVDC converters’ cost estimation.
ArchitectureConverter IDCost in £M C o s t in £M
Architecture 3Conv#188176
Conv#288
Architecture 4Conv#3140280
Conv#4140
Table 14. Architectures’ total cost and power capacity.
ArchitectureTotal Cost (£M)Power Capacity (MW)
Architecture 1612.8100
Architecture 27772.631500
Architecture 33912.33600
Architecture 4699.811000
Publisher’s Note: MDPI stays neutral with regard to jurisdictional claims in published maps and institutional affiliations.

