Article

Benefit Evaluation Model of Prefabricated Buildings in Seasonally Frozen Regions

1
School of Water Conservancy and Civil Engineering, Northeast Agricultural University, No. 59 Timber East Street, Harbin 150006, China
2
School of Economics and Management, Harbin Institute of Technology, Weihai, No. 2 Wenhua West Road, Weihai 264200, China
3
Polytechnic Institute, Far Eastern Federal University, 690922 Vladivostok, Russia
4
Department of Theoretical Mechanics and Strength of Materials, Belgorod State Technological University Named after V.G. Shukhov, 308012 Belgorod, Russia
5
Institute of Civil Engineering, Peter the Great Saint Petersburg Polytechnic University, 195251 Saint Petersburg, Russia
*
Authors to whom correspondence should be addressed.
Energies 2021, 14(21), 7119; https://doi.org/10.3390/en14217119
Submission received: 23 July 2021 / Revised: 8 September 2021 / Accepted: 8 September 2021 / Published: 1 November 2021

Abstract

:
In order to effectively develop the benefit evaluation model of prefabricated houses in seasonal frozen soil areas, and improve the comprehensive benefits of prefabricated buildings, this paper proposes a life cycle benefit evaluation model for prefabricated buildings in seasonally frozen regions. According to the climatic characteristics of the area, the impact of the seasonally frozen regions is listed as an evaluation index in the construction stage for comprehensive analysis. The 16 indicators that affect the comprehensive benefits of prefabricated buildings are grouped by the nearest neighbor element analysis method. Fuzzy cluster analysis and analytic hierarchy process are used to filter out the most influential index group to calculate the index weight. Then the model proposed in this paper is compared with the existing model to test the validity of the model. The research results show that research and development costs weight is 0.23, design cost weight is 0.10, construction cost weight is 0.22, resource consumption weight is 0.25, building demolition cost weight is 0.04, and seasonal freezing effect weight is 0.16. The calculation result passed the consistency test and the expert scoring result conformed to the normal distribution, which proved the accuracy of the conclusion. It is proposed that the calculation result of the comprehensive benefit score of the model is 1.8% lower than the previous results, which proves the validity of the model. The model can speed up the efficiency of comprehensive benefit evaluation of prefabricated buildings thereby improving the development level of prefabricated buildings.

1. Introduction

The existing research results of prefabricated buildings are mainly reflected in the technical upgrade of the original construction technology and building node methods, improving the degree of green building, lack of improving the comprehensive benefit evaluation of prefabricated buildings, and how to establish and improve supporting auxiliary technologies. Khan and Yan [1] developed a new type of bolt connection of the long tenon gusset plate for horizontal connection and a long beam bolt for vertical connection, which improves the seismic performance of the fabricated steel structure building. However, the paper does not propose specific formulas for different bolt connection methods and the seismic performance of buildings. Kebeckova et al. [2] studied the adverse effects of the internal microclimate of prefabricated buildings from 1950 to 1990 on the health of users, and proposed corresponding remedial measures, but the research scope was narrow and could not be combined with modern prefabricated building technology. Pihelo et al. [3] conducted research and development and performance evaluation of prefabricated thermal insulation components in prefabricated apartment floors. The paper proposes the use of mineral wool boards with special wind-proof panels and aerated autoclaved concrete walls to reduce energy consumption and carbon emissions in apartment buildings. However, the cost increase caused by the new components was not considered. Tsoka et al. [4] analyzed the energy demand of single-family prefabricated buildings according to different climate and environmental characteristics, and demonstrated the contribution of prefabricated buildings to sustainable development. However, during the experiment, no other influencing factors other than temperature were considered. Adekunle et al. [5] studied the seasonal performance and occupant comfort of prefabricated wood structure buildings, and demonstrated that the winter performance of prefabricated wood structure buildings is better than summer performance, and the occupants have higher thermal comfort in winter, however the study did not analyze the prefabricated buildings of other structures. Barelli et al. [6] proposed a correction method to determine the energy requirements of buildings in winter and summer, demonstrating that the seasonal energy of different building types are different, and there are differences in energy requirements in winter and summer. However, it did not consider the seasonal performance of buildings in different regions, especially seasonal frozen ground areas. In the assessment of life cycle, Cabeza et al. [7] proposed that life cycle assessment can systematically analyze the comprehensive performance of a product throughout its life cycle. Ji et al. [8] studied the life cycle assessment model based on BIM and demonstrated the advantages of prefabricated buildings from the perspective of life cycle, but the model only considered the environmental impact and lacked the discussion on the comprehensive benefits of prefabricated buildings. When evaluating the life cycle of prefabricated buildings, Wang et al. [9] considered cost and environmental factors to improve the comprehensiveness of the evaluation, but did not take into account the impact of climate in different regions, and there are still certain shortcomings.
He et al. [10] studied the feasibility of applying 3D model technology to prefabricated buildings, and how using this technology can further improve building quality and reduce building energy consumption. However, it is not considered that the actual application will lead to an increase in the cost of the design stage. SU Yangyue [11] studied the building quality problems in the construction of prefabricated buildings and proposed ways to improve the construction methods to improve the project quality, but did not take into account the impact of the seasonal climate on the construction, and the discussion was not comprehensive enough. SC Li [12] conducted research on green building technology of prefabricated buildings and proposed a series of innovative construction technologies, but the innovative technologies lacked the proof of actual case application. J Zhang [13] analyzed the comprehensive benefits of prefabricated buildings and concluded that China’s prefabricated buildings have better benefits and broad development prospects. However, when evaluating the benefits of prefabricated buildings, the benefits of each stage of the life cycle of prefabricated buildings were not listed, which led to insufficient conclusions. Yongsen et al. [14] evaluated the comprehensive benefits of prefabricated buildings from the perspective of the whole life cycle, and concluded that prefabricated buildings have good evaluation results and have room for improvement. However, their research did not establish an evaluation model for prefabricated buildings.
In order to improve the development level of prefabricated buildings in seasonal frozen ground areas, improve the benefit evaluation system of prefabricated buildings in seasonal frozen ground regions, and propose a benefit evaluation model for prefabricated buildings more suitable for seasonal frozen ground regions, this paper is based on the whole life cycle theory, dividing the life cycle of a prefabricated building into different stages, and determining the comprehensive benefit evaluation index. Combined with the climatic characteristics of the seasonal frozen regions, the evaluation index of the influence of the seasonal frozen regions is creatively proposed. This paper uses the hierarchical cluster analysis method to calculate the index weights, establishes a prefabricated building life cycle benefit evaluation model, and proves the correctness of the model through actual cases.

2. Materials and Methods

2.1. Select Benefit Evaluation Index

The main influencing factors selected in the planning and design stage are research and development cost (C11), design cost (C12), green space rate (C13) and heat island effect (C14). From the perspective of economic benefits, research costs and design costs directly affect project revenue. They are important indicators for evaluating project profitability [15,16]. From the perspective of environmental benefits, the building green space rate and the heat island effect determine the residents’ experience [17,18]. The green space rate can reflect the surrounding environment of the building, and the heat island effect can reflect the internal environment of the building. By referring to the literature research in the planning and design stage, this paper selects four representative benefit evaluation indicators in the planning and design stage.
The influencing factors during the construction stage mainly include component production cost (C21), construction cost (C22), dust pollution (C24), noise pollution (C25), and carbon emission (C26). The component production cost and construction cost of prefabricated buildings are the main costs in the construction stage [19,20]. Transportation cost is the cost of transporting the produced parts from the processing plant to the construction site. It will have a certain impact on the production cost of components in prefabricated buildings. The farther the component processing plant is from the construction site, the greater the transportation cost, and the corresponding production cost will increase. According to Lu and Yuan’s research [21], the average cost of transportation accounts for 18% to 20% of the total cost. The transportation cost of a project that has been developed can be estimated based on Lu and Yuan’s research results. In this paper, the seasonal frozen effect (C23) is creatively proposed as an evaluation index. Freeze-thaw cycles exist in the soils in seasonal frozen soil regions. According to the study of Qi et al. [22], very dense soils will lose part of their elastic modulus and strength after freeze-thaw cycles. Therefore, during the construction process, it is necessary to replace the seasonal frozen soil with purer gravel or medium and coarse sand to ensure the strength of the foundation bed soil, which will bring additional costs to the construction stage, thereby affecting the comprehensive benefits of the entire life cycle of prefabricated buildings. Therefore, from the perspective of economic benefits, three indicators are selected: design cost, construction cost, and seasonal frozen effect. In addition, the dust pollution and noise pollution during the construction process are the evaluation criteria for measuring the environmental pollution of the project, and the carbon emissions are also an important indicator to measure the impact on the environment [23,24,25]. From the perspective of environmental benefits, three indicators of dust pollution, noise pollution, and carbon emissions were selected. By referring to the literature research in the construction stage, this paper selected six representative benefit evaluation indexes in the construction stage.
The influencing factors in the operation and maintenance stage mainly include resource consumption (C31), maintenance cost (C32), owner satisfaction (C33), and green building concept (C34). The main cost of the operation process are resource consumption and maintenance cost [26,27]. Resource consumption can reflect whether the building is environmentally friendly, and maintenance cost can reflect the engineering quality of the building. Owner satisfaction refers to the subjective feelings generated by buyers in the process of using the house, which reflects the degree of satisfaction of the residents with the building. The concept of green building reflects the idea of harmonious coexistence between man and nature, and is an important reference factor for buyers [28,29]. By referring to the literature research in the operation and maintenance stage, four representative benefit evaluation indicators were selected in the operation and maintenance stage.
The influencing factors of the demolition and recycling stage include building demolition cost (C41) and component recycling benefit (C42). The cost of building demolition is the cost to be paid when the building is demolished, including the cost of demolition and the cost of leveling the site. The component recycling income reflects the income brought by the recycling of components after the building is demolished. It is not only a measure of the economic benefit index of the construction project, but also an important factor for measuring environmental benefits [30,31]. By referring to the literature research in the demolition and recycling phases, two representative benefit evaluation indicators were selected in the demolition and recycling phases.

2.2. Screening Key Indicator Groups

This paper uses a questionnaire survey method. According to the scoring results, the hierarchical clustering method is used to analyze the indicators that affect the comprehensive benefits of the prefabricated building throughout the life cycle. The evaluation indexes are classified according to two indexes of relative importance value (RIV) and standard deviation value (SDV), grouped according to the degree of influence of the indexes, and the index group with the greatest degree of influence is selected for research.
The subjects of the survey are mainly employees in the prefabricated construction industry. The results of the survey are the above experts’ evaluation of the importance of various indicators that affect the comprehensive benefits of prefabricated buildings throughout the life cycle. The five-point Likert scale method was used to quantify the respondents’ importance to various indicators, where 1 = very unimportant, 2 = not important, 3 = generally important, 4 = more important, and 5 = very important. The sample size of the conventional questionnaire survey method is 50–60. Thompson et al. [32] selected 55 effective samples when using the expert evaluation method, and achieved good research results. In this paper, too, a total of 76 questionnaires were distributed and 55 valid questionnaires were received, and the response rate was 72.3%. This paper refers to the methods used by Shapira and Simcha [33] to describe the interviewees, and counts the information of the interviewees who responded to valid questionnaires. A total of 55 respondents who responded to the valid questionnaire were architects, project managers and general engineers from 16 leading construction industries in China. These 55 experts have served for 748 years (with an average of 13.6 years) during their current tenure. Among them, 37 experts have rich experience in seasonal frozen ground area construction projects. The occupational distribution chart is shown in Figure 1.
The results of the questionnaire survey are shown in Table 1. The data in Table 1 represent the number of respondents who gave the corresponding point.
In order to avoid the impact of individual extreme data on the accuracy of grouping, when using hierarchical clustering analysis, the factors that affect the comprehensive benefits of the entire life cycle of the prefabricated building are classified according to the RIV and the SDV. The RIV reflects the relative importance of each influencing factor, and the SDV reflects the stability of data changes. The nearest neighbor element method is used to classify the elements according to the distance between elements, and to group according to the distance between various influencing factors, so as to filter out the most influential index group.
The RIV and SDV are calculated as follows:
RIV i = j = 1 N x j N
SDV i = j = 1 N ( x j RIVi ) 2 N
where N = total number of valid questionnaire results, and xj = score of the respondent on the evaluation index.
Since RIV and SDV have the same importance in the clustering process, the two indicators need to be standardized. This paper uses the standardized formula proposed by Kaufman and Rousseeuw [34] to standardize RIV and SDV into Z(RIV) and Z(SDV), respectively; the Z(RIV) and Z(SDV), are calculated as follows:
Z ( RIV i ) = RIV i μ RIV 1 M i = 1 M | RIV i μ RIV |
Z ( SDV i ) = SDV i μ SDV 1 M i = 1 M | SDV i μ SDV |
where M = total number of evaluation indicators, μRIV = the average value of the RIV of each group of indicators, μSDV = the average value of the SDV of each group of indicators. μ RIV = 1 M j = 1 M RIV i , μ SDV = 1 M i = 1 M SDV i .
The calculation results are shown in Table 2.
Z(RIV) represents the relative importance between the indicators. The greater the value of Z(RIV), the greater the importance of the indicator. Z(SDV) represents the relative deviation degree of the index scoring results. The larger the value of Z(SDV), the more controversial the indicator.
This paper refers to Zhao et al.’s indicator grouping method [35]. According to the index clustering calculation results in Table 2, Z(RIV) is used to establish the horizontal axis of the coordinate, and Z(SDV) is used to establish the vertical axis of the coordinate. This paper uses the nearest neighbor element method to group the indicators according to Z(RIV) and Z(SDV), and screen out the most influential indicator group. The screening results are shown in Figure 2. As can be seen from the relative importance value in Figure 1, the more to the right of each point in the figure, the greater the degree of impact of the indicators. The degree of influence of Group1, Group2, Group3, and Group4 on the comprehensive benefits of prefabricated buildings gradually weakened.

2.3. Analysis of Data

2.3.1. Calculate Index Weight

Based on the above analysis, this paper focuses on Group1. There are six indicators in this indicator group. In order to distinguish and calculate easily, the indicators in the group are renamed as B1 research and development cost, B2 component production cost, B3 construction cost, B4 resource consumption, B5 building demolition cost, and B6 seasonal frozen effect. In order to further study the degree of influence of the above six indicators, the analytic hierarchy process (AHP) is used to calculate the weight of each indicator. This paper refers to the AHP analysis method used by Saaty [36] in “Decision Making for Leaders: The Analytic Hierarchy Process for Decisions in a Complex World”. The AHP method can divide complex problems into different levels for processing, and is suitable for decision-making problems that are difficult to accurately measure and calculate. When using the AHP to solve problems, it is necessary to construct a hierarchical structure. For each index, the Saaty1–9 scaling method is used for expert scoring, and to assign values to the index influence degree. The Saaty1–9 scale table is shown in Table 3.
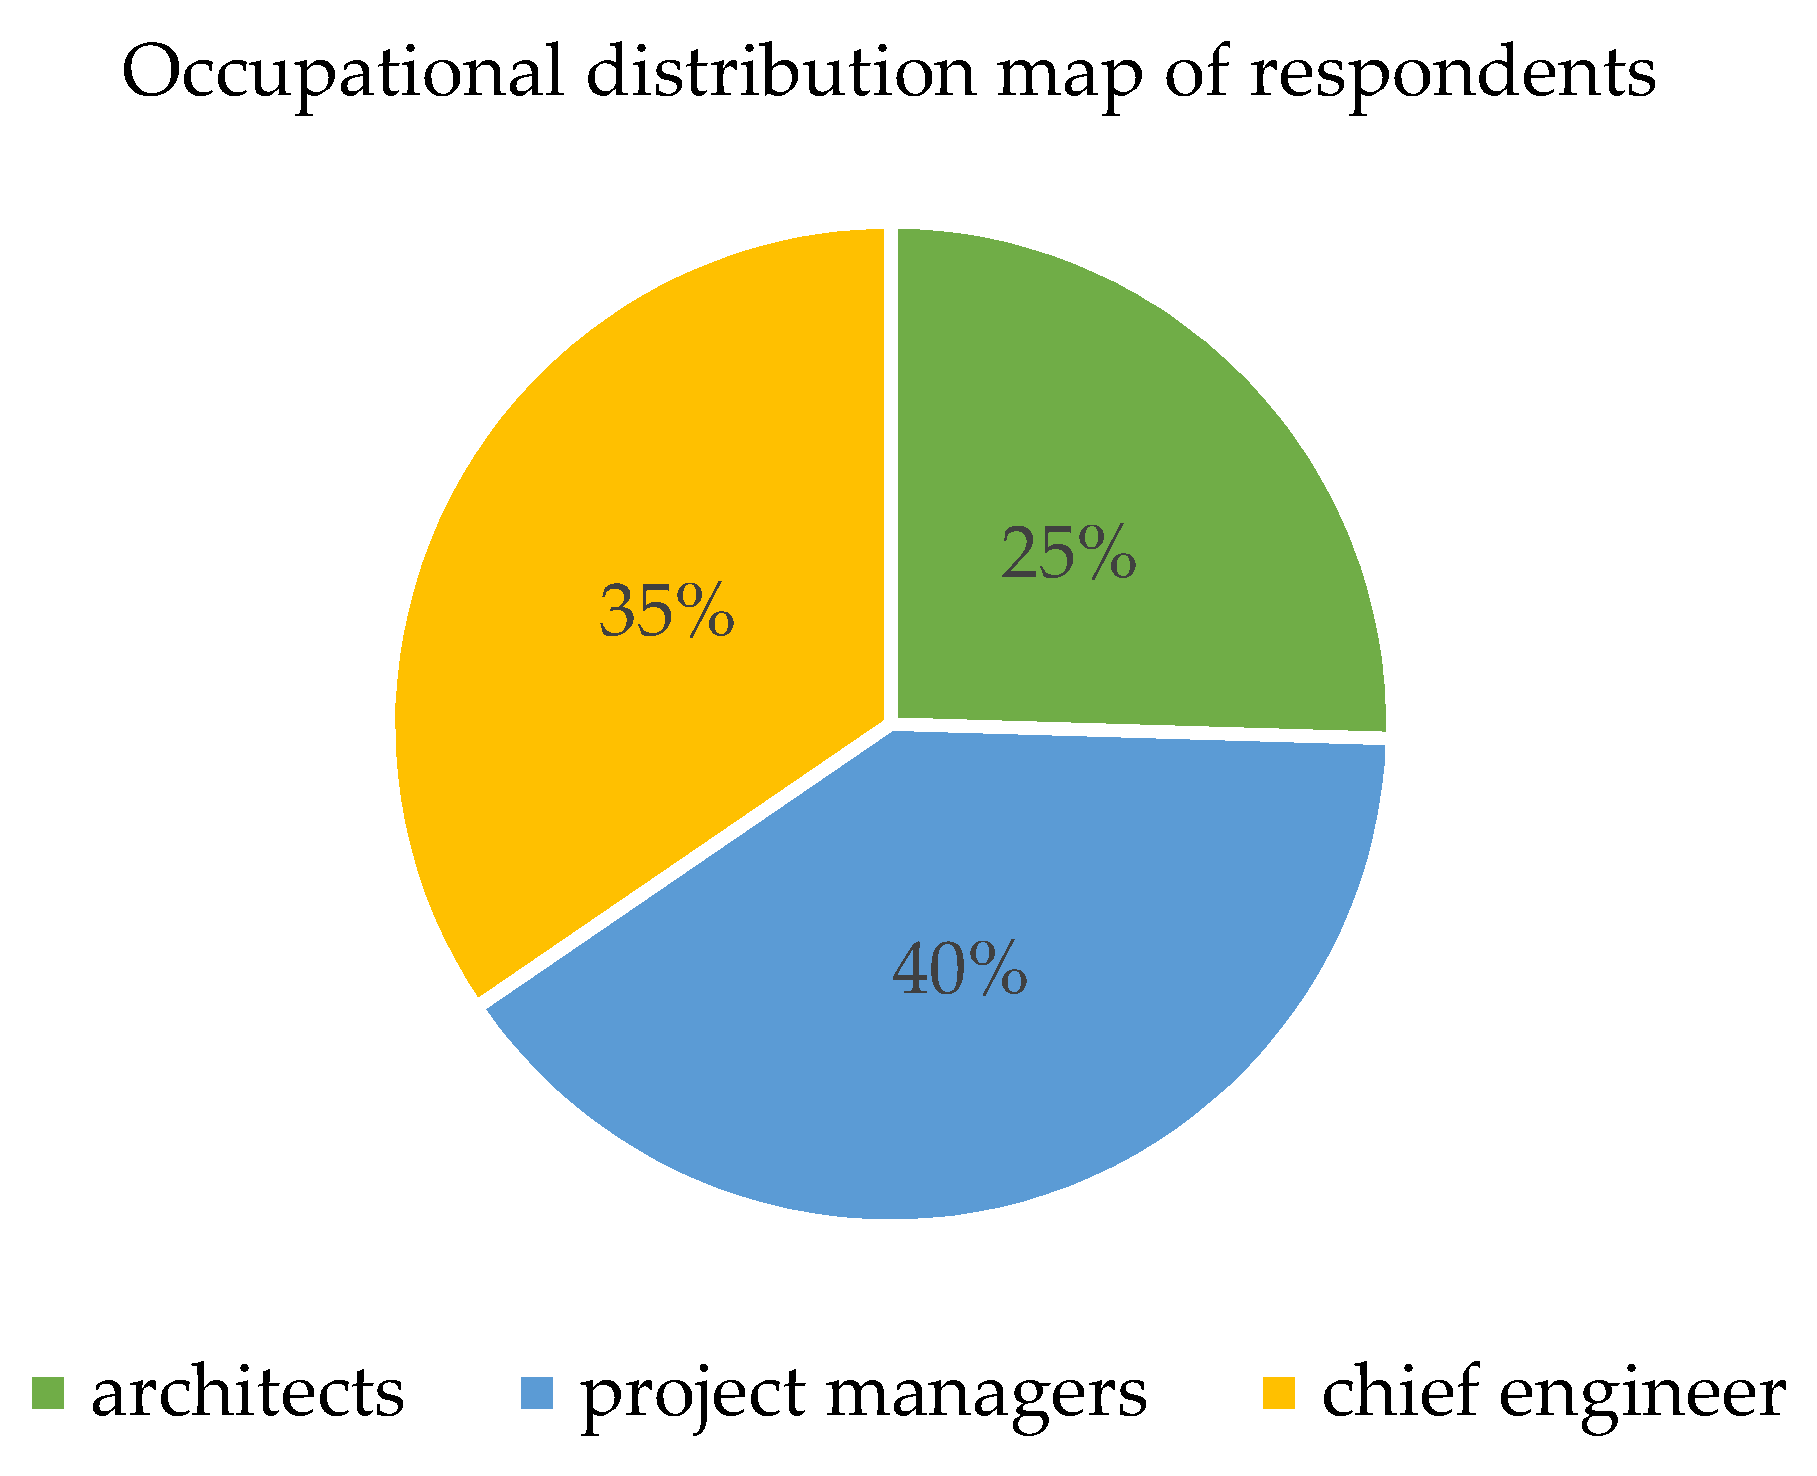
Using the Saaty1–9 scaling method, the indicators are assigned values through expert scores, qualitative factors are quantified, and the weights of various indicators are calculated. The weight of the impact of each indicator on the comprehensive benefits of the entire life cycle of the prefabricated building can be obtained by comparing the indicators in pairs and constructing a judgment matrix. In order to further ensure the accuracy of the research, this paper has increased the sample size and issued 300 questionnaires to senior leaders, project managers and domain experts in the prefabricated construction industry. The above-listed experts completed the questionnaires through the mobile application and a total of 237 valid questionnaires were received. The experts who responded to the effective questionnaire were architects, project managers, chief engineers, and scientific researchers with rich academic achievements in the field of prefabricated construction from China’s leading construction companies. They have worked or researched for a total of 3508 years (average 14.8 years). The occupational distribution chart is shown in Figure 3.
According to the scoring results of each expert, a corresponding judgment matrix can be constructed, and the judgment matrix of each expert can be analyzed separately, and the index weight value given by each expert can be calculated. In order to ensure the accuracy of the calculation results, it is necessary to check the consistency of the judgment matrix, eliminate the questionnaire results that fail the consistency check, and then average the index weights given by each expert to obtain the average weight of each index.
The method of calculating the index weight according to the judgment matrix is as follows. First, multiply the data of each row of the judgment matrix to obtain the row product of each row, then calculate the 6th root of the row product, and normalize the calculation result by column to get the weight of each indicator. Finally, in order to test the accuracy of the weight calculation results, it is also necessary to calculate the maximum eigen value of the judgment matrix for consistency testing. The calculation process is as follows:
(1)
Calculate the row product of each element of the matrix.
M i = j = 1 n b i j
where bij represents the element in the i-th row and j-th column of the matrix.
(2)
Calculate the n-th root of Mi.
w i = M i n
where Mi represents the product of each element in each row of the matrix, and n represents the number of rows in the matrix. In this paper, the value of n is 6.
(3)
Normalize wi by column to get the index weight.
w i = w i i = 1 n w i
where wi is the sixth root of the product of the elements in each row.
(4)
Calculate the maximum eigen value.
λ m a x = i = 1 n w i n r i W i
where ri represents the i-th row vector in the matrix and wi represents the weight value corresponding to each indicator calculated by Formula (7). Wi represents a column vector composed of each w value, and n represents the number of rows in the matrix. In this paper, the value of n is 6.
Experts may have fuzzy judgments when scoring elements, leading to inconsistent influence of element values in the matrix. It is necessary to check the coordination between the importance of elements to avoid the occurrence of A is more important than B, B is more important than C, but C is more important than A. In order to ensure the accuracy of the weights, a consistency check is required. Determine whether there is a significant difference between the average value or the variance of each party at a certain level of significance. If there is no significant difference, the average value or variance of each party is consistent. When the CR calculation result is less than 0.1, it proves that there is no significant difference in the evaluation process, the index weight calculation is correct, and the result of the judgment matrix passes the consistency test. Refer to the inspection method proposed by Saaty [37] in “The Analytic Hierarchy Process” and the calculation method of CI and CR is as follows:
(1)
Calculate the consistency index CI.
CI = λ m a x n n 1
where λmax is the calculation result of Formula (8), and n represents the number of rows in the matrix. In this paper, the value of n is 6.
(2)
The average consistency index is taken.
In the consistency test, the average consistency index RI needs to be used. RI is a constant used to calculate the consistency ratio CR of the judgment matrix, and the value is obtained according to the order of the matrix. By consulting the analytic hierarchy process (AHP) average consistency index value table, the RI values corresponding to different matrix orders can be obtained. This paper refers to the RI value table used by Zhang [38] in the consistency test. RI values are shown in Table 4.
(3)
Calculate the consistency ratio CR.
CR = CI RI
The value of RI is obtained by looking up the table. This paper uses a 6-order matrix, so RI is 1.24.
When CR < 0.1, the matrix meets the consistency requirement.
Taking an expert’s scoring result as an example, the judgment matrix and calculation results constructed based on the expert’s scoring result are shown in Table 5.
The calculation process is as follows. Taking B1 as an example, by multiplying the elements in the first column of the judgment matrix, M1 = 0.74 corresponding to B1 can be obtained. Take the 6th root of the calculated M1 to get wi = 0.74. Using the same method, we can calculate the wi corresponding to each indicator, and then divide the wi corresponding to each indicator by Σwi to get the weight wi corresponding to each indicator. The weight corresponding to index B1 is w1 = 0.1. Similarly, the weight corresponding to other indexes can also be obtained. After obtaining the column vector Wi composed of the index weights wi, Formula (8) can be used to calculate the λmax = 6.08. By substituting λmax into Formula (9), CI = 0.016 can be calculated. By looking up Table 4, RI = 1.24 can be determined, and then CI is divided by RI to get CR = 0.013.
Table 5 shows the evaluation results of this expert, CR = 0.013 < 0.1, which proves that the matrix passes the consistency test. Research and development costs (B1) weight is 0.10, component production cost (B2) weight is 0.25, construction cost (B3) weight is 0.38, resource consumption (B4) weight is 0.07, building demolition cost (B5) weight is 0.04, and seasonal freezing effect (B6) weight is 0.16. The influence degree of the indexes can be ranked according to the weight; the greater the weight, the greater the influence degree of the indexes. The ranking of the indexes of this expert is B3, B2, B6, B1, B4 and B5, and the influence degree decreases sequentially.
Based on the evaluation results of 237 questionnaires, a judgment matrix for each expert can be constructed. According to the above steps, the corresponding index weight value and CI can be calculated according to the scoring results of each expert. Through calculation, 24 questionnaire results failed the consistency test (CR > 0.1), and the 24 questionnaire results were removed and the average weight of each indicator was calculated. The calculation process of the average weight refers to the method adopted by Suganthi [32], and the weights calculated from the remaining 213 questionnaire results are averaged to obtain the average weight of each indicator. The calculation results are shown in Table 6.
In order to further verify the accuracy of the conclusions, this paper compares the ranking of the calculation results of various indicators with the ranking of the scoring results of the experts. We used Statistical Product and Service Solutions (SPSS) software (25.0.0, IBM, Armonk, NY, USA) to describe the distribution curve of the data set, and calculate the kurtosis and skewness to determine whether the expert scoring results conformed to the normal distribution. The judgment criteria are shown in Table 7.
When making judgments, the distribution data set of expert opinions can be obtained by calculating the difference between the calculation ranking of each indicator and the expert scoring ranking. Taking B1 research and development cost as an example: According to the calculation results in Table 6, the research and development costs index is ranked as 2. If the expert believes that the research and development costs ranking is 2, the corresponding ranking score is 0 points. If the expert believes that the research and development costs ranking is 3, which is 1 place lower than the calculated ranking, the corresponding ranking score is −1 point. Comparing the scoring results of each expert with the calculation results in this paper, a data set reflecting the gap between the opinions of all experts and the calculation results can be obtained. According to the kurtosis and skewness values of the data set, this determines whether the data obeys a normal distribution. The difference data set is shown in Figure 4.
Figure 4 describes the distribution of the data set of expert opinion and average ranking difference, and lists the kurtosis and skewness values. It can be seen from the figure that the values of kurtosis and skewness are both close to zero. It can be judged that the data set obeys the normal distribution, and the calculation result of the weight of each indicator is correct.

2.3.2. Establish Benefit Evaluation Model

When building the model, this paper refers to the method of Zhao et al. [39] using various parameters to predict the international roughness index of cement pavement in seasonal frozen areas, and the method of He et al. [40] using weights to arithmetically weight various indicators, so as to obtain a model building method that affects the comprehensive benefit value. Since the comprehensive life cycle benefits of prefabricated buildings are determined by multiple variables, the use of the arithmetic weighting method to build a comprehensive life cycle comprehensive benefit evaluation model for prefabricated buildings can realize the evaluation of comprehensive benefits throughout the life cycle of prefabricated buildings, which is shown as follows:
Y = i = 1 n ω i X i
where Xi represents the i-th index, and ωi represents the weight value of the i-th index. According to the comprehensive benefit evaluation model for the whole life cycle of prefabricated buildings, the benefits of prefabricated buildings can be judged as a whole.
Bringing the weights calculated by the analytic hierarchy process into the model, the full life cycle benefit evaluation model of prefabricated buildings can be obtained as follows:
y = 0.23 x 1 + 0.10 x 2 + 0.22 x 3 + 0.25 x 4 + 0.04 x 5 + 0.16 x 6
There are 100 test samples in total, 4 of which are 1 group, with a total of 25 groups. There are 68.26% of the observations within one standard deviation of the average; 95.43% of the observations are within two standard deviations of the average; 99.73% of the observations are within three standard deviations of the average within range. The mean is 0.37 and the standard deviation is 0.65. The normal distribution analysis of the distribution of the difference between the estimated value and the measured value (residual error) obtained after the solution of the proposed evaluation model is shown in Figure 5a. It can be seen from the figure that the residual distribution is in line with the normal distribution curve trending. This shows that the regression prediction model has universal applicability in statistical significance; Figure 5b is the PP diagram of the regression standardized residuals of the prefabricated building life cycle benefit evaluation model, which is the cumulative probability and expectation of the actual measured value, the residual P-P diagram between the cumulative probability of the estimation results. It can be seen from the figure that the residual distribution curve surrounds the pre-specified distribution line and changes around the line. The distribution of the residual P-P diagram can meet the pre-set normal distribution. It shows that the distribution of the residual P-P diagram can meet the pre-set normal distribution and the equation has practical significance. In summary, the benefit evaluation model for the entire life cycle of prefabricated buildings has passed various tests, and the fitting effect is very good.

3. Results

In order to test the accuracy of the model, this paper refers to the verification method of Zhao et al. [41] model comparison. The evaluation model proposed by Zhao et al. [42] when studying the comprehensive benefits of prefabricated buildings was compared with the evaluation model established in this paper. Zhao et al. calculated 19 indicators and their weights as shown in Table 8.
Using the expert scoring method, the evaluation model of this paper and the evaluation model proposed by Zhao et al. are used to evaluate the actual situation of the prefabricated building case in Shenyang, China. Shenyang is located in the northeast of China, and the climate has obvious seasonal frozen characteristics, which can effectively test the accuracy of the whole life cycle benefit evaluation model of prefabricated buildings in seasonal frozen areas. Since there is no seasonal freezing effect in the original model, in the expert scoring link, on the basis of the original 19 indicators, one item is added for a total of 20 evaluation indicators. In order to improve the accuracy of the scoring result data, this paper selected 100 valid questionnaires. The selection criteria for the number of questionnaires have been discussed in the previous section. The interviewees were experts in the prefabricated construction industry in Shenyang, China, including architects, project managers, and chief engineers. The occupational distribution chart is shown in Figure 6.
The scoring results of 100 experts are averaged, as shown in Table 9.
Bringing the scoring results into the model can get the benefit scores and comprehensive benefit scores of each stage of the prefabricated building life cycle, so as to compare the differences in the evaluation results of the two models. Through calculation, in the design stage, the benefit score of this research model is 28.18 points, and the benefit score of the reference model is 27.46 points. In the construction phase, the benefit score of the research model is 30.76 points, and the benefit score of the reference model is 33.58 points. In the operation stage, the benefit score of the research model is 23.00 points, and the benefit score of the reference model is 24.23 points. In the demolition stage, the benefit score of the research model is 3.76 points, and the benefit score of the reference model is 1.88 points. After summing the scores of each stage, the comprehensive benefit score of the model is obtained. The comprehensive benefit score of the research model is 85.7 points, and the comprehensive benefit score of the reference model is 87.15 points.

4. Discussion

First, the calculation results of the two models in each stage of the prefabricated building’s life cycle are compared, and then the comprehensive benefit calculation results of the two models are compared. The comparison results are shown in Figure 7 and Figure 8.
This paper refers to the histogram comparison method used by Zhao et al. [43], and draws a histogram of the benefit scores of each stage of the prefabricated building. It can be seen from Figure 7 that in the design stage and the operation stage, the difference between the benefit score calculated by the model in this paper and the benefit score calculated by the model of Zhao et al. is relatively small. In the design stage, the calculation result of this paper is 2.6% higher than the calculation result of the model of Zhao et al. In the operation stage, the calculation results in this paper are 5.3% lower than the calculation result of the model of Zhao et al. The score gap between the two is mainly due to the difference between the weights of indicators in this paper and the model of Zhao et al. In order to make the benefit evaluation process more concise and efficient, this paper uses hierarchical clustering to filter out the key indicator groups, and only considers the 1–2 key indicators with the greatest impact in each stage. However, the model proposed by Zhao et al. lacks the steps of extracting key indicators, which leads to more complicated calculations. From the perspective of comparison results, the score gap between the two models is relatively small, but the calculation process of the model in this paper is more concise, reflecting the efficiency of the model in this paper.
In the construction stage, there is a big gap between the benefit score calculated by the model in this paper and the benefit score calculated by the model of Zhao et al. In the construction stage, the calculation result of this paper is 9.2% lower than the calculation result of the model of Zhao et al. The difference between the scores of the two comes from the fact that this paper combines the actual conditions of the seasonal frozen area during the construction stage, and proposes the index of the seasonal frozen effects, but the model of Zhao et al. does not take into account the seasonal frost influence. This case is located in Shenyang, China. This area belongs to the frozen regions of China. During winter construction, it will be affected by seasonal frozen regions, which will reduce the benefit score of the construction stage. When evaluating the benefits of prefabricated buildings in seasonal frozen regions, this paper can more truly reflect the benefit scores during the construction stage, which demonstrates the practicality of the model in this paper.
In the demolition stage, the calculation result of this paper is twice as high as the calculation result of the model of Zhao et al. However, because the benefit of the demolition stage has a very low impact on the comprehensive benefit of the entire life cycle of the prefabricated building, the index weight of the demolition stage is much smaller than that of other stages. Therefore, the benefit scores of this model and the model of Zhao et al. are both very low, and the comparison between the two has no practical research significance.
It can be seen from the comparison in Figure 8 that from the perspective of the comprehensive benefit scores of the whole life cycle, the difference between the benefit scores calculated by the model in this paper and that calculated by the model of Zhao et al. is very small. The calculation results in this paper are 1.7% lower than the case calculation results. The evaluation results of the two models are basically the same, which reflects the accuracy of the model in this paper.
Analyzing the parameters of the model, it can be seen that the weight of resource consumption is 0.25, which is the most influential index. This also shows that prefabricated buildings have obvious advantages in reducing energy consumption. Therefore, it is necessary to be more detailed when evaluating the energy consumption of prefabricated buildings. It is necessary to comprehensively consider energy efficiency factors such as carbon emissions and resource reuse, make accurate judgments on the energy consumption of prefabricated buildings, and convert the advantages of low energy consumption of prefabricated buildings into the actual data reflected to make the model evaluation result more accurate. Therefore, the research results of this paper can promote the development of energy efficiency evaluation of prefabricated buildings, make the energy efficiency evaluation process of prefabricated buildings more detailed and the evaluation results more accurate.

5. Conclusions

(1)
This paper divides the prefabricated building into the planning and design phase, the construction phase, the operation and maintenance phase, the demolition and recycling phase based on the prefabricated building life cycle theory. From the perspectives of economy, environment, and society, 16 items are selected through literature research. It also creatively proposes the impact indicators of the climate characteristics of seasonally frozen regions, and comprehensively evaluates the comprehensive benefits of prefabricated buildings throughout the life cycle.
(2)
The relative importance and standard deviation of each indicator are calculated by issuing questionnaires to senior leaders, project managers and field experts engaged in the prefabricated construction industry. The SPSS nearest neighbor element analysis method is used to group the indicators, and the indicator group that has the greatest impact on the comprehensive benefits of the entire life cycle of the prefabricated building is selected including design costs, component production costs, construction costs, resource consumption, construction recovery benefits, and seasonal frozen effects.
(3)
A life-cycle benefit evaluation model for prefabricated buildings in seasonal frozen areas is proposed, and the analytic hierarchy process is used to calculate the weight of each index in the index group based on the results of experts’ scoring, and the consistency test is carried out. Among them, the weight of research and development cost is 0.23, the weight of component production cost is 0.10, the weight of construction cost is 0.22, the weight of resource consumption is 0.25, the weight of building demolition cost is 0.04, and the weight of seasonal frozen effects is 0.16. Judging by the data distribution graph, kurtosis value and skewness value, the expert scoring data conforms to the normal distribution, and the calculation result is accurate.
(4)
Compared with other models, the evaluation model proposed in this paper can evaluate the benefits of prefabricated buildings in seasonal frozen areas more concisely and efficiently. In the design stage, the calculation result of the model proposed in this paper is 2.6% higher than the calculation result of the model of Zhao et al. In the operation phase, the calculation result of the model proposed in this paper is 5.3% lower than the model of Zhao et al. During the construction phase, it is proposed that the calculation result of the model proposed in this paper is 9.2% lower than the calculation result of the model of Zhao et al. In the demolition phase, the calculation result of the model proposed in this paper is twice the model of Zhao et al. From the whole life cycle comprehensive benefit score, the model calculation result is 1.7% lower than the calculation result of the model of Zhao et al.
(5)
The model proposed in this paper has high practical application value, and can be applied to the benefit evaluation of prefabricated buildings in various seasonal frozen ground regions, and improve the accuracy of the comprehensive benefit evaluation results of prefabricated buildings in seasonal frozen ground regions. The research significance of this paper is also reflected in the development process of the project. Operators can start from the six key influencing factors screened out in this paper, according to the actual situation of different projects, rationally allocate resources, and achieve the goal of maximizing comprehensive benefits. In the research and development stage, the research and development cost of prefabricated buildings can be reduced by applying building information modeling (BIM) technology to assist development; the production of prefabricated components adopts an assembly line production method to improve production efficiency and reduce production energy consumption. In the construction stage, the use of subgrade soil replacement and artificial salinization of roadbed soil will reduce the impact of seasonal frozen soil on the project; the use of segmented construction methods can achieve simultaneous multi-process construction, reduce energy consumption during construction, and increase construction efficiency. In the operation stage, in order to reduce energy consumption in the operation process, new technologies such as solar photovoltaic power generation technology and rainwater and sewage reuse can be adopted to reduce resource consumption and carbon emissions. In the demolition stage, it is possible to take full advantage of the high component-recycling rate of prefabricated buildings, increase component-recycling revenue, and reduce demolition costs.

Author Contributions

Conceptualization, Q.Z.; methodology, R.F.; validation, S.K.; data curation, D.N.; writing—original draft preparation, J.L.; writing—review and editing, Q.Z. All authors have read and agreed to the published version of the manuscript.

Funding

The research is partially funded by the Ministry of Science and Higher Education of the Russian Federation under the strategic academic leadership program ‘Priority 2030’ (Agreement 075-15-2021-1333 dated 30.09.2021).

Institutional Review Board Statement

Not applicable.

Informed Consent Statement

Not applicable.

Data Availability Statement

The data presented in this study are available from the corresponding author upon reasonable request.

Conflicts of Interest

The authors declare no conflict of interest.

References

  1. Khan, K.; Yan, J.B. Numerical studies on the seismic behaviour of a prefabricated multi-storey modular steel building with new-type bolted joints. Adv. Steel Constr. 2021, 17, 1–9. [Google Scholar] [CrossRef]
  2. Kubečková, D.; Kraus, M.; Šenitková, I.J.; Vrbová, M. The indoor microclimate of prefabricated buildings for housing: Interaction of environmental and construction measures. Sustainability 2020, 12, 10119. [Google Scholar] [CrossRef]
  3. Pihelo, P.; Kuusk, K.; Kalamees, T. Development and Performance Assessment of Prefabricated Insulation Elements for Deep Energy Renovation of Apartment Buildings. Energies 2020, 13, 1709. [Google Scholar] [CrossRef] [Green Version]
  4. Tsoka, S.; Theodosiou, T.; Papadopoulou, K.; Tsikaloudaki, K. Assessing the energy performance of prefabricated buildings considering different wall configurations and the use of PCMs in Greece. Energies 2020, 13, 5026. [Google Scholar] [CrossRef]
  5. Adekunle, T.O.; Nikolopoulou, M. Winter performance, occupants’ comfort and cold stress in prefabricated timber buildings. Build. Environ. 2019, 149, 220–240. [Google Scholar] [CrossRef]
  6. Barelli, L.; Bidini, G.; Pinchi, E. Evaluation of the corrected seasonal energy demand, for buildings classification, to be compared with a standard performance scale. Energy Build. 2009, 41, 958–965. [Google Scholar] [CrossRef]
  7. Cabeza, L.F.; Rincon, L.; Vilarino, V.; Perez, G.; Castell, A. Life cycle assessment (LCA) and life cycle energy analysis (LCEA) of buildings and the building sector: A review. Renew. Sust. Energ. Rev. 2014, 29, 394–416. [Google Scholar] [CrossRef]
  8. Ji, Y.B.; Qi, K.; Qi, Y.; Li, Y.; Li, H.X.; Lei, Z.; Liu, Y. BIM-based life-cycle environmental assessment of prefabricated buildings. Eng. Constr. Archit. Manag. 2020, 27, 1703–1725. [Google Scholar] [CrossRef]
  9. Wang, H.; Zhang, Y.Q.; Gao, W.J.; Kuroki, S. Life Cycle Environmental and Cost Performance of Prefabricated Buildings. Sustainability 2020, 12, 2609. [Google Scholar] [CrossRef] [Green Version]
  10. He, Y.; Zhang, Y.; Zhang, C.; Zhou, H. Energy-saving potential of 3D printed concrete building with integrated living wall. Energy Build. 2020, 222, 110110. [Google Scholar] [CrossRef]
  11. Yangyue, S.U.; Zhao, J.; Youquan, X.U.; Hongyun, S.I. Research on Quality Problems and Improvement of Production and Construction of Prefabricated Building. Constr. Econ. 2016, 37, 38–43. [Google Scholar]
  12. Li, S.C. Green building Technology of Prefabricated Building. In Proceedings of the 2020 10th Chinese Geosynthetics Conference & International Symposium on Civil Engineering and Geosynthetics (ISCEG 2020), Chengdu, China, 23–27 September 2020; Volume 198, p. 3007. [Google Scholar]
  13. Zhang, J.; Wang, H.; Chu, X. Benefit evaluation of prefabricated concrete structure and its development in china. Archit. Technol. 2007, 38, 9. [Google Scholar]
  14. Yongsen, L.I.; Su Fa Ng, L.I.; Management, S.O.; University, A.J. Research on the Economy of Prefabricated Houses Based on the Whole Life Cycle Theory. Eng. Econ. 2016, 26, 66–69. [Google Scholar]
  15. Kim, Y.W.; Han, S.H.; Yi, J.S.; Chang, S.W. Supply chain cost model for prefabricated building material based on time-driven activity-based costing. Can. J. Civ. Eng. 2016, 43, 287–293. [Google Scholar] [CrossRef]
  16. Mehrbod, S.; Staub-French, S.; Tory, M. BIM-based building design coordination: Processes, bottlenecks, and considerations. Can. J. Civ. Eng. 2020, 47, 25–36. [Google Scholar] [CrossRef]
  17. Liu, H.; Liu, Q. The Urban Heat Islands Analysis: Factors of Building Surface, Green Area and Lighting. Master’s Thesis, University of Gävle, Gävle, Swenden, 2012. [Google Scholar]
  18. Rui, P.S.; Carbalho, A.C.; Carvalho, D.; Rocha, A. Study of Urban Heat Islands Using Different Urban Canopy Models and Identification Methods. Atmosphere 2021, 12, 521. [Google Scholar]
  19. Chang, C.G.; Yu, Z. Optimization Model Under Grouping Batch for Prefabricated Components Production Cost. In Proceedings of the International Conference on Intelligent and Interactive Systems and Applications, Beijing, China, 17–18 June 2017; Springer: Cham, Switzerland, 2017. [Google Scholar]
  20. Zhong, C.; Zhang, M.; Cui, X.; Liu, Z. Comprehensive Evaluation of China’s Prefabricated Decoration Cost Based on Analytic Hierarchy Process. Adv. Civil Eng. 2020, 2020, 1583748. [Google Scholar] [CrossRef]
  21. Lu, W.S.; Yuan, H.P. Investigating waste reduction potential in the upstream processes of offshore prefabrication construction. Renew. Sust. Energ. Rev. 2013, 28, 804–811. [Google Scholar] [CrossRef] [Green Version]
  22. Qi, J.L.; Vermeer, P.A.; Cheng, G.D. A review of the influence of freeze-thaw cycles on soil geotechnical properties. Permafr. Periglac. Process. 2006, 17, 245–252. [Google Scholar] [CrossRef]
  23. Zuo, J.; Rameezdeen, R.; Hagger, M.; Zhou, Z.; Ding, Z. Dust pollution control on construction sites: Awareness and self-responsibility of managers. J. Clean. Prod. 2017, 166, 312–320. [Google Scholar] [CrossRef]
  24. Hammad, A.W.A.; Akbarnezhad, A.; Rey, D. A multi-objective mixed integer nonlinear programming model for construction site layout planning to minimise noise pollution and transport costs. Autom. Constr. 2016, 61, 73–85. [Google Scholar] [CrossRef]
  25. Hao, J.L.; Cheng, B.; Lu, W.; Xu, J.; Guo, Z. Carbon emission reduction in prefabrication construction during materialization stage: A BIM-based life-cycle assessment approach. Sci. Total Environ. 2020, 723, 137870. [Google Scholar] [CrossRef] [PubMed]
  26. Horta, I.M.; Camanho, A.S.; Dias, T.G. Residential building resource consumption: A comparison of Portuguese municipalities’ performance. Cities 2016, 50, 54–61. [Google Scholar] [CrossRef]
  27. Kim, J.; Han, S.; Hyun, C. Minimizing Fluctuation of the Maintenance, Repair, and Rehabilitation Cost Profile of a Building. J. Perform. Constr. Facil. 2016, 30, 4015034. [Google Scholar] [CrossRef]
  28. Frontczak, M.; Schiavon, S.; Goins, J.; Arens, E.; Zhang, H.; Wargocki, P. Quantitative relationships between occupant satisfaction and satisfaction aspects of indoor environmental quality and building design. Indoor Air 2012, 22, 119–131. [Google Scholar] [CrossRef] [PubMed] [Green Version]
  29. Alsulaili, A.D.; Al-Matrouk, M.F.; Al-Baghli, R.A.; Al-Enezi, A.F. Environmental and economic benefits of applying green building concepts in Kuwait. Environ. Dev. Sustain. 2019, 22, 3371–3387. [Google Scholar] [CrossRef]
  30. Da Ntata, N.; Touran, A.; Wang, J. An analysis of cost and duration for deconstruction and demolition of residential buildings in Massachusetts. Resour. Conserv. Recycl. 2005, 44, 1–15. [Google Scholar] [CrossRef]
  31. Zhang, C.; Hu, M.; Sprecher, B.; Yang, X.; Tukker, A. Recycling potential in building energy renovation: A prospective study of the Dutch residential building stock up to 2050. J. Clean Prod. 2021, 301, 126835. [Google Scholar] [CrossRef]
  32. Thompson, L.; Hill, M.; Lecky, F.; Shaw, G. Defining major trauma: A Delphi study. Scand. J. Trauma Resusc. Emerg. Med. 2021, 29, 1–20. [Google Scholar] [CrossRef]
  33. Shapira, A.; Simcha, M. AHP-Based Weighting of Factors Affecting Safety on Construction Sites with Tower Cranes. J. Constr. Eng. Manag. 2009, 135, 307–318. [Google Scholar] [CrossRef]
  34. Kaufman, L.; Rousseeuw, P.J. Finding Groups in Data: An Introduction to Cluster Analysis; John Wiley & Sons: Hoboken, NJ, USA, 2009; pp. 164–198. [Google Scholar]
  35. Zhao, Q.Q.; Zhang, H.T.; Fediuk, R.S.; Wang, J.W. Antiskid prediction model for cement pavements in seasonal frost regions. Mag. Civ. Eng. 2020, 98, 140. [Google Scholar] [CrossRef]
  36. Saaty, T.L. Decision Making for Leaders: The Analytic Hierarchy Process for Decisions in a Complex World; RWS Publications: Pittsburgh, PA, USA, 1982; pp. 277–285. [Google Scholar]
  37. Saaty, T.L. The Analytic Hierarchy Process; McGraw Hill: New York, NY, USA, 1980. [Google Scholar]
  38. Zhang, M. The tennis serve technology based on the AHP evaluation of consistency check. Biotechnol. Indian J. 2014, 10, 4651–4657. [Google Scholar]
  39. Zhao, Q.; Cheng, P.; Wei, Y.; Zhou, X. IRI predictive revised model for cement pavement in seasonal frozen region using MEPDG. Harbin Gongye Daxue Xuebao/J. Harbin Inst. of Technol. 2018, 50, 171–177. [Google Scholar]
  40. He, T.; Ho, W.; Man, C.; Xu, X. A fuzzy AHP based integer linear programming model for the multi-criteria transshipment problem. Int. J. Logist. Manag. 2012, 23, 159–179. [Google Scholar] [CrossRef] [Green Version]
  41. Zhao, Q.; Cheng, P.; Wang, J.; Wei, Y.U. Damage prediction model for concrete pavements in seasonally frozen regions. Mag. Civ. Eng. 2018, 84, 57–66. [Google Scholar]
  42. Zhao, W.; Zhang, B.; Yang, Y. Empirical study of comprehensive benefits for prefabricated buildings: A case study of Hefei city. Int. J. Electr. Eng. Educ. 2020. [Google Scholar] [CrossRef]
  43. Zhao, Q.; Zhang, H.; Fediuk, R.S.; Wang, J.; Fu, Q. Freeze-thaw damage model for cement pavements in seasonal frost regions. Mag. Civ. Eng. 2021, 104, 10406. [Google Scholar]
Figure 1. Occupational distribution map of 55 respondents.
Energies 14 07119 g001
Figure 2. Grouping diagram of nearest neighbor elements.
Energies 14 07119 g002
Figure 3. Occupational distribution map of 237 respondents.
Energies 14 07119 g003
Figure 4. Expert opinion distribution.
Energies 14 07119 g004
Figure 5. Residual Histogram and Residual Regression P-P Diagram of DBL. (a) Residual Histogram (b) Residual Regression P-P Diagram.
Energies 14 07119 g005
Figure 6. Occupational distribution map of 100 respondents.
Energies 14 07119 g006
Figure 7. Comparison of benefit scores at various stages.
Energies 14 07119 g007
Figure 8. Comparison of comprehensive benefit scores.
Energies 14 07119 g008
Table 1. Questionnaire survey results.
Point12345
Index
research and development cost C1100201520
design cost C120072325
building green space rate C1303151918
heat island effect C1406171913
component production cost C2100102124
construction cost C2200102223
seasonal frozen effect C2300132121
dust pollution C2400171523
noise pollution C2506201217
carbon emission C2607191811
resource consumption C3100142120
maintenance cost C3208201710
owner satisfaction C3303152017
green building concept C3404191517
building demolition cost C4107141915
component recycling benefit C4200142021
Table 2. Index cluster calculation results.
Evaluation IndexZ(RIV)Z(SDV)
research and development cost C110.22−0.14
design cost C121.63−1.65
building green space rate C13−0.060.47
heat island effect C14−1.191.09
component production cost C211.46−1.21
construction cost C221.33−1.29
seasonal frozen effect C230.95−0.94
dust pollution C240.32−0.24
noise pollution C25−1.061.68
carbon emission C26−1.691.00
resource consumption C310.70−0.86
maintenance cost C32−2.201.09
owner satisfaction C33−0.180.29
green building concept C34−0.691.09
building demolition cost C41−0.941.60
component recycling benefit C420.83−0.74
Table 3. Assignment of the Saaty1–9 scale method.
Quantized ValueRelative Importance
1Equally important
3Slightly important
5Obviously important
7Strongly important
9Extremely important
2,4,6,8Intermediate values
Table 4. AHP average consistency index value table (adapted from [38]).
Matrix Order123456789
RI000.580.901.121.241.321.411.45
Table 5. This expert’s AHP calculated the results.
AB1B2B3B4B5B6MiwiwiConsistencyRank
B111/31/4231/30.170.740.10 4
B2311/2452601.980.25λmax = 6.082
B34215637203.000.38CI = 0.0161
B41/21/41/5121/30.020.510.07RI = 1.245
B51/31/51/61/211/40.0010.330.04CR = 0.013 < 0.16
B631/21/334141.260.16 3
Table 6. Average weight of the indicator.
AWeightsRank
B10.232
B20.105
B30.223
B40.251
B50.046
B60.164
Table 7. Normal distribution test table.
Rank ScoreDifference between Expert Opinion and Calculation Result Ranking
−55 places lower than the calculated rank
−44 places lower than the calculated rank
−33 places lower than the calculated rank
−22 places lower than the calculated rank
−11 places lower than the calculated rank
0Consistent with calculation order
11 place higher than the calculated rank
22 place higher than the calculated rank
33 place higher than the calculated rank
44 place higher than the calculated rank
55 place higher than the calculated rank
Table 8. Reference model indicators and weights.
Evaluation IndexWeight
production research and development costs0.206
component design cost0.116
component production cost0.056
component marketing expense0.034
construction and installation expense0.087
maintenance and management expense0.056
recycling and dismantling expense0.021
resource consumption0.096
energy consumption0.055
garbage emission0.025
dust pollution0.037
noise pollution0.01
labor productivity level0.058
product performance benefit0.02
customer satisfaction0.035
product related benefit0.012
construction safety level0.05
safety education, protection, inspection level0.018
supervision level0.009
Table 9. Expert scoring results table.
Evaluation IndexScore Results
production research and development costs86
component design cost84
component production cost84
component marketing cost89
construction and installation cost86
maintenance and management cost79
seasonal frozen effects74
resource consumption92
energy consumption92
garbage emission86
dust pollution89
noise pollution87
labor productivity level90
product performance benefit86
customer satisfaction91
product related benefit84
construction safety level87
safety education, protection, inspection level94
supervision level88
recycling and dismantling expense94
Publisher’s Note: MDPI stays neutral with regard to jurisdictional claims in published maps and institutional affiliations.

