Abstract
The main objective of this work was to model ground collectors with different parameters and geometries in ANSYS R19.2 and to simulate their operation during the heating season in Slovakia in order to determine their impact on the soil. At the same time, four new geometries in the shape of vertical spirals with diameters of 6, 8 and 10 m were designed and simulated to occupy a smaller area while maintaining performance similar to classical geometries. Due to climate change, heat pumps are becoming an important proxy in the heating of buildings and are an important part of decarbonisation plans; thus, it is essential to adapt them to urban and metropolitan conditions. Ground source heat pumps possess high efficiency but require a lot of space for their collectors. The collector geometries proposed in this work are a combination of horizontal and vertical technologies and are feasible. Only one geometry achieved performance similar to classical geometries: spiral with 10 m diameter. Factors significantly influencing collector operation were confirmed, namely season, soil type, soil water content, geometry and collector placement.
1. Introduction
Heat pumps are becoming an important part of the plans of countries around the world with respect to decarbonizing and reducing emissions in the field of heating and hot water, not only in households but also in the industry. According to B2DS [1] (below 2 degrees scenario), in 2014 heat pumps form only 3.4% [2] of the heating equipment in buildings, but in 2060, it is expected that they will form more than 50% of all heating equipment. The most popular so far are still air pumps, especially for their price and ease of installation without the need for earthworks and significant interventions in the environment, unlike heat pumps with a horizontal ground collector for which modifying a very large area of land is necessary. It could be a big problem not just in Slovakia but in every country because in cities and metropolises, there is not much space to install horizontal ground collectors. This is the reason why this paper examines the different technical parameters of a ground collector and looks for the best geometry and setup for its operation in order to reduce the area and volume of the installation site. To achieve this aim, ANSYS and Fluent R19.2 were used.
The use of CFD (Computational Fluid Dynamics) is proving to be an appropriately costly, fast, and efficient alternative not only for the optimization and design of ground collectors, which is also easily available and commercially usable, but also in other industries. In addition, CFD analyses are flexible enough to meet any type of analysis requirements, from fluid flow prediction to complete collectors’ design and optimization, including the wide range of turbulence models available in CFDs. The simulations generally produce results that are in good agreement with the experimental studies, with deviations in the range of 2–10%; in exceptional cases, the deviation was up to 36% [3]. Given the current climatic conditions, it is necessary to look for environmentally acceptable options in both electricity generation and heating. Heat pumps are one of the solutions; thus, their development and research are particularly important, and it is necessary to adapt them as much as possible to the needs of people in both villages and cities. More and more studies are being devoted to optimizing heat pumps using CFD.
Three-dimensional numerical models of a horizontal ground collector and 10 cases of its installation were developed and created by Chong et al. (five spacing between the individual loops of the spiral, three diameters of loops and three combinations of thermal properties of the soil). In order to reduce the computational load, only half of the spiral ground collector loop was modelled. During the simulation, the authors assumed that the soil had constant properties and neglected the movement of water and solutes in the soil. Chong et al. investigated the heat outputs of individual simulated configurations, which are given as the heat recovery rate (W·m−1), sometimes called specific heat extraction, and heat consumption, respectively, as well as the impact of continuous and intermittent operation. The results show that a smaller loop spacing would provide better thermal performance and require less excavation work to install the system compared to configurations with larger loop spacings. The results also show that the loop diameter has a much smaller effect on thermal performance than loop spacing. Chong found that the thermal properties of the soil have a great influence on the thermal output of the ground collector. The results showed that discontinuous operation would increase the heat transfer rate by 58.5% and significantly reduce excavation work as well as the amount of piping material [4].
Larwa et al. were focused on modelling and simulating heat conduction in the ground. They assumed that the soil environment is an infinite plate. In the supposed system, the temperature profiles changed during each time interval until they reached a cyclic equilibrium state. With small changes in the temperature of the working fluid between the inlet and the outlet in the horizontal ground collector, heating or cooling the ground can be considered a two-dimensional problem. Larwa et al. considered flowing through seven horizontal tubes, which were connected in parallel and which are located in the ground. They found that each pipe cools the ground separately and independently of the other pipes. After some time, however, the temperature queues came together, and the system behaved similarly to the process of cooling the earth with an endless plate [5].
Pauli, together with colleagues Neuberger and Adamovsky, monitored and analyzed the temperatures of the soil in which linear and spiral earth collectors were installed. They also measured and compared the specific heat flux and the specific energy extracted from the ground during the heating season. In addition, they sought to identify and assess the impact of the ground collector configuration on temperature values of soil and their distributions [6]. In another study, it was found that the depth of collector buried has minimal effect on heat dissipation and energy balance in the soil around the collectors. They found that the average daily soil temperature was primarily influenced by the ambient temperature, regardless of the type of collector. The soil temperature near the collector was higher than the ambient temperature during 68.8% (linear arrangement) and 53.6% (spiral type) of the heating season. The ambient temperature was higher than the ground temperature, especially at the end of the heating season. The average daily temperatures in the collector area were below zero only in installations with a spiral-type ground collector, especially at the end of the heating season. The average daily temperature in the collector area was 1.97 ± 0.77 K higher with the linear collector than with the spiral type collector. The specific energies extracted from the ground during the day of the heating season qd were higher by an average value of 239.91 ± 198.35 Wh·m−2·day−1 in the setting with a linear collector as in the setting of the spiral type. The specific energies extracted from the ground during the entire heating season were 110.15 kWh·m−2 for linear storage and 57.85 kWh·m−2 for a spiral collector [7].
The thermal efficiency of spiral ground collectors for the UK climate was investigated by Wu et al. They presented the results of experimental measurements as well as numerical simulation using the three-dimensional CFD code ANSYS Fluent. In addition, they studied the heat removal from the ground in detail, the specific heat output of a linear ground collector and the influence of incident solar radiation on the energy balance of the ground. For example, they found the effect of loop diameter and loop spacing (i.e., the distance between the loops) on the thermal efficiency of a spiral ground collector. The specific heat extraction of both linear and spiral collectors was initially 46 W·m−1 and decreased with increasing system operation time but at different speeds. After running the systems for 140 h, the specific heat extraction of the straight pipe would be 3.5 W·m−1 higher than with the spiral pipe. There was no significant difference in the specific thermal extraction of the helical ground collector at different loop diameters 0.6, 0.8 and 1.0 m. However, the larger the diameter of the loop, the higher the heat extraction per meter of soil length. Specific heat extraction increased with increasing distance between the loops [8].
Another study on spiral ground collectors was carried out by Ali, Selamat, Kariya and Miraya, who not only investigated the influence of the orientation of the collectors in the soil on the speed of heat transfer and recovery but also investigated the effect of working medium flow. During operation, the performance of the collectors decreases with the operating time because the soil temperature has reached the temperature of the working medium. Since the orientation of the collector loops is not important because it has little effect on thermal performance (Selamat et al., 2015b), both vertical and parallel collectors would be more practical if they were covered with a material with high thermal conductivity. The average heat transfer rate increased by 21.7% for the vertical collector and 17.5% for the parallel collector when the flow rate increased from 1 L min−1 to 2 L·min−1 [9,10].
Experiments with horizontal ground collectors, their subsequent numerical simulations and parametric studies were also performed by Kim, Yoon, Go and Lee. They also focused on the economic and environmental aspects of collectors. They found that the smaller the loop spacing, the higher the total amount of heat extracted. However, when the distance between the loops is exceedingly small, mutual thermal interference between the tubes occurs, especially if the working medium in the tube flows too fast. They created a design of the installation, which according to the authors is economical, ecological and energy optimal: spacing of loops = 8 cm; depth of installation = 2.5 m; speed flow medium = 0.7 m·s−1. They claim that the type of collector and the thermal conductivity of the environment are the main factors influencing the performance of the collector, while the diameter of the pipe has no effect [11,12,13].
Condego et al., performed calculations using the Fluent function to simulate different horizontal ground collector configurations in order to evaluate the characteristics of these systems in the most common configurations and under different operating conditions. Specifically, three different geometry configurations (linear, laying spiral and helical) were analyzed for different operating conditions (winter and summer); varying depths of collector placement in the ground (from 1.5 to 2.5 m); working medium speed (from 0.25 to 1 m·s−1); and thermal conductivity of soil around collectors (from 1 to 3 W·m−1·K−1 Condego et al. found that the depth of the ground collector is not so important for its performance (up to 2.5 m depth). At a working medium speed of 1 m·s−1, the linear collector has a lower output than spiral collectors; at lower speeds, its output increased but the spiral collectors’ output, on the contrary, decreased. The thermal conductivity of the soil is an especially important factor significantly influencing the performance of collectors. With soil conductivity, the collector power was 3 W·m−1·K−1, which is twice as high as at conductivity 1 W·m−1·K−1. They state that the most advantageous in terms of performance is a helical collector, and its ability to obtain and transfer heat is 10 times higher than with a linear collector and five times higher than with a laying spiral collector [14,15].
There are many examples of the use of CFD modelling of ground collectors, the soil environment and their mutual interaction, as well as experimental studies on this topic. For example, the application of ANSYS Fluent was also used by Benazza et al. to investigate the influence of thermal conductivities and geometric parameters on the efficiency of the heat collector [16]. Garcia et al. investigated the interaction between the ground and the horizontal collector, finding that heat extraction by this collector has a significant effect not only on the temperature but also on ground humidity [17]. The importance of knowledge of soil temperature and ambient climatic data and their changes throughout the year, concerning the design of a horizontal ground heat exchanger configuration, is emphasized in Hepburn et al. [18].
Sanaye and Niroomand were involved in optimizing the design and use of different configurations of linear ground heat exchangers concerning ground temperature, extracted flow energy and the use of ground source heat pump systems [19]. Capozza, Zarrella and De Carli paid close attention to the influence of the interaction between the surface and the terrain of the environment on the performance of the horizontal ground collector and on the effect of the heat pump. They created a model of thermal resistances and capacities respecting the state of the environment, the intensity of solar radiation, heat transfer through irradiation of the earth’s surface and the influence of the spacing of the spiral heat exchanger tube. They analyzed the model in detail and verified it in run mode. The results of the simulation showed good agreement with the measurements and also showed insignificant effects of the distance between the tubes of the spiral heat exchanger [20].
The effects of ground moisture on the heat output of the ground collector and the COP were investigated by Leong et al. [21] Factors that affect the thermal conductivity of the earth were analyzed by Song et al. [22] and Banks [23]. Fujii and his team performed numerical simulations of the ground collector by using a FEFLOW finite element simulator and taking into account the energy balance on the landscape and the simplified shape of the spiral collector on the board [24].
Rezaei and colleagues experimented with the new insulation material called Tire Derived Aggregate (TDA, consisting mainly of cut pieces of used tires in various sizes from 2.5 cm to more than 12.7 cm), which they used as an inhomogeneous blanket of ground collectors. They found that this TDA layer increased the amount of energy absorbed from the ground by 17% in colder conditions and by 5–6% in temperate conditions [25].
This paper aims to determine the degree of influence of the individual parameters of the ground collector on its operation and its impact on the soil in its surroundings in the territory of Slovakia, where soil temperatures at depths of 10 and 100 cm and soil thermophysical properties are observed. The results are in agreement with other investigations of this kind, as mentioned above. The contribution of this paper is the simulation of the operation of collectors with classical geometries, i.e., meander collector, snail collector and 3D spiral collector, and the comparison of the results of their simulations with the authors’ designs, i.e., vertical spiral collectors, which are not currently studied or used in practice; therefore, this paper attempts to fill this particular gap in knowledge. The proposed geometries require a smaller area for groundworks, which would allow their installation at houses with smaller land plots, for example, in cities. Comparisons with other authors are not possible in this case, as no investigations with such geometries have been found. At present, no experiments have been carried out with the geometry mentioned, which provides space for further future research on this issue. Moreover, there are other possibilities of modifying this geometry (diameter and depth of burry) that could improve the collector’s performance.
2. Methods of Research
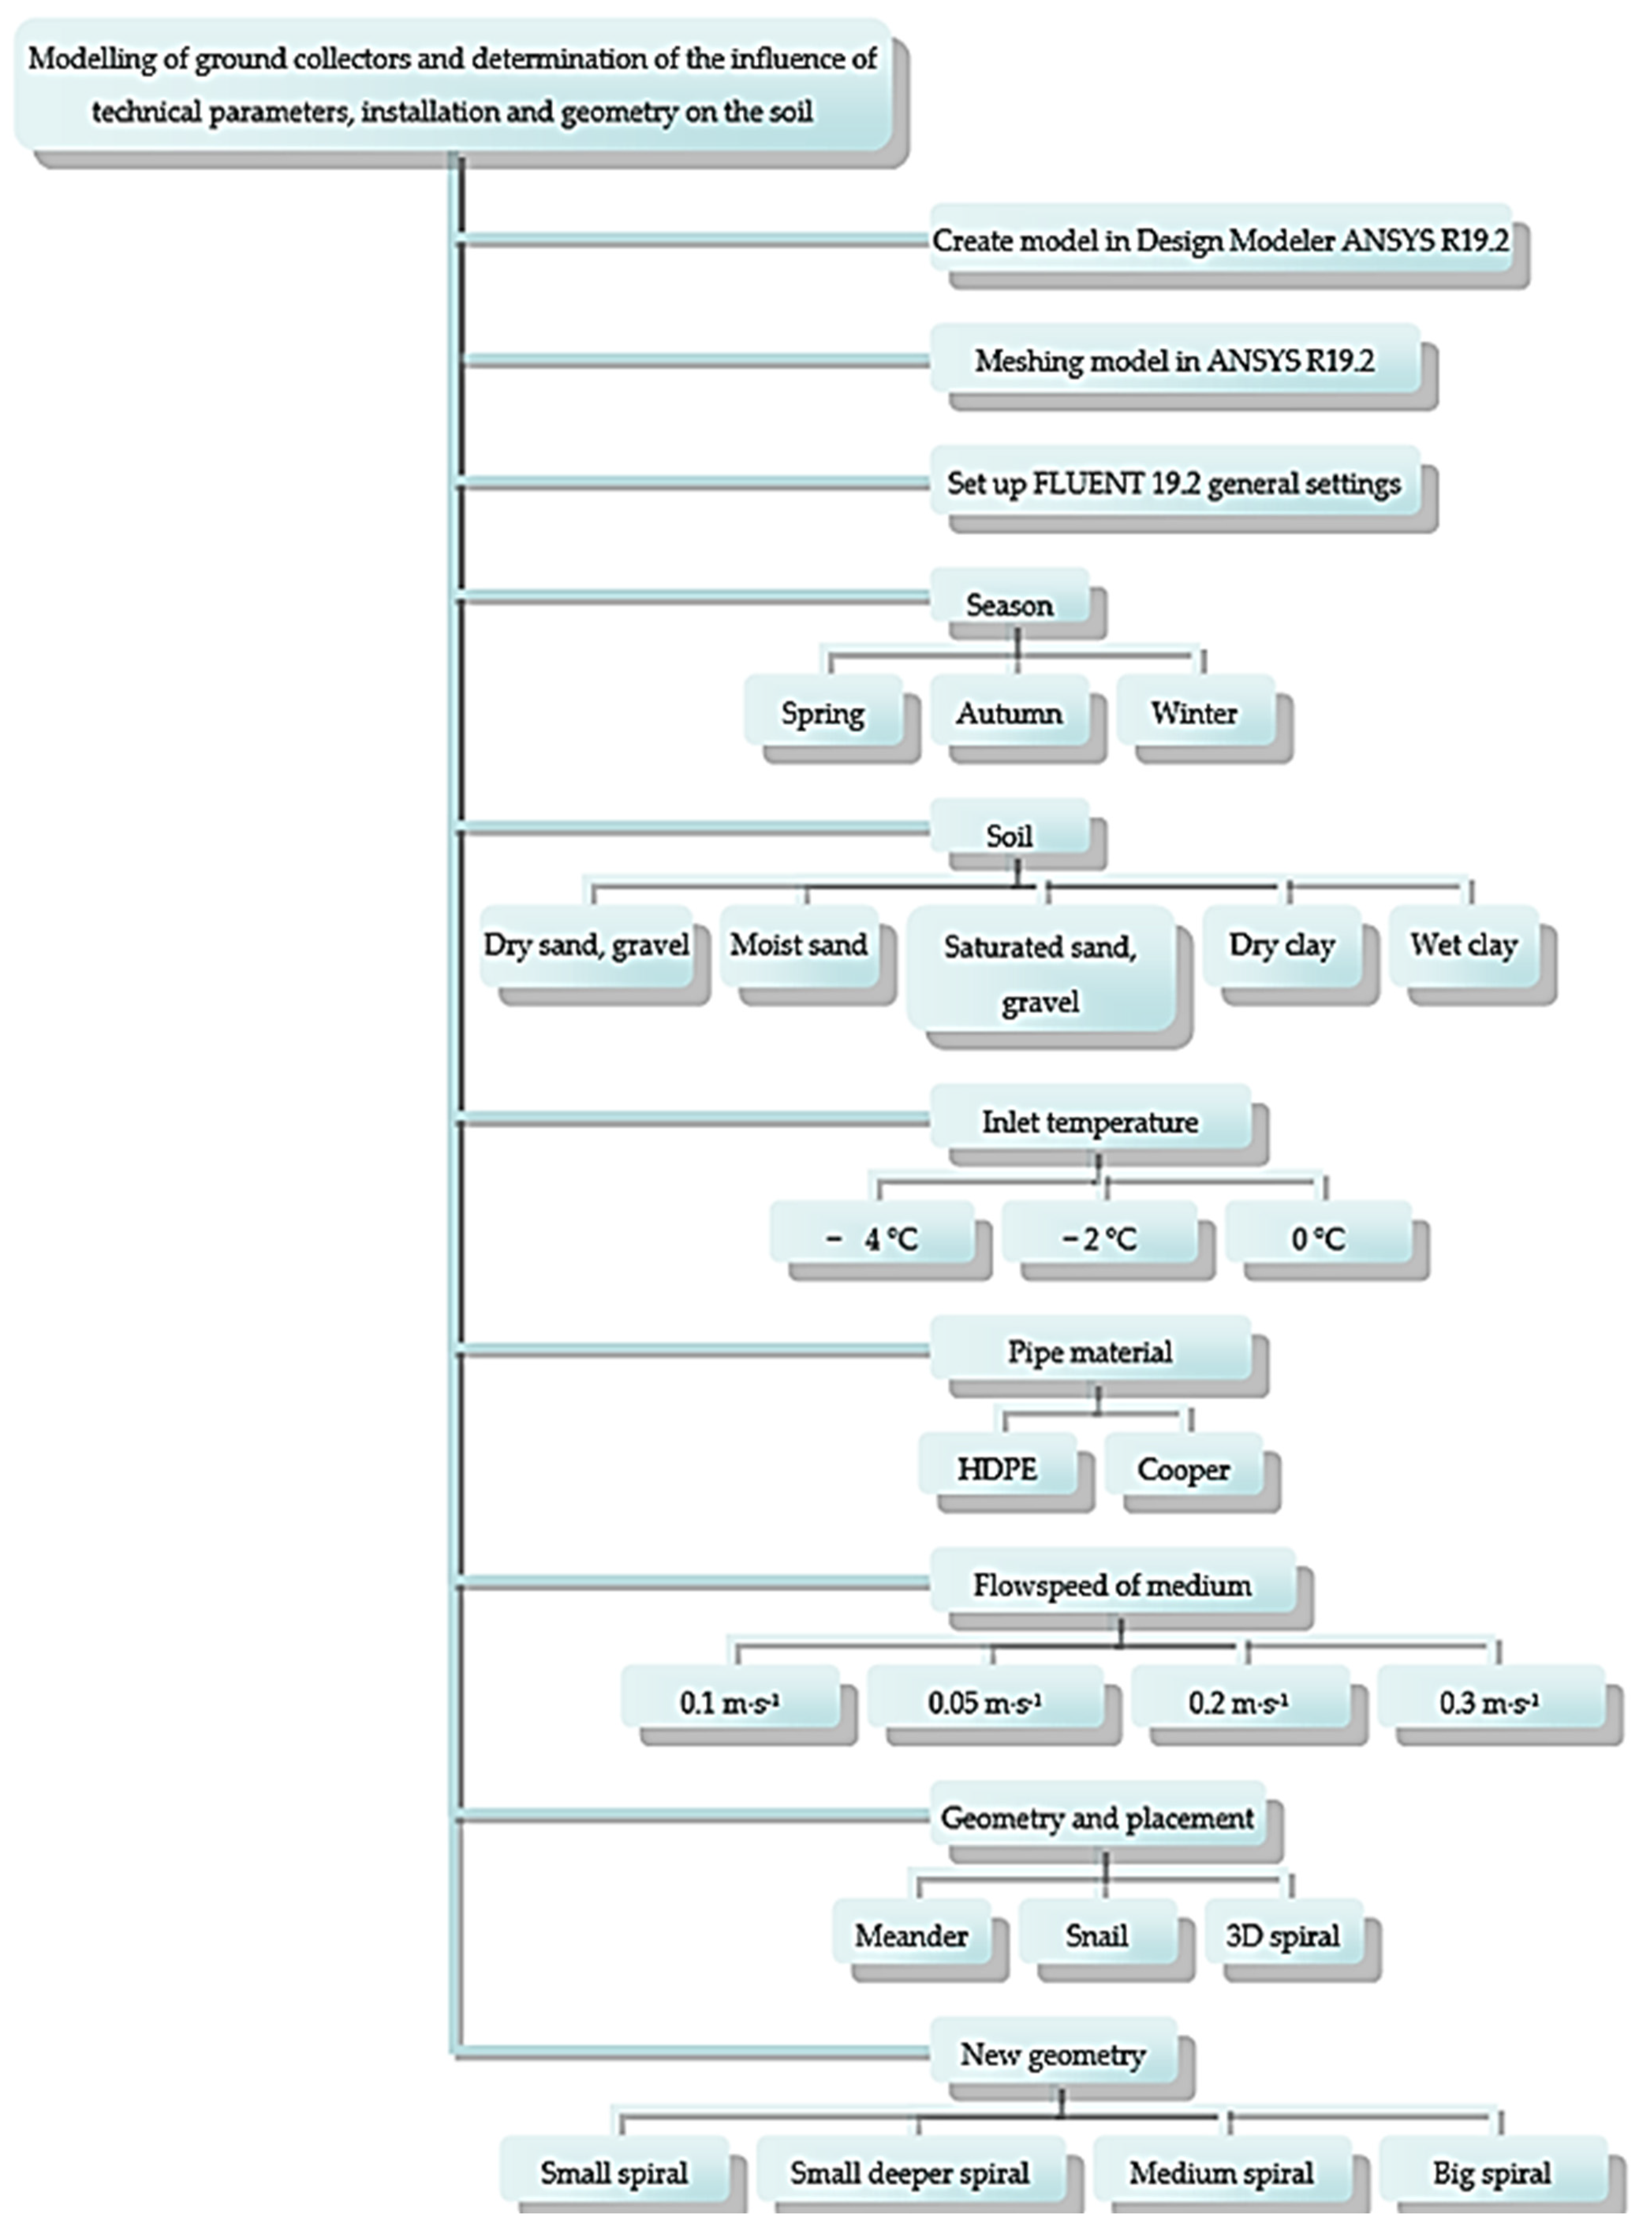
An important tool in this study includes ANSYS R19.2, and FLUENT 19.2 software was used to model the ground collector and simulate its operation under the conditions specified by the authors. Soil temperatures in Slovakia at depths of 10 and 100 cm between November 2017 and August 2018 and the thermophysical properties of the soils were observed. Collector models with classical geometries were created based on the knowledge from real installations. A basic first collector case with a meander geometry was created (see Figure 1) against which the remaining 13 cases were compared. The methodology of research is described by the flowchart in Figure 2. In total, 14 cases (see Table 1), 7 models (Figure 3) and 210 simulations (14 cases × 3 seasons × 5 soil types) were created and run.
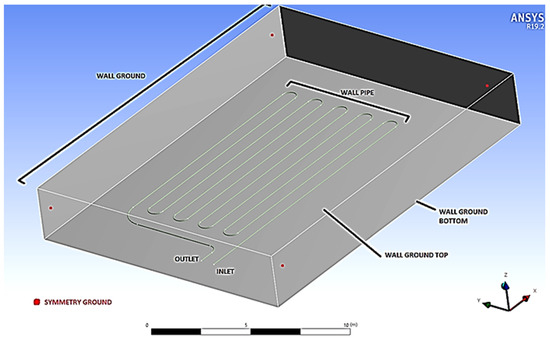
Figure 1.
The geometry of cases 1–8.
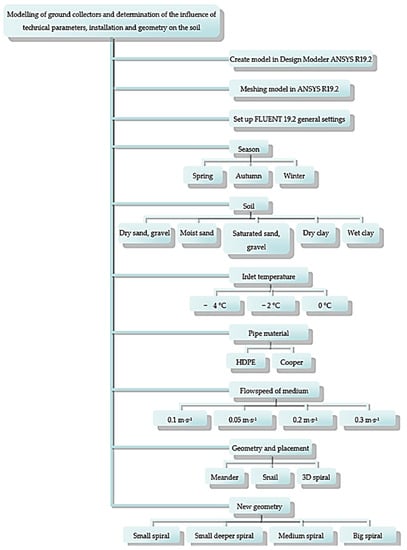
Figure 2.
Methodology of research.

Table 1.
Cases, observations and changed parameters.
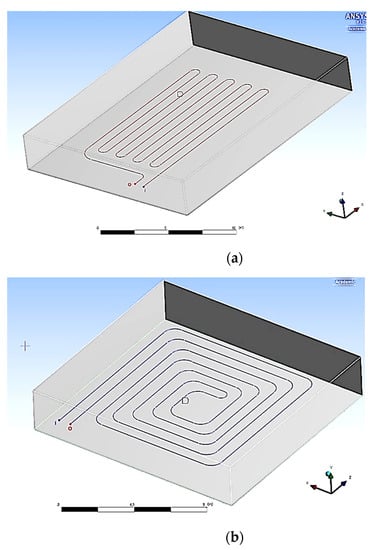

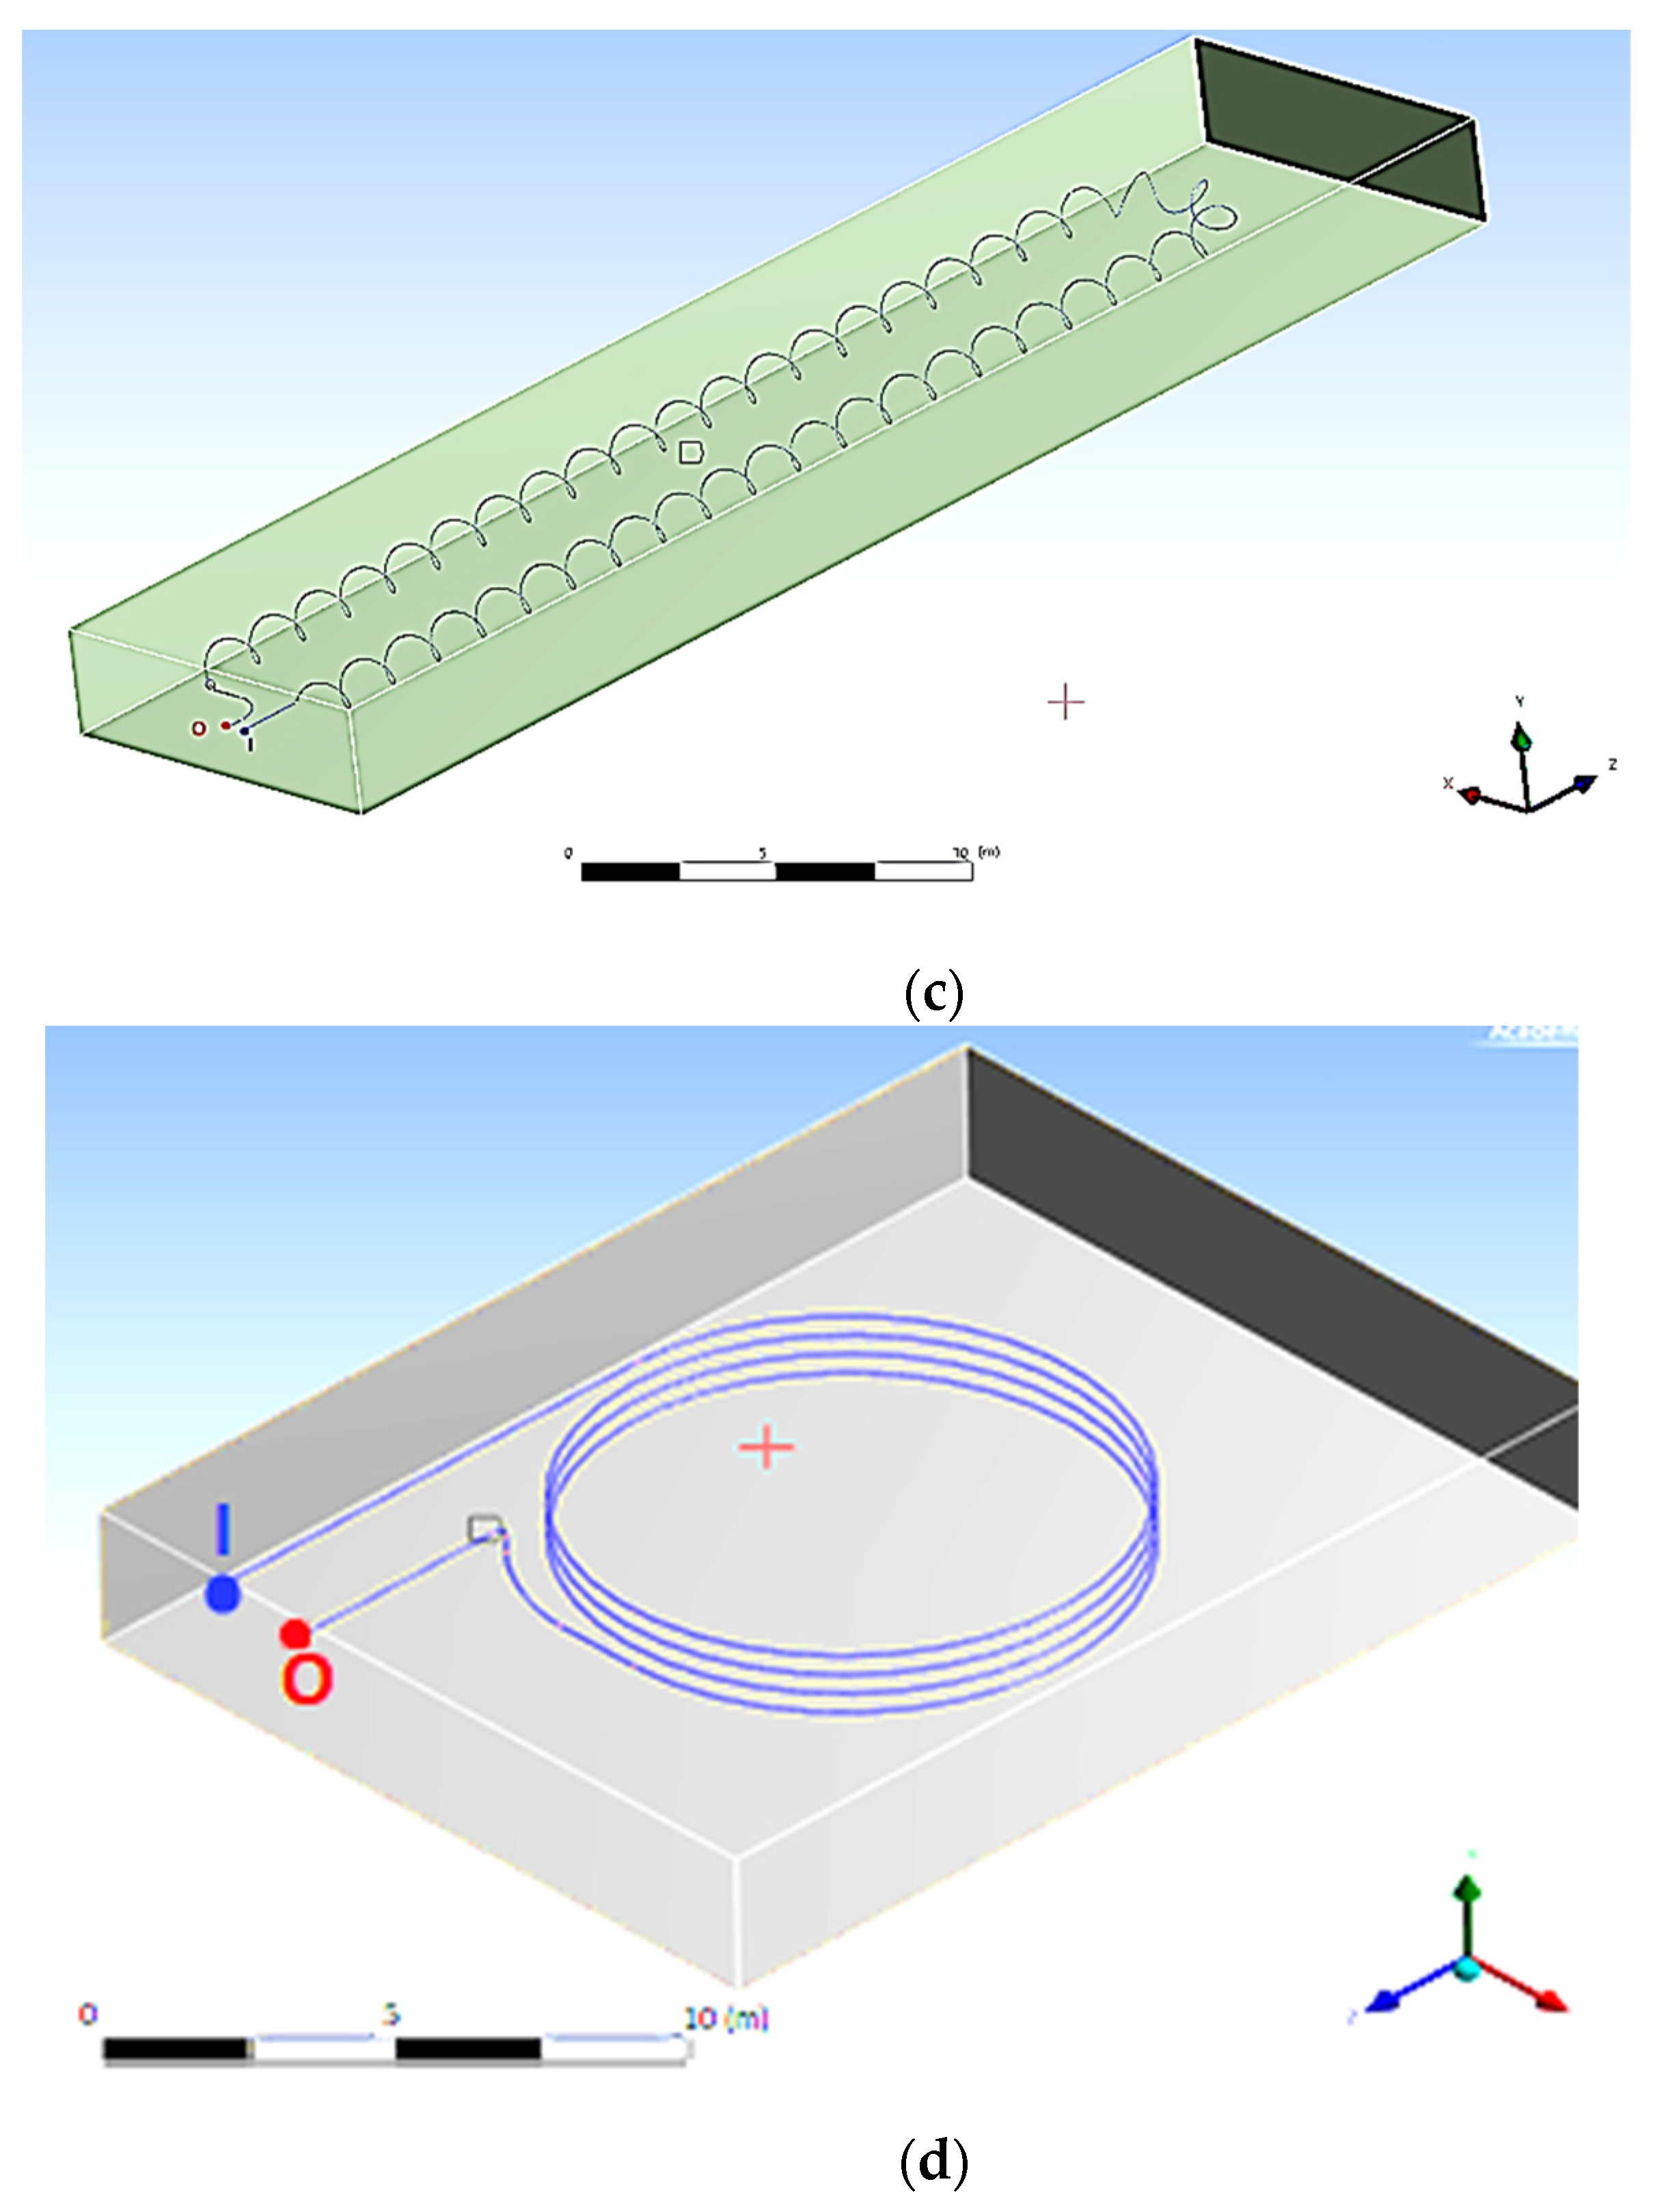
Figure 3.
Models of geometry and arrangement of collectors: (a) meander (cases 1–8), (b) snail (case 9), (c) 3D horizontal spiral (case 10) and (d) vertical spiral for cases 11–14; I—inlet; O—outlet.
All models were created in Design Modeler and meshed in Meshing ANSYS R19.2 (Figure 3, Table 2). The general settings in FLUENT 19.2 was set up (Table 3). A laminar viscous model was applied.
Table 2.
Parameters of all cases.
Table 3.
Simulation’s settings (FLUENT R19.2): volume and number of elements.
Migration of moisture and latent heat of the phase change caused by thermal gradient was not a consideration in this paper, but there is an assumption that our results could be affected by them. In case number 1, the impact of soil type on the output of the collector was researched, and 5 types of soil were used including dry sand/gravel, moist sand, saturated sand/gravel, dry clay and wet clay, which are all common in Slovakia; 15 simulations were runs. The highest output of the horizontal ground collector can be expected in Slovakia in the autumn when the heating season begins. The soils properties used in simulations and averages temperatures in Slovakia are visible in Table 4.
Table 4.
Soils properties and averages temperatures in Slovakia used in simulations.
Cases number 2 and 3 were focused on comparing the inlet temperature of the working medium in the collector with the temperature in case 1, which was −4 °C (−2, 0 °C). In Table 5, the working medium’s properties are shown.
Table 5.
Properties of the working medium used in simulations.
In case 4, pipe material (HDPE, copper) was studied. HDPE pipes are currently the most commonly used type not only for ground collectors but also for other devices where heat transfer plays an important role. However, the development of materials is still moving forward, and this can also bring new possibilities for optimizing heat pumps with a source of low-potential heat in the ground. However, due to the good conductive and thermal properties of copper, we decided to simulate our system with the exchange of pipe material from HDPE to copper. The basic properties of the pipe can be observed in Table 6.
Table 6.
Pipe properties used in simulations.
Flow velocity changed (0.05–0.3 m·s−1), and their effects on collectors’ output were viewed in cases 5–8. The velocity of mixture ethylene glycol and water, i.e., working medium, was 0.1 m·s−1 in the case of no. 1, which we consider to be the basic case of this study and with which all other cases are compared to; it is not a completely standard speed in the primary circuit of heat pumps, but the interval of these speeds is very large, and for each type, it is differently determined by the manufacturer or technician. Therefore, we also examined the effect of other velocities, namely 0.05, 0.15, 0.2 and 0.3 m·s−1.
In cases 9 and 10, the operations of the common geometry ground collector (snail, 3D spiral) was simulated and compared to meander geometry used in case 1. The depth of placement of the collector in the shape of a snail is the same as in the case of no. 1, i.e., 1.5 m below the surface, and the spacing between the individual pipes is also 0.8 m. With a 3D spiral, the centre of the loops is at the same depth, and since the diameter of the loops is 1 m, the highest point of the loops is at a depth of 1 m, and the lowest point at a depth of 2 m. The distance between the two uppermost points of the loops is 1.6 m.
In the end, simulations of the authors’ design geometries of the collector were conducted, and the results were compared with classical geometries. The authors decided to combine horizontal and vertical directions of placement and created new geometries—vertical spirals. Every spiral has a different diameter (6, 8 and 10 m), length of pipe (67.4–133.8 m), depth of buried (2–3.5 m) and spacing between pipe in a vertical direction (0.53–1.27 m).
Once the simulations were completed and the values obtained from FLUENT itself were processed, the temperature difference at the inlet and outlet of the collector was determined, and the results were used in the formula below:
where ρ represents the density of the medium, Cp is the specific heat capacity at constant pressure, A is the cross-sectional area of the pipe and (T_out − T_in) represents the temperature difference at the inlet and outlet of the collector. According to Han and Yu [26], the outlet temperature alone cannot measure the performance of a heat exchanger (ground collector) that operates at different pipe lengths and media flow rates, but the above formula, which represents the total energy recovered, helps to quantify its performance [26]. The result was then divided by the length and area of the collector in order to find its specific power per 1 m of pipe length and per 1 m2 of land. Graphical outputs from FLUENT in the form of cross-sections showing the temperature distribution in the collector and the soil were then compared and evaluated. Another form for processing the results involve utilizing graphs, which also serve primarily to compare the conclusions that result from individual cases of numerical simulation under specific conditions and settings.
P = ρ·Cp·u·A (T_out − T_in)
3. Results of Simulations, Calculations and Computing
The results of these studies are divided according to the subject of observation and are presented below in the individual subchapters.
3.1. Effect of Soil Environment—Case 1
During the autumn, the soil at the collector location has the highest temperature, and heat removal takes place mainly near the pipe itself. During the winter, the soil is significantly colder at this point, and heat extraction extends to a greater distance from the pipe. The water content in the soil is a significant factor that affects the performance of the collector, which results from a comparison of simulation results. Total collector output in dry sand and gravel was 606–1571 W; in moist sand, it was 1071–2778 W; in saturated sand and gravel, it was 1716–4466 W; in dry clay, it was 819–2128 W; and in wet clay, it was 1125–2929 W.
Performance of the buried collector:
- In moist sand, it has 76.8–77.7% higher performance than in dry sand.
- In saturated sand and gravel, it has a 183.2–184.9% higher output than in dry sand.
- In wet clay, it has 37.5% higher performance than in dry clay.
The effect of the presence of water can be seen in the sections of the models after simulation (see Figure 3), where it is very clear that while in saturated sand and gravel, there is faster and more pronounced heating than the collector filling in the dry soil of the same type where it has much slower heating; thus, the amount of heat extracted is substantially smaller. The soil type itself or rather its physical and chemical composition can affect the performance of the collector more or less significantly depending on the specific properties of the soil.
Performance of installed collector:
- In dry clay, it increases its performance by 35.2–35.9% compared to dry sand.
- In wet clay, it increases its performance by 4.9–5.4% compared to moist sand.
- In saturated sand–gravel, it increases its performance by 52.5% compared to wet clay.
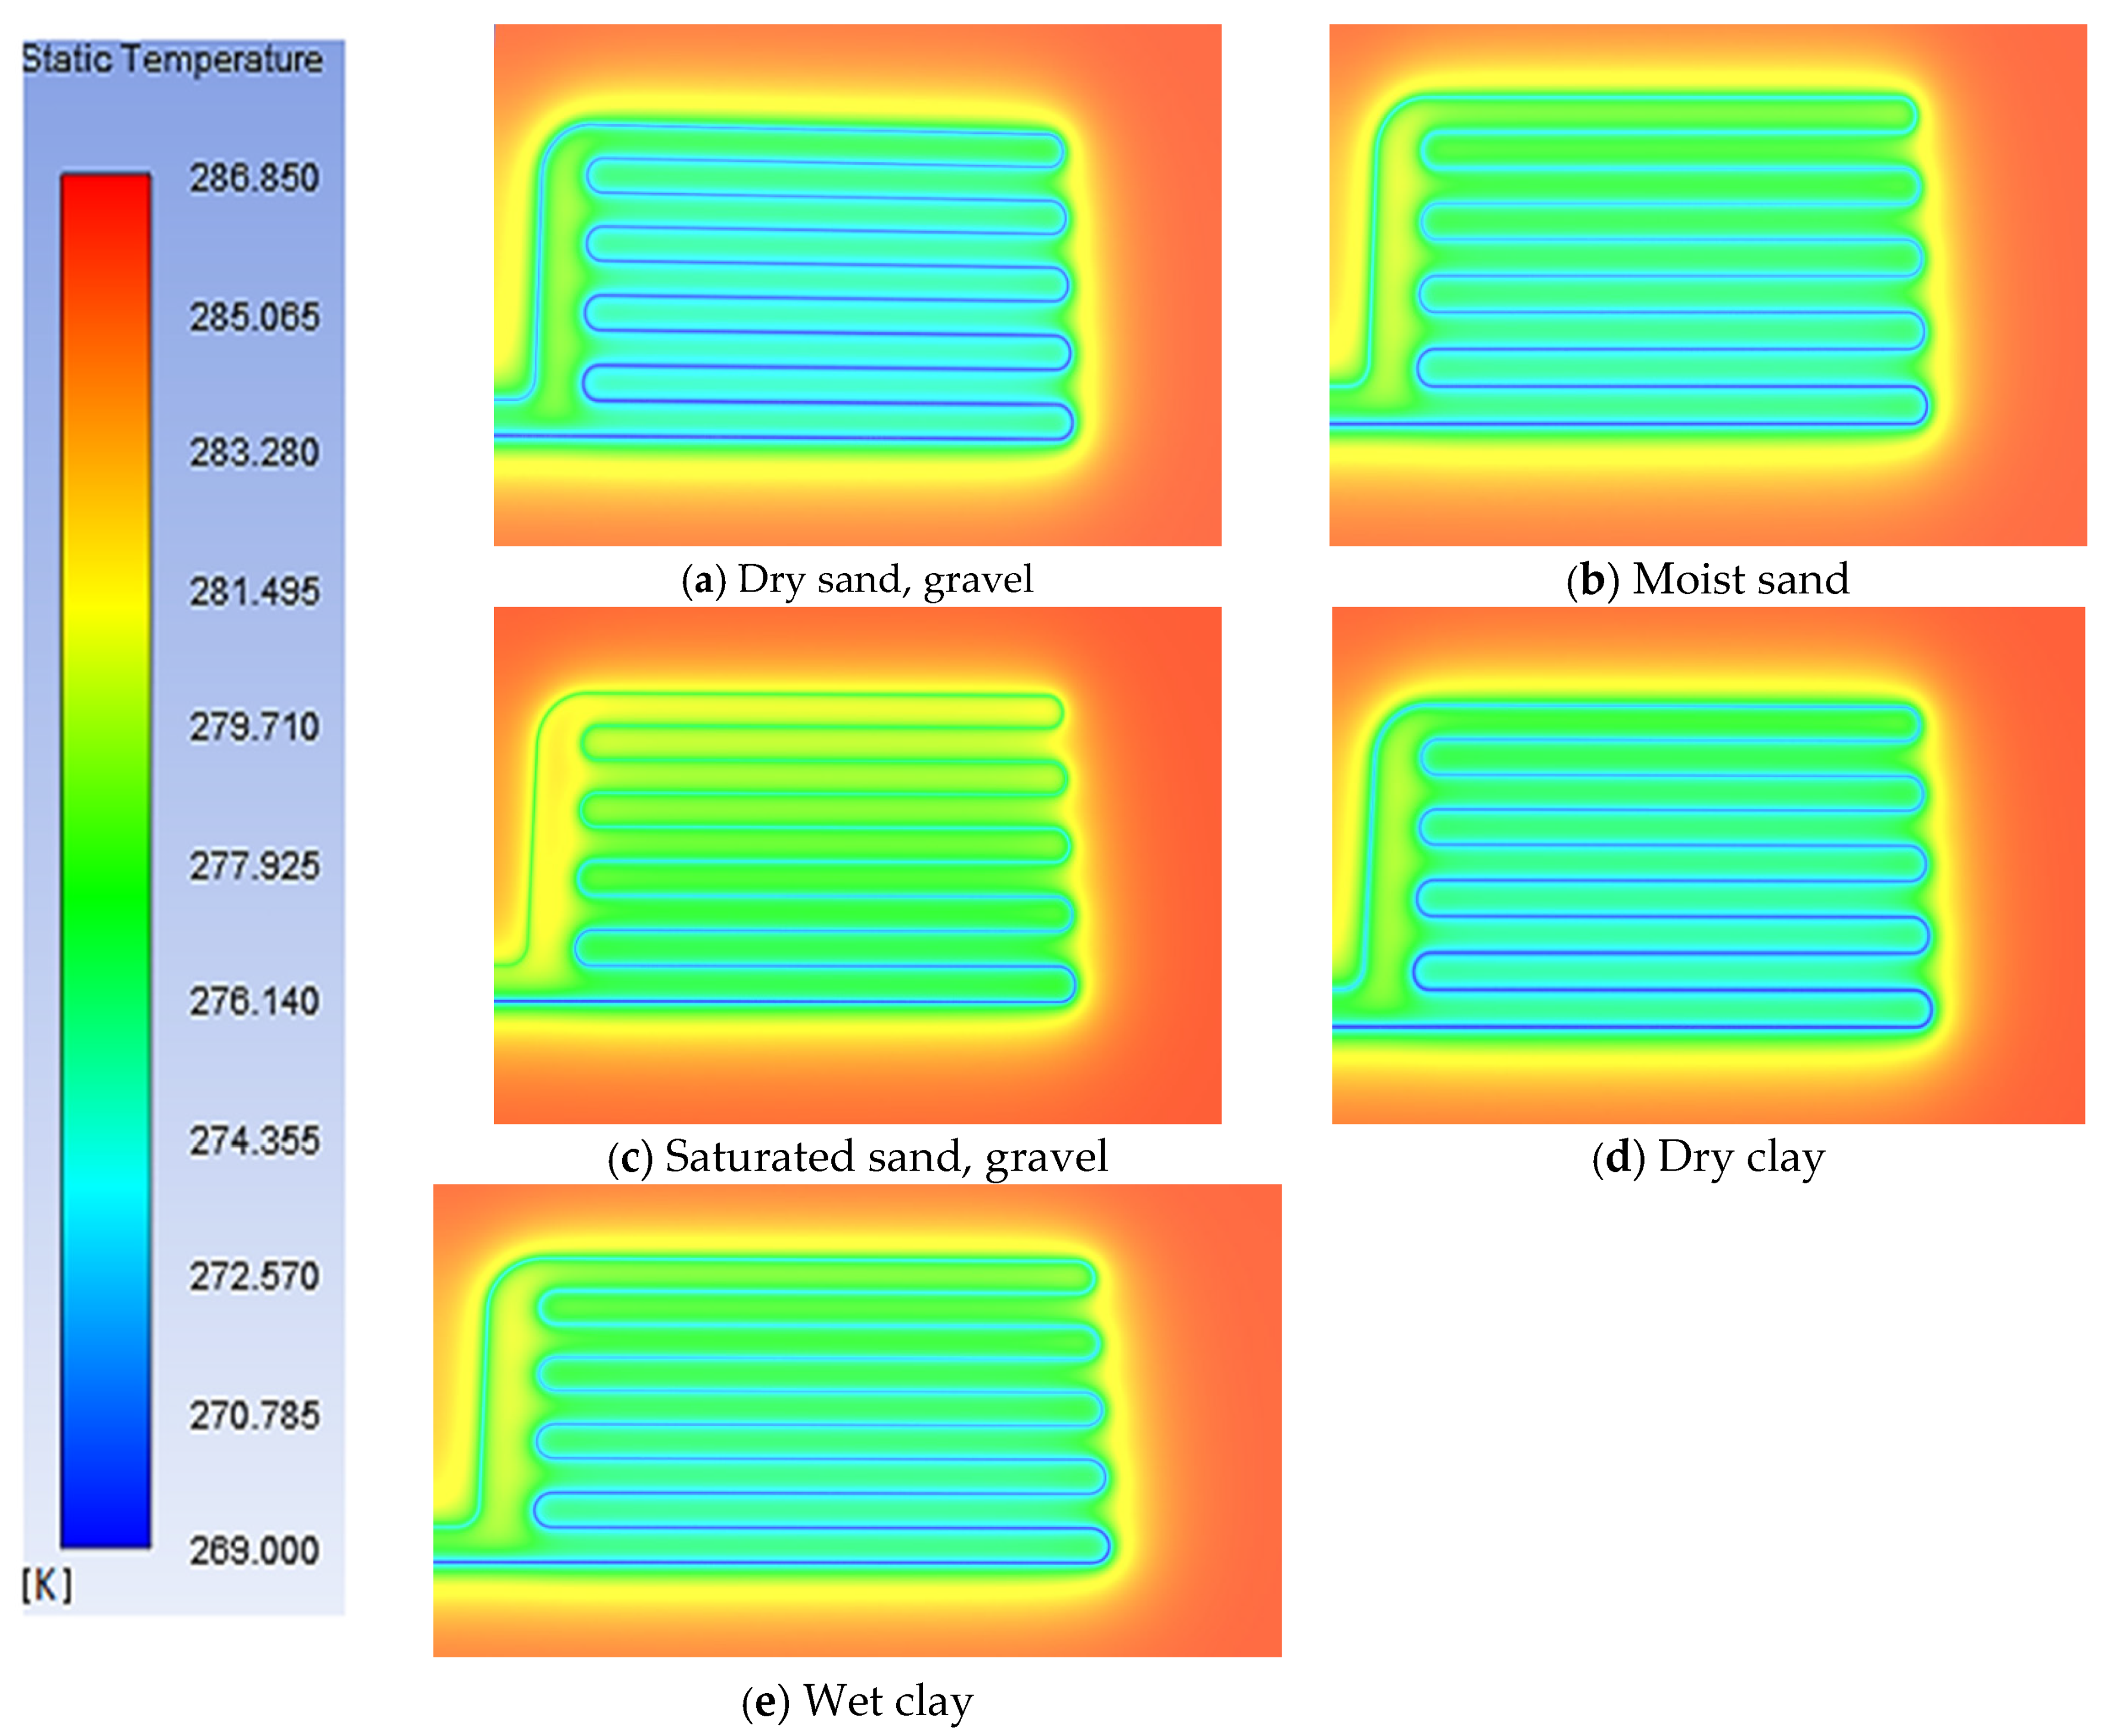
Figure 4 shows the temperature distribution in different soil types during collector operation in the autumn. The differences between dry sand, gravel and clay can be observed very well, the difference in heat consumption between moist sand and wet clay is less pronounced. The reason for these differences may be the higher coefficient of thermal conductivity and the mass heat capacity of the clay. It can also be observed from the figures that in dry soils, there is more cooling near the pipeline, while in soils with the presence of water, this phenomenon is almost non-existent. The heat capacity of the water and its conductivity cause the heat extraction to take place more smoothly without the formation of significantly cooled places around the pipe; heat transfer is continuous at this location.
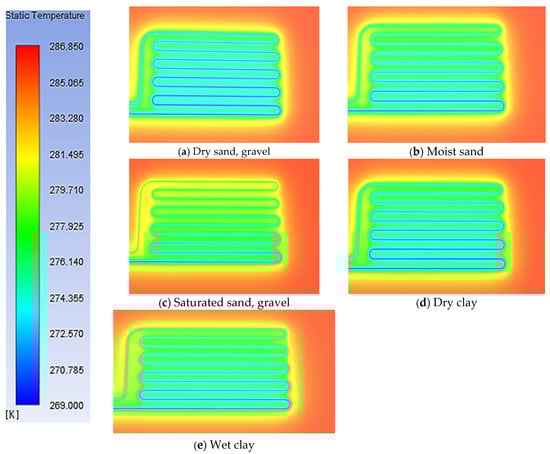
Figure 4.
Horizontal section of the model of case no. 1—distribution of autumn temperatures (269–286.85 K) in different types of soils.
3.2. Effect of the Medium Temperature at the Inlet to the Collector
At the inlet temperature of −4 °C, the total output of the ground collector in dry sand and gravel was 606–1571 W; in moist sand, it was 1071–2778 W; in saturated sand and gravel, it was 1716–4466 W; in dry clay, it was 819–2128 W; and in wet clay, it was 1125–2929 W. If the inlet temperature was changed to −2 °C, the total output of collector changes in dry sand and gravel to 403–1368 W; in moist sand, it was 718–2426 W; in saturated sand and gravel, it was 1150–3897 W; in dry clay, it was 548–1859 W; and in wet clay, it was 752–2557 W. If inlet temperature was changed to 0 °C, total output of collector changes in dry sand and gravel to 218–1286 W; in moist sand, it was 388–2097 W; in saturated sand and gravel, it was 621–3374 W; in dry clay, it was 296–1602 W; and in wet clay, it was 408–2209 W.
3.2.1. Case 2—Inlet Temperature 0 °C
At the inlet temperature of 0 °C, the total output of the ground collector decreased by 29.7–30.2% in the spring; in the autumn, it was by 24%; and in the winter, the output decreased by almost 64% against an inlet temperature of −4 °C.
3.2.2. Case 3—Inlet Temperature −2 °C
If the temperature at the inlet to the collector was −2 °C, the decrease in output against to inlet temperature −4 °C was smaller than in the previous case: at the level of 15% in the spring, almost 13% in autumn and 33–33.5% in winter.
3.3. Effect of Pipe Material
HDPE was used as basic pipe material for this research study. The total output of the ground collector with HDPE pipe in dry sand and gravel was 606–1571 W; in moist sand, it was 1071–2778 W; in saturated sand and gravel, it was 1716–4466 W; in dry clay, it was 819–2128 W; and in wet clay, it was 1125–2929 W. If pipe material was changed to copper, the total output of the ground collector in dry sand and gravel changed to 567–1605 W; in moist sand, it was 1110–2890 W; in saturated sand and gravel, it was 1823–4743 W; in dry clay, it was 843–2192 W; and in wet clay, it was 1173–3050 W. By using copper, heat extraction by the collector increased in the spring months by 2.2–3% in dry and 3.8–6.2% in wet soils; in autumn, by 2.1–2.9% and 4–6.1%; and in winter in wet soils, the output increased by 3, 6–6.2%. In dry clay, the collector output increased by 2.96% in this period, but in dry sand, the output decreased by 6.4%. Copper in our research has improved collector performance and heat extractions but only minimally.
3.4. Effect of Mediums’ Flow Velocity
The total output of the ground collector with mediums’ flow velocity 0.1 m·s−1 in dry sand and gravel was 606–1571 W; in moist sand, it was 1071–2778 W; in saturated sand and gravel, it was 1716–4466 W; in dry clay, it was 819–2128 W; and in wet clay, it was 1125–2929 W. If velocity was decreased to 0.05 m·s−1, the total output of the ground collector in dry sand and gravel changed to 543–1416 W; in moist sand, it was 882–2298 W; in saturated sand and gravel, it was 1239–3220 W; in dry clay, it was 708–1842 W; and in wet clay, it was 921–2393 W. Increased velocity of the medium to 0.15 m·s−1 caused the total output of the ground collector in dry sand and gravel to change to 625–1622 W; in moist sand, it was 1142–2967 W; in saturated sand and gravel, it was 1934–5033 W; in dry clay, it was 858–2233 W; and in wet clay, it was 1207–3142 W. If the velocity of the medium was 0.2 m·s−1, the total output of the ground collector in dry sand and gravel was 630–1648 W; in moist sand, it was 1173–3064 W; in saturated sand and gravel, it was 2056–5334 W; in dry clay, it was 872–2279 W; and in wet clay, it was 1251–3249 W. The last velocity that was used in this research was 0.3 m·s−1, and the total output of the ground collector in dry sand and gravel was 640–1687 W; in moist sand, it was 1222–3171 W; in saturated sand and gravel, it was 2196–5702 W; in dry clay, it was 902–2342 W; and in wet clay, it was 1294–3375 W.
3.4.1. Case 5—Flow Velocity 0.05 m·s−1
At this velocity, heat extraction decreased 9.8–13.5% in dry sand and clay and 17.5–27.95% in soils with water during all three simulated seasons.
3.4.2. Case 6—Flow Velocity 0.15 m·s−1
The velocity of the medium in the collector at this speed increased heat extraction during spring and winter by 3.5–4.6% in soils with 0% water content and by 6.4–12.6% in wet soils. In the autumn, this sampling in dry soils was at the level of spring and winter and by 17.2–27.9% higher in soils with water.
3.4.3. Case 7—Flow Velocity 0.2 m·s−1
Even at this velocity, the collector output increases, while in dry soils, it was 4.9–7.22% during spring and autumn and 4–6.5% in the winter. In soils with the presence of water, there was an increase of 9.9–19.4% in the spring and autumn months and 9.5–19.7% in the winter.
3.4.4. Case 8—Flow Velocity 0.3 m·s−1
As in previous cases, the increase in the velocity of the medium increases heat extraction through the collector at the level of 7.5–10% in dry sand and clay in spring and autumn; during the winter, it is at the level of 5.6–10%. In wet sand, wet clay and saturated gravel, performance is improved by 14−28% during all observed periods.
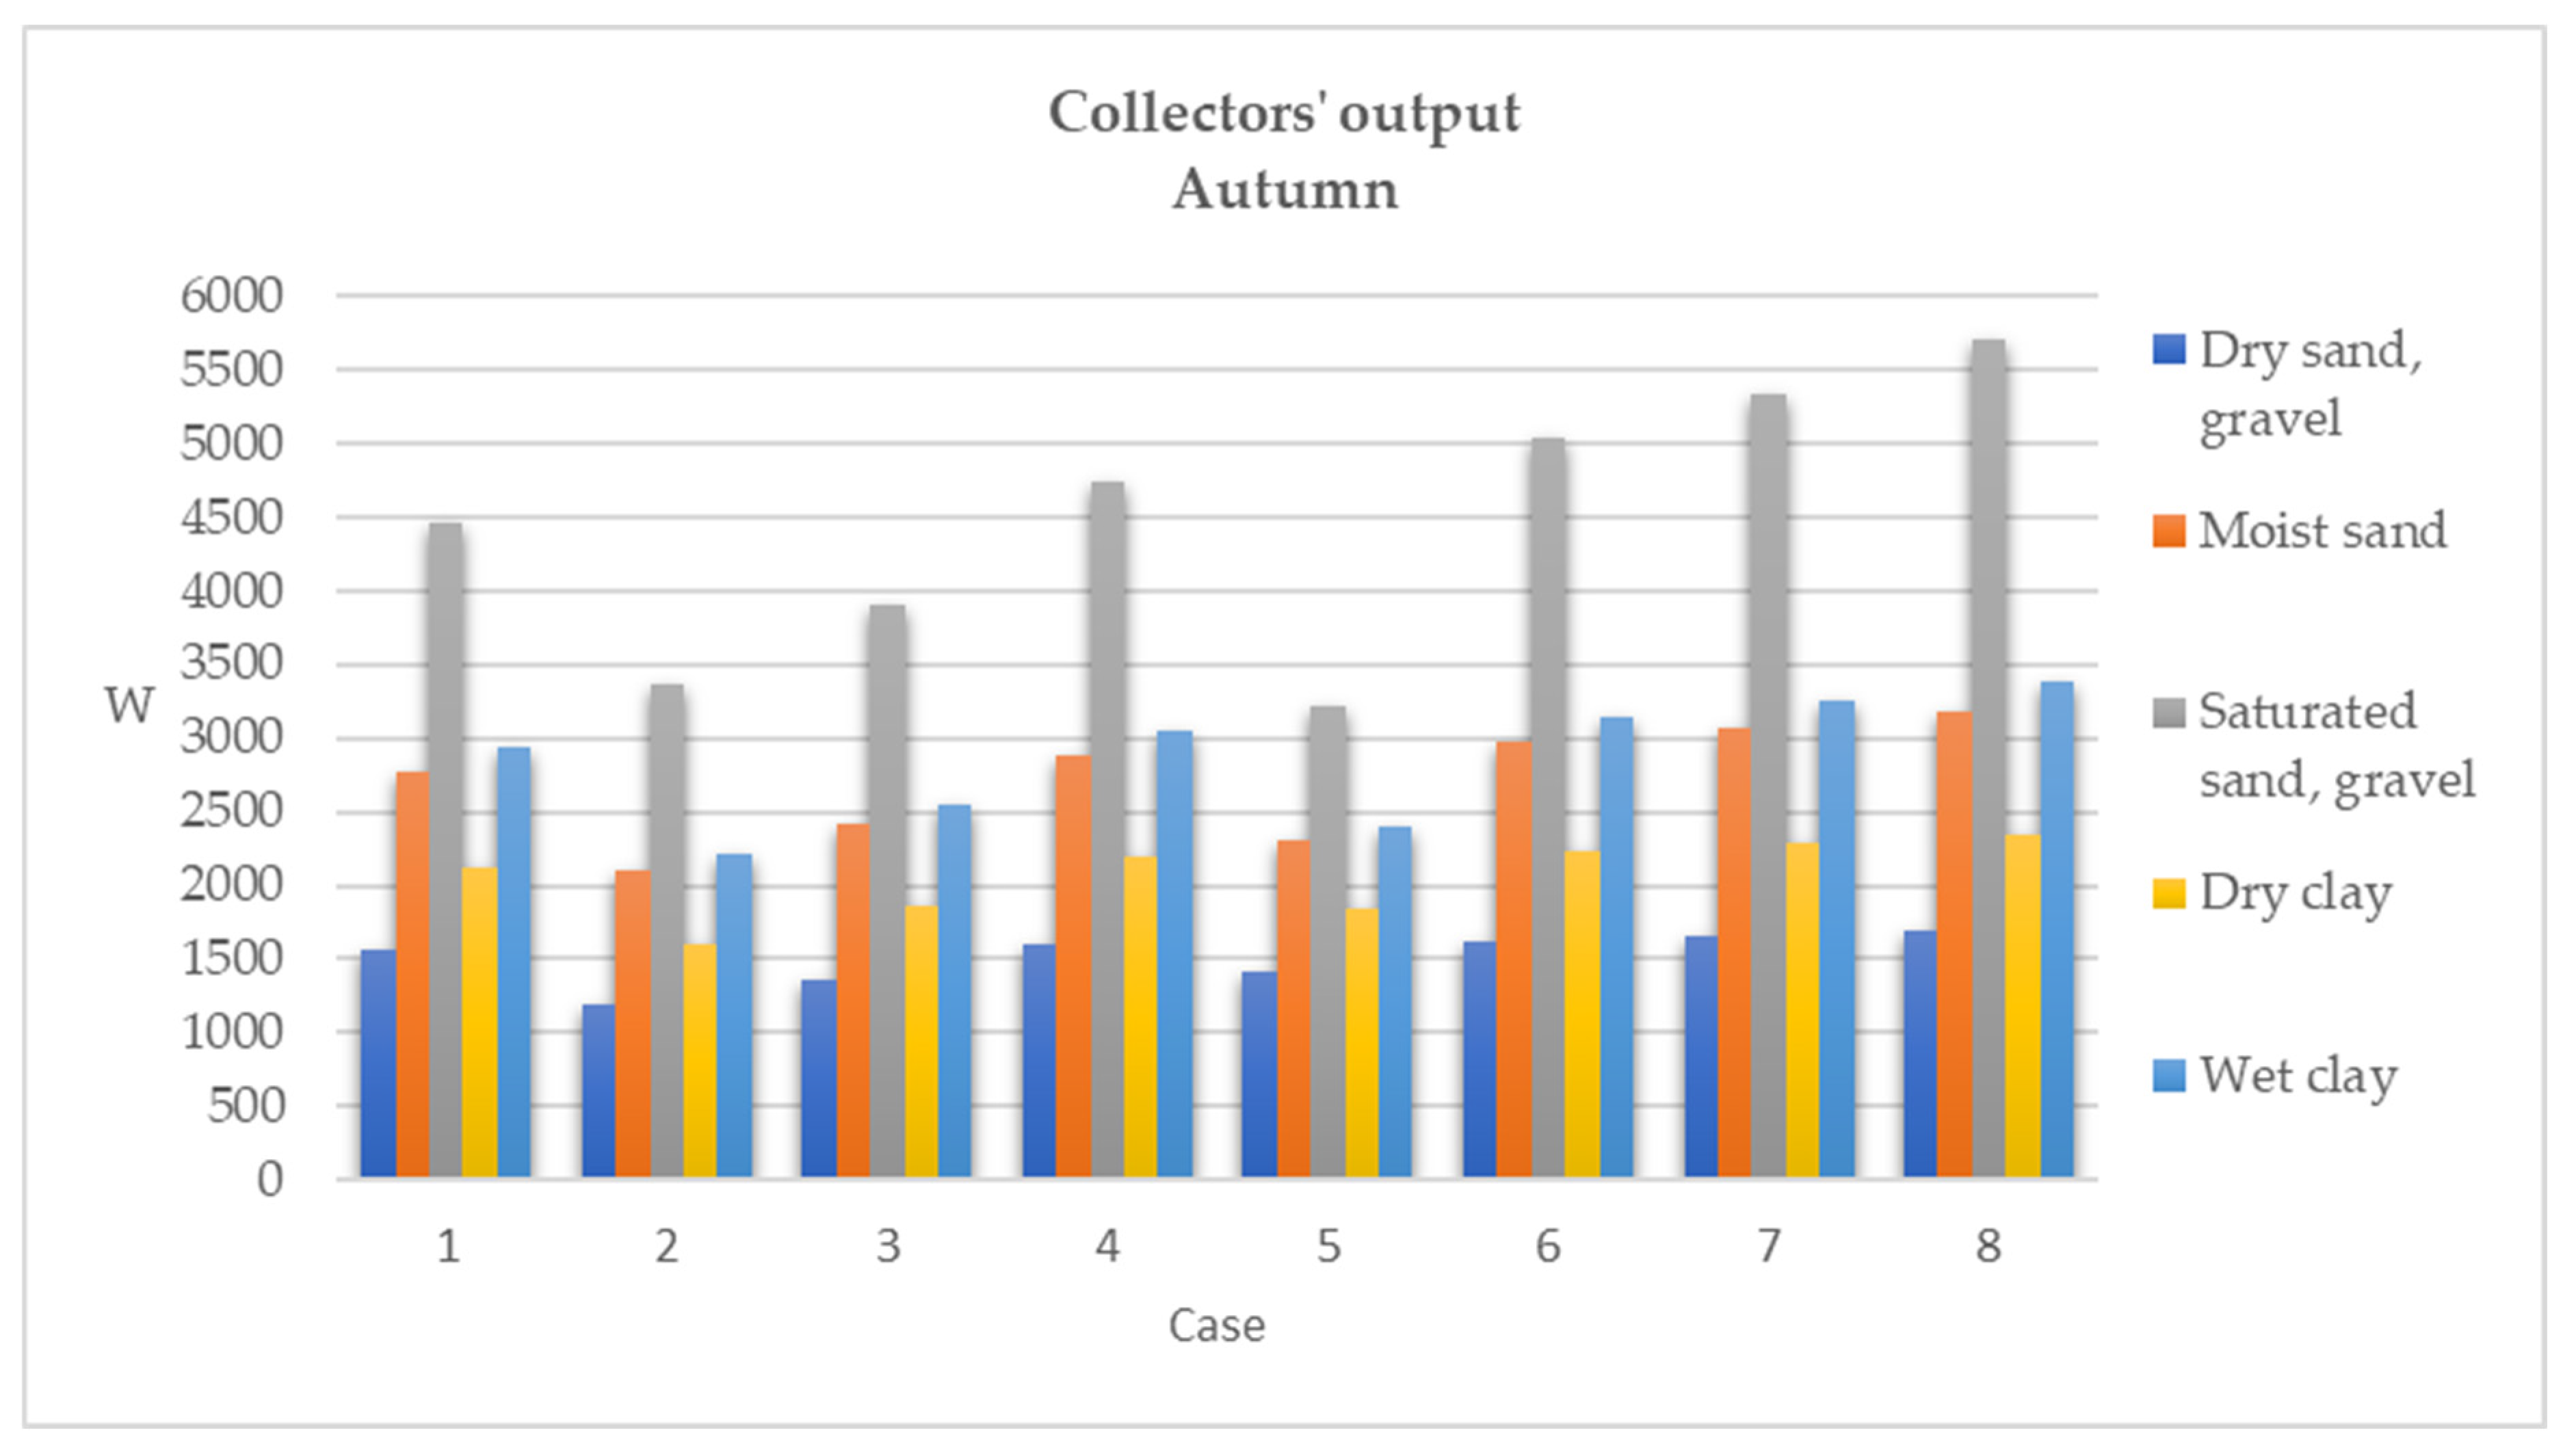
Figure 5 summarises and shows the total collector output in cases 1–8, described in detail above, for all observed soil types in autumn.

Figure 5.
Total collector output with changing parameters in autumn; case 1–8.
3.5. Effect of Collectors’ Geometry and Placement
3.5.1. Case 9—Snail
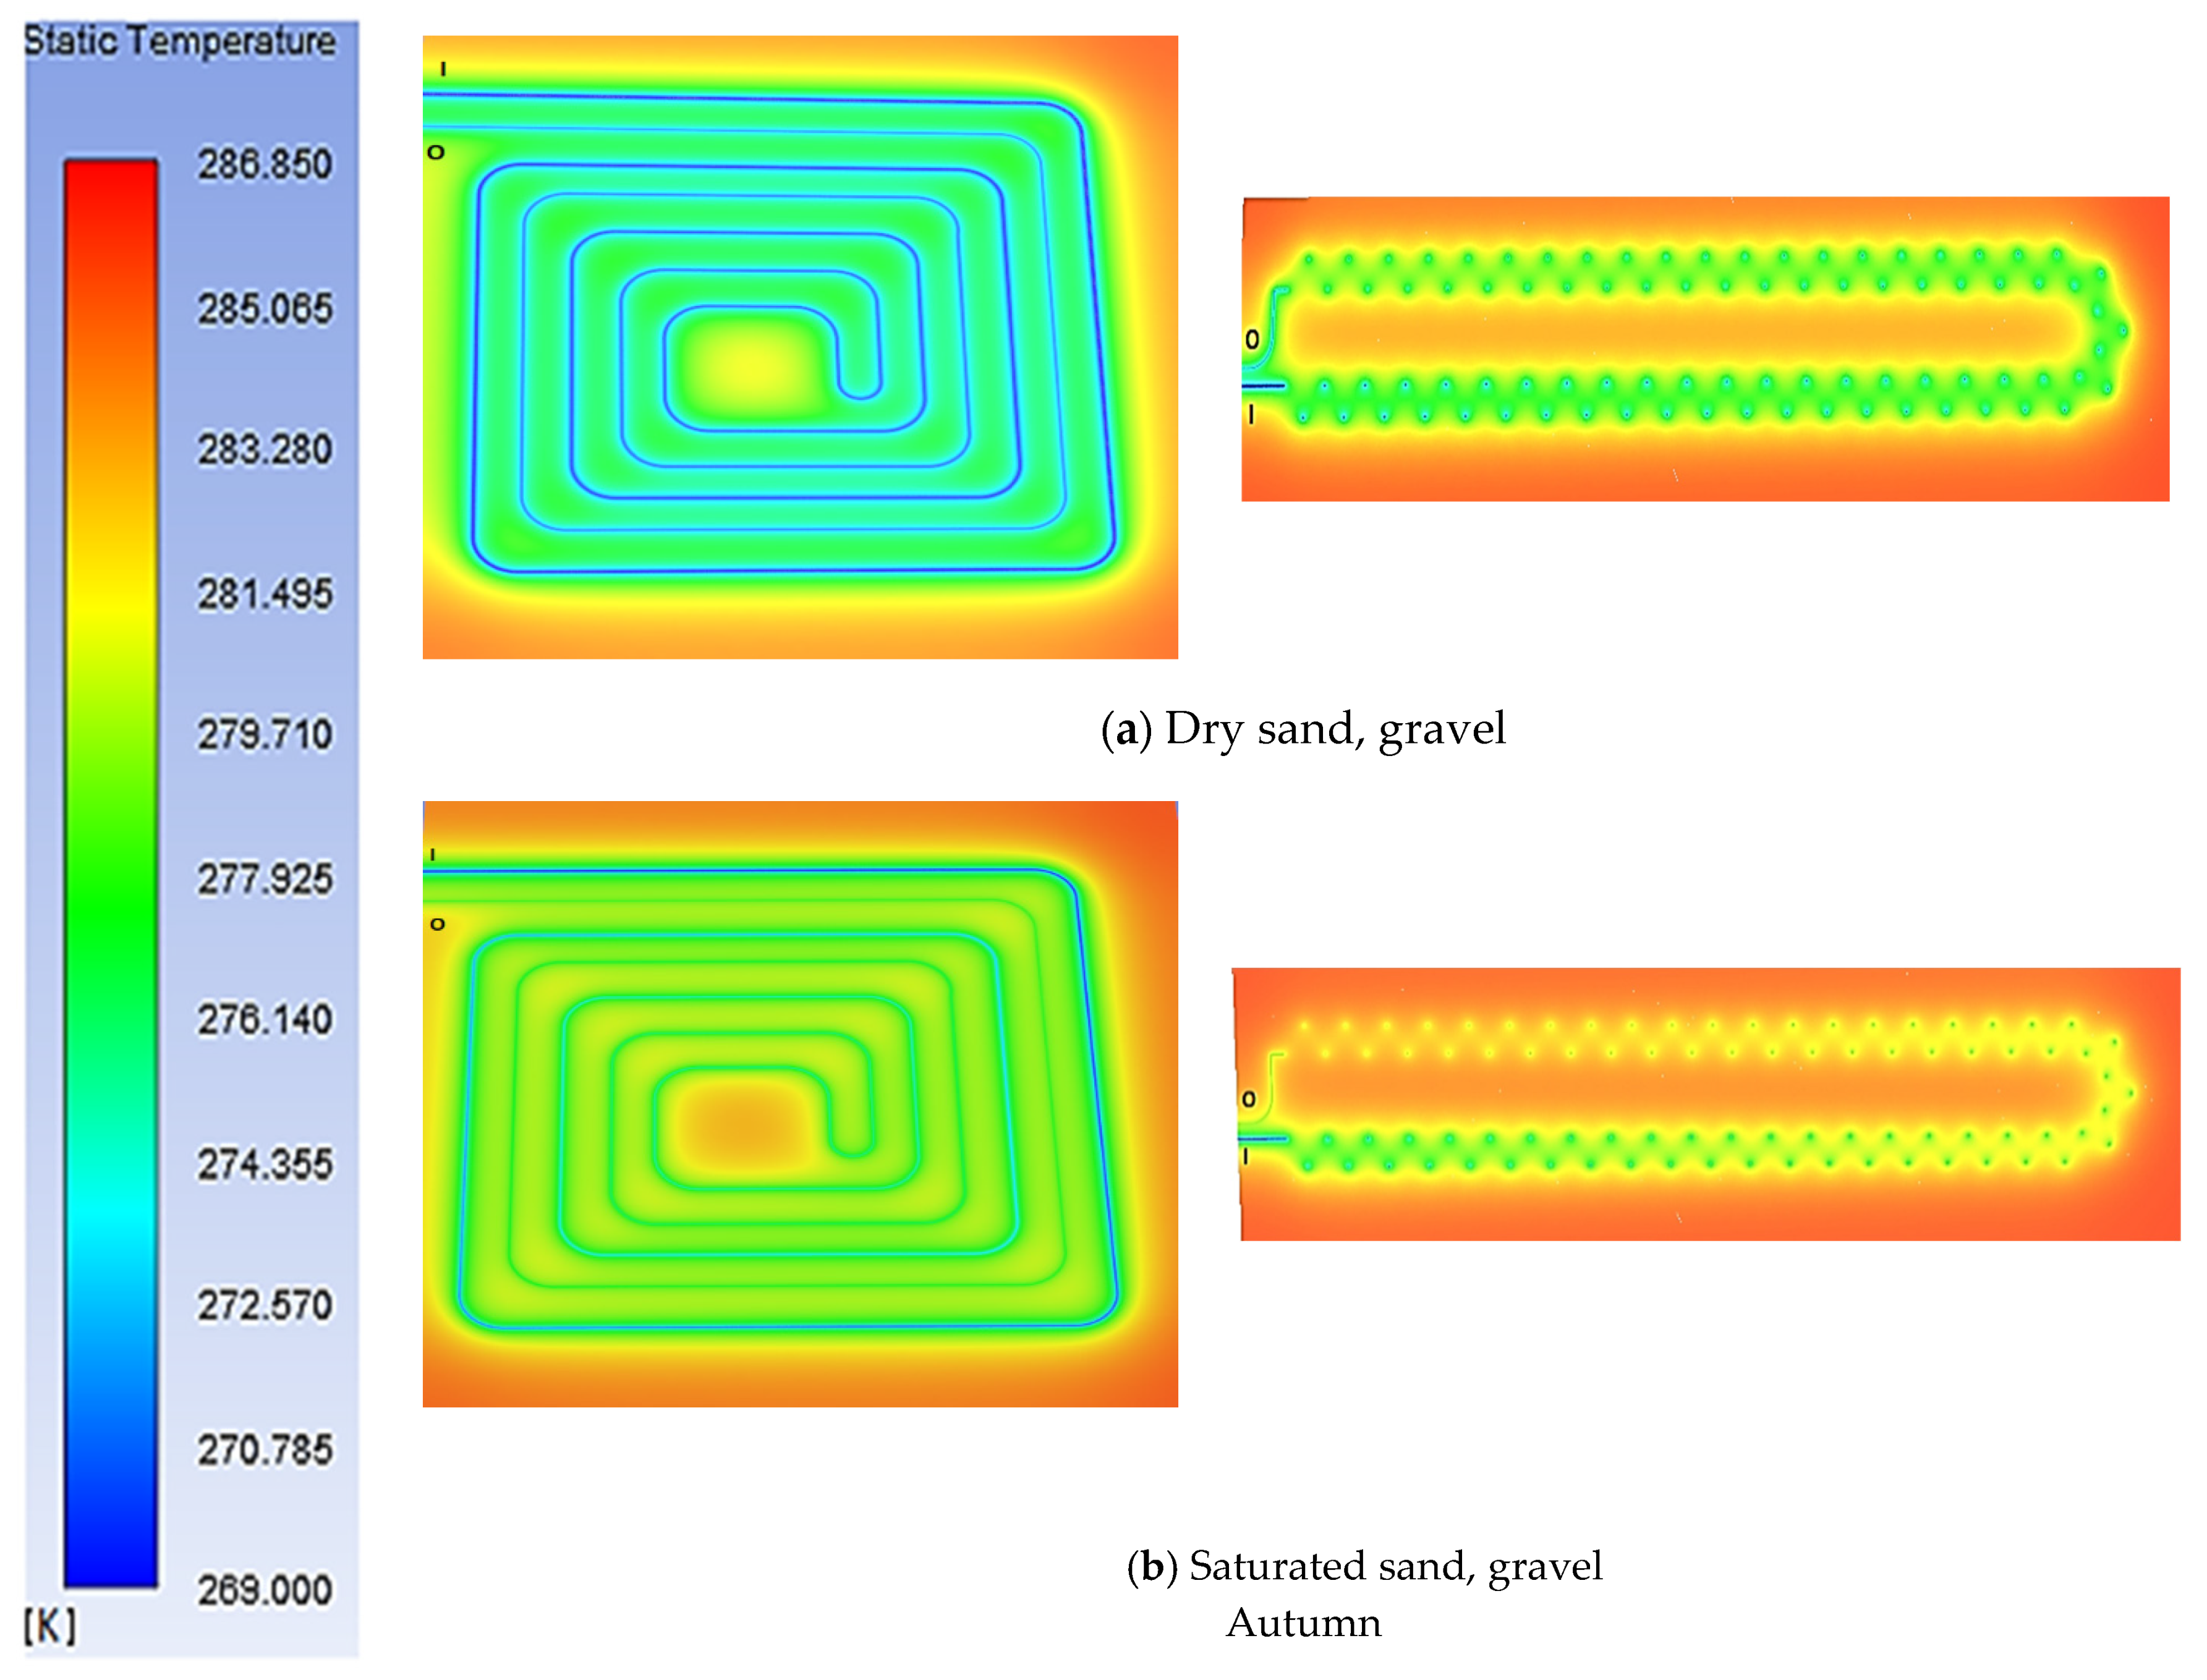
When calculating the output per 1 m of pipe length and 1 m2 of soil, we concluded that heat extraction per meter of pipe by this system was lower in dry soils by 0.2–1.3% in spring, 0.6–1.2% in autumn and 0.7–1.5% in winter. In wet soils, the decrease in output was at the level of 2–5.3% during the entire period. Heat extraction per 1 m2 of soil was 9.2–10.4% lower than the meander in dry sand or clay and by 10.9–13.8% in soils with the presence of water during all three seasons. It follows that this geometric and spatial arrangement almost has the same results as the meander arrangement, i.e., the shape of the collector itself, in this case, had no significant effect on the performance of the system. In Figure 6, we can observe a comparison of snail-shaped collectors and 3D spiral collectors in dry and saturated sand and gravel: temperature distribution and the effect of the collector on the soil environment in which it is buried. The first element we can observe from the pictures is, again, the influence of the soil type on the heating rate of the medium and on the outlet temperature of the medium. The collector in dry sand and gravel extracts significantly less heat, both in terms of the shape of a 3D spiral and in the shape of a snail, but this extraction has an effect at a greater distance from the pipe than in soil with the presence of water.

Figure 6.
Horizontal section of the model with temperature distribution in autumn (269–286.85 K)—snail (left)—and 3D spiral (right); I—inlet; O—outlet.
We can also observe that while in wet soil during the autumn, two pipes of the collector minimally affected each other; in dry soil, this phenomenon was more pronounced (yellow-green colour connecting both sides of the collector).
The lower performance of case no. 9, i.e., a geometric arrangement in the shape of a snail, can be caused by the fact that the pipes with the working medium of lower and higher temperature are arranged parallel to each other at 0.8 m. From the picture, we can observe that the individual rows of pipes are affected. Therefore, the outlet temperatures at this collector would be lower than in the first case with a meander at the same pipe length and collector area.
3.5.2. Case 10—3D Horizontal Spiral
Compared to case 1, this model is 1.2 m shorter and occupies 26 m2 less area. Despite these facts, its performance exceeds that of previous models. For example, the total output of this collector is 22.2–29.3% higher in dry soils and 13.9–24.6% higher in wet soils than the meander output. When converted to 1 m of pipe length, we achieve the results of increasing the output by 14.8–30.4%, and heat extraction has increased even by 50–70.3% per one m2. Larger differences in performance may also be present since the spacing between rows of pipes is 0.8 m for a meander and a snail, and it is 3 m between rows for a spiral and the distance between two equally spaced points on each loop is 1.6 m. The influence between the collector rows and between the individual loops is, therefore, less pronounced than with the meander, which can also be observed in the figures above (Figure 6). In addition, the flow at a speed of 0.1 m·s−1 provides the working medium enough time to extract heat from the environment. It should not be forgotten that the lowest points of the spiral are located at a depth of 2 m, where the soil temperature is constant and even slightly higher than in 1.5 m, which can also affect the performance of the collector. Interestingly, during the winter and in dry sand and gravel, there is significant cooling around the pipe in the case of the collector with the spiral shape. At the same time, more influence between the sides of the collector while in the saturated soil type can be observed, and the soil cooling in the immediate proximity of the pipe is smaller but acts at a greater distance from the pipeline.
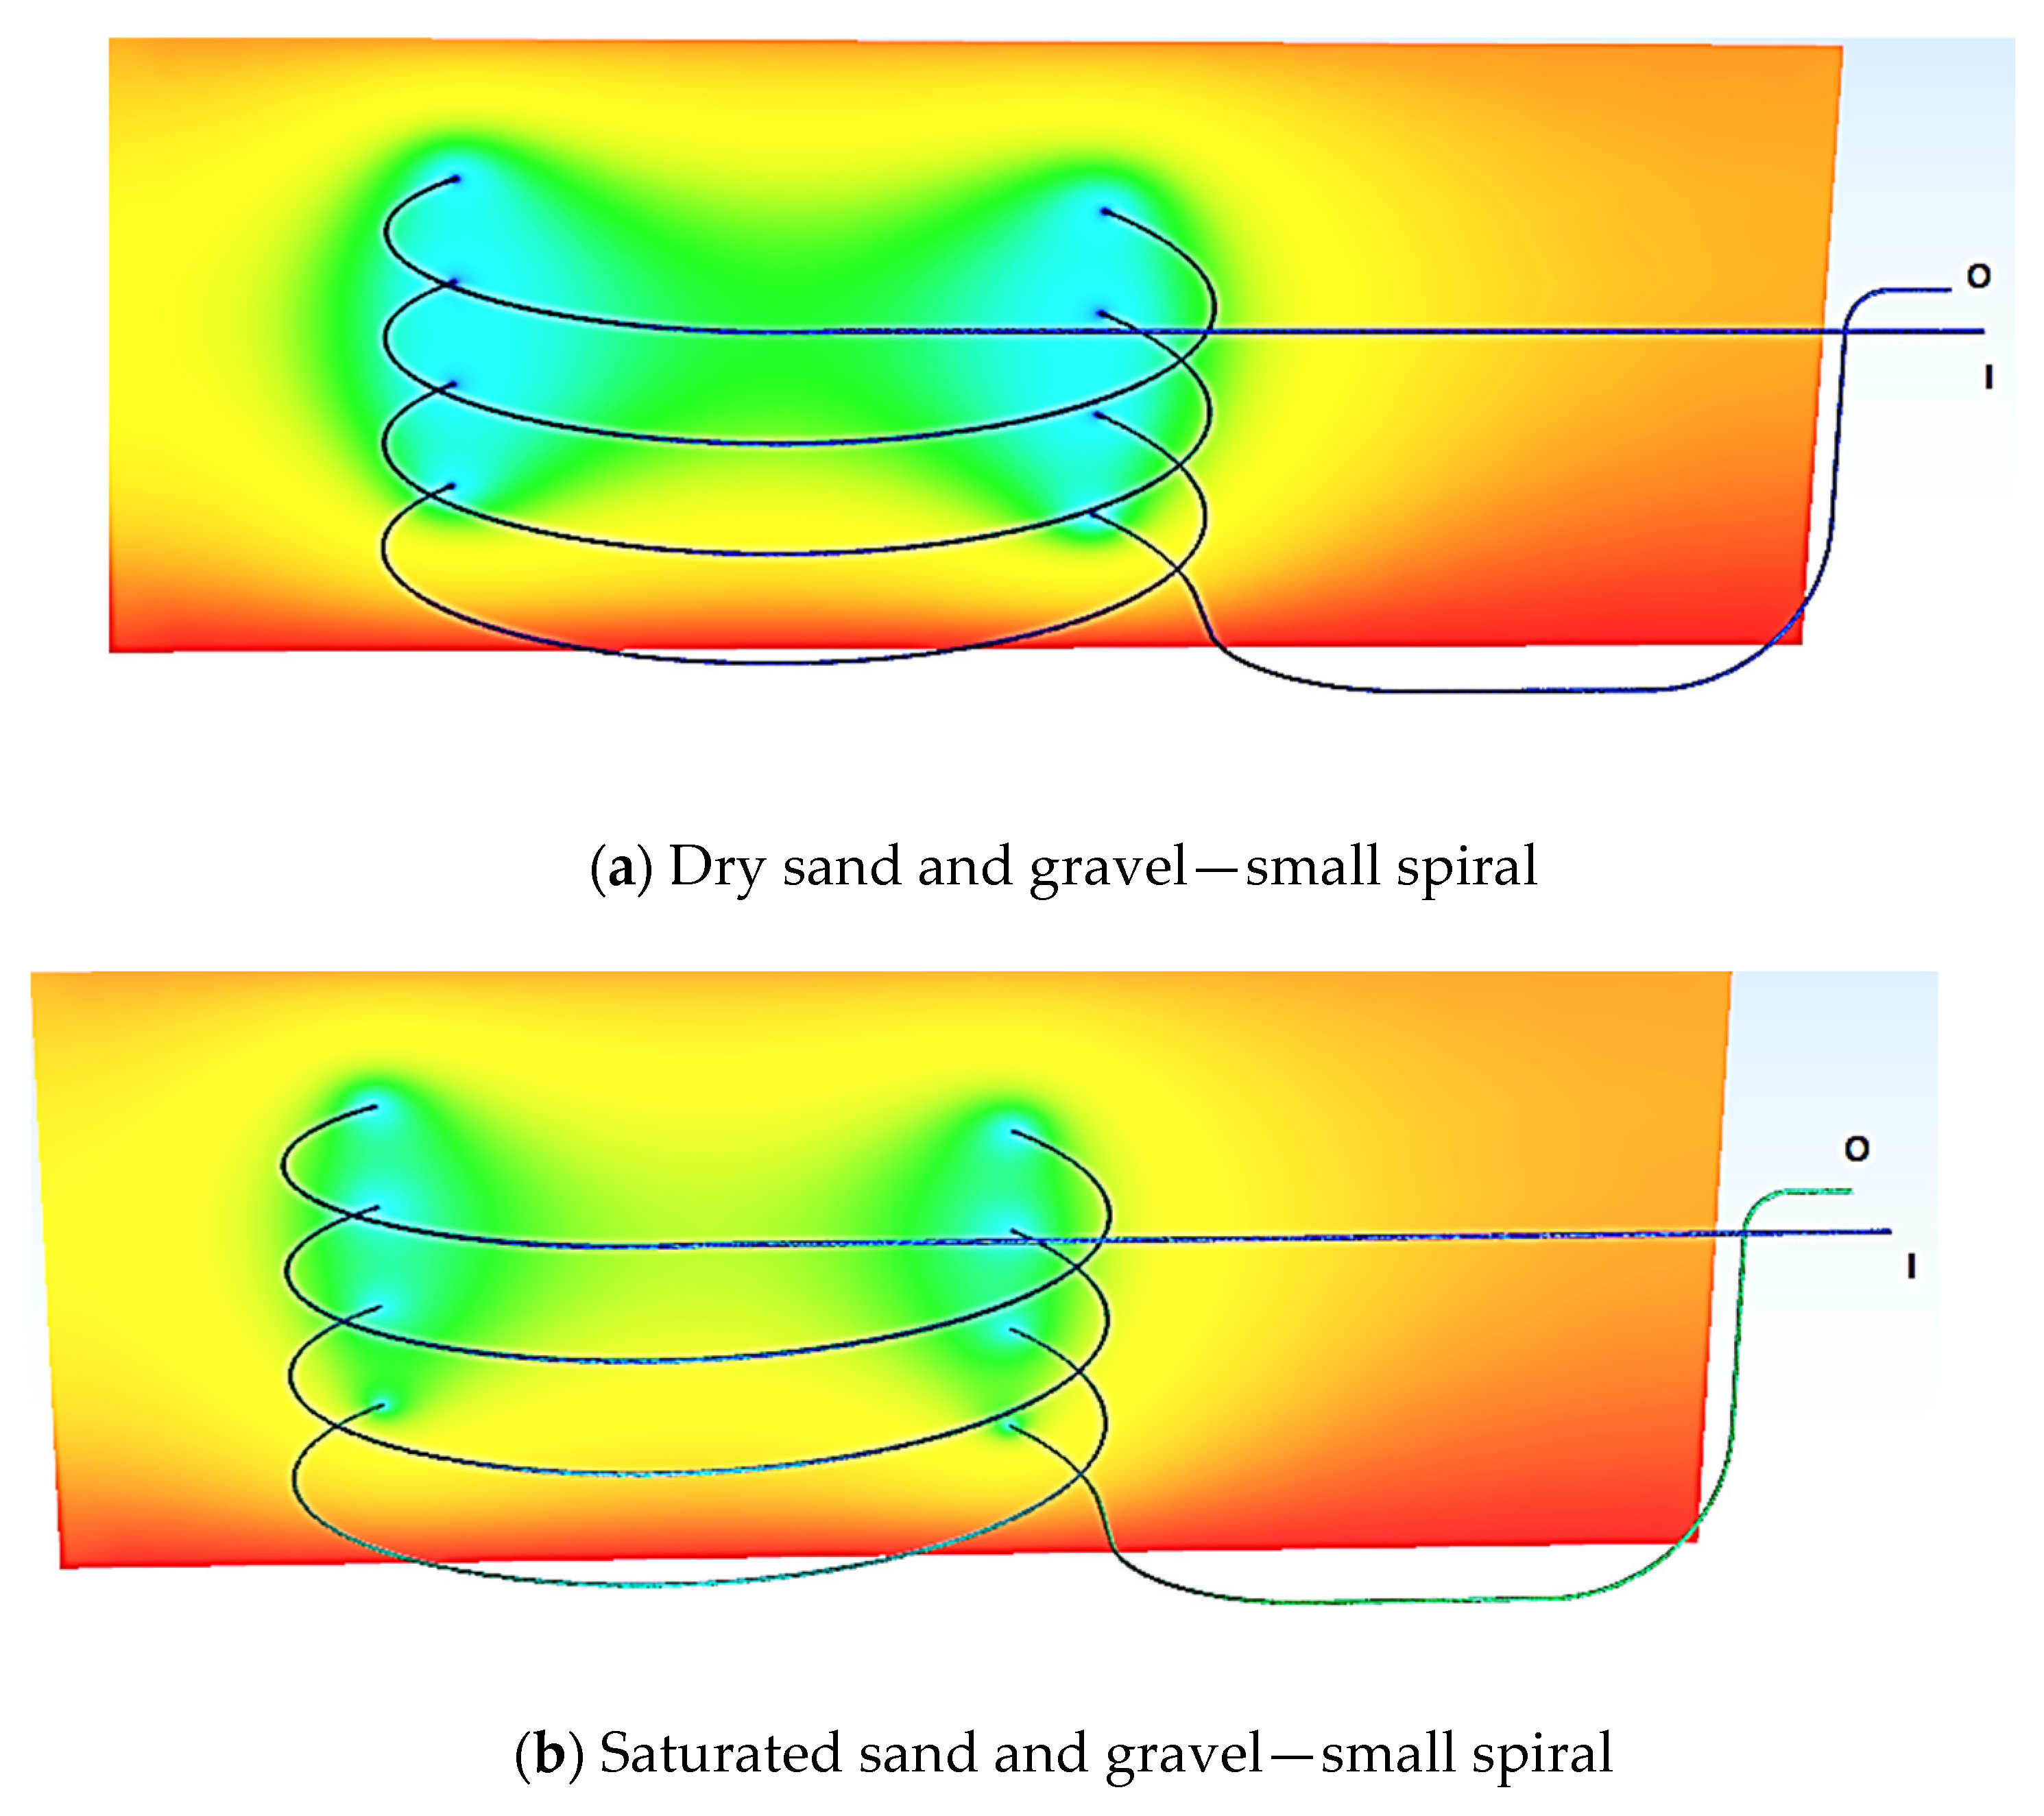
3.5.3. Case 11—Small Spiral 3.75
Since the biggest disadvantage of surface collectors is the need for a large area, our designs try to minimize its area and also attempts to minimize the extent of earthworks required to installation the collector. Therefore, we propose a collector that has the shape of a spiral laid vertically, and our idea is that earthworks will be limited to creating a space large enough to lay the pipeline around the circumference of the spiral, eliminating soil treatment in the centre of the spiral. The problem with installing can be the depth, which should be 4 m in this particular case.
The results of this proposal were not satisfactory. Compared to the meander, the total output of the collector was lower by 35–41% in the spring, by 19.8–27.6% during autumn and by 35.5–44% during winter. The specific output of the collector per 1 m of pipe length, which was lower by 17.7–26.8% in the spring, by 19.8–27.6% during autumn and by 20.3–29% during winter, has greater decisive value for us. With a specific output per 1 m2 of soil, it was interesting that although for all other soil types the outputs were lower than the meander by 12–22.5%, it was higher by 66–75% with dry sand and gravel as outputs.
The length of the pipe is not only a problem in this case, but the spacing of 0.8 m between the pipe and the diameter of the spiral (6 m) is also a problem. Although the mutual thermal influence in the vertical direction is similar to that of the meander, the small diameter of the spiral renders the influence in the horizontal direction very significant and considerably degrades the performance of the system (Figure 7).
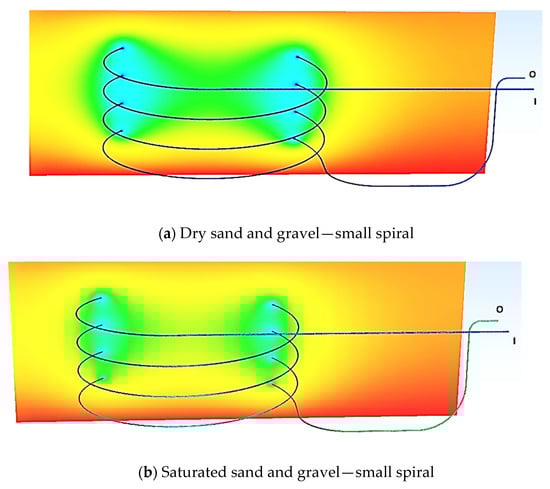
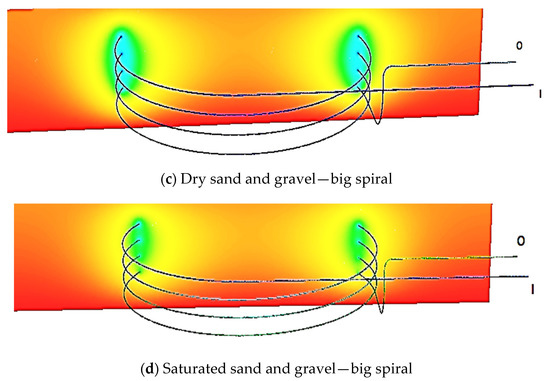
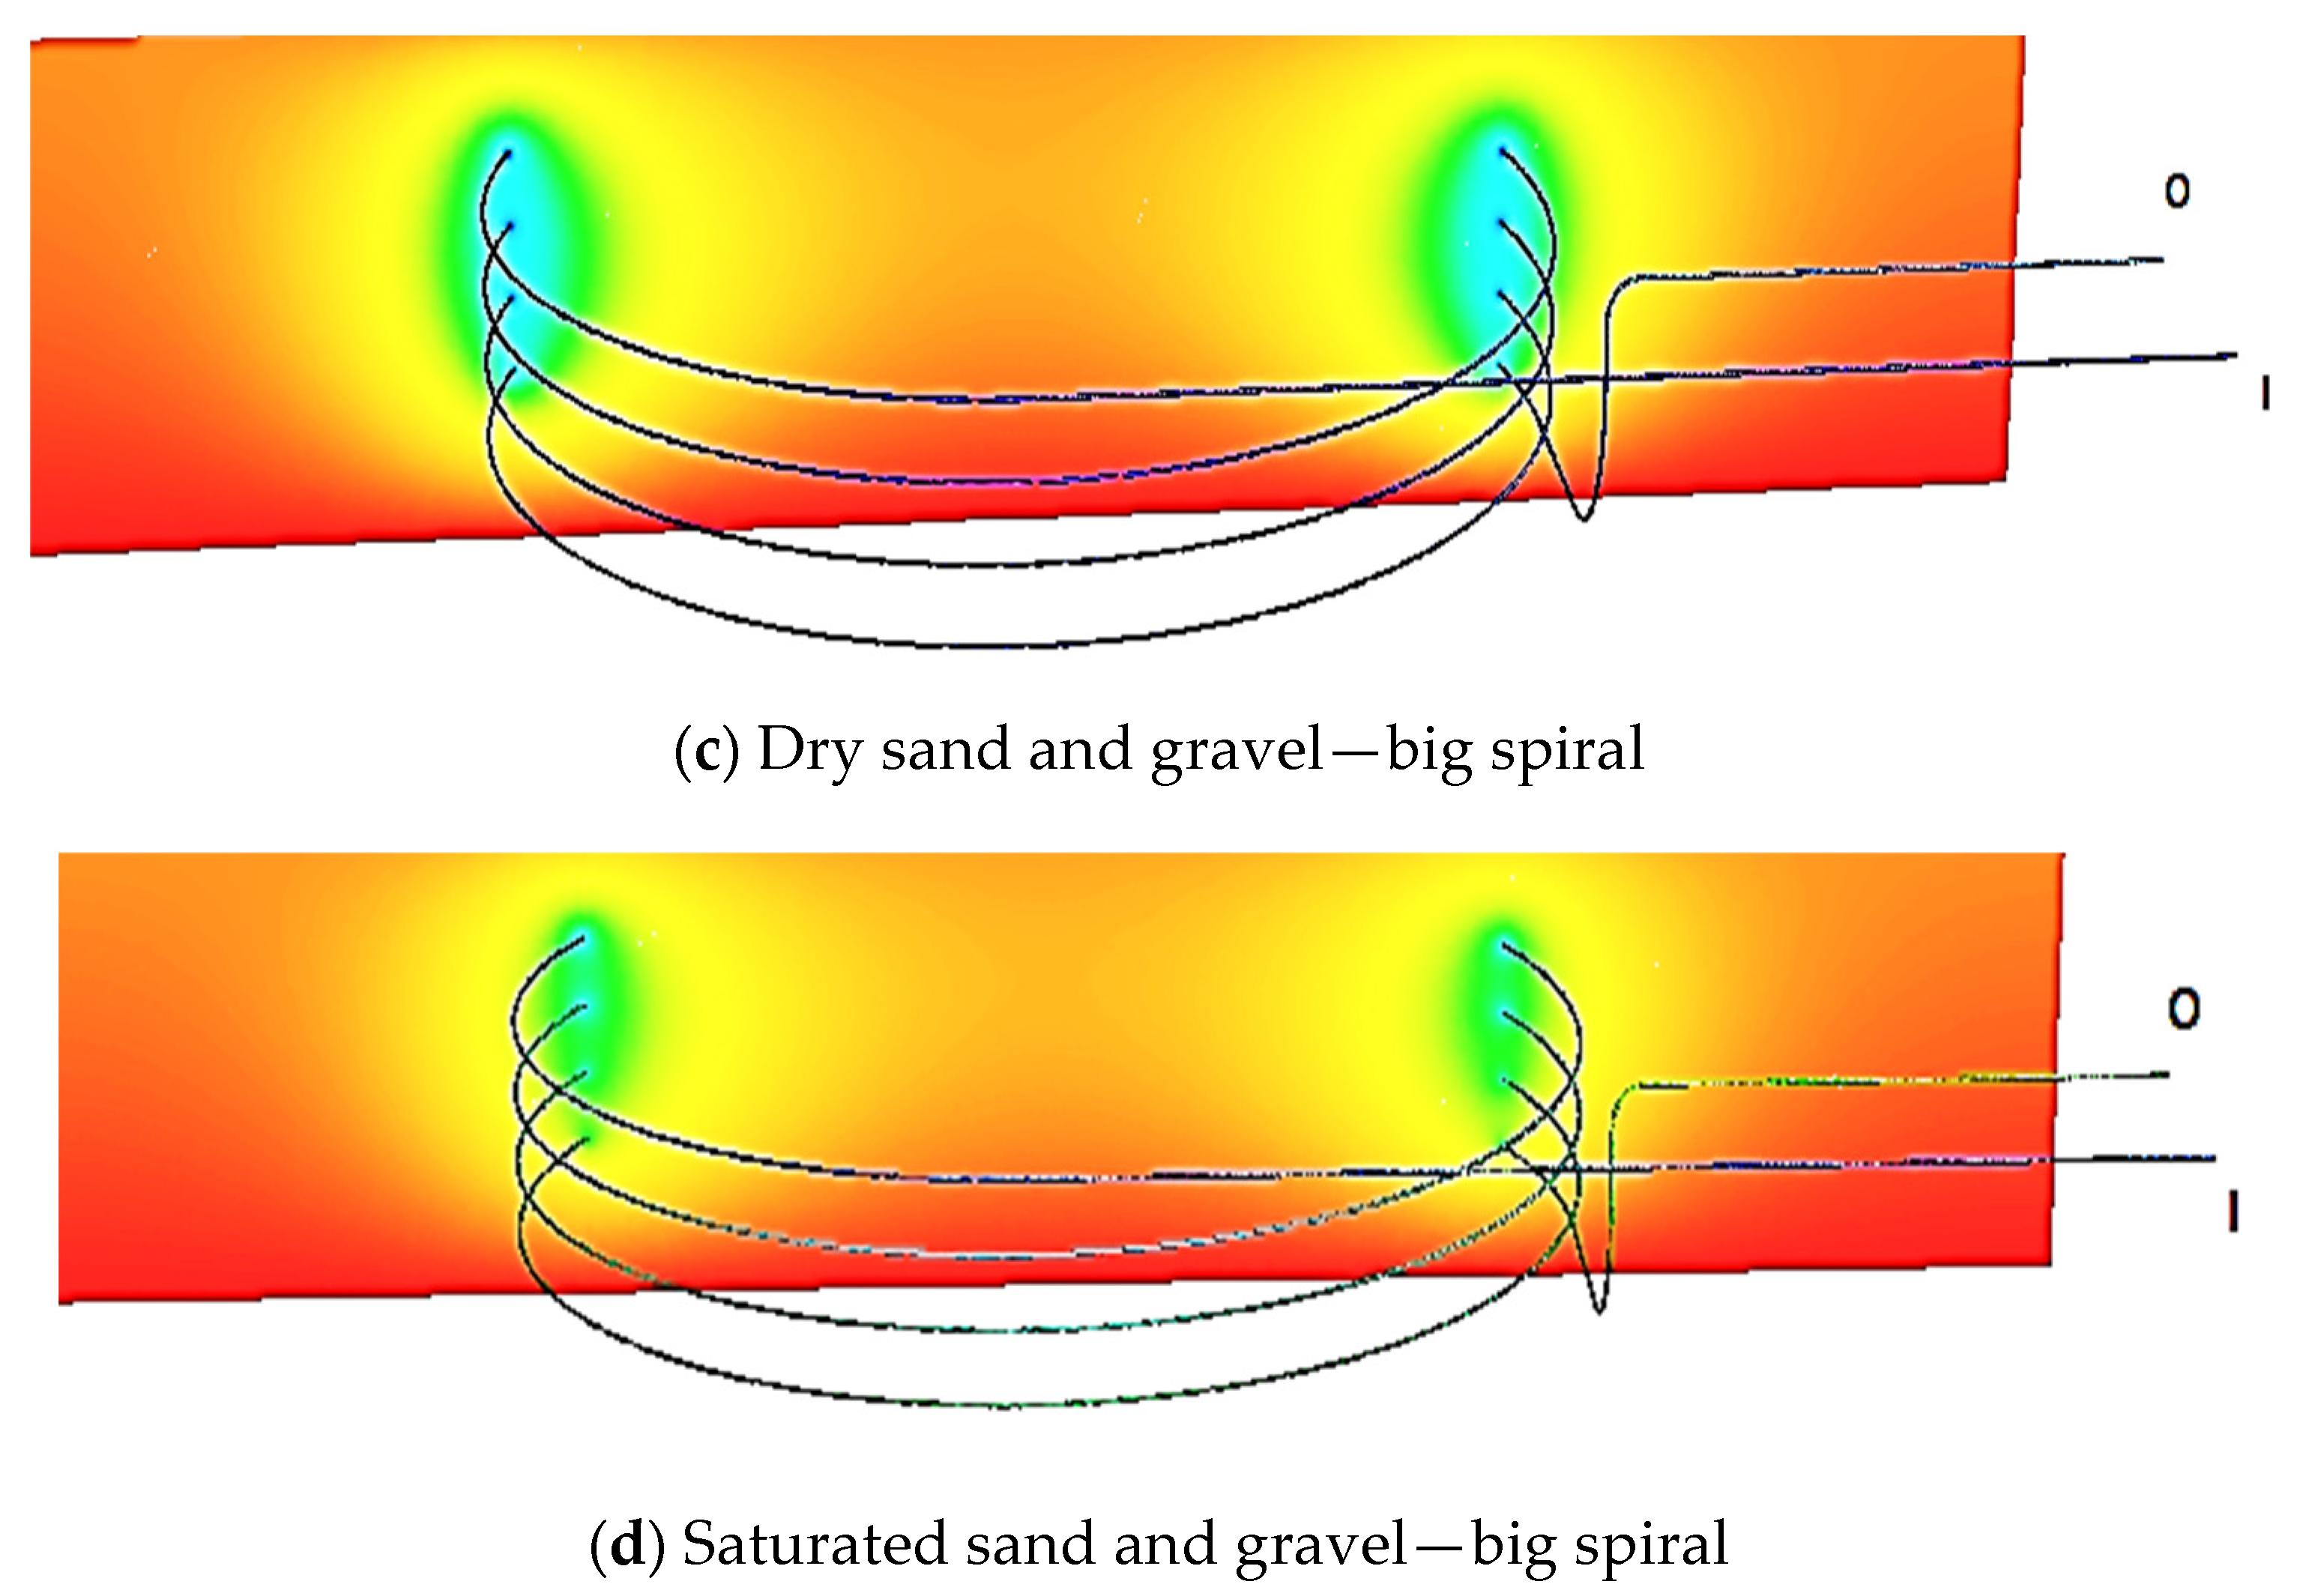
Figure 7.
Vertical sections of the models with temperature distribution in autumn; I—inlet; O—outlet.
3.5.4. Case 12—Small Deeper Spiral 2.75
In order to ensure the elimination of vertical influences, we decided to shorten the pipeline by one loop and increase the gaps between the pipelines from 0.8 m to 1.27 m. In saturated sand and gravel, it can be observed that the mutual interaction in the horizontal direction has also decreased; however, this does not apply to the dry type of the same soil. The cooling of the soil around the pipe is lesser in soil with the presence of water. The results of the calculations showed that this collector design has a total output of 35–44% lower than the meander during all three seasons. For 1 m of the pipeline, the specific output was at the level of −19% to −29% for all other soil types except dry sand and gravel for which it was at the level of +18% to +21.7% during spring, autumn and winter. The results of the specific output per 1 m2 of soil were similar, namely +66% to 71.4% for dry sand and gravel and −12% to −22% for other soils. It follows that if we want to use a spiral with a smaller diameter as a collector, we need a greater installation depth and greater distances between the pipes in the vertical direction.
3.5.5. Case 13—Medium Spiral 3.75
In this design, we increased the diameter of the spiral to 8 m but reduced the installation depth to 2 m; thus, the distance between the pipes in the vertical direction is 0.53 m. We have found that the overall performance of this proposal is 23–32.5% lower than with the meander. The specific collector output per 1 m of the pipeline is lower by 5–16.6%, and it was lower by 0.1–8% per 1 m2 of soil in all soil types except saturated sand and gravel, in which this output was higher by 3% during spring and autumn; during winter, it was lower by 1.6%.
These results are better than the results of the previous two proposals, but they still do not match conventional installation. In this case, several factors can again be responsible for the lower output, namely the length of the pipe, the distance between the pipes in the vertical direction and the diameter of the spiral. The length of this collector is 115.24 m, which is 19% shorter than the meander-shaped collector pipe. When converted to 1 m of the pipeline, however, the outputs are lower, which is mainly due to the mutual influence of the pipeline in the vertical direction. The last factor is the diameter of the spiral, which is larger than in previous cases but is still not large enough such that the individual sides of the spiral are not affected. We can also observe that while in saturated sand and gravel, the reach of heat extraction is reduced to a smaller distance from the pipe, and there is no significant cooling of the soil; with dry sand gravel, this range was much greater.
One method for optimizing this design would be to extend the collector to a greater depth and to increase spacing between the pipes above each other.
3.5.6. Case 14—Big Spiral 3.75
The last proposal in this article is a spiral with a diameter of 10 m and a pipe length of 133.8 m. Compared to the first case, this collector is shorter by 8.7 m. The total performance of the collector of this shape compared to the meander was lower by 7–11.7% during spring, lower by 10–13% during autumn and lower by 12–16.8% during winter. The specific output of the collector per 1 m of the pipeline was lower by 1.8–5.9% in the spring months, lower by 2.9–5.6% in autumn and by lower 6.7–11.4% in winter. The specific output of the collector per 1 m2 of land ranged from +10% to +15% during spring and autumn and at +3% to +9.8% during winter.
This design has the best results of all the collectors we have designed in this work, but even so, these performances are smaller than the performances of classical geometry and spatial bearings. Again, this is mainly due to the distance between the pipes, which is the same as in the previous case, i.e., 0.53 m. In Figure 7 (above), we can observe that there is a vertical effect between the pipes, and the effect is quite significant. On the other hand, at this diameter, the influence of the pipeline in the horizontal direction has been reduced, and in wet soils, this improvement is more pronounced than in dry soil types. Figure 8, Figure 9 and Figure 10 shows and summarizes cases 1 and 9–14, where geometries and its effect on collectors’ output were researched.
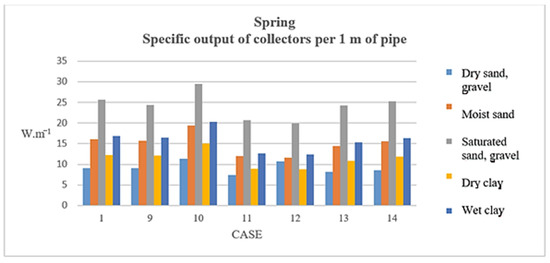
Figure 8.
The specific output of collectors per 1 m of pipe in spring; cases 1 and 9–14.

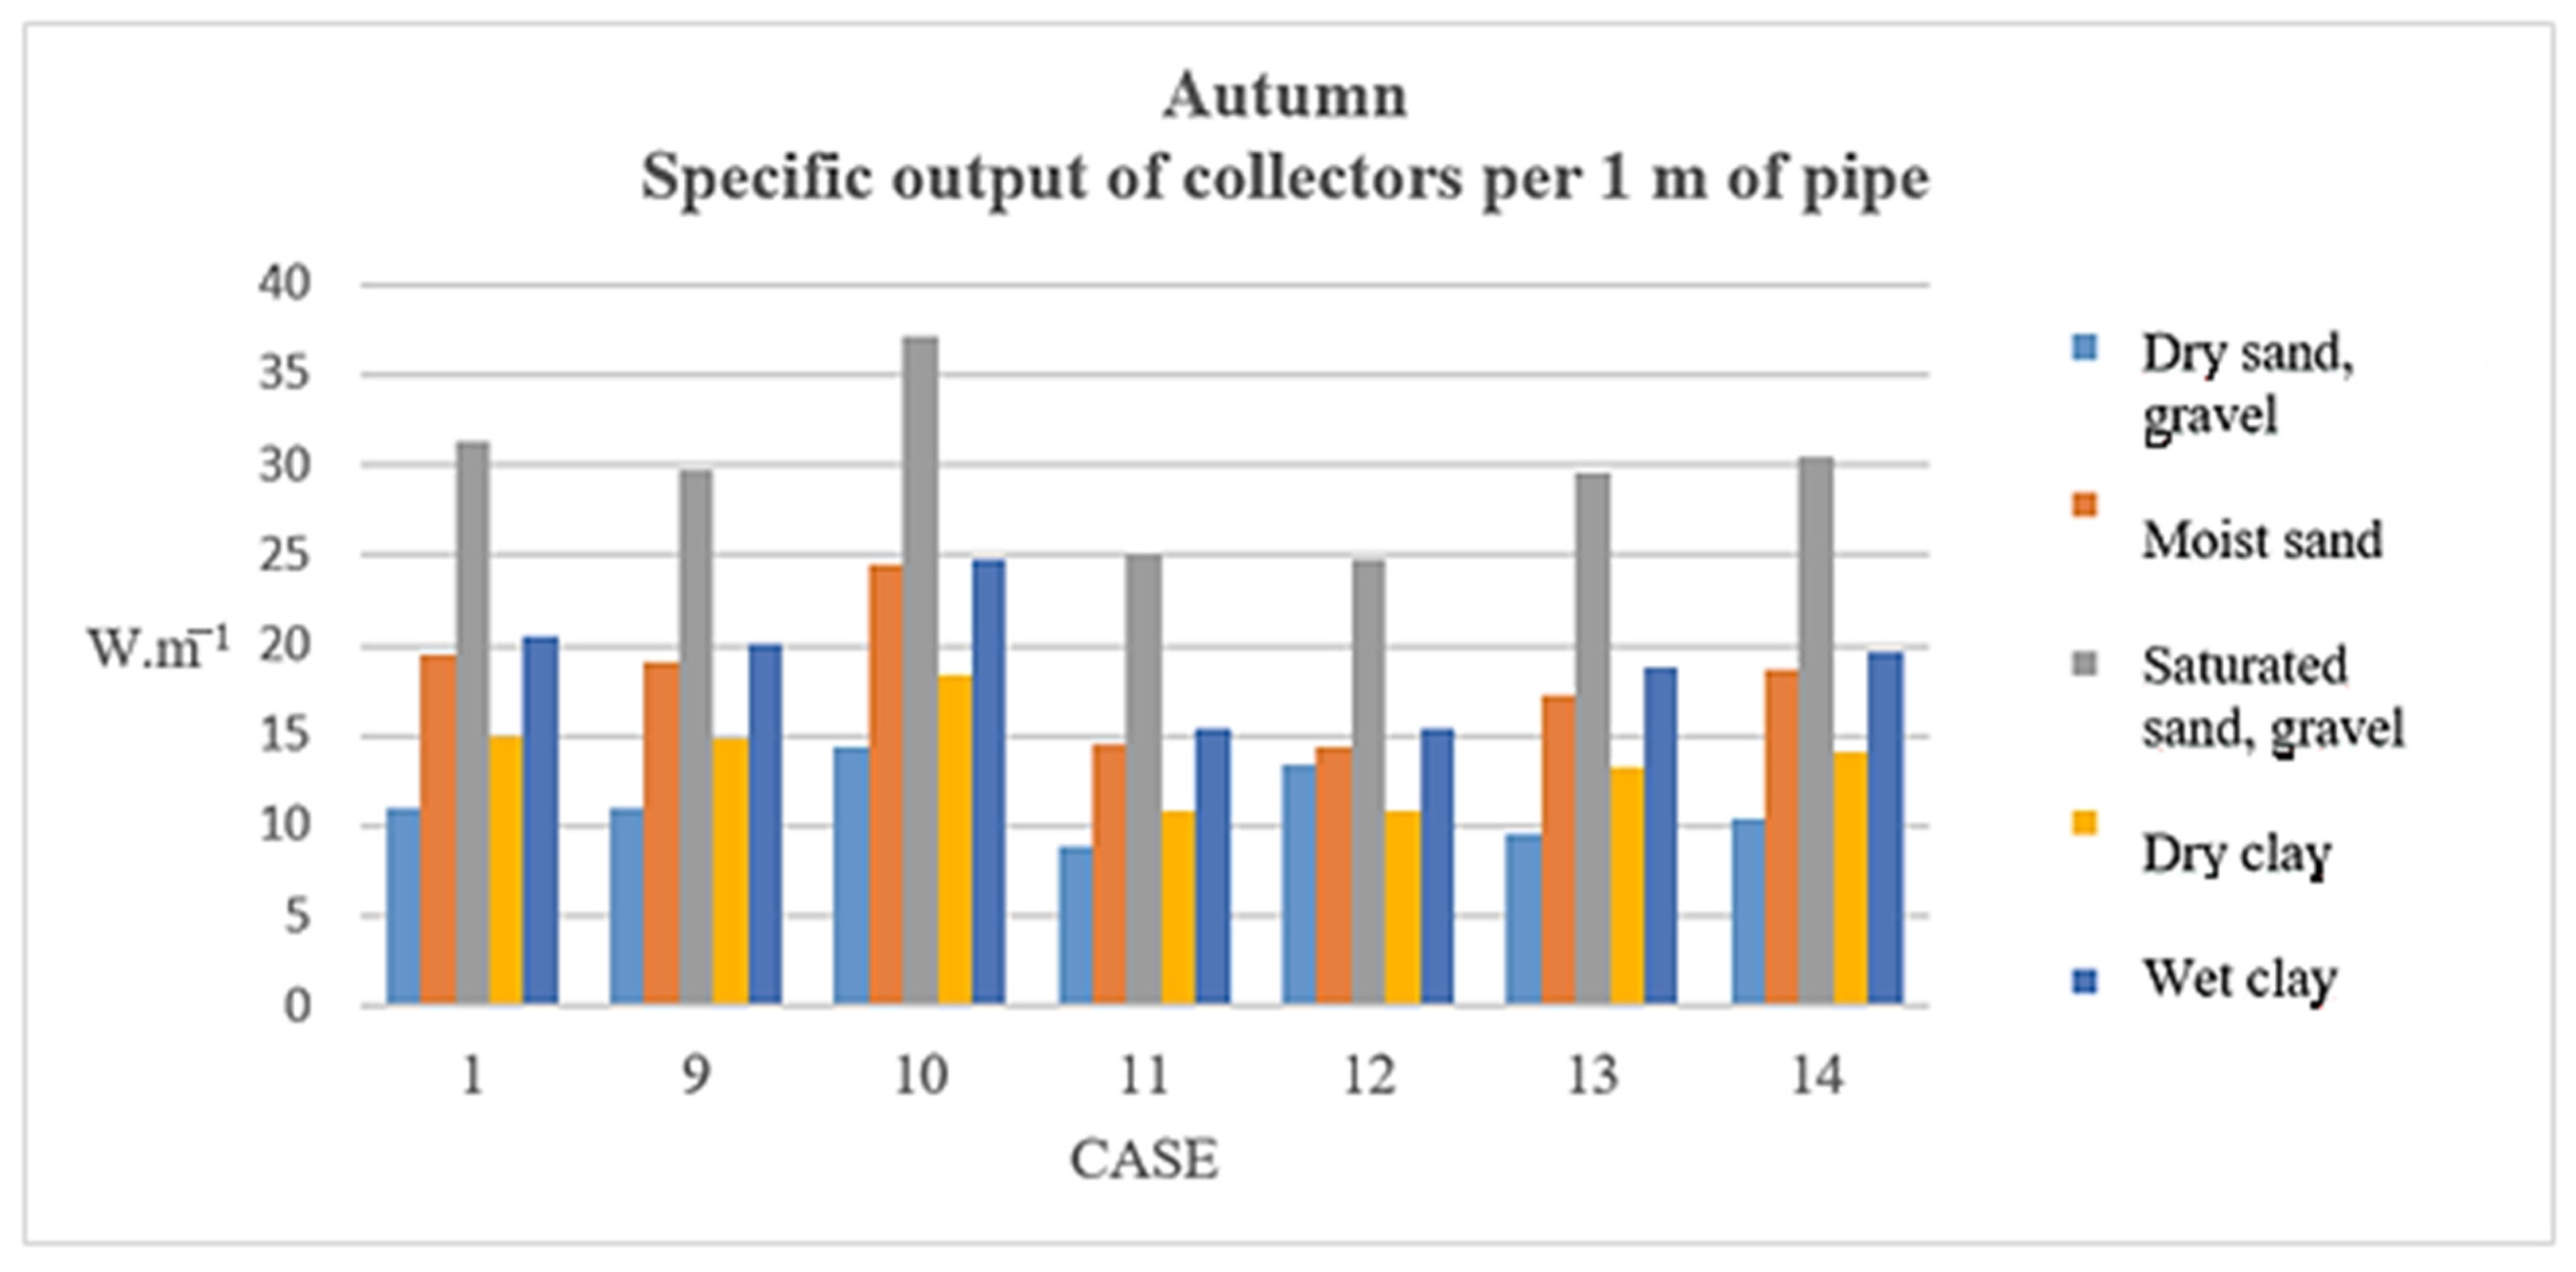
Figure 9.
The specific output of collectors per 1 m of pipe in autumn; cases 1 and 9–14.
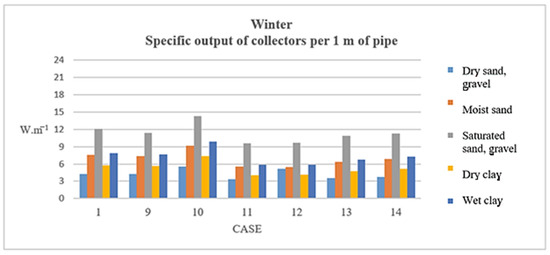
Figure 10.
The specific output of collectors per 1 m of pipe in winter; cases 1 and 9–14.
Since the collectors in cases 1 and 9–14 have different lengths, it is more appropriate to compare their specific output per 1 m of the pipeline. It is clear from Figure 8, Figure 9 and Figure 10 that the geometry of the 3D spiral has the best specific performance of all geometries, while the worst output had the small spiral. Of our designs, the great spiral came closest to the performance of classical arrangements.
4. Discussion
Determining the factors that affect the performance of horizontal ground collectors and the speed and amount of heat extracted from the soil is very important for the continuous development and optimization of these systems, especially because of the advantages of heating over conventional heating systems concerning the environment.
We found that the environment in which the collector is buried, i.e., in our case the soil, and its properties, especially the water content, has a significant impact on the long-term energy balance of this environment and output of the collector, which is significantly conditioned in Slovakia by individual seasons. The impact of the pipe material was minimal in our case. We considered the velocity and the temperature of the medium entering the collector to be important factors that can increase the performance of the system, but it is necessary to properly dimension not only the collector but the entire heat pump. The effect of the filling temperature is considerable, especially when the inlet temperature difference is 4 °C. We can assume that, at higher temperatures at the inlet to the collector, the trend would be similar, and the performance of the system would be even lower, especially in the winter months. Conversely, at lower inlet temperatures, collector performance could be higher, but this could significantly affect soil temperature near the pipe and cause it to freeze, thus reducing the efficiency of heat extraction. Therefore, it is generally not recommended to have an inlet temperature lower than −5 °C. The effect of filling speed is also significant. The reduction in collector output at a lower speed may be due to the mass heat capacity of the medium being 1/7 smaller than that of water; therefore, we need to have a higher velocity with respect to this medium. It can also happen that the slower flow rate results in more heat extraction from the beginning of the operation of the system, which causes the soil to subcooled around the pipe quickly and causes its efficiency to decrease over time. It is, therefore, logical that the output increased at higher speeds; although the flow in the collector pipe is rather laminar, the higher speed may cause the flow to become transient between laminar and turbulent flow, thus improving heat transfer from the pipe walls to its centre. At the same time, however, it must be taken into account that at a very high speed, the working medium does not have enough time to obtain heat from the surroundings and from the pipe walls, which may ultimately cause a reduction in overall performance and heat extraction.
The geometric and spatial placement of collectors has proven to be an area of research in which there is still an opportunity to experiment or try new things. At the same time, it is an area that significantly affects not only the performance of the collector but also the cost, which mainly includes piping material, the system installation itself, the number of earthworks, system efficiency in terms of heat needs for the heated object, and often interferes in the decision making of potential buyers of the heat pump. In the case of horizontal ground collectors in the shape of a meander or a snail, we assumed that it was possible to increase their output and heat consumption by increasing the spacing between the pipes and, thus, increasing the area needed for their storage. In the case of a 3D spiral, this also applies, but there is the possibility of shortening the excavations and, thus, the need for a smaller area in length.
Although none of the system’s designs matched the performance of conventional arrangements and, in addition, required excavation with greater depth, the benefit of this study is that a combination of horizontal and vertical spatial storage could be one of the basic collector storage options for ground/water or ground/air heat pumps in the future, especially in areas with sufficient area and landscaping. In cities where there are relatively few such areas, we can expect the use of vertical probes and boreholes that can be installed in the vicinity of both prefabricated houses, businesses, shopping centres or industrial buildings in the coming years.
The correct settings of the ground collector system, its filling and heat pump exchanger are very important for its optimal and efficient operation.
5. Conclusions
In this work, we dealt mainly with the investigation of horizontal ground collectors and factors that affect their performance whether it was the soil environment in which they were stored, the parameters of the pipe or the working medium. We also investigated the influence of geometric and spatial placement on the overall performance of these systems and what their energy balance is with respect to the balance of the soil environment near the collector expressed by its total output, specific output per 1 m of pipeline and 1 m2 of soil, which is also referred to in some publications as specific heat extraction.
Part of the work also included the optimization of ground collectors with respect to the design of geometry and spatial storage, which would increase the efficiency of the collector in terms of reducing its area or reducing the amount of excavation and groundworks required to place the collector in the soil. Although the performance of these systems did not reach the value of classical geometries and bearings, it was not too small for the given geometry to not be considered in the future.
Author Contributions
Conceptualization, D.K. and Ľ.G.; methodology, D.K.; software, Ľ.G.; validation, Ľ.G. and D.K.; formal analysis, M.P.; investigation, D.K.; resources, Ľ.G.; data curation, Ľ.G.; writing—original draft preparation, Ľ.G.; writing—review and editing, Ľ.G.; visualization, Ľ.G.; supervision, M.P.; project administration, D.K.; funding acquisition, D.K. All authors have read and agreed to the published version of the manuscript.
Funding
This research was funded by the Scientific Grant Agency of the Ministry of Education, Science, Research and Sport of the Slovak Republic (VEGA), grant number 1/0509/18.
Conflicts of Interest
The authors declare no conflict of interest. The funders had no role in the design of the study; in the collection, analyses or interpretation of data; in the writing of the manuscript; or in the decision to publish the results.
References
- IEA HPT. ETP 2017 Shows That Heat Pumps Will Be One of the Key Technologies for the Building Sectors in the 2BDS. 2017. Available online: https://heatpumpingtechnologies.org/etp2017-heat-pumps-key-technologies-building-sectors/ (accessed on 14 September 2020).
- IEA. Share of Households Purchasing Heat Pumps for Heating And Hot Water Production in Selected Regions the Sustainable Development Scenario, 2010–2030. 2020. Available online: https://www.iea.org/reports/heat-pumps (accessed on 14 September 2020).
- Bhutta, M.M.A. CFD applications in various heat exchangers design: A review. Appl. Therm. Eng. 2012, 32, 1–12. [Google Scholar] [CrossRef]
- Chong, C.S.A.; Gan, G.; Verhoef, A.; Garcia, R.G.; Vidale, P.L. Simulation of thermal performance of horizontal slinky-loop heat exchangers for ground source heat pumps. Appl. Energy 2013, 104, 603–610. [Google Scholar] [CrossRef]
- Kupiec, K.; Larwa, B.A.; Gwadera, M. Heat transfer in horizontal ground heat exchangers. Appl. Therm. Eng. 2015, 75, 270–276. [Google Scholar] [CrossRef]
- Pauli, P.; Neuberger, P.; Adamovský, R. Monitoring and Analysing Changes in Temperature and Energy in the Ground with Installed Horizontal Ground Heat Exchangers. Energies 2016, 9, 555. [Google Scholar] [CrossRef] [Green Version]
- Neuberger, P.; Adamovský, R.; Šeďová, M. Analyzing temperature changes in the ground massif with a horizontal heat exchanger in the course of the heating season. Infrastrukt. I Ekol. Teren. Wiej. 2013, 59, 91–97. [Google Scholar]
- Wu, Y.; Gan, G.; Verhoef, A.; Vidale, P.L.; Gonzalez, R.G. Experimental measurement and numerical simulation of horizontal-coupled slinky ground source heat exchangers. Appl. Therm. Eng. 2010, 30, 2574–2583. [Google Scholar] [CrossRef] [Green Version]
- Ali, M.; Selamat, S.B.; Kariya, K.; Miyara, A. Experimental Performance Estimations of Horizontal Ground Heat Exchangers for GSHP System. In Proceedings of the International Refrigeration and Air Conditioning Conference, West Lafayette, IN, USA, 11–14 June July 2016; Available online: http://docs.lib.purdue.edu/iracc/1808 (accessed on 24 February 2019).
- Selamat, S.; Miraya, A.; Kariya, K. Numerical study of horizontal ground heat exchangers for design optimization. Renew. Energy 2016, 95, 561–573. [Google Scholar] [CrossRef]
- Go, G.H.; Lee, S.R.; Yoon, S.; Kim, M.J. Optimum design of horizontal ground-coupled heat pump systems using spiral-coil-loop heat exchangers. Appl. Energy 2016, 162, 330–345. [Google Scholar] [CrossRef]
- Yoon, S.; Lee, S.R.; Go, G.-H. Evaluation of thermal efficiency in different types of horizontal ground heat exchangers. Energy Build. 2015, 105, 100–105. [Google Scholar] [CrossRef]
- Kim, M.J.; Lee, S.R.; Yoon, S.; Go, G.H. Thermal performance evaluation and parametric study of a horizontal ground heat exchanger. Geothermics 2016, 60, 134–143. [Google Scholar] [CrossRef]
- Congedo, P.M.; Colangelo, G.; Starace, G. CFD simulations of horizontal ground heat exchangers: A comparison among different configurations. Appl. Therm. Eng. 2012, 33–34, 24–32. [Google Scholar] [CrossRef]
- Congedo, P.M.; Colangelo, G.; Starace, G. Horizontal Heat Exchangers for GSHP. Efficiency and Cost Investigation for Three Different Applications. In Proceedings of the ECOS2005-18th International Conference on Efficiency, Cost, Optimization, Simulation, and Environmental Impact of Energy Systems, Trondheim, Norway, 20–22 June 2005; Available online: https://www.researchgate.net/profile/Gianpiero_Colangelo/publication/257277153_Horizontal_Heat_Exchangers_for_GSHP_Efficiency_and_Cost_Investigation_for_Three_Different_Applications/links/54db5e0d0cf261ce15cffefb.pdf (accessed on 24 February 2019).
- Benazza, A.; Blanco, E.; Aichouba, M.; Río, J.L.; Laouedj, S. Numerical Investigation of Horizontal Ground Coupled Heat Exchanger. Energy Procedia 2011, 6, 29–35. [Google Scholar] [CrossRef] [Green Version]
- Del-Castillo-García, G.; Borinaga-Treviño, R.; Sañudo-Fontaneda, L.A.; Pascual-Muñoz, P. Influence of pervious pavement systems on heat dissipation from a horizontal geothermal system. Eur. J. Environ. Civ. Eng. 2013, 17, 956–967. [Google Scholar] [CrossRef]
- Hepburn, B.D.; Sedighi, M.; Thomas, H.R. Field-scale monitoring of a horizontal ground source heat system. Geothermics 2016, 61, 86–103. [Google Scholar] [CrossRef]
- Sanaye, S.; Niroomand, B. Simulation of heat exchanger network (HEN) and planning the optimum cleaning schedule. Energy Convers. Manag. 2007, 48, 1450–1461. [Google Scholar] [CrossRef]
- Capozza, A.; Zarrella, A.; De Carli, M. Long-term analysis of two GSHP systems using validated numerical models and proposals to optimize the operating parameters. Energy Build. 2015, 93, 50–64. [Google Scholar] [CrossRef]
- Leong, W.H.; Tarnawski, V.R.; Aittomäki, A. Effect of soil type and moisture content on ground heat pump performance. Int. J. Refrig. 1998, 21, 595–606. [Google Scholar] [CrossRef]
- Kim, S.; Song, H.; Yu, K.; Tserengombo, B.; Choi, S.-H.; Chung, H.; Kim, J.; Jeong, H. Comparison of CFD simulations to experiment for heat transfer characteristics with aqueous Al2O3 nanofluid in heat exchanger tube. Int. Commun. Heat Mass Transf. 2018, 95, 123–131. [Google Scholar] [CrossRef]
- Banks, D. An Introduction to Thermogeology: Ground Source Heating and Cooling; Wiley-Blackwell: Chichester, UK, 2009; ISBN 978-1-4443-0268-4. Available online: https://www.researchgate.net/publication/233925703_An_Introduction_to_Thermogeology_Ground_Source_Heating_and_Cooling (accessed on 24 February 2019).
- Fujii, H.; Nishi, K.; Komaniwa, Y.; Chou, N. Numerical modeling of slinky-coil horizontal ground heat exchangers. Geothermics 2012, 41, 55–62. [Google Scholar] [CrossRef]
- Rezaei, A.; Kolahdouz, E.M.; Dargush, G.F.; Weber, A.S. Ground source heat pump pipe performance with Tire Derived Aggregate. Int. J. Heat Mass Transf. 2012, 55, 2844–2853. [Google Scholar] [CrossRef]
- Han, C.; Yu, X.B. Sensitivity analysis of a vertical geothermal heat pump system. Appl. Energy 2016, 170, 148–160. [Google Scholar] [CrossRef] [Green Version]


Publisher’s Note: MDPI stays neutral with regard to jurisdictional claims in published maps and institutional affiliations. |
© 2021 by the authors. Licensee MDPI, Basel, Switzerland. This article is an open access article distributed under the terms and conditions of the Creative Commons Attribution (CC BY) license (https://creativecommons.org/licenses/by/4.0/).