Abstract
The maximum gasification rate of corn stalk char (CSC) appeared at high conversion range, and its quite different gasification behaviors from other carbonaceous materials are all derived from the catalytic effect of alkali and alkali earth metals (AAEMs), so it is necessary to study the effect of AAEMs and gasification kinetics of such biomass char. However, there are few systematic discussions about this effect and kinetic modeling. Thus, in this study, CSC samples were prepared in a fast pyrolysis fixed-bed reactor, and its gasification experiments were conducted on a pressurized magnetic suspension balance at various total pressures (0.1–0.7 MPa), steam concentrations (10–70 vol.%) and temperatures (725–900 °C). Moreover, a water-leached CSC (H2O-CSC) was also prepared to evaluate the impact of AAEMs on the gasification performance of CSC, and some well-known models were adopted to describe the gasification behaviors. On the basis of these results, the effect of primary AAEMs on the gasification behaviors of CSC and gasification kinetic modeling were obtained. Results showed total pressure had no obvious influence on the gasification rate of CSC, and the reaction order varied at 0.43–0.55 with respect to steam partial pressures. In addition, the modified random pore model (MRPM) and Langmuir–Hinshelwood (L-H) model were satisfactorily applied to predict the gasification behaviors of CSC. The catalytic effect of AAEMs on CSC gasification was weakened due to water-leaching treatment. A random pore model (RPM) could describe the gasification behavior of H2O-CSC well, followed by grain model (GM) and volumetric model (VM).
1. Introduction
Accompanied with the huge consumption of fossil fuels (especially coal) and the induced serious environmental problems, in recent years, the usage of biomass resource has attracted lots of attention. Compared with coal, biomass has some advantages, e.g., it is carbon-dioxide-neutral, renewable and has high gasification reactivity as well as low S and N content, thus becoming a reasonable alternative energy. Among the methods of thermal processing biomass resources, biomass gasification can produce syngas for liquid fuels and chemical productions and is considered as a promising technology [1,2].
Gasification of biomass includes two main steps: (1) pyrolysis of the raw samples and (2) gasification of the residual chars. Compared with pyrolysis, the reaction rate of char is rather slow; therefore, it is considered to be the kinetic controlling step of gasification. In industrial applications, it is important to know how fast the reaction proceeds and how long it will take to complete char conversion. Therefore, the research on biomass char gasification kinetics is crucial for the simulation of gasification process and design of the gasifiers [3,4].
Many works have been done on the gasification reactions of biomass char with steam, CO2 or steam/CO2. Results concerning the effects of the biomass char prepared conditions such as pyrolysis temperature [5,6,7,8], pressure [9,10], heating rate [11,12], atmosphere [13] and sample size [8] on biomass char gasification reactivity, which are summarized in Table 1. In addition, further research focused on the effects of alkali and alkali earth metals (AAEMs) on biomass char gasification behaviors [14,15,16,17,18,19,20,21] are shown in Table 2. Generally, K, Na and Ca have been found to remarkably increase the gasification rate of biomass char, of which the catalytic effect of K is the most prominent one. Biomass and biomass char are usually rich in AAEMs [19,20,22]. Attributed to the high amount of AAEMs, the gasification behavior of biomass char differs a lot from coal char. For example, the maximum gasification rate of some biomass chars always appeared at high conversion range [19,23,24,25]; however, the maximum gasification rate of coal char was usually at low conversion range [26,27,28,29]. Thus, the conventional nth-order model such as volumetric model (VM), grain model (GM) and random pore model (RPM) can no longer predict the gasification behaviors of these kinds of biomass chars [19,24]. Owing to Zhang and his co-workers’ efforts [19], a semi-empirical model based on random pore model (which is known as modified random pore model (MRPM)) was proposed to solve this problem, and this model could describe the experimental data of 14 biomass chars well over the whole conversion range. This model is especially suitable for biomass char that has a maximum gasification rate at high carbon conversion range (>0.393). MRPM has been proved to be successful in describing the gasification behaviors of biomass chars [7,15,19,24]. Although AAEMs (whether loaded on biomass chars or indigenous) were proved to increase the gasification rate of biomass chars and lead to a maximum reaction rate showing at a high conversion range [15,17], the discussions about the effect of AAEMs on kinetic modeling of biomass char are few [15,30]. Despite the nth-order model, the Langmuir–Hinshelwood model (L-H) model based on the stepwise reaction mechanism which can give the relations between gasification rate and reactant partial pressure was usually applied to predict the gasification behaviors and determine the kinetic parameters of char [31,32].

Table 1.
Summary on the effect of char prepared conditions on the reactivities of biomass chars.
Table 2.
Summary on the effect of AAEMs on the gasification behaviors of biomass chars.
This work aims to study the gasification kinetics of biomass char rich in AAEMs (especially K) under steam atmosphere and adopt an applicable model to describe the experimental results. The nth-order model and L-H model were used to predict the gasification behaviors of biomass char and obtain the corresponding kinetic parameters. Furthermore, an attempt was made to evaluate the effects of indigenous AAEMs on biomass char gasification rate and kinetic model. In order to study the mentioned issues, a fast pyrolysis biomass char was made and gasified in a thermogravimetric analyzer. For the purpose of investigating the effect of indigenous AAEMs on the gasification behaviors of biomass char, a water-leached biomass char was also prepared.
2. Materials and Methods
2.1. Preparation of Char Samples
Agriculture residues usually have high content of AAEMs [33], and corn stalk (CS) collected from the southeast of Shanxi province was selected as a representative biomass in this study. CS was previously dried in an oven at 105 °C for 12 h and then sheared to a particle size of less than 600 μm. The corn stalk char (CSC) was prepared in a fixed-bed reactor at 900 °C under N2. Details of the experimental device and procedure have been given elsewhere [24]. CSC was ground to a diameter of less than 100 μm and stored in a desiccator for further use. The procedure of preparing water-leached biomass char (H2O-CSC) was as follows: CSC was leached by ultra-pure H2O (about 0.25 g CSC was soaked and stirred by a magnetic stirrer in a round-bottom flask (500 mL) with 250 mL ultra-pure H2O) for 6 h at 60 °C. Then, H2O-CSC sample was dried in an oven at 105 °C for 12 h and stored for further use. The proximate and ultimate analyses of the raw sample and corresponding chars are shown in Table 3.
Table 3.
Proximate and ultimate analyses of corn stalk and the corresponding chars.
In addition, the inorganic elements of the char samples were determined by ICP-AES (Thermo ICAP 6300, Thermo Fisher Scientific, Waltham, MA, USA) according to the procedure adopted by Jiang et al. [22]. Table 4 lists the contents of the major inorganic elements of the char samples. Compared with some works in the literature [14,19], CSC has a high content of K. After water-leaching treatment, the contents of the inorganic elements all decreased, and the mass fraction of K and Na dropped dramatically. The primary chemical form of K and Na in biomass char is water-soluble [14,34], so the water-leaching treatment caused a massive loss of K and Na.
Table 4.
Contents of the major inorganic elements in char samples.
2.2. Steam Gasification Tests
The gasification experiments were performed on a magnetic suspension balance (Rubotherm, 2011-01181-CHN), and steam was used as the gasifying agent. In each test, a 10 mg sample was loaded in a platinum crucible (13 mm in diameter, 2 mm in height). Then, the gasification system was sealed and pressurized to the experimental pressure. After that, the sample was heated up in N2 at a constant ramp (20 °C/min) and flow rate (200 mL/min) to the desired temperature and maintained for 30 min until the mass signal and temperature was stable. Then steam was dosed to the system to initiate the reaction. The experiments were conducted in 200 mL/min steam/N2 atmosphere at various total pressures (0.1–0.7 MPa), steam concentrations (10–70 vol.%) and temperatures (725–900 °C). All the experiments were conducted until the mass changes were no longer observed. The experiments were conducted 2–4 times, and the standard deviations of the experiments were within ±1%. The carbon conversion (X) and average gasification rate (Ravg) was calculated by the following equations:
where m0 represents the mass of char at the onset of gasification, mt indicates the instantaneous mass of char at time t, and m∞ is the final mass of char when the mass changes were no longer observed, in wt.%, and N is the number of the data adopted. In this paper, Ravg is the average instantaneous reaction rates between X = 0.1 to 0.9; it aims to decrease the error by applying single-point reaction rate. This method is similar to some researchers who adopted the average gasification rate between the conversion of 0–50% [35], 1–80% [33] and 60–80% [36] to compare the reactivities of different biomass char samples.
2.3. Kinetic Models
Usually, the gasification behavior can be predicted by two kinds of models: an nth-order one-step model and rate equations based on the stepwise reaction mechanism [37] (Langmuir–Hinshelwood (L-H) model).
The nth-order model can be written as Equation (3), where k is the apparent gasification rate constant, which is related with temperature and the partial pressure of the reagent, and f(X) describes the changes in the physical or chemical properties of the sample as the gasification proceeds. The most-used nth-order models are volumetric model (VM), grain model (GM) and random pore model (RPM) [38]. The forms of these models are listed below, Equations (4)–(6):
where kVM, kGM, kRPM denote the respective apparent reaction rate constant and ψ is a pore structural parameter.
In the nth-order model, RPM proposed by Bhatia and Perlmutter (1980) is the most successful model in describing coal char gasification [38,39,40] and has been used to describe biomass char gasification [6,18,41]. However, RPM can only describe the gasification behavior when the maximum gasification rate appears at X < 0.393. When the gasification rate increases with conversion and shows a maximum at high conversion range (X > 0.393), especially for biomass char and catalytic biomass char gasification [15,17,19,30], RPM was no longer adopted. Consequently, a semi-empirical model developed by Zhang et al. [19] was applied to describe such gasification behaviors. The modified random pore model (MRPM) is indicated as below:
where c presents a dimensionless constant and p is a dimensionless power law constant.
When the concentration of the gasifying agent is constant, the apparent reaction rate constant can be expressed by the Arrhenius equation:
where A, Ea and R are the pre-exponential factor, activation energy and universal gas constant (8.314 J/mol∙K), respectively.
The L-H model is based on adsorption and desorption theories. The expressions of char-H2O gasification can be written as Equations (9) and (10):
where Cf represents a free active site and C(O) is an absorbed surface complex, and the total concentration of active sites Ct on the sample surface is expressed as:
Assuming that the reaction is in a steady state, and the concentration of C(O) approaches to zero, the gasification rate of char-H2O can be written as Equation (12) [42]:
where K2 = k1/k3, K3 = k2/k3, P is the partial pressure.
Usually when the system has excess gasifying agent (steam), the partial pressure of H2 (PH2) can be neglected (K3PH2 << K2PH2O); thus, Equation (12) can be simplified to Equation (13) and further transformed to Equation (14), where k1 and k2 can be calculated by linearizing Equation (8). Then the value of A and Ea of the two main steps can be obtained.
3. Results and Discussion
3.1. Effect of Gasification Pressure
Two types of pressure effects on the gasification rate of CSC have been analyzed, i.e., fixed total pressure with different steam concentrations and fixed steam partial pressures with varying total pressures [43]. Figure 1a shows the effect of steam concentration with a fixed total pressure on the gasification rate of CSC. As can be depicted from the figure, the reaction rate of CSC increases with steam concentration.
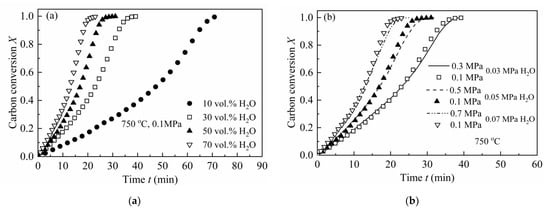
Figure 1.
Pressure effects on the gasification rate of CSC at 750 °C: (a) different steam concentrations with a constant total pressure of 0.1 MPa; (b) different total pressures with fixed steam partial pressures (0.03, 0.05 and 0.07 MPa), respectively.
Figure 1b illustrates the results of fixed steam partial pressures with different total pressures on the gasification rate of CSC. As can be seen, there are no clear differences when the steam partial pressure is fixed but with different total pressures. This is consistent with the results of some researchers, i.e., that total pressure has no influence on the intrinsic gasification rate of chars, except for the diffusion effect of the reactant [28,44,45]. Thus, this research mainly focused on the gasification of CSC under at 0.1 MPa with different steam concentrations (10, 30, 50 and 70 vol.%).
3.2. Effect of Gasification Temperature
The effect of gasification temperature on the reaction rate of CSC was tested at 725–825 °C and 0.1 MPa with steam concentrations of 10–70 vol.%. Results were processed according to the method mentioned in Section 2.2 (the reaction rate was obtained by averaging the instantaneous reaction rates between X = 0.1 to 0.9). The gasification rates at different steam concentrations and temperatures were listed in Table 5, and the Arrhenius plots were shown in Figure 2. As seen in Table 5, at low steam concentrations (10 and 30 vol.%), the gasification rate grows very fast with temperature, i.e., the rate at 825 °C is nearly eight times at 725 °C (83.86/10.57 = 7.93, 130/17.78 = 7.31). At high steam concentrations (50 and 70 vol.%), the growth of gasification rate slows down, for the reaction rate of 825 °C is about six times that of 725 °C (160/24.92 = 6.42, 200/31.42 = 6.37). This phenomenon can be explained by the effect of temperature on the reaction order, in which the reaction order with respect to steam partial pressure decreases with the increase in gasification temperature (seen in Section 3.3).
Table 5.
Gasification rates and activation energies of CSC at 0.1 MPa with various steam concentrations and temperatures.
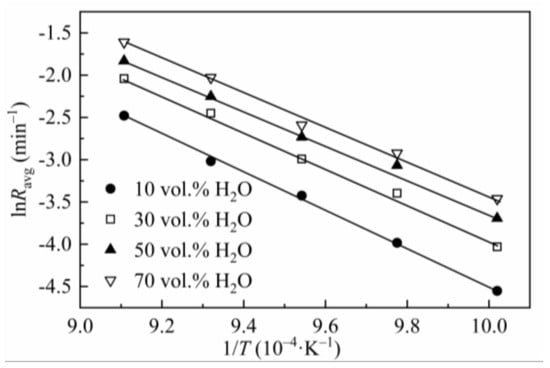
Figure 2.
Arrhenius plots of lnRavg versus 1/T for CSC.
The Arrhenius plot was used to evaluate the char reactivities at different temperatures. The value of Ea was obtained by linearizing Equation (3) (where k(T, P) was substituted by Equation (8)) without considering the specific form of f(X). This method, discussed by Vyazovkin et al. [46,47], was called the model-free method and is usually applied to data for non-isothermal and isothermal decompositions of solids. The use of the model-free method is recommended as a trustworthy way of obtaining reliable kinetic parameters. The value of Ea obtained in this way is closer to the true value. The corresponding plots of various steam concentrations were developed to determine Ea. At low temperatures, the reaction is under chemical control zone. As the temperature increases, diffusion control becomes dominant [48,49,50]. The straight line in Figure 2 and the high regression coefficients (R2 > 0.99) listed in Table 5 indicate the gasification reactions are all under chemical control zone. The values of Ea (167–187 kJ/mol) are within the ranges of biomass char steam gasification summarized in the literature [1]. In Table 5, it is noticeable that Ea decreases when the steam concentration increases; however, when the steam concentration reaches 50 vol.%, Ea no longer decreases and remains stable. It can be explained as when the concentration of the reagent grows, the effective collision between the reactant atom and the carbon atom increases, so the gasification reaction happens more easily, and Ea becomes lower. When the steam concentration is high enough, the adsorption of steam on the char surface intends to be saturated [51]; thus, Ea grows slowly when the steam ratio increases further.
3.3. Reaction Order
The effect of steam partial pressure on CSC gasification rate can be described by the reaction order with respect to steam partial pressure. Equation (2) can be expressed by the following:
where b is a constant, PH2O is the partial pressure of steam, and n is the reaction order with respect to steam partial pressure, which can be calculated by linearizing Equation (15).
As obtained from Figure 3, the reaction order of char steam gasification was listed in Table 6 and in the range of 0.43–0.55. Marquez-Montesinos [52] et al. reported the values of reaction order for grapefruit char gasification were 0.5–0.6. Lopez et al. [53] found the reaction order with respect to steam partial pressure was 0.34 for pinewood sawdust. Fermoso et al. [38] found that the reaction order with respect to steam partial pressure for chestnut char and olive stones char was 0.40 and 0.52, respectively. The reaction order obtained here differs from other studies, which may be caused by different biomass resources. However, the value of n is in the range listed in the literature [1].
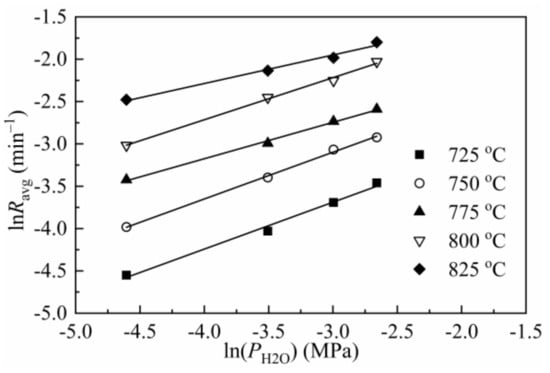
Figure 3.
Reactivity of CSC as a function of steam partial pressure.
Table 6.
Reaction order and regression coefficients of CSC at 0.1 MPa with steam concentrations of 10–70 vol.%.
3.4. Kinetics
3.4.1. The Application of MRPM to Describe Biomass Char Gasification Behaviors
As mentioned in Section 2.3, the nth-order model is usually applied to evaluate the gasification kinetics of carbonaceous materials. However, according to the expression of VM, GM and RPM (Equations (4)–(6)), the gasification rates predicted by VM and GM are all decreased with carbon conversion, and the maximum rate of RPM is less than 0.393 [54]. It is obviously not appropriate to use these models to describe the gasification behaviors of biomass chars of which the gasification rate increases with conversion and the maximum value appears at conversion above 0.393.
From the shape of the plot of dX/dt-X (Figure 4), it can be easily found that the maximum reaction rates are all at high conversion range, which has a remarkable difference with the plot of coal char gasification [26,27,28,29]. As mentioned by some researchers [19,23,24,55], the maximum gasification rate of biomass char appearing at high conversion was caused by the high content of AAEMs within char and the effect of enrichment of the AAEMs caused by carbon consuming. Therefore, MRPM proposed by Zhang et al. [19] was adopted to evaluate such biomass char gasification.
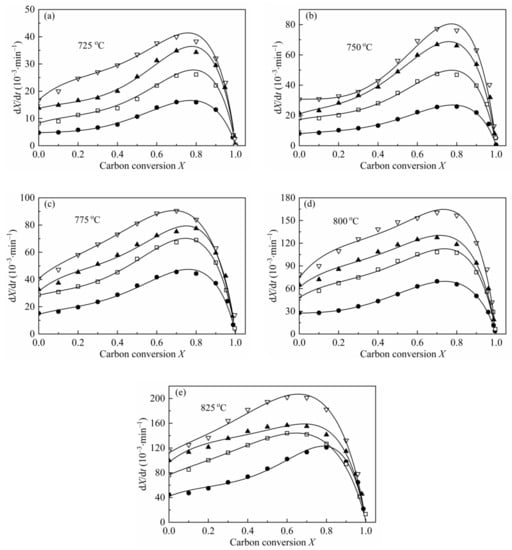
Figure 4.
Application of MRPM to describe the gasification behaviors of CSC at 0.1 MPa, 725–825 °C (a–e), with different steam concentrations. ●:10 vol.%; □:30 vol.%; ▲:50 vol.%; ▽:70 vol.%; solid line: MRPM results.
The gasification rate versus carbon conversion profiles at various temperatures and steam concentrations were depicted in Figure 4. The results of the application of MRPM were also presented in Figure 4. As can be noted from the figure, the carbon conversions corresponding to the maximum gasification rates are all around X = 0.8, which can be explained by the above-mentioned reasons. It can also be seen from Figure 4 that MRPM is well applied to fit the gasification results, and all the regression coefficients of the model are above 0.97 (which was listed in Table 7). It is shown in Table 7 that the value of ψ has no regular pattern with temperature or steam concentration, and the average value of ψ, c and p is around 6.8, 1.8 and 3.0, respectively, which are in the range of the literatures [7,15,19]. According to Zhang et al. [19], who developed MRPM, ψ was obtained by adopting RPM to fit the experimental data as best as it can be; however, this way of getting ψ was not theoretically adequate. In this paper, ψ was gained by optimizing the experimental data with taking kMRPM, ψ, c, p as unknown parameters, and this method had been widely verified [7,15,24,27].
Table 7.
Kinetic parameters and regression coefficients of MRPM for CSC at 0.1 MPa with different temperatures and steam concentrations.
The activation energy Ea listed in Table 7 was obtained by linearizing Equation (8), and kMRPM was obtained from MRPM. Figure 5 is the Arrhenius plot of lnkMRPM versus 1/T for CSC gasified at 0.1 MPa with different steam concentrations.
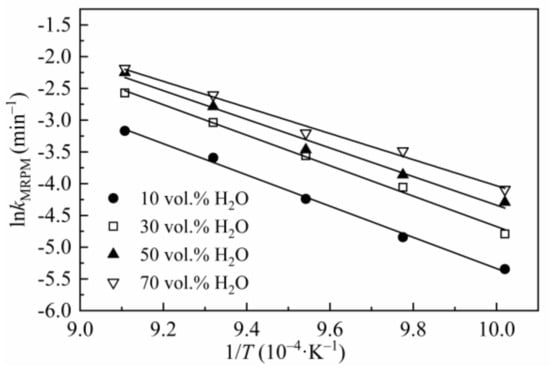
Figure 5.
Arrhenius plots of lnkMRPM versus 1/T for CSC.
Compared with Table 5, the value of Ea in Table 7 varied remarkably. This discrepancy is mainly caused by two different methods of data processing. In Section 3.2, the value of Ea in Table 5 was obtained by linearized Equation (3) (where k(T, P) is substituted by Equation (8)) without considering the specific form of f(X), and the same method had been adopted by Lahijani et al. [48]. In Equation (3), dX/dt was obtained by averaging the instantaneous reaction rates between X = 0.1 to 0.9, which aims to reduce the uncertainties by applying single point reaction rate. However, the value of Ea in Table 7 was obtained from kMRMP, which was derived from MRPM by optimizing the experimental data. In Equation (6), kMRPM is the value of dX/dt, when X = 0. In summary, Ea in Table 5 was obtained according to the meaning value of dX/dt at different temperatures and steam concentrations, whereas Ea in Table 7 was gained by a single point dX/dt (X = 0) of MRPM at different temperatures and steam concentrations.
3.4.2. The Effect of Water Leaching on Biomass Char Gasification Behaviors
Many researchers reported the catalytic effect of AAEMs on biomass char gasification [14,15,16,17,18,20,21,25,56]. In most cases, the catalytic effect of AAEMs was investigated by loading AAEMs on a low-ash-content biomass char (e.g., pine wood char, nut shell char). Results showed that AAEMs have a remarkable improvement on the gasification rates of biomass chars, and some researchers found the impregnation of AAEMs made the maximum gasification rate of biomass char shift to higher conversion [15,17], which was consistent with the phenomenon that appeared in this paper. Compared with some works [14,19], CSC adopted in this research has a high content of AAEMs (especially K), which may cause the special gasification behaviors. However, there is little research concerning with the effect of indigenous AAEMs on the gasification behaviors of biomass char. Feng et al. [14] studied the effect of chemical speciation of AAEMs on the steam gasification of a biomass char and found the speciation of K, Na in biomass char was mainly water-soluble, while Ca and Mg are mainly in insoluble form, and H2O-soluble AAEMs play an important role in biomass char reactivity.
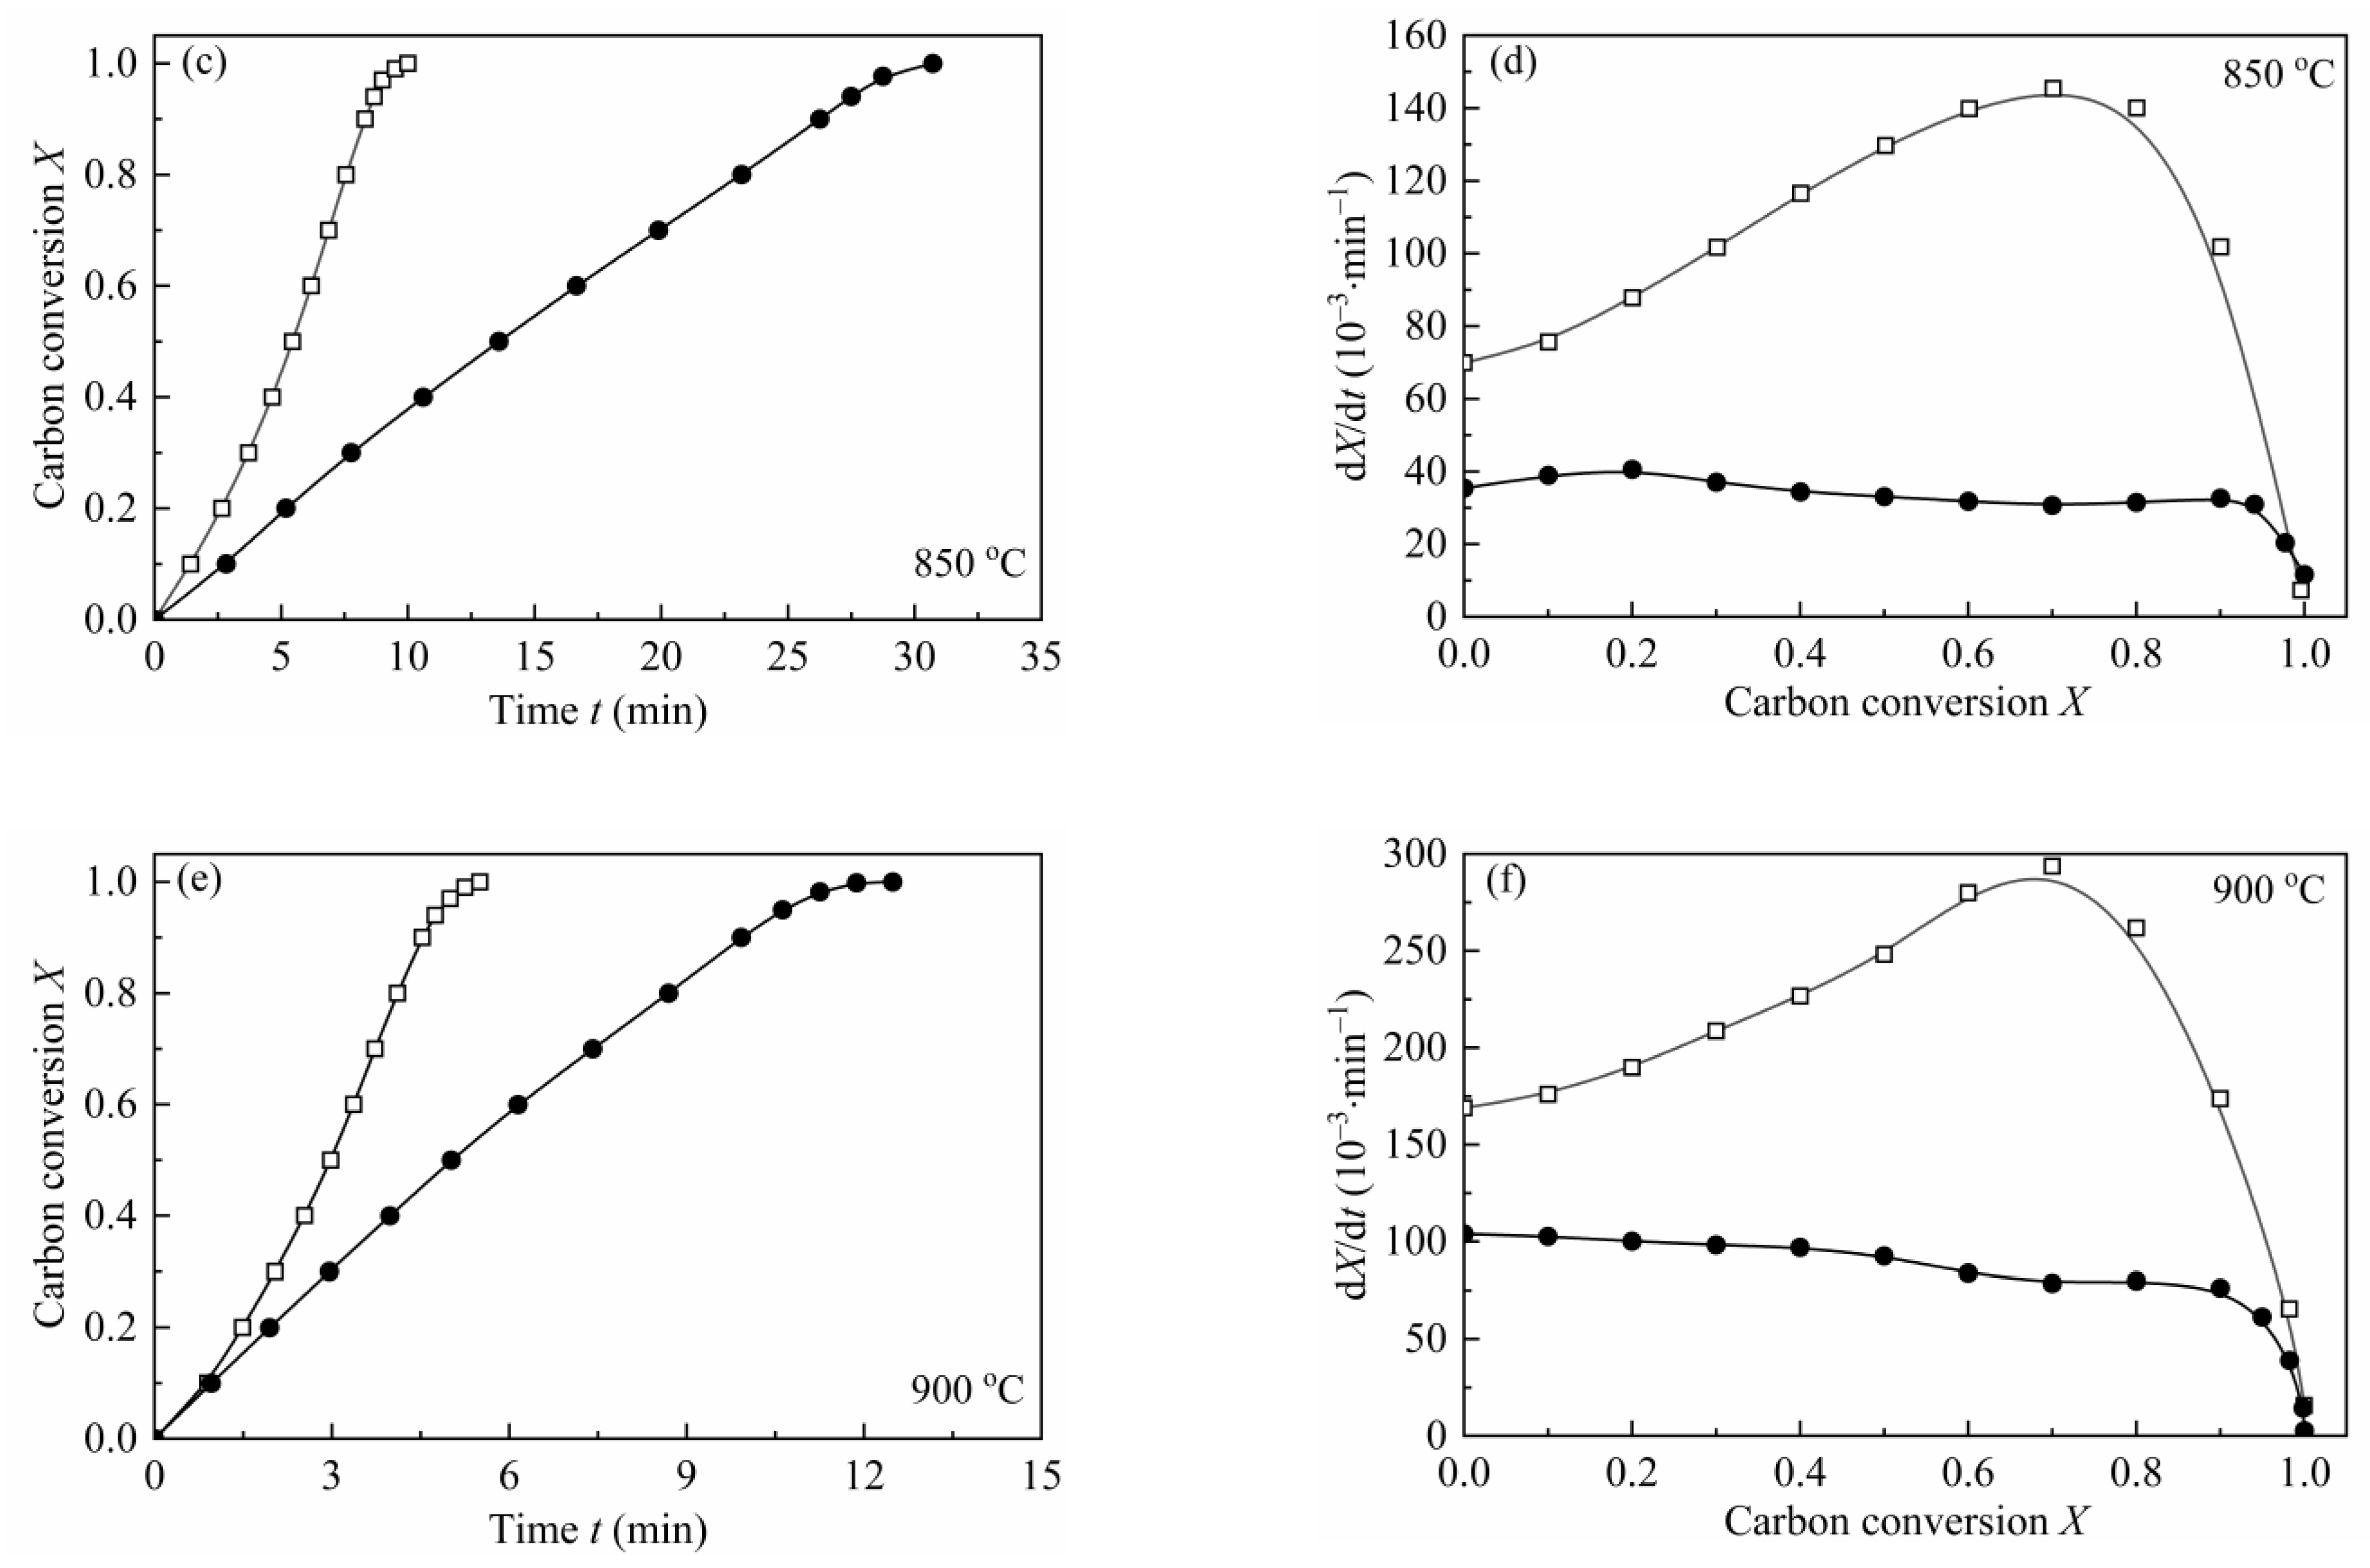
In order to verify the catalytic effect of indigenous AAEMs on the gasification behaviors of biomass char, a water-leached biomass char (H2O-CSC) was prepared. According to Table 4, about 80 wt.% of K and Na and 25 wt.% of Ca and Mg was removed by water-leaching treatment. According to Jiang et al. [57], the water-leaching method rarely changed the pore structure and surface area of the original biomass char, and the carbonization structure was almost not influenced by the water-leaching treatment [56]. The gasification of H2O-CSC was compared with CSC at 800–900 °C, 0.1 MPa with a steam concentration of 10 vol.%. Figure 6 shows the comparison between the gasification reactivity of CSC and H2O-CSC at different temperatures. As depicted from the figure, after water leaching, the reaction rate of H2O-CSC decreased significantly. A comparison of reaction time (the time for carbon conversion reached X = 0.9) and average reaction rate (reaction rate between X = 0.1–0.9) was shown in Table 8. As seen in Table 8, compared with CSC, the time for H2O-CSC to reach X = 0.9 is shortened, and the average reaction rate of CSC is about 4.3 (48.94/11.30), 3.3 (115.38/34.49) and 2.5 (228.70/89.88) times the average reaction rate of H2O-CSC at 800, 850 and 900 °C, respectively. Since about 80 wt.% of K and Na were removed by water leaching, and water soluble AAEMs play a crucial role in biomass char reactivity [14], it can be concluded that AAEMs (especially K and Na) have an obviously promoting effect on CSC gasification rate.
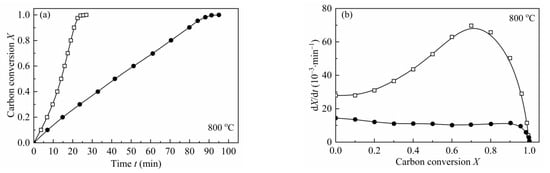
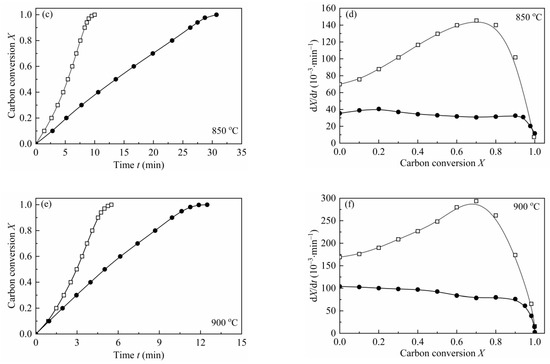
Figure 6.
Reactivity comparisons of CSC and H2O-CSC at 0.1 MPa with 10 vol.% H2O. —□—: CSC; —●—: H2O-CSC.
Table 8.
Reactivity comparisons of CSC and H2O-CSC at 0.1 MPa with 10 vol.% H2O.
From Figure 6, it can be observed that the shape of dX/dt-X for H2O-CSC changes a lot compared with CSC, and the reaction rate no longer grows with carbon conversion; however, it decreases gradually (except for 850 °C, there is an increase before X = 0.2). This is an obvious distinction compared with the gasification behavior of CSC, for the gasification rate of CSC increases with carbon conversion to a maximum (around X = 0.7–0.8), then decreases. The MRPM proposed by Zhang et al. [19] is more suitable for biomass char that has a maximum reaction rate at the high conversion range (X > 0.393). Since the gasification behaviors of H2O-CSC changed, MRPM is no longer appropriate to predict its gasification behavior. Other nth-order models of VM, GM and RPM were applied to evaluate the experimental results of H2O-CSC. The method adopted here can be found in references [23,58]. The integral forms of VM, GM and RPM (Equations (16)–(18)) were used to get the reaction rate constant k, and then A and Ea were obtained by linearizing Equation (8).
In order to avoid any uncertainties at high conversions where quite little char is left (X > 0.9, there is a sudden decrease in reaction rate), X = 0–0.9 was chosen for simulation. Figure 7 shows the linearized models of VM, GM and RPM and coefficients for H2O-CSC. Moreover, the reaction rate constant k was obtained from the slope (seen in Table 9).
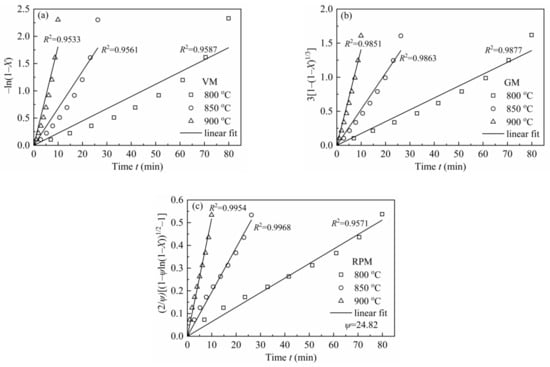
Figure 7.
VM, GM and RPM linearized models for H2O-CSC at 0.1 MPa with 10 vol.% H2O.
Table 9.
Kinetic parameters of VM, GM and RPM by fitting kinetic data of H2O-CSC.
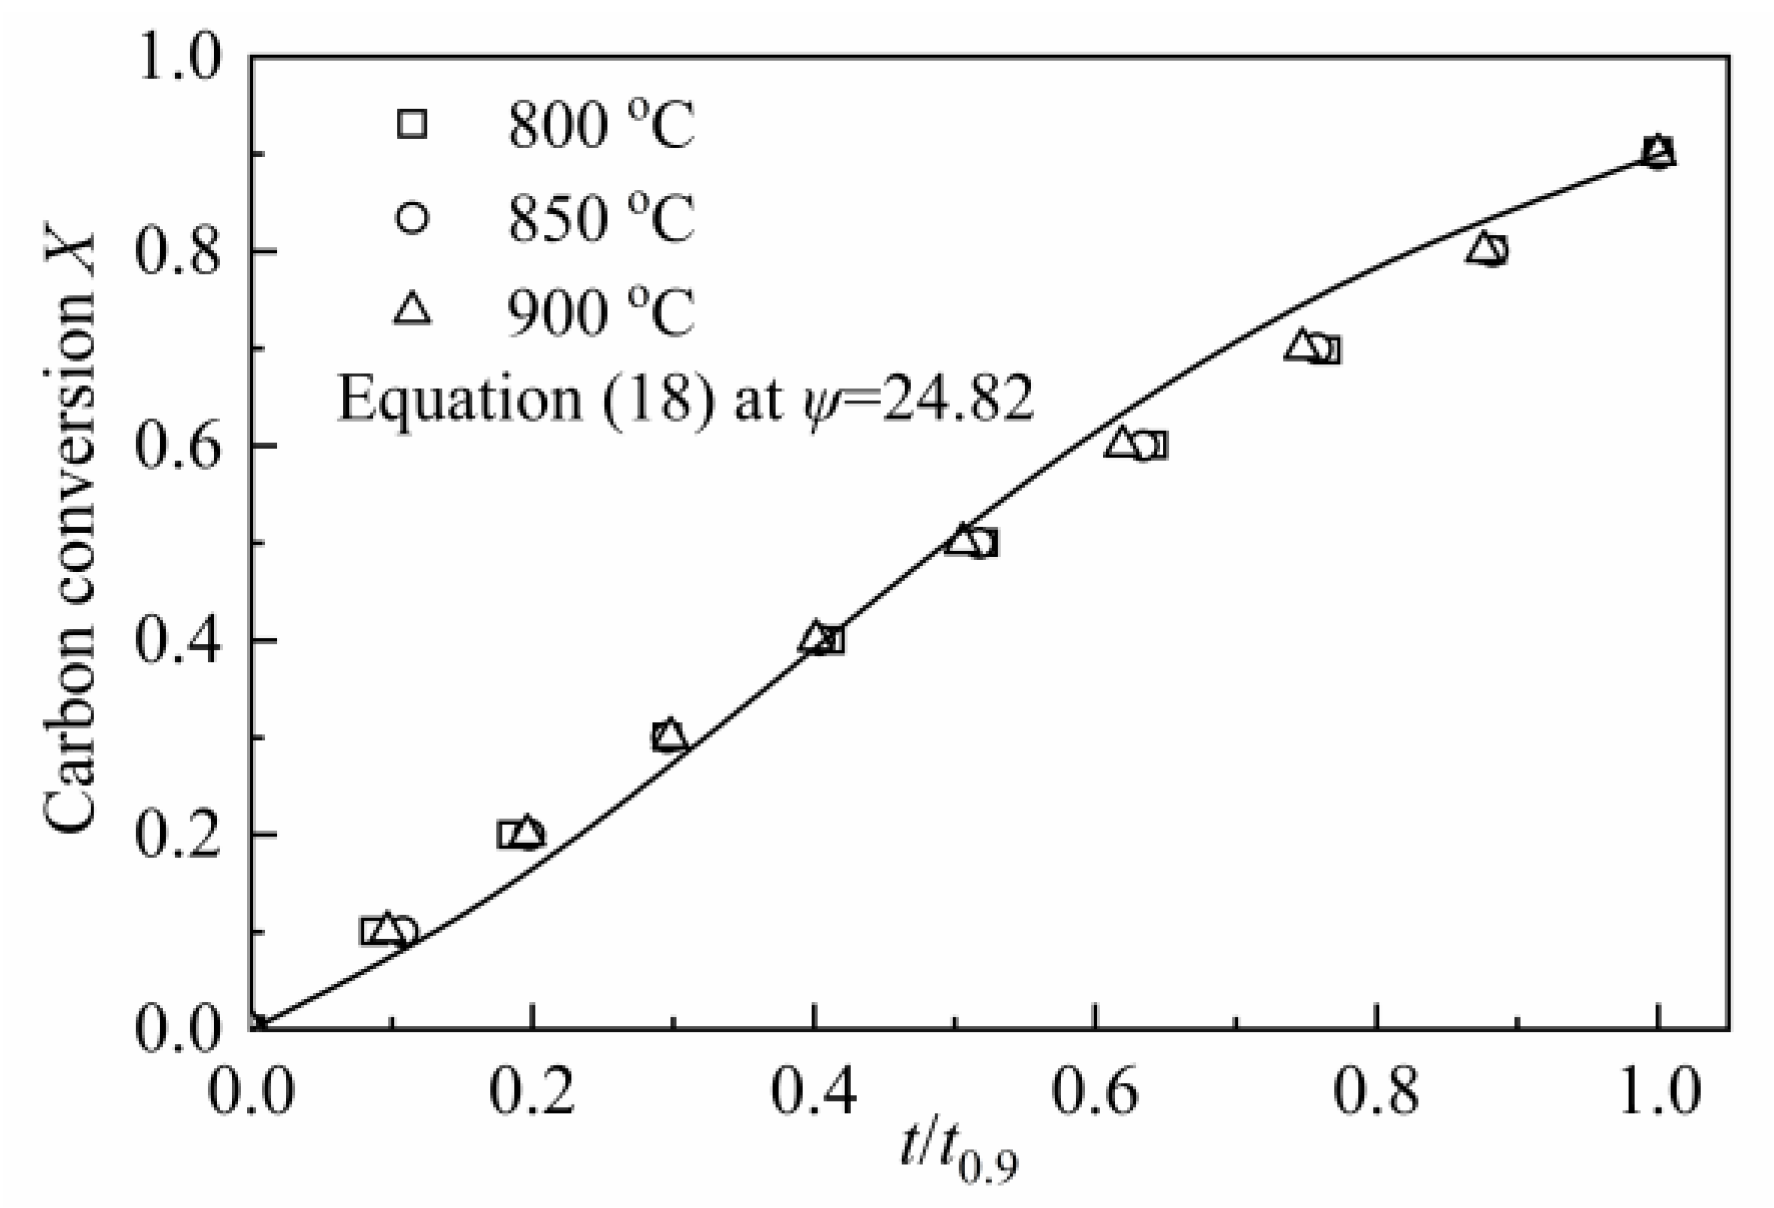
In RPM, ψ was calculated by the method developed by Everson et al. [59], and a reduced time tX/t0.9 was introduced to Equation (18) to calculate ψ:
where tX is the time for carbon conversion reach X and t0.9 is the time for X = 0.9.
According to Equation (19), the value of ψ was calculated as 24.82, which was shown in Figure 8. Compared with the value of ψ (varied from 2 to 12) for CSC in MRPM, it is larger. A high value of ψ indicates a high porosity of the char sample, and more reactions will occur at the internal pores of the char [60]. Other researchers also obtained a high value of ψ by using RPM to describe biomass char gasification, i.e., Wang et al. [23] found the value of ψ for maize cob char, wheat straw char and pine sawdust was 128.24, 88.54 and 149.37, respectively; Lin et al. [6] observed a value of ψ of 15 and 450 for Wood 800-5 and Miscanthus 800-15, respectively.

Figure 8.
Determination of the structural parameter ψ for CSC.
Figure 9 is the Arrhenius plots of H2O-CSC by using reaction constants calculated from VM, GM and RPM. The values of Ea and A obtained by adopting different models are listed in Table 9. Compared with Table 5 or Table 7, the value of Ea for H2O-CSC is higher than CSC, which can be attributed to the loss of catalytic effect of AAEMs after water-leaching process.
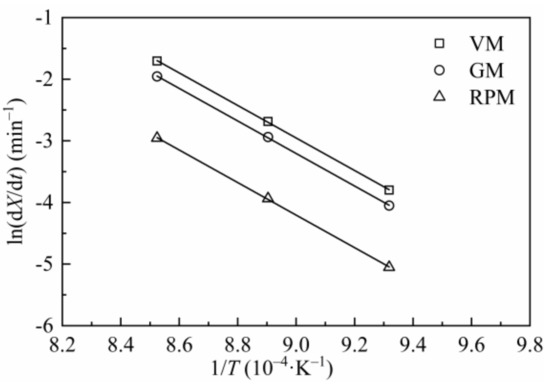
Figure 9.
Arrhenius plots for VM, GM and RPM of H2O-CSC.
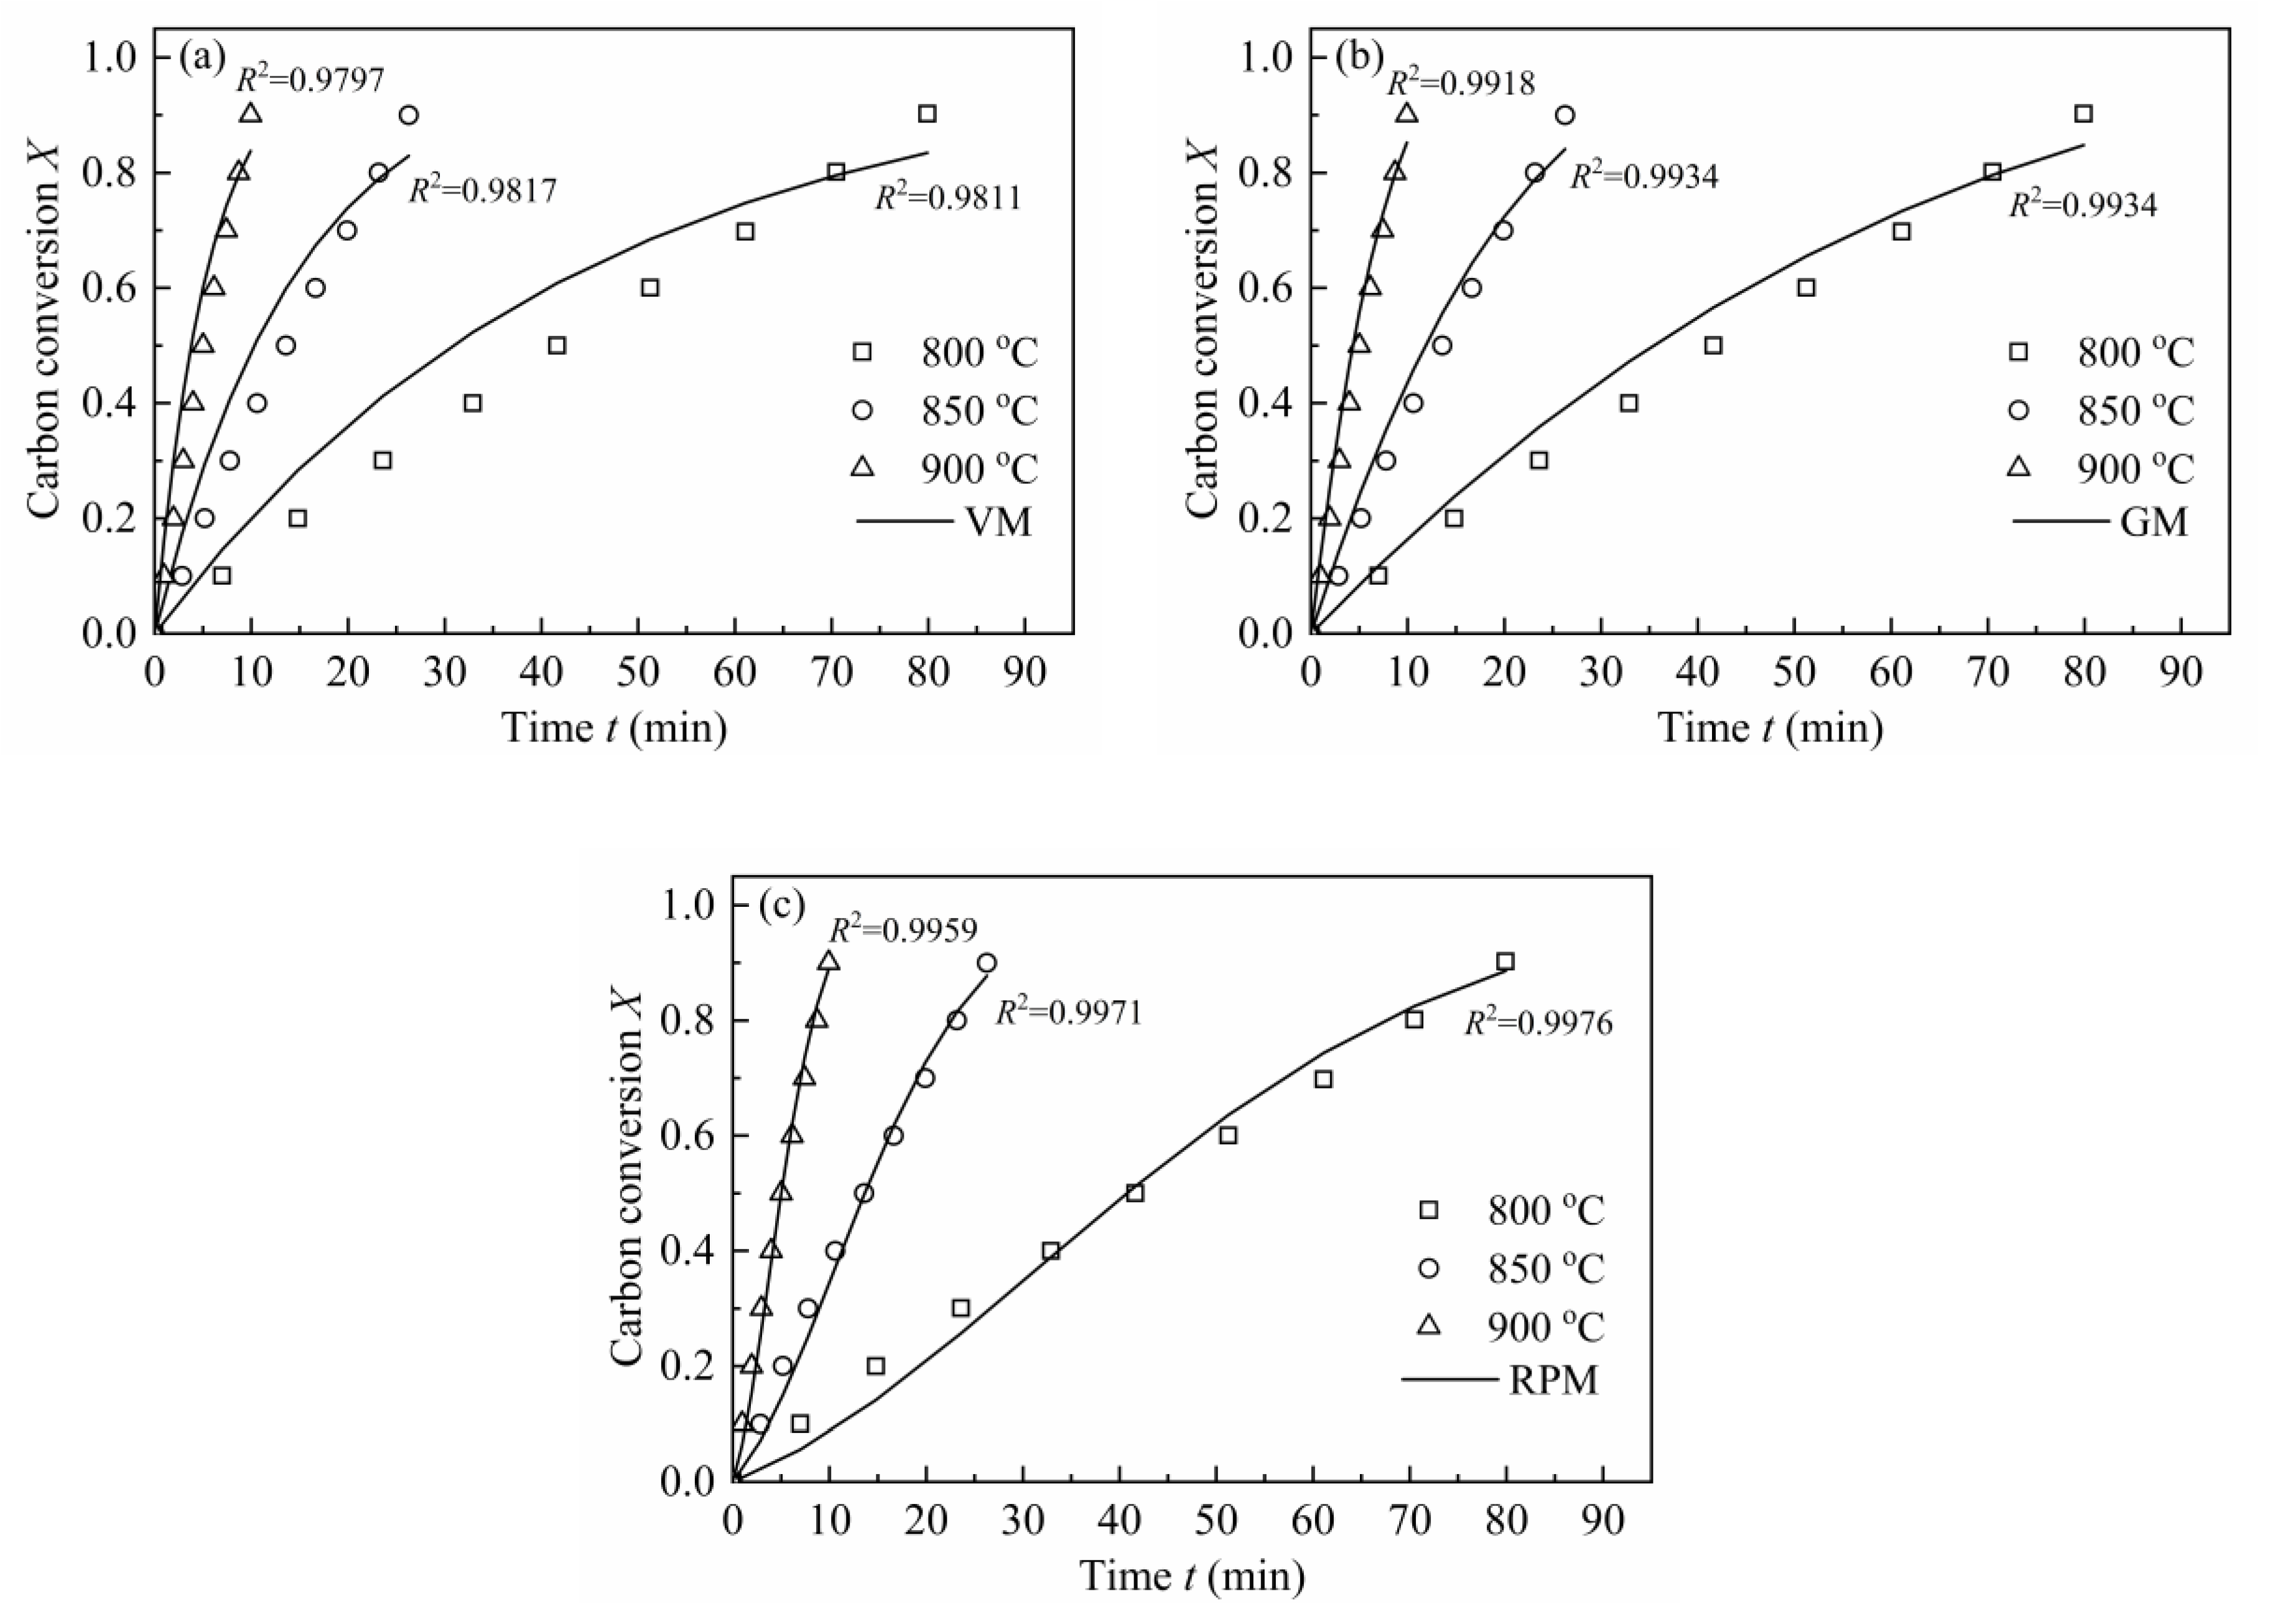
In order to validate each model, the experimental data was compared with the calculated values at different temperatures, which was shown in Figure 10. In accordance with Figure 10, the better the linear relation in Figure 7, the higher goodness of fit between the experimental and model calculation results in Figure 10 will be. In conclusion, MRPM is no longer appropriate for predicting the gasification behaviors of H2O-CSC; instead, RPM gives a better fitting result for H2O-CSC, followed by GM and VM. It can be considered that the loss of AAEM (especially K in this paper) by water leaching leads to the decrease in reaction rate and an obvious change of the shape of dX/dt-X, thus making MRPM inappropriate to evaluate the gasification behaviors of H2O-CSC. However, a deep understanding about the influence of AAEMs on biomass char gasification modeling needs to be explored in future work.

Figure 10.
Comparison between experimental data and calculated values of H2O-CSC by VM, GM, RPM at 0.1 MPa with 10 vol.% H2O.
3.4.3. The Application of the L-H Model to Interpret Biomass Char Gasification
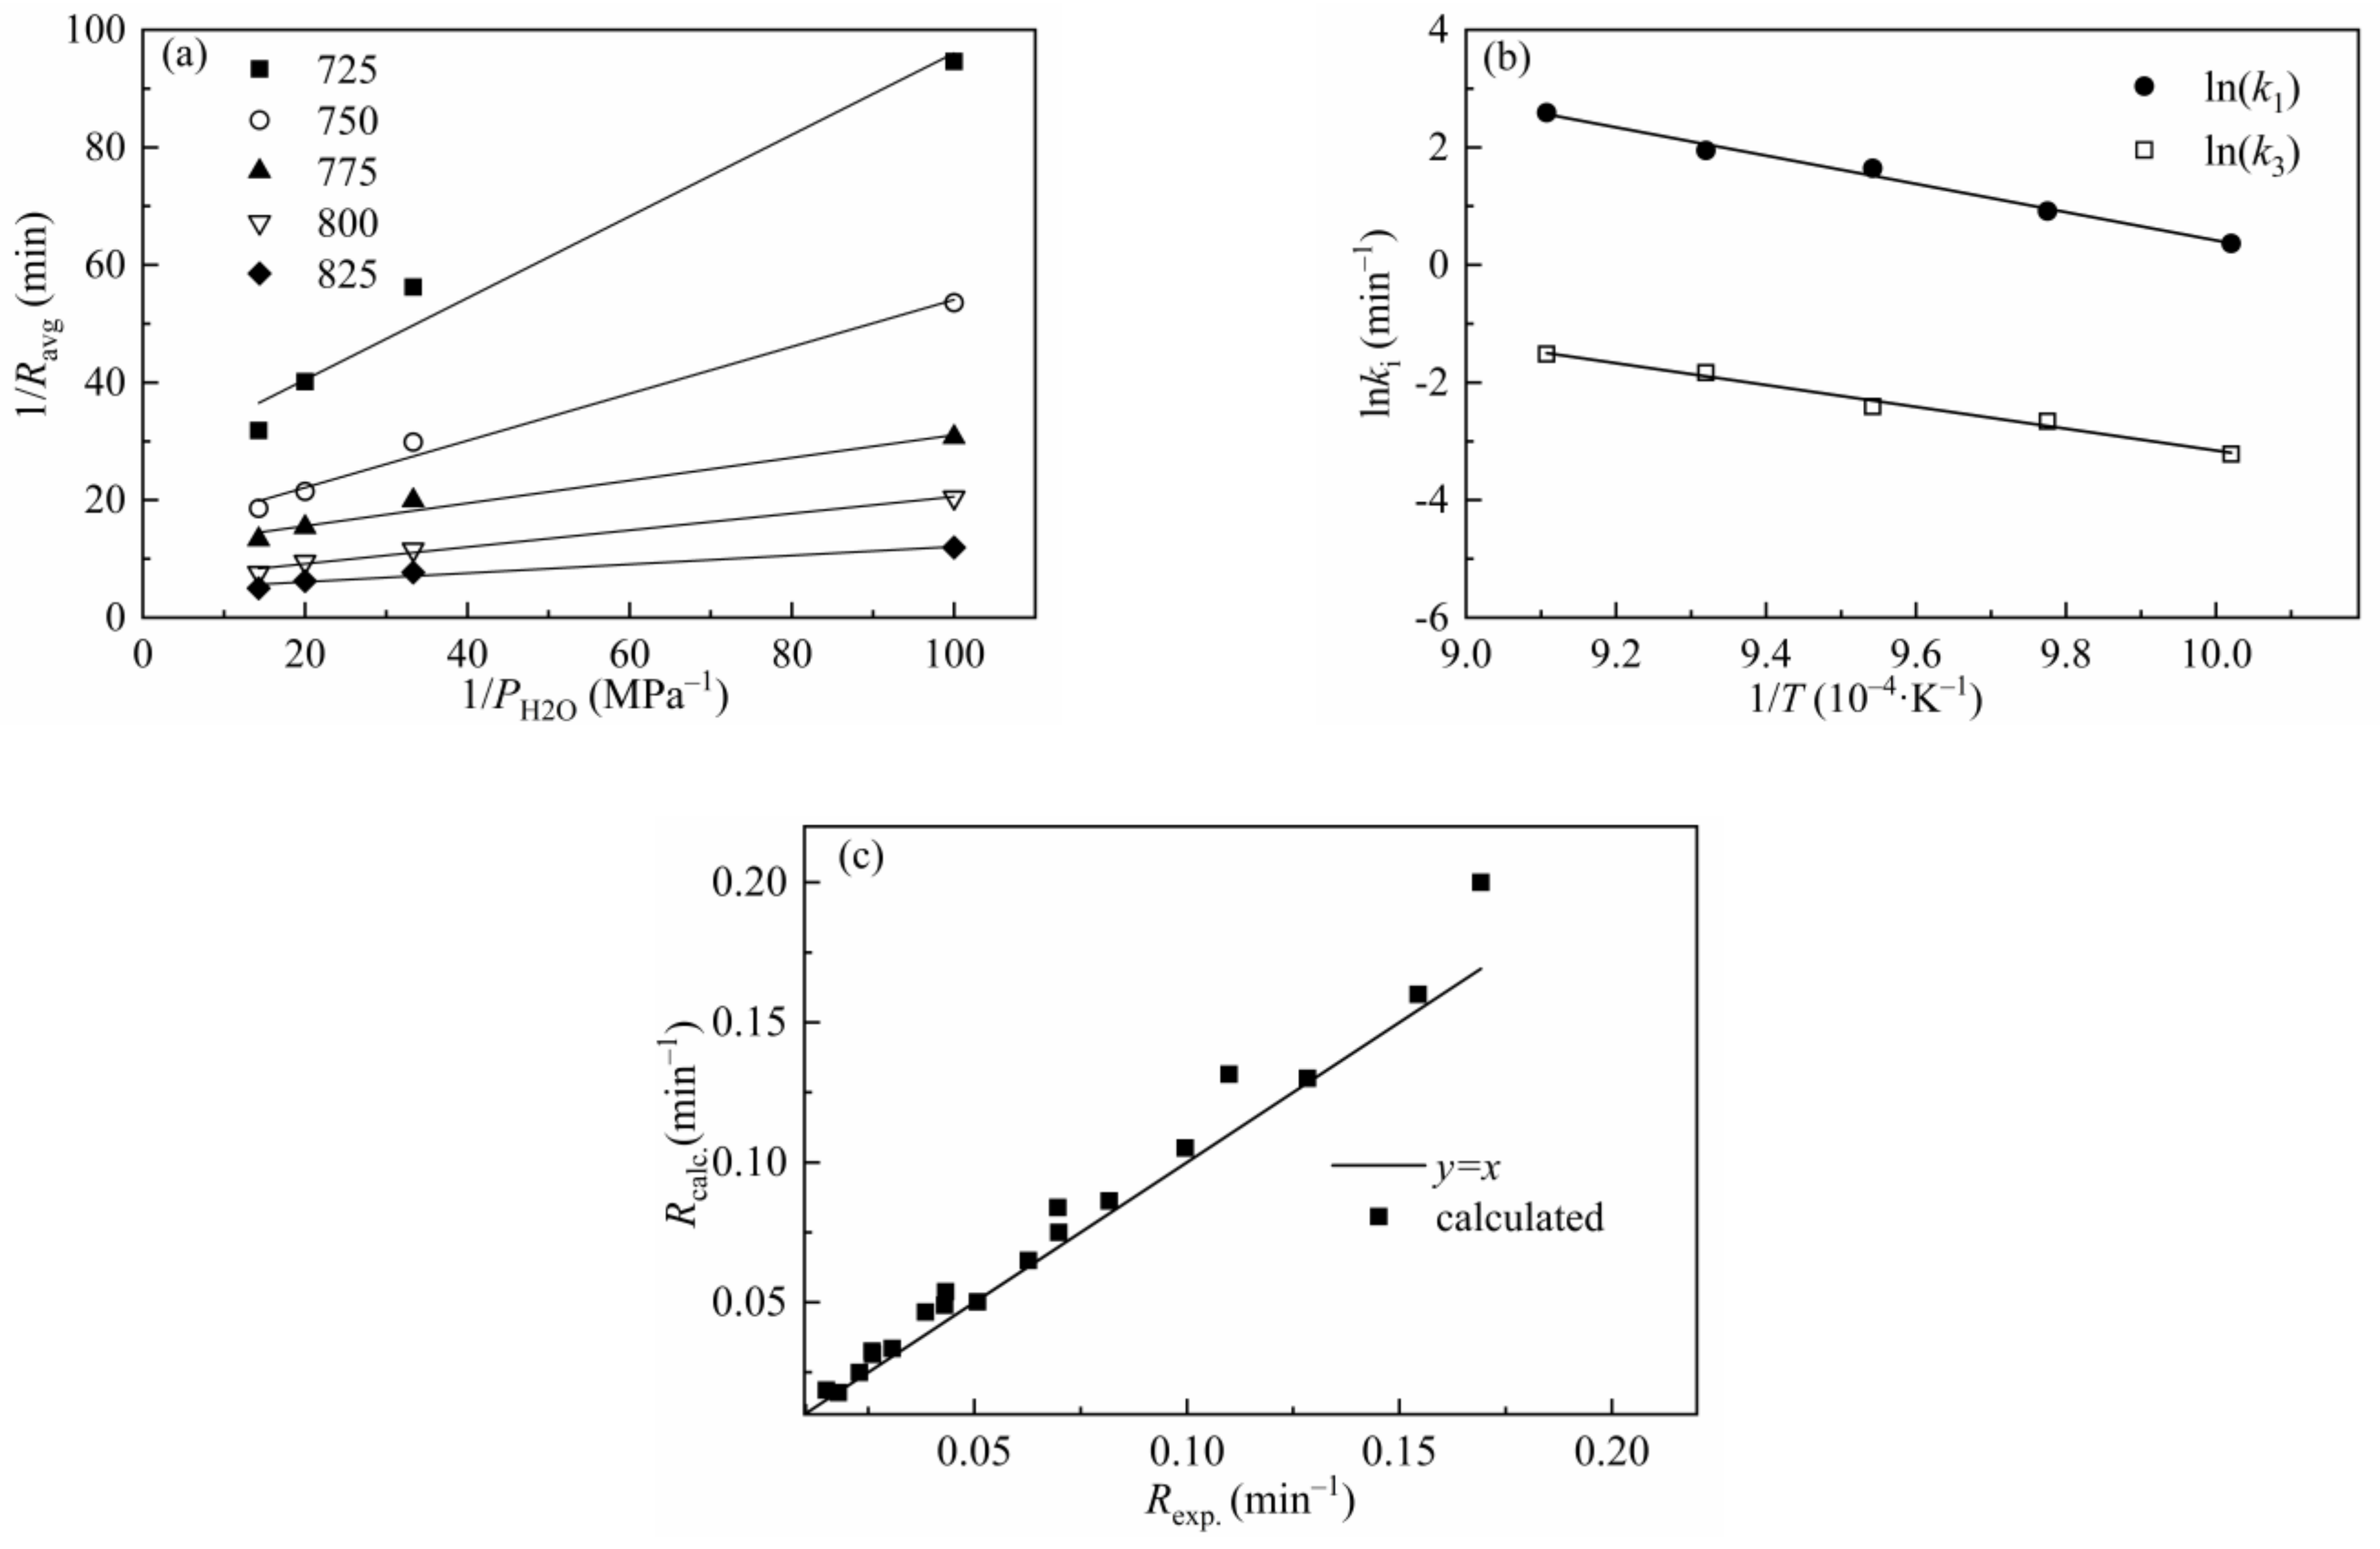
The L-H model has been applied by many researchers to describe the gasification behaviors of char and gave excellent predictions of the gasification results [51,61]. Figure 11 shows 1/R versus 1/P and ln(ki) versus 1/T for CSC at different temperatures and a total pressure of 0.1 MPa, and the goodness of fit of the experimental results versus calculated values is also presented in the figure. Figure 11a,b indicates a good linear correlation between 1/R and 1/P, ln(ki) and 1/T, respectively. Figure 11c shows that most of the calculated data lies near the line of y = x, which indicates that the L-H model can be well applied in the prediction of gasification behavior of CSC. Table 10 lists the kinetic parameters and regression coefficients of the L-H model. The values of Ea1 and Ea3 are 202.08 kJ/mol and 157.84 kJ/mol, respectively. The L-H model can predict the gasification behavior at different temperatures and gasification agent partial pressures without considering the structure characters of gasification materials and can be well applied in the simulation of gasification process.

Figure 11.
Relationship between (a) 1/Ravg and 1/PH2O and (b) ln(ki) and 1/T for CSC; (c) comparison of the experimental results with calculated values of the L-H model.
Table 10.
Kinetic parameters and regression coefficients of L-H model for CSC.
4. Conclusions
The steam gasification behaviors of corn stalk char and water-leached corn stalk char were analyzed in a magnetic suspension balance. Results showed that there were no clear differences of total pressure effect on CSC gasification rate with a fixed steam partial pressure. The influence of temperature on the reaction rate is more obvious at high steam concentrations. The reaction order of CSC steam gasification with respect to steam partial pressure is in the range of 0.43~0.55. The MRPM and L-H model fitted the gasification results of CSC well. Due to the loss of AAEMs caused by water-leaching treatment, the gasification rate of H2O-CSC dropped dramatically, and the value of Ea became higher. Moreover, MRPM can no longer be applied to describe the gasification behaviors of H2O-CSC; instead, RPM gives a better fitting result for H2O-CSC, followed by GM and VM. All the evidence indicates that AAEMs within biomass char have an important influence on its gasification behaviors.
Author Contributions
Conceptualization, Z.Q. and L.D.; methodology, S.Z.; formal analysis, S.Z., Y.R., B.B. and Z.L.; writing—original draft preparation, S.Z.; writing—review and editing, L.D.; supervision, L.D. All authors have read and agreed to the published version of the manuscript.
Funding
This research was funded by National Natural Science Foundation of China (21908176 and 21878243).
Acknowledgments
This work has been supported by the National Natural Science Foundation of China (21908176 and 21878243).
Conflicts of Interest
The authors declare no conflict of interest.
References
- Di Blasi, C. Combustion and gasification rates of lignocellulosic chars. Prog. Energy Combust. Sci. 2009, 35, 121–140. [Google Scholar] [CrossRef]
- Widjaya, E.R.; Chen, G.; Bowtell, L.; Hills, C. Gasification of non-woody biomass: A literature review. Renew. Sustain. Energy Rev. 2018, 89, 184–193. [Google Scholar] [CrossRef] [Green Version]
- Zhang, Y.; Geng, P.; Zheng, Y. Exploration and practice to improve the kinetic analysis of char-CO2 gasification via thermogravimetric analysis. Chem. Eng. J. 2019, 359, 298–304. [Google Scholar] [CrossRef]
- Safarian, S.; Unnþórsson, R.; Richter, C. A review of biomass gasification modelling. Renew. Sustain. Energy Rev. 2019, 110, 378–391. [Google Scholar] [CrossRef]
- Gao, X.; Zhang, Y.; Li, B.; Zhao, Y.; Jiang, B. Determination of the intrinsic reactivities for carbon dioxide gasification of rice husk chars through using random pore model. Bioresour. Technol. 2016, 218, 1073–1081. [Google Scholar] [CrossRef]
- Lin, L.; Strand, M. Investigation of the intrinsic CO2 gasification kinetics of biomass char at medium to high temperatures. Appl. Energy 2013, 109, 220–228. [Google Scholar] [CrossRef]
- Chew, J.J.; Soh, M.; Sunarso, J.; Yong, S.-T.; Doshi, V.; Bhattacharya, S. Isothermal kinetic study of CO2 gasification of torrefied oil palm biomass. Biomass Bioenergy 2020, 134, 105487. [Google Scholar] [CrossRef]
- Strandberg, A.; Holmgren, P.; Wagner, D.R.; Molinder, R.; Wiinikka, H.; Umeki, K.; Broström, M. Effects of Pyrolysis Conditions and Ash Formation on Gasification Rates of Biomass Char. Energy Fuels 2017, 31, 6507–6514. [Google Scholar] [CrossRef]
- Cetin, E.; Moghtaderi, B.; Gupta, R.; Wall, T.F. Biomass gasification kinetics: Influences of pressure and char structure. Combust. Sci. Technol. 2005, 177, 765–791. [Google Scholar] [CrossRef]
- Okumura, Y.; Hanaoka, T.; Sakanishi, K. Effect of pyrolysis conditions on gasification reactivity of woody biomass-derived char. Proc. Combust. Inst. 2009, 32, 2013–2020. [Google Scholar] [CrossRef]
- Septien, S.; Escudero Sanz, F.J.; Salvador, S.; Valin, S. The effect of pyrolysis heating rate on the steam gasification reactivity of char from woodchips. Energy 2018, 142, 68–78. [Google Scholar] [CrossRef] [Green Version]
- Dahou, T.; Defoort, F.; Thiéry, S.; Grateau, M.; Campargue, M.; Bennici, S.; Jeguirim, M.; Dupont, C. The Influence of Char Preparation and Biomass Type on Char Steam Gasification Kinetics. Energies 2018, 11, 2126. [Google Scholar] [CrossRef] [Green Version]
- Xiao, R.; Yang, W. Kinetics characteristics of straw semi-char gasification with carbon dioxide. Bioresour. Technol. 2016, 207, 180–187. [Google Scholar] [CrossRef] [PubMed]
- Feng, D.; Zhao, Y.; Zhang, Y.; Sun, S.; Gao, J. Steam Gasification of Sawdust Biochar Influenced by Chemical Speciation of Alkali and Alkaline Earth Metallic Species. Energies 2018, 11, 205. [Google Scholar] [CrossRef] [Green Version]
- Kirtania, K.; Axelsson, J.; Matsakas, L.; Christakopoulos, P.; Umeki, K.; Furusjö, E. Kinetic study of catalytic gasification of wood char impregnated with different alkali salts. Energy 2017, 118, 1055–1065. [Google Scholar] [CrossRef]
- Sadhwani, N.; Adhikari, S.; Eden, M.R.; Wang, Z.; Baker, R. Southern pines char gasification with CO2—Kinetics and effect of alkali and alkaline earth metals. Fuel Process. Technol. 2016, 150, 64–70. [Google Scholar] [CrossRef] [Green Version]
- Perander, M.; DeMartini, N.; Brink, A.; Kramb, J.; Karlström, O.; Hemming, J.; Moilanen, A.; Konttinen, J.; Hupa, M. Catalytic effect of Ca and K on CO2 gasification of spruce wood char. Fuel 2015, 150, 464–472. [Google Scholar] [CrossRef]
- Lahijani, P.; Zainal, Z.A.; Mohamed, A.R.; Mohammadi, M. CO2 gasification reactivity of biomass char: Catalytic influence of alkali, alkaline earth and transition metal salts. Bioresour. Technol. 2013, 144, 288–295. [Google Scholar] [CrossRef]
- Zhang, Y.; Ashizawa, M.; Kajitani, S.; Miura, K. Proposal of a semi-empirical kinetic model to reconcile with gasification reactivity profiles of biomass chars. Fuel 2008, 87, 475–481. [Google Scholar] [CrossRef]
- Dupont, C.; Nocquet, T.; Da Costa, J.A., Jr.; Verne-Tournon, C. Kinetic modelling of steam gasification of various woody biomass chars: Influence of inorganic elements. Bioresour. Technol. 2011, 102, 9743–9748. [Google Scholar] [CrossRef]
- Mitsuoka, K.; Hayashi, S.; Amano, H.; Kayahara, K.; Sasaoaka, E.; Uddin, M.A. Gasification of woody biomass char with CO2: The catalytic effects of K and Ca species on char gasification reactivity. Fuel Process. Technol. 2011, 92, 26–31. [Google Scholar] [CrossRef]
- Long, J.; Song, H.; Jun, X.; Sheng, S.; Lun-shi, S.; Kai, X.; Yao, Y. Release characteristics of alkali and alkaline earth metallic species during biomass pyrolysis and steam gasification process. Bioresour. Technol. 2012, 116, 278–284. [Google Scholar] [CrossRef]
- Wang, G.; Zhang, J.; Shao, J.; Liu, Z.; Wang, H.; Li, X.; Zhang, P.; Geng, W.; Zhang, G. Experimental and modeling studies on CO2 gasification of biomass chars. Energy 2016, 114, 143–154. [Google Scholar] [CrossRef] [Green Version]
- Ding, L.; Zhang, Y.; Wang, Z.; Huang, J.; Fang, Y. Interaction and its induced inhibiting or synergistic effects during co-gasification of coal char and biomass char. Bioresour. Technol. 2014, 173, 11–20. [Google Scholar] [CrossRef] [PubMed]
- Dahou, T.; Defoort, F.; Jeguirim, M.; Dupont, C. Towards understanding the role of K during biomass steam gasification. Fuel 2020, 282, 118806. [Google Scholar] [CrossRef]
- Wang, Y.; Bell, D.A. Reaction kinetics of Powder River Basin coal gasification in carbon dioxide using a modified drop tube reactor. Fuel 2015, 140, 616–625. [Google Scholar] [CrossRef]
- Jing, X.; Wang, Z.; Yu, Z.; Zhang, Q.; Li, C.; Fang, Y. Experimental and Kinetic Investigations of CO2 Gasification of Fine Chars Separated from a Pilot-Scale Fluidized-Bed Gasifier. Energy Fuels 2013, 27, 2422–2430. [Google Scholar] [CrossRef]
- Kajitani, S.; Hara, S.; Matsuda, H. Gasification rate analysis of coal char with a pressurized drop tube furnace. Fuel 2002, 81, 539–546. [Google Scholar] [CrossRef]
- Peng, F.F.; Lee, I.C.; Yang, R.Y.K. Reactivities of in situ and ex situ coal chars during gasification in steam at 1000–1400 °C. Fuel Process. Technol. 1995, 41, 233–251. [Google Scholar] [CrossRef]
- Arnold, R.A.; Habibi, R.; Kopyscinski, J.; Hill, J.M. Interaction of Potassium and Calcium in the Catalytic Gasification of Biosolids and Switchgrass. Energy Fuels 2017, 31, 6240–6247. [Google Scholar] [CrossRef]
- Zhang, R.; Wang, Q.H.; Luo, Z.Y.; Fang, M.X.; Cen, K.F. Competition and Inhibition Effects during Coal Char Gasification in the Mixture of H2O and CO2. Energy Fuels 2013, 27, 5107–5115. [Google Scholar] [CrossRef]
- Roberts, D.G.; Harris, D.J. A Kinetic Analysis of Coal Char Gasification Reactions at High Pressures. Energy Fuels 2006, 20, 2314–2320. [Google Scholar] [CrossRef]
- Dupont, C.; Jacob, S.; Marrakchy, K.O.; Hognon, C.; Grateau, M.; Labalette, F.; Da Silva Perez, D. How inorganic elements of biomass influence char steam gasification kinetics. Energy 2016, 109, 430–435. [Google Scholar] [CrossRef]
- Song, Y.-C.; Li, Q.-T.; Li, F.-Z.; Wang, L.-S.; Hu, C.-C.; Feng, J.; Li, W.-Y. Pathway of biomass-potassium migration in co-gasification of coal and biomass. Fuel 2019, 239, 365–372. [Google Scholar] [CrossRef]
- Chen, G.; Yu, Q.; Sjöström, K. Reactivity of char from pyrolysis of birch wood. J. Anal. Appl. Pyrolysis 1997, 40–41, 491–499. [Google Scholar] [CrossRef]
- DeGroot, W.F.; Shafizadeh, F. Kinetics of gasification of Douglas Fir and Cottonwood chars by carbon dioxide. Fuel 1984, 63, 210–216. [Google Scholar] [CrossRef]
- Fermoso, J.; Stevanov, C.; Moghtaderi, B.; Arias, B.; Pevida, C.; Plaza, M.G.; Rubiera, F.; Pis, J.J. High-pressure gasification reactivity of biomass chars produced at different temperatures. J. Anal. Appl. Pyrolysis 2009, 85, 287–293. [Google Scholar] [CrossRef]
- Fermoso, J.; Arias, B.; Pevida, C.; Plaza, M.G.; Rubiera, F.; Pis, J.J. Kinetic models comparison for steam gasification of different nature fuel chars. J. Therm. Anal. Calorim. 2008, 91, 779–786. [Google Scholar] [CrossRef] [Green Version]
- Tanner, J.; Bhattacharya, S. Kinetics of CO2 and steam gasification of Victorian brown coal chars. Chem. Eng. J. 2016, 285, 331–340. [Google Scholar] [CrossRef]
- Fermoso, J.; Gil, M.V.; Garcia, S.; Pevida, C.; Pis, J.J.; Rubiera, F. Kinetic Parameters and Reactivity for the Steam Gasification of Coal Chars Obtained under Different Pyrolysis Temperatures and Pressures. Energy Fuels 2011, 25, 3574–3580. [Google Scholar] [CrossRef] [Green Version]
- Seo, D.K.; Lee, S.K.; Kang, M.W.; Hwang, J.; Yu, T.-U. Gasification reactivity of biomass chars with CO2. Biomass Bioenergy 2010, 34, 1946–1953. [Google Scholar] [CrossRef]
- Wang, Y.; Bell, D.A. Competition between H2O and CO2 during the gasification of Powder River Basin coal. Fuel 2017, 187, 94–102. [Google Scholar] [CrossRef]
- Wall, T.F.; Liu, G.-s.; Wu, H.-w.; Roberts, D.G.; Benfell, K.E.; Gupta, S.; Lucas, J.A.; Harris, D.J. The effects of pressure on coal reactions during pulverised coal combustion and gasification. Prog. Energy Combust. Sci. 2002, 28, 405–433. [Google Scholar] [CrossRef]
- Roberts, D.G.; Harris, D.J.; Wall, T.F. Total pressure effects on chemical reaction rates of chars with O2, CO2 and H2O. Fuel 2000, 79, 1997–1998. [Google Scholar] [CrossRef]
- Park, H.Y.; Ahn, D.H. Gasification kinetics of five coal chars with CO2 at elevated pressure. Korean J. Chem. Eng. 2007, 24, 24–30. [Google Scholar] [CrossRef]
- Vyazovkin, S.; Wight, C.A. Model-free and model-fitting approaches to kinetic analysis of isothermal and nonisothermal data. Thermochim. Acta 1999, 340–341, 53–68. [Google Scholar] [CrossRef]
- Vyazovkin, S. Computational aspects of kinetic analysis. Part C. The ICTAC Kinetics Project—The light at the end of the tunnel? Thermochim. Acta 2000, 355, 155–163. [Google Scholar] [CrossRef]
- Lahijani, P.; Zainal, Z.A.; Mohamed, A.R. Catalytic effect of iron species on CO2 gasification reactivity of oil palm shell char. Thermochim. Acta 2012, 546, 24–31. [Google Scholar] [CrossRef]
- Roberts, D.G.; Hodge, E.M.; Harris, D.J.; Stubington, J.F. Kinetics of Char Gasification with CO2 under Regime II Conditions: Effects of Temperature, Reactant, and Total Pressure. Energy Fuels 2010, 24, 5300–5308. [Google Scholar] [CrossRef]
- Yuan, S.; Dai, Z.-H.; Zhou, Z.-J.; Chen, X.-L.; Yu, G.-S.; Wang, F.-C. Rapid co-pyrolysis of rice straw and a bituminous coal in a high-frequency furnace and gasification of the residual char. Bioresour. Technol. 2012, 109, 188–197. [Google Scholar] [CrossRef]
- Zhang, R.; Wang, Q.H.; Luo, Z.Y.; Fang, M.X.; Cen, K.F. Coal Char Gasification in the Mixture of H2O, CO2, H2, and CO under Pressured Conditions. Energy Fuels 2014, 28, 832–839. [Google Scholar] [CrossRef]
- Marquez-Montesinos, F.; Cordero, T.; Rodriguez-Mirasol, J.; Rodriguez, J.J. CO2 and steam gasification of a grapefruit skin char. Fuel 2002, 81, 423–429. [Google Scholar] [CrossRef]
- Lopez, G.; Alvarez, J.; Amutio, M.; Arregi, A.; Bilbao, J.; Olazar, M. Assessment of steam gasification kinetics of the char from lignocellulosic biomass in a conical spouted bed reactor. Energy 2016, 107, 493–501. [Google Scholar] [CrossRef]
- Bhatia, S.K.; Perlmutter, D.D. A random pore model for fluid-solid reactions: I. Isothermal, kinetic control. AIChE J. 1980, 26, 379–386. [Google Scholar] [CrossRef]
- Lahijani, P.; Zainal, Z.A.; Mohamed, A.R.; Mohammadi, M. Co-gasification of tire and biomass for enhancement of tire-char reactivity in CO2 gasification process. Bioresour. Technol. 2013, 138, 124–130. [Google Scholar] [CrossRef]
- Feng, D.; Zhao, Y.; Zhang, Y.; Xu, H.; Zhang, L.; Sun, S. Catalytic mechanism of ion-exchanging alkali and alkaline earth metallic species on biochar reactivity during CO2/H2O gasification. Fuel 2018, 212, 523–532. [Google Scholar] [CrossRef]
- Jiang, L.; Hu, S.; Sun, L.-S.; Su, S.; Xu, K.; He, L.-M.; Xiang, J. Influence of different demineralization treatments on physicochemical structure and thermal degradation of biomass. Bioresour. Technol. 2013, 146, 254–260. [Google Scholar] [CrossRef]
- González-Vázquez, M.P.; García, R.; Gil, M.V.; Pevida, C.; Rubiera, F. Unconventional biomass fuels for steam gasification: Kinetic analysis and effect of ash composition on reactivity. Energy 2018, 155, 426–437. [Google Scholar] [CrossRef]
- Everson, R.C.; Neomagus, H.W.J.P.; Kaitano, R.; Falcon, R.; du Cann, V.M. Properties of high ash coal-char particles derived from inertinite-rich coal: II. Gasification kinetics with carbon dioxide. Fuel 2008, 87, 3403–3408. [Google Scholar] [CrossRef]
- Ahmed, I.I.; Gupta, A.K. Kinetics of woodchips char gasification with steam and carbon dioxide. Appl. Energy 2011, 88, 1613–1619. [Google Scholar] [CrossRef]
- Fermoso, J.; Gil, M.V.; Borrego, A.G.; Pevida, C.; Pis, J.J.; Rubiera, F. Effect of the Pressure and Temperature of Devolatilization on the Morphology and Steam Gasification Reactivity of Coal Chars. Energy Fuels 2010, 24, 5586–5595. [Google Scholar] [CrossRef] [Green Version]


Publisher’s Note: MDPI stays neutral with regard to jurisdictional claims in published maps and institutional affiliations. |
© 2021 by the authors. Licensee MDPI, Basel, Switzerland. This article is an open access article distributed under the terms and conditions of the Creative Commons Attribution (CC BY) license (https://creativecommons.org/licenses/by/4.0/).