1. Introduction
The decarbonization of energy is accelerating to achieve the Paris Agreement’s goal of limiting global warming to well below 2 (preferably 1.5) degrees Celsius, compared with pre-industrial levels [
1]. The investment in renewable energy remains high in 2021, and the momentum is as strong as ever. This trend is expected to continue [
2].
Despite national efforts, future population growth and the development of economic activities will create further demand for electricity. It will be more important to use energy efficiently and to promote the use of renewable energy [
3]. Furthermore, the installation costs of renewable energy decrease year by year [
4,
5] thus, more renewable energy will be connected to the grid in the future.
However, the generation of renewable energy, such as photovoltaic (PV) or wind power, is highly weather-dependent [
6], and can sometimes generate excessive amounts of power, which can adversely affect the quality of grid power if linked to the grid [
7,
8]. The key to solving this problem is in the technologies that mitigate rapid changes in power generation and high electricity demand. Battery energy storage systems (BESS) play a crucial role in this [
9,
10]. However, if BESS capacity reserved for grid operators is adjusted to when renewable energy sources generate the most power, the total usage rate of BESS will be reduced, and the performance will be lower [
11]. In the end, this will cause a negative impact on the cost of BESS.
On the other hand, if existing assets, such as batteries installed in households and EVs, can be effectively used in addition to dedicated BESS for grid operations, it will be possible to increase the capacity of storage batteries while reducing costs. P2P energy trading is gaining attention for effectively utilizing installed assets [
12,
13], and is a mechanism to flexibly exchange surplus energy generated from distributed power resources (DER) among neighbors [
14]. As the number of participants increases, the number of DER that can be handled will also increase. For that, it is necessary to provide users with incentives to participate in P2P energy trading.
In the first place, if the participants cannot perform the transactions they intend, the system may not be used. Several studies exist that reflect the preferences of participants in P2P energy trading. Reference [
15] proposed an energy management method based on trading priorities that allow prosumers to trade energy as heterogeneous products in the P2P energy market. Reference [
16] describes a method that reflects the ordering styles of participants with multiple parameters. Reference [
17] shows a method for prioritizing transactions nearby.
Economic trading would be a clear incentive for P2P energy trading participants. There are several studies that discuss it from a market mechanism point of view. Reference [
18] shows key indices for P2P market-clearing performance. Reference [
19] compares several auction mechanisms and ordering strategies, then analyzes how they change the outcome in the P2P energy market. Reference [
20] studies a multi-round double auction mechanism for local energy grids.
There are several P2P energy trading pilot projects. For example, the UK’s Piclo [
21] offers a market where consumers can choose a producer/generator, and Vandebron [
22] offers a similar system in the Netherlands.
While there are a few pilot projects that require manual actions to do P2P energy trading, there are not many projects in which trading is done automatically, involve participants, and use hardware for measurement and control. One example that is already in operation is the Brooklyn Microgrid provided by Lo3, but it is not designed to predict the power usage of participants, and then order in advance [
23].
This paper describes a mechanism that enhances users’ participation in P2P energy trading by providing a user-centric cooperative mechanism. Here, orders can be conducted so as to reflect the trading intentions of participants, and energy will be secured in advance by predicting participants’ energy demand and supply. The key components of the incentive for participants to engage in P2P energy trading are described and analyzed. A demonstration experiment conducted in the Higashi-Fuji area of Shizuoka, Japan, is verified as a case study. It is a joint project by Toyota Motor Corporation, the University of Tokyo, and TRENDE Inc. [
24]. Volunteer participants were recruited in a total of 19 households, and 9 of them were each loaned a Toyota Prius, a plugin hybrid vehicle (PHV), for the duration of the experiment. In order to conduct this verification experiment, the following tasks were carried out: recruiting participants, procuring hardware (home energy management system (HEMS), PV, storage batteries, etc.), arranging for construction work, completing application procedures with the grid operator, dealing with hardware problems, managing supply and demand during the demonstration experiment period, and removing the equipment after the verification experiment was completed.
A one-week period of trading results was analyzed to validate whether the defined key components were satisfied or not.
2. User-Centric P2P Energy Trading Platform
2.1. Key Components
This study focuses on the following three key components, which incentivize participants to trade willingly in a user-centric P2P energy trading platform:
The participants can reflect their preferences on the trade (K1);
The participants can trade economically (K2);
The participants can conduct P2P energy trading with lower effort (K3).
Regarding the first point (K1), electricity needs are becoming more diverse. For example, some people wish to purchase renewable energy preferentially. Therefore, it is important to specify the energy to be traded at the time of ordering. As for the second point (K2), even if participants have the means to conduct the desired trade, if it is not conducted economically, the trade will not be sustainable. Therefore, it is also important to measure whether the trade is economically viable. Finally, the third point (K3) is that if participants spend much effort to conduct K1 and K2, it is not feasible unless sufficient benefits are obtained. When dealing with inexpensive resources, such as electricity, it is not easy to obtain a benefit that exceeds the effort expended. Therefore, it is important to ensure that the trade can be processed with little effort.
If these three points are achieved, it will be possible to provide a P2P energy trading platform that incorporates a cooperative mechanism in which P2P energy trading participants with various energy demand characteristics can supplement each other’s energy needs.
2.2. Trading Platform Design
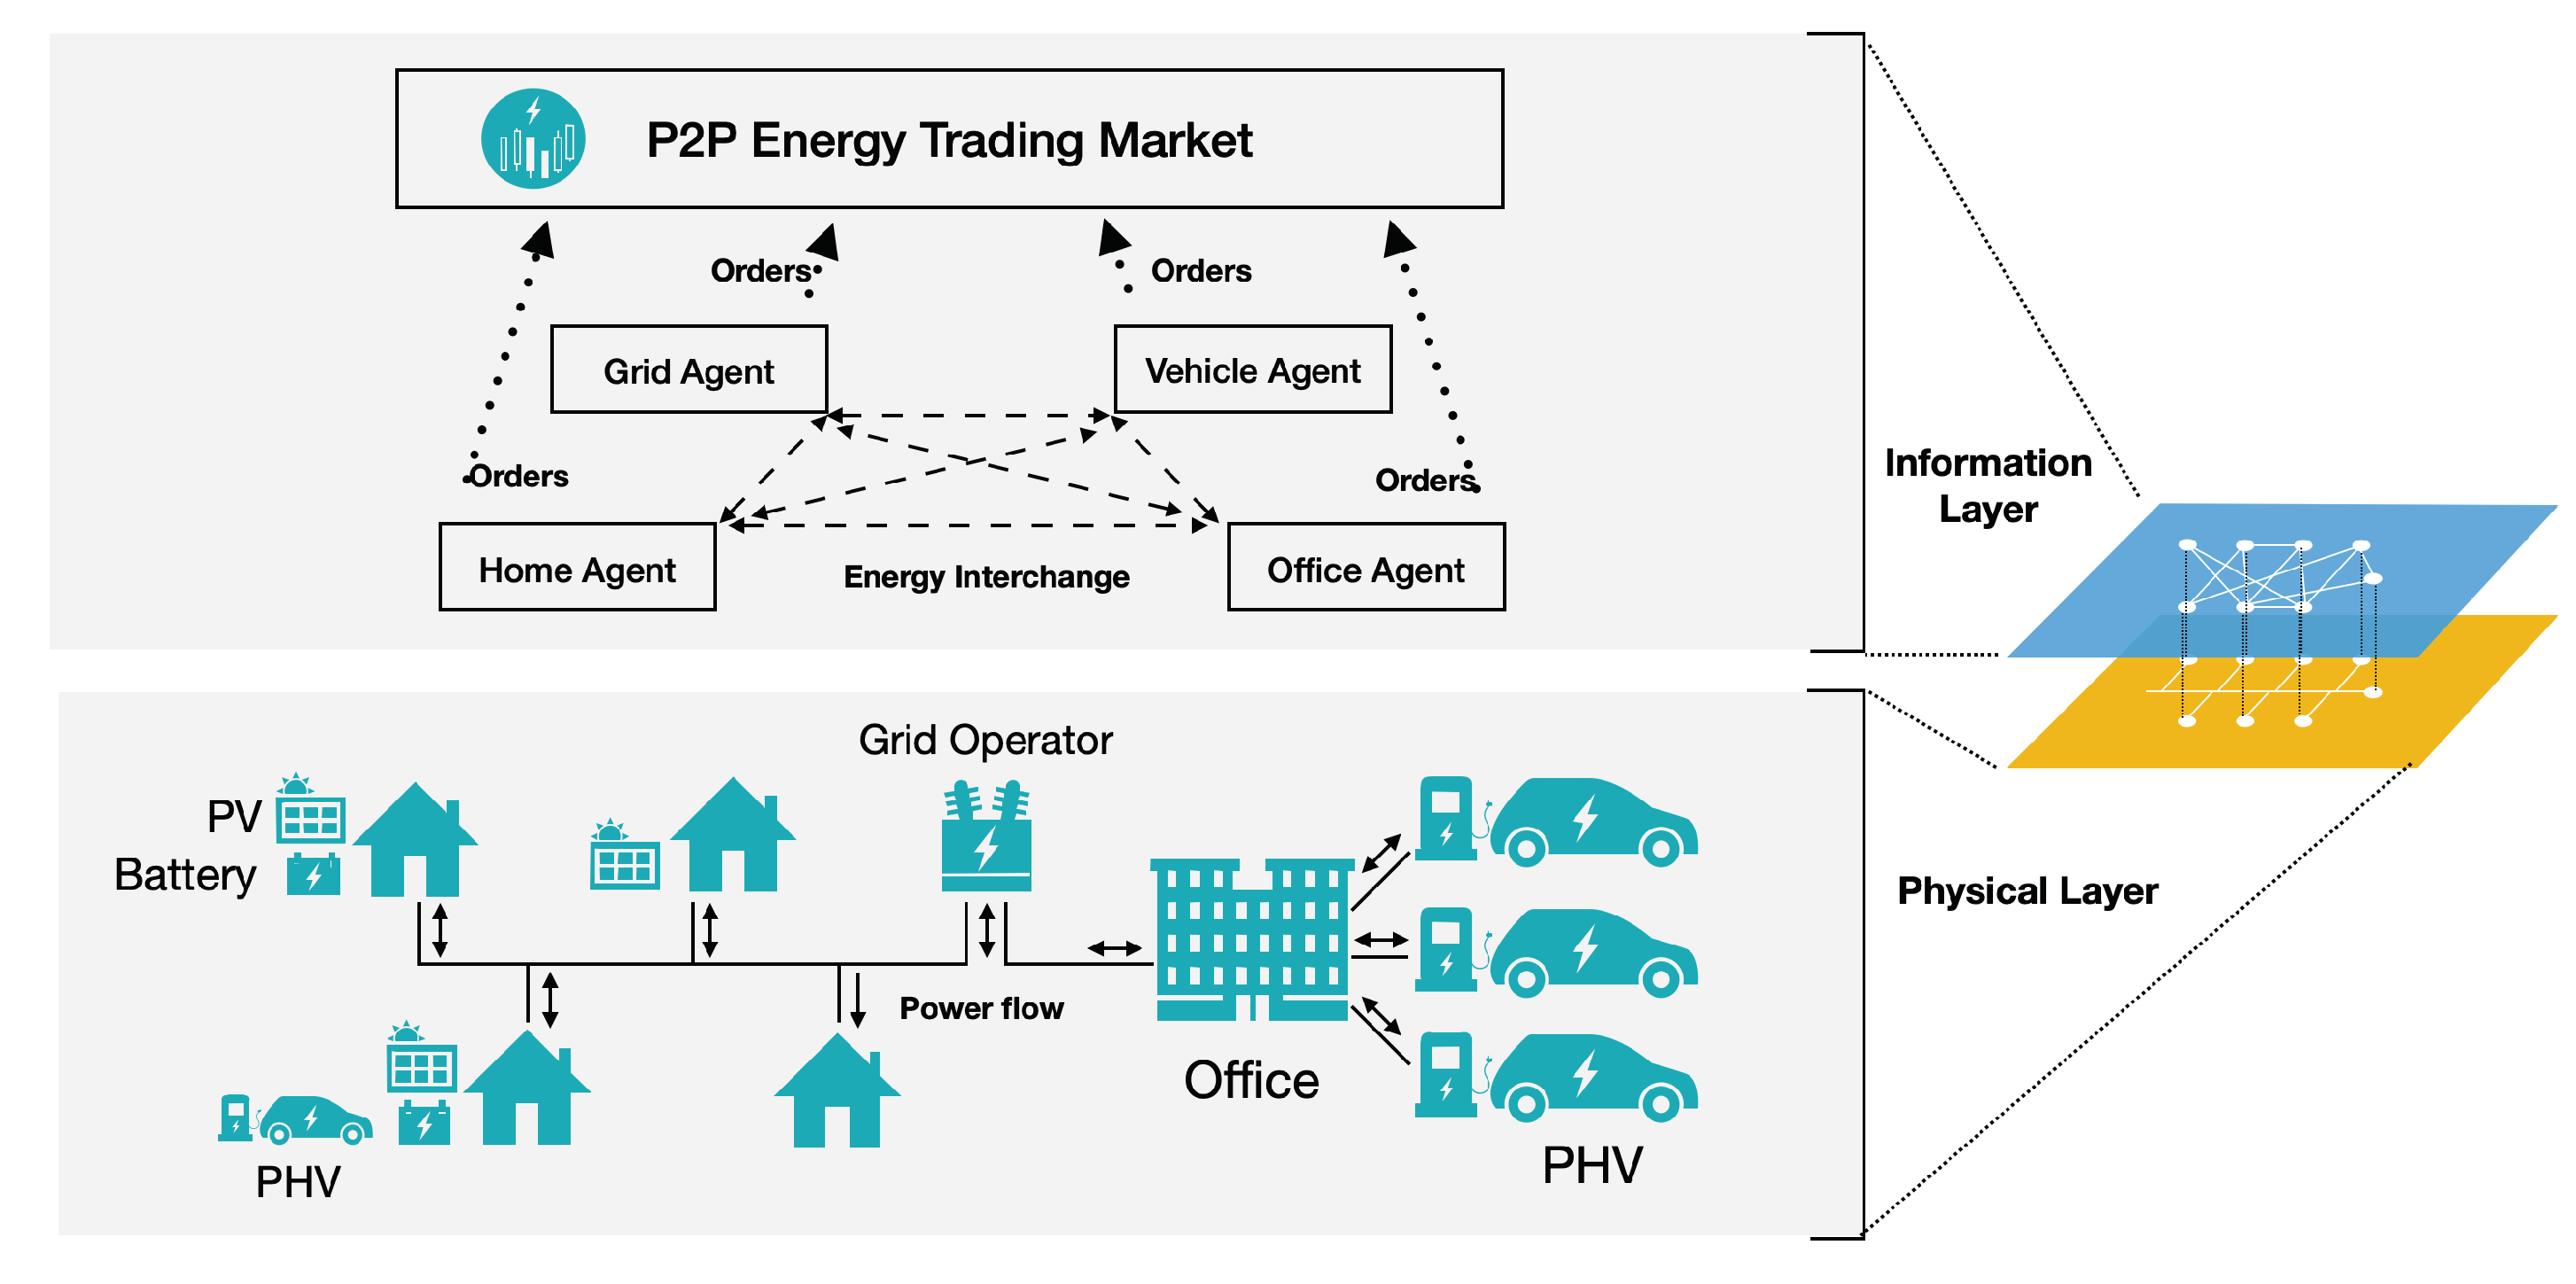
The schematic diagram of the P2P energy trading platform is shown in
Figure 1. The information layer in the figure represents the exchange of transaction information, and the physical layer represents the exchange of electricity. On the information layer in the figure, the virtual P2P energy exchange is performed by trading agents, and the information is treated as if the trading agents are exchanging power with each other, but the actual power exchange is performed using the existing power distribution network on the physical layer.
In order to achieve K1, it is necessary to have a flexible ordering system. Therefore, in this project, in addition to the mandatory information, such as price and quantity, we will add tags as additional information to specify what type of electricity participants want to purchase and in which market they want to trade.
Next, for K2, we will use continuous double auction (CDA) as the market mechanism. CDA is widely used, not only for the financial sector, but also for energy trading all over the world [
25]. There are some studies that utilize CDA to manage P2P energy trading. For example, [
26] shows how P2P energy trading is done with neighbors using a CDA-based market. The use of CDA allows for price-first trading, where the execution price tends to be lower when there are many orders to sell in the market and higher when there are few. With this behavior, supply and demand are naturally adjusted.
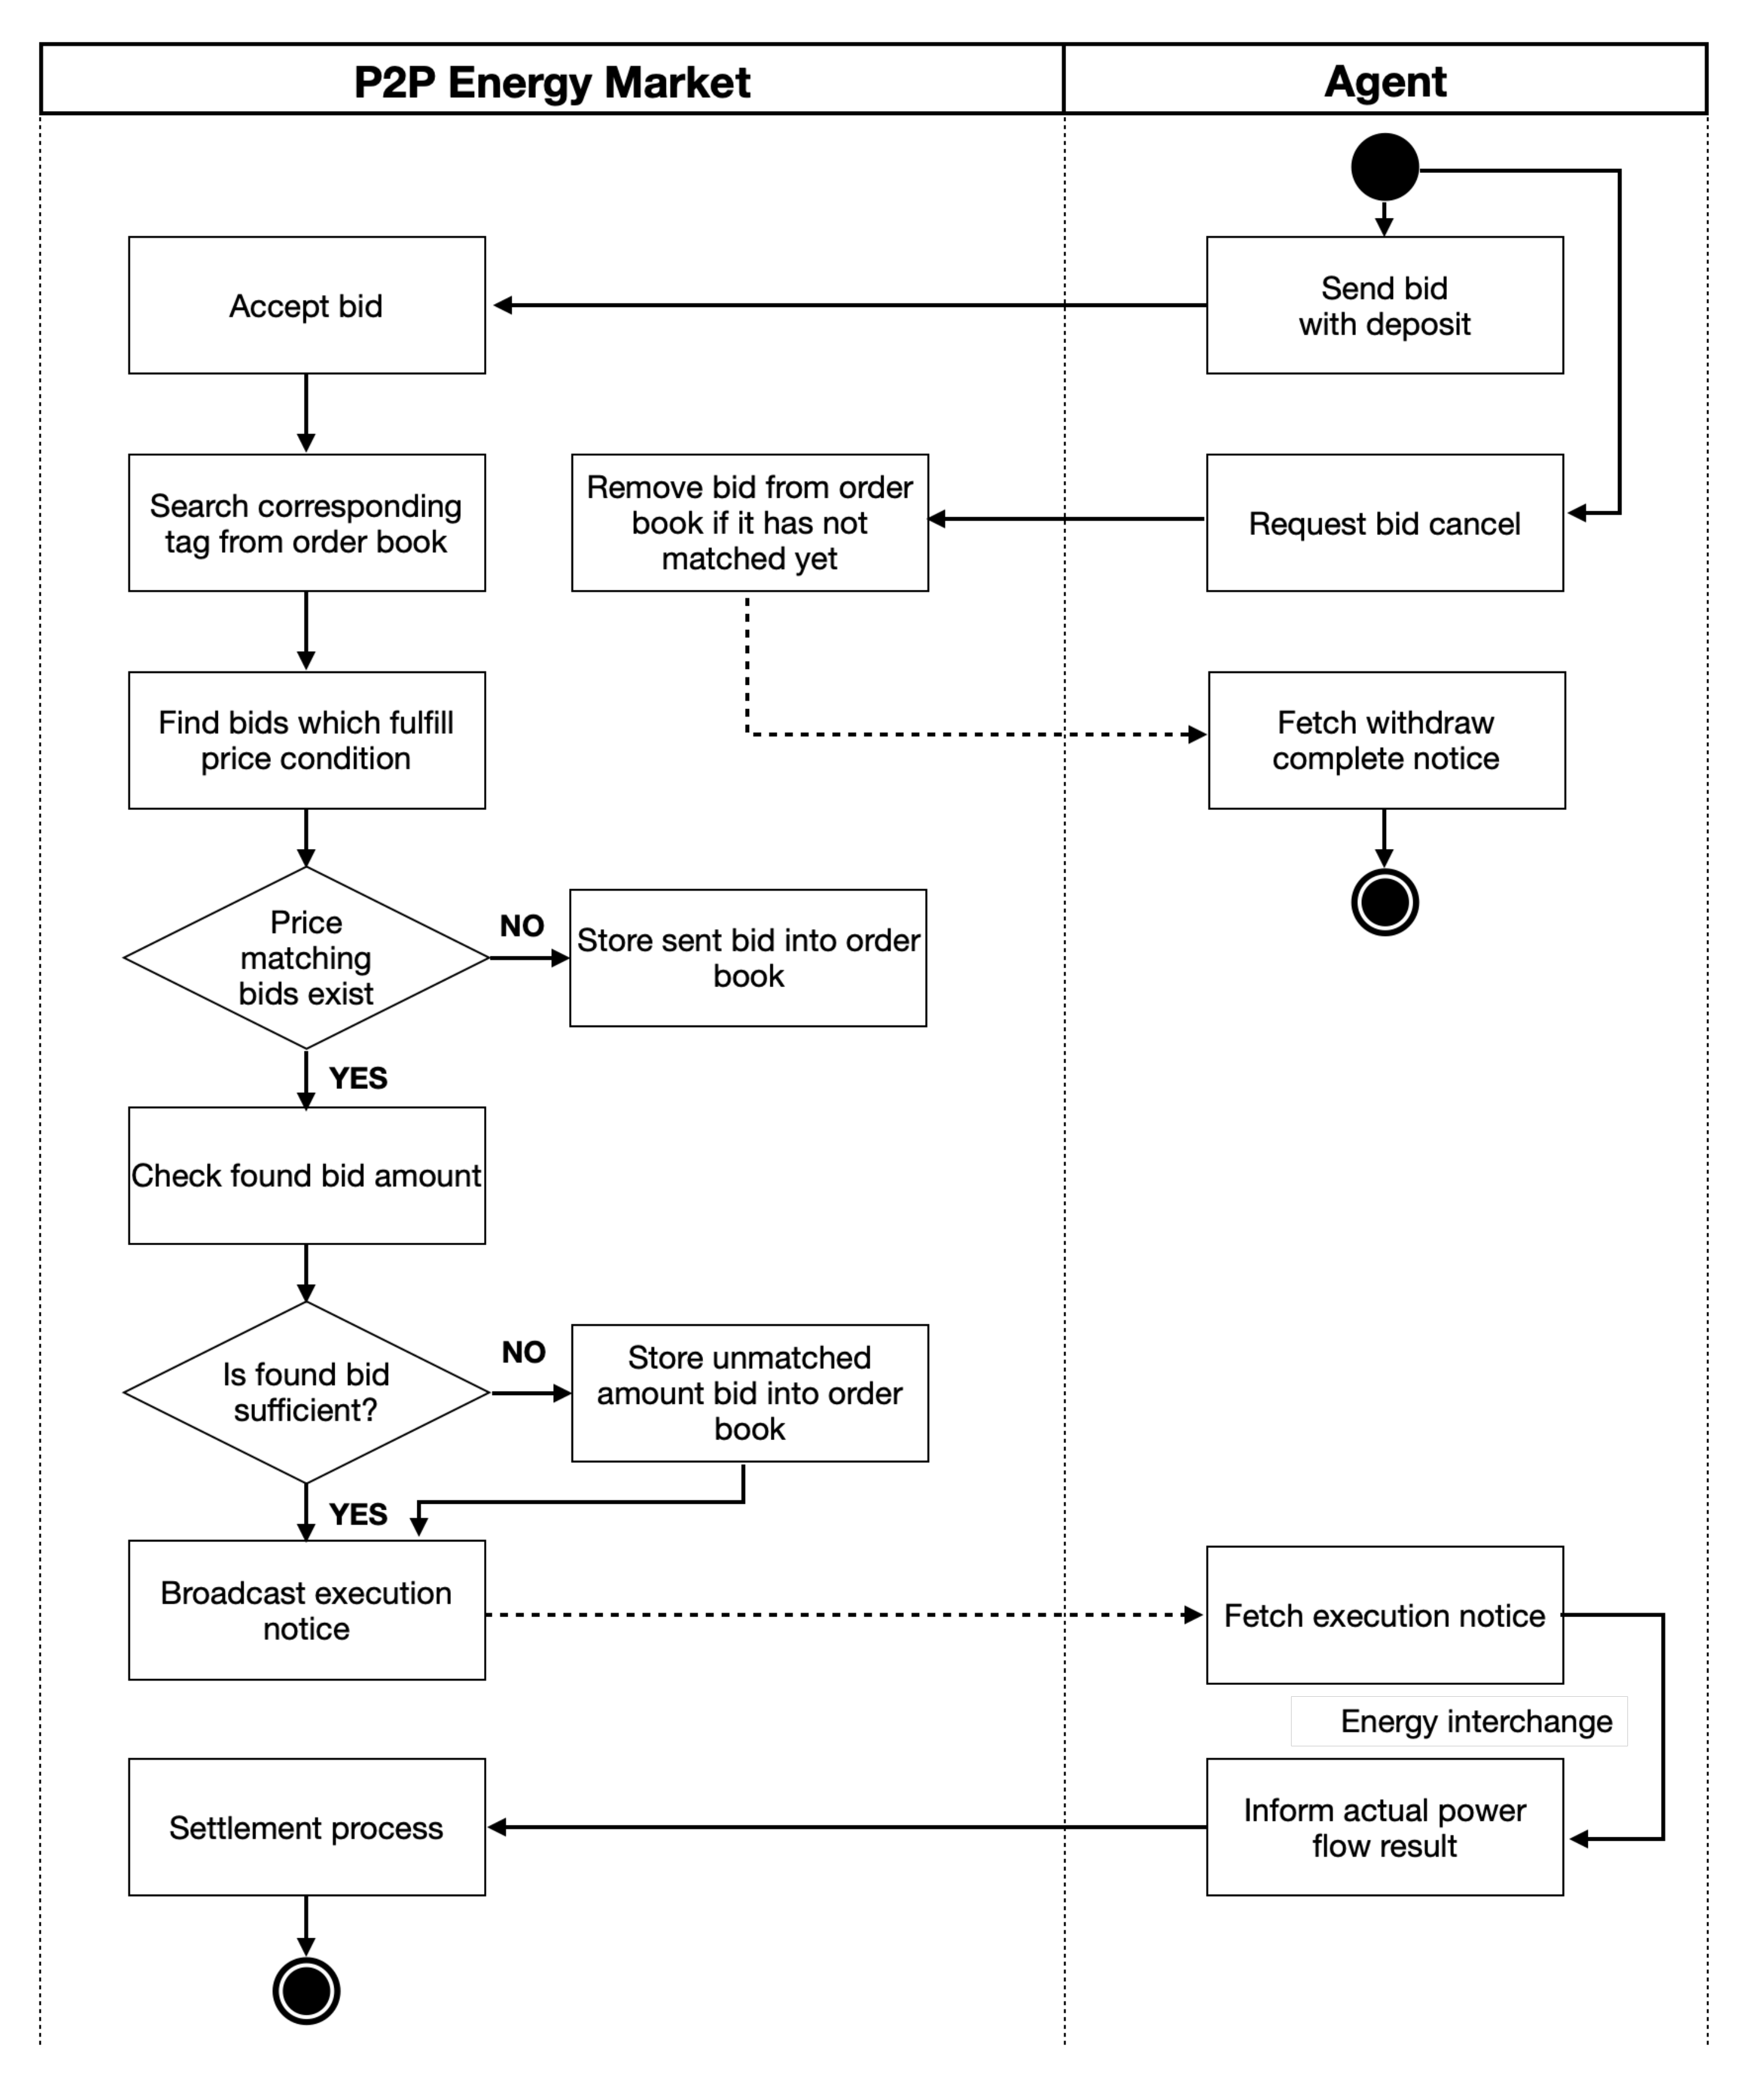
The interaction between the P2P energy trading market and agents is shown in
Figure 2. The P2P energy trading market is built on smart contracts using Ethereum Blockchain on a private network. Proof of authority was employed for the consensus algorithm. A block is generated in about 5 seconds. Ether, the virtual currency of Ethereum, is used for transactions exchanged on the P2P energy trading market.
Markets exist every 30 min; advance ordering can be conducted up to one day (48 slots) ahead of the real-time market. The real-time market gate closure is 10 min before the market ends.
Due to the nature of the blockchain, it is impossible to withdraw the executed price from the agent’s cryptocurrency wallet later. Therefore, the participants must make a deposit when they submit an order. The amount of the deposit
is shown in Equation (
1)
where
is the highest price on the market, which is the same as the price when buying from the grid agent.
is the transmission cost, and
is the order amount. Both the seller and the buyer make deposits.
It is common for buyers to make a deposit, but sellers also need to do so in order to collect a fee from
as a penalty if they make an order and fail to sell enough electricity. The penalty is calculated as the adjustment fee. If a deployed order is not executed, the
is refunded to the agent. There is a different calculation method for the buyer and seller. First, the seller’s adjustment fee is calculated as Equation (
2).
is the actual amount of electricity sold, is the sold amount with the orders, and refers to the highest price in the P2P electricity trading market. In case of excess sales, the grid purchases the excess at the lowest price in the P2P energy trading market (with a post-transfer remittance).
Next, the buyer’s adjustment fee is calculated by Equation (
3). If the buying order amount
is greater than the amount of actual electricity usage
, the adjustment price becomes the difference between the execution price
and
. This payment is made at the time of the completion of the energy interchange in
Figure 2.
If a participant does not follow an execution result, their economic situation will worsen because of this adjustment mechanism. Thus, participants are encouraged to send a precise order and help the platform to remain stable. If the amount of electricity generated is less than the amount of orders submitted by the trading agent, the grid agent will compensate for that amount of electricity. The grid agent collects a fee from the trading agent as an adjustment according to the amount of compensation.
2.3. Trading Agent Design
The trading agent is software that performs P2P energy trading on behalf of the user. In order to achieve K3, it is desirable that all the necessary processing can be done without requiring any manual action by the user. The minimum required functions are listed below.
Measurement;
Prediction;
Ordering.
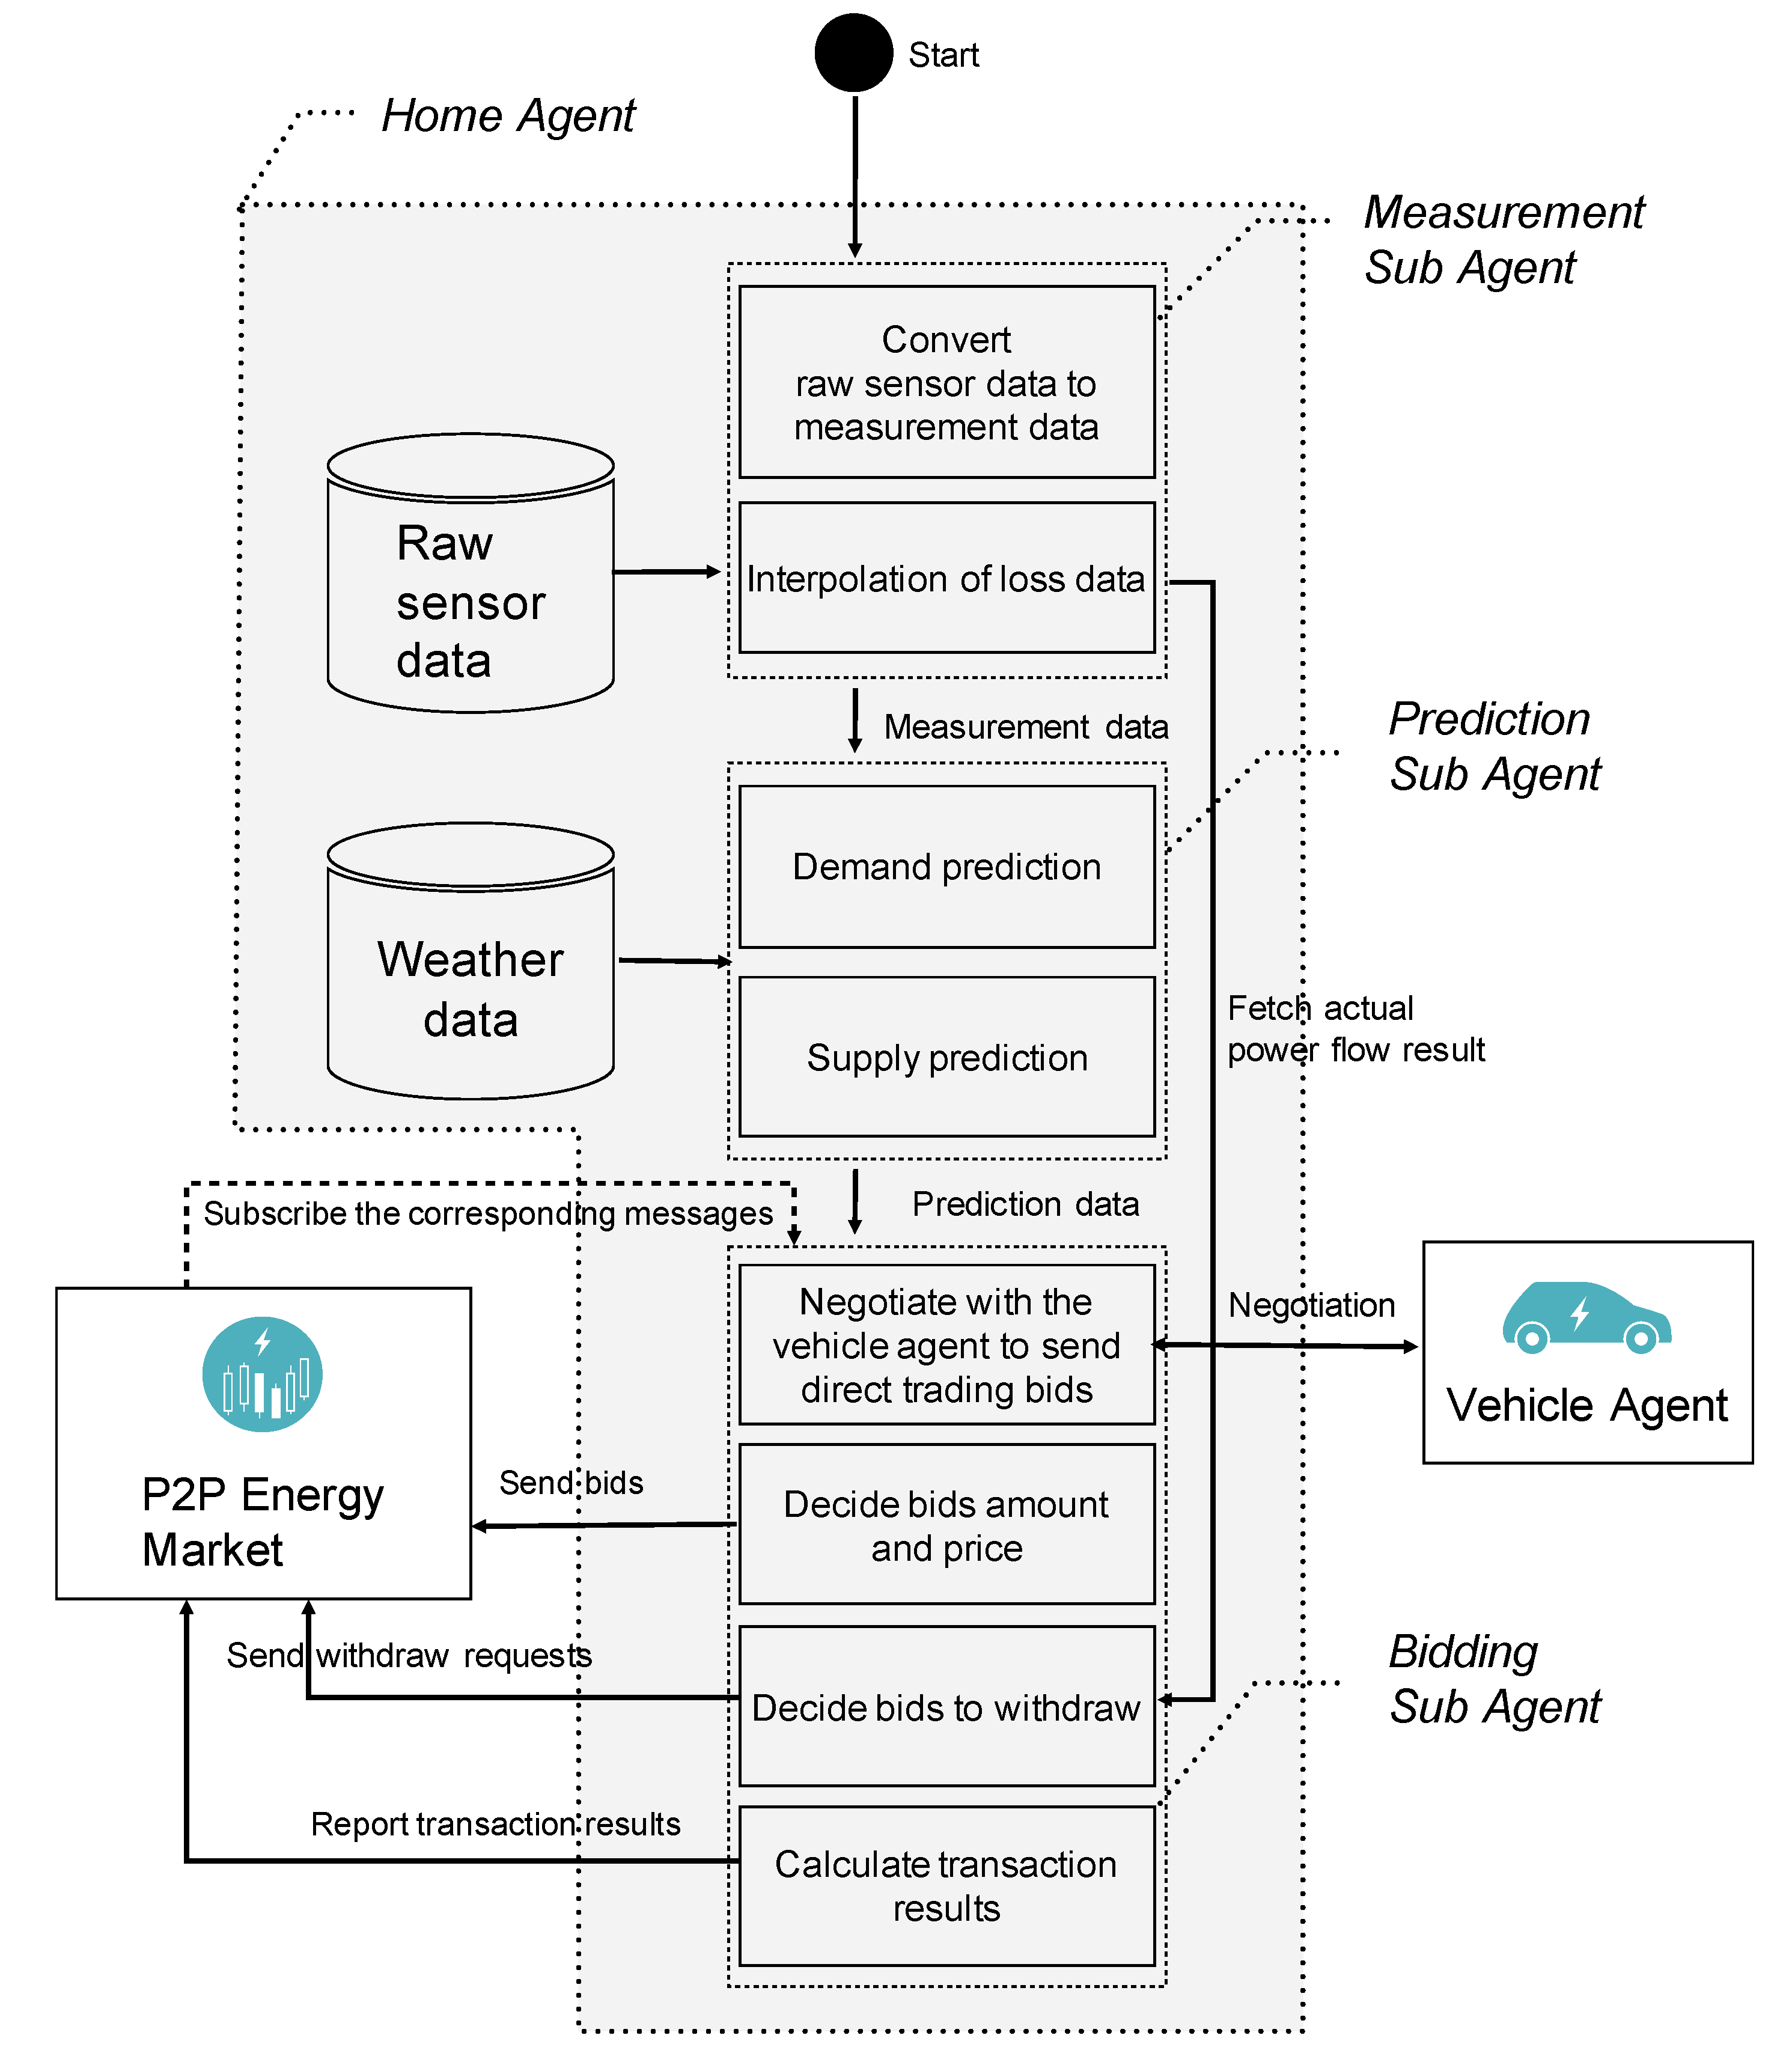
As an example of the trading agent, the configuration of a home agent is described. The overall process of the home agent is shown in
Figure 3.
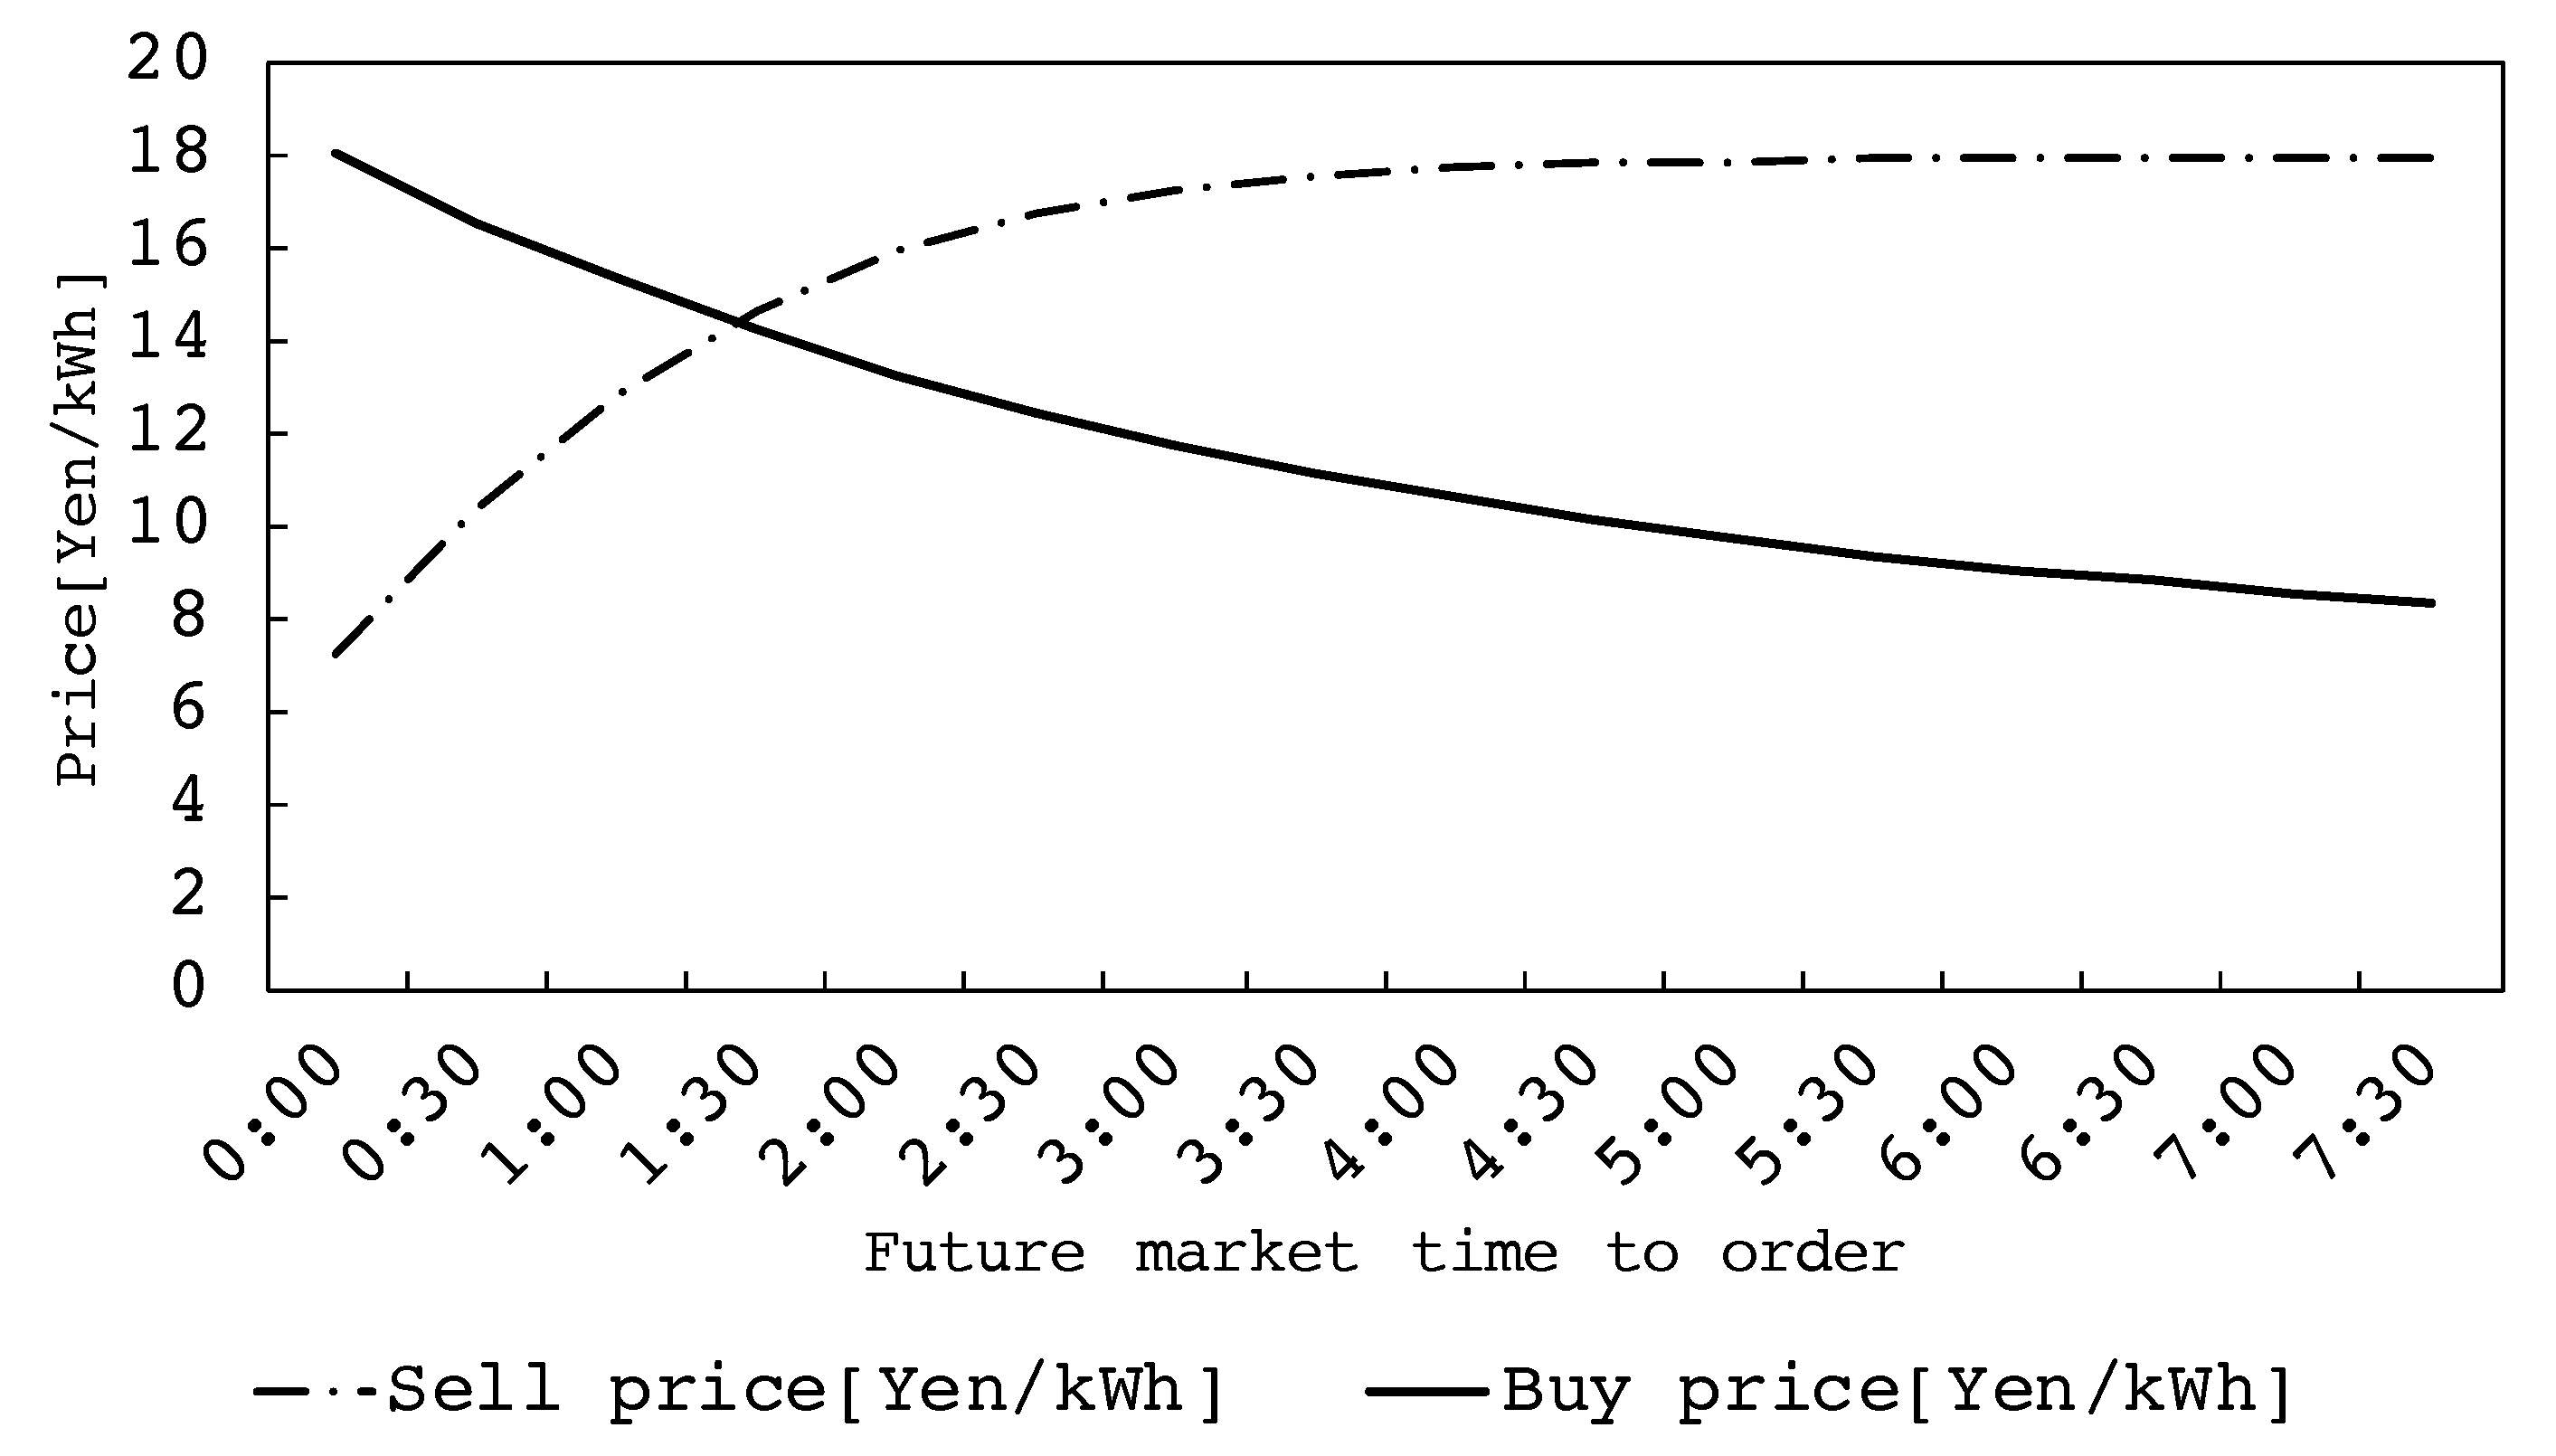
The measurements vary depending on the user’s assets; demand, PV power generation, and battery storage amount are recorded in real-time. The raw data are converted into a data format that can be processed by the agent by interpolating the missing data. Predictions of energy use are also made in real-time using user measurement data, weather forecasts, and the trading results are used to determine the amount of trading orders. To decide the ordering price, a fixed price table is used, as shown in
Figure 4. The desirable price change in the buy order price is a lower price for future orders and a higher price for recent orders. This is because users can order more optimistically in the future. The sell order price is the opposite, with a higher price in the future market.
The home agent also has the ability to negotiate with the vehicle agent of the PHV that is associated with the same owner before ordering, but this is not covered in this paper.
Orders prioritize renewable energy, but will buy grid power if renewable energy cannot be purchased. In order for the trading agent to order on the smart contract in the blockchain, it uses a private key to sign the ordering transaction and deploy it on the blockchain. The deployed orders are constantly monitored, and when an execution occurs, the internal data are updated and reflected in the following order. It also cancels deployed orders if necessary. At the end of the transaction, the amount of power actually used for the execution result is measured, and the information is recorded on the blockchain. The detailed home agent settings are described in
Section 3.2.
3. Case Study: Higashi-Fuji P2P Energy Trading Demonstration Experiment
The overall picture of this experiment is described in
Figure 5. The process required to conduct this demonstration experiment is as follows.
Recruit participants;
Procure hardware (HEMS, PV, storage batteries, etc.);
Arrange for construction work;
Complete application procedures with the grid operator;
Deal with hardware problems and manage supply and demand during the demonstration experiment period;
Remove the equipment after the verification experiment is completed.
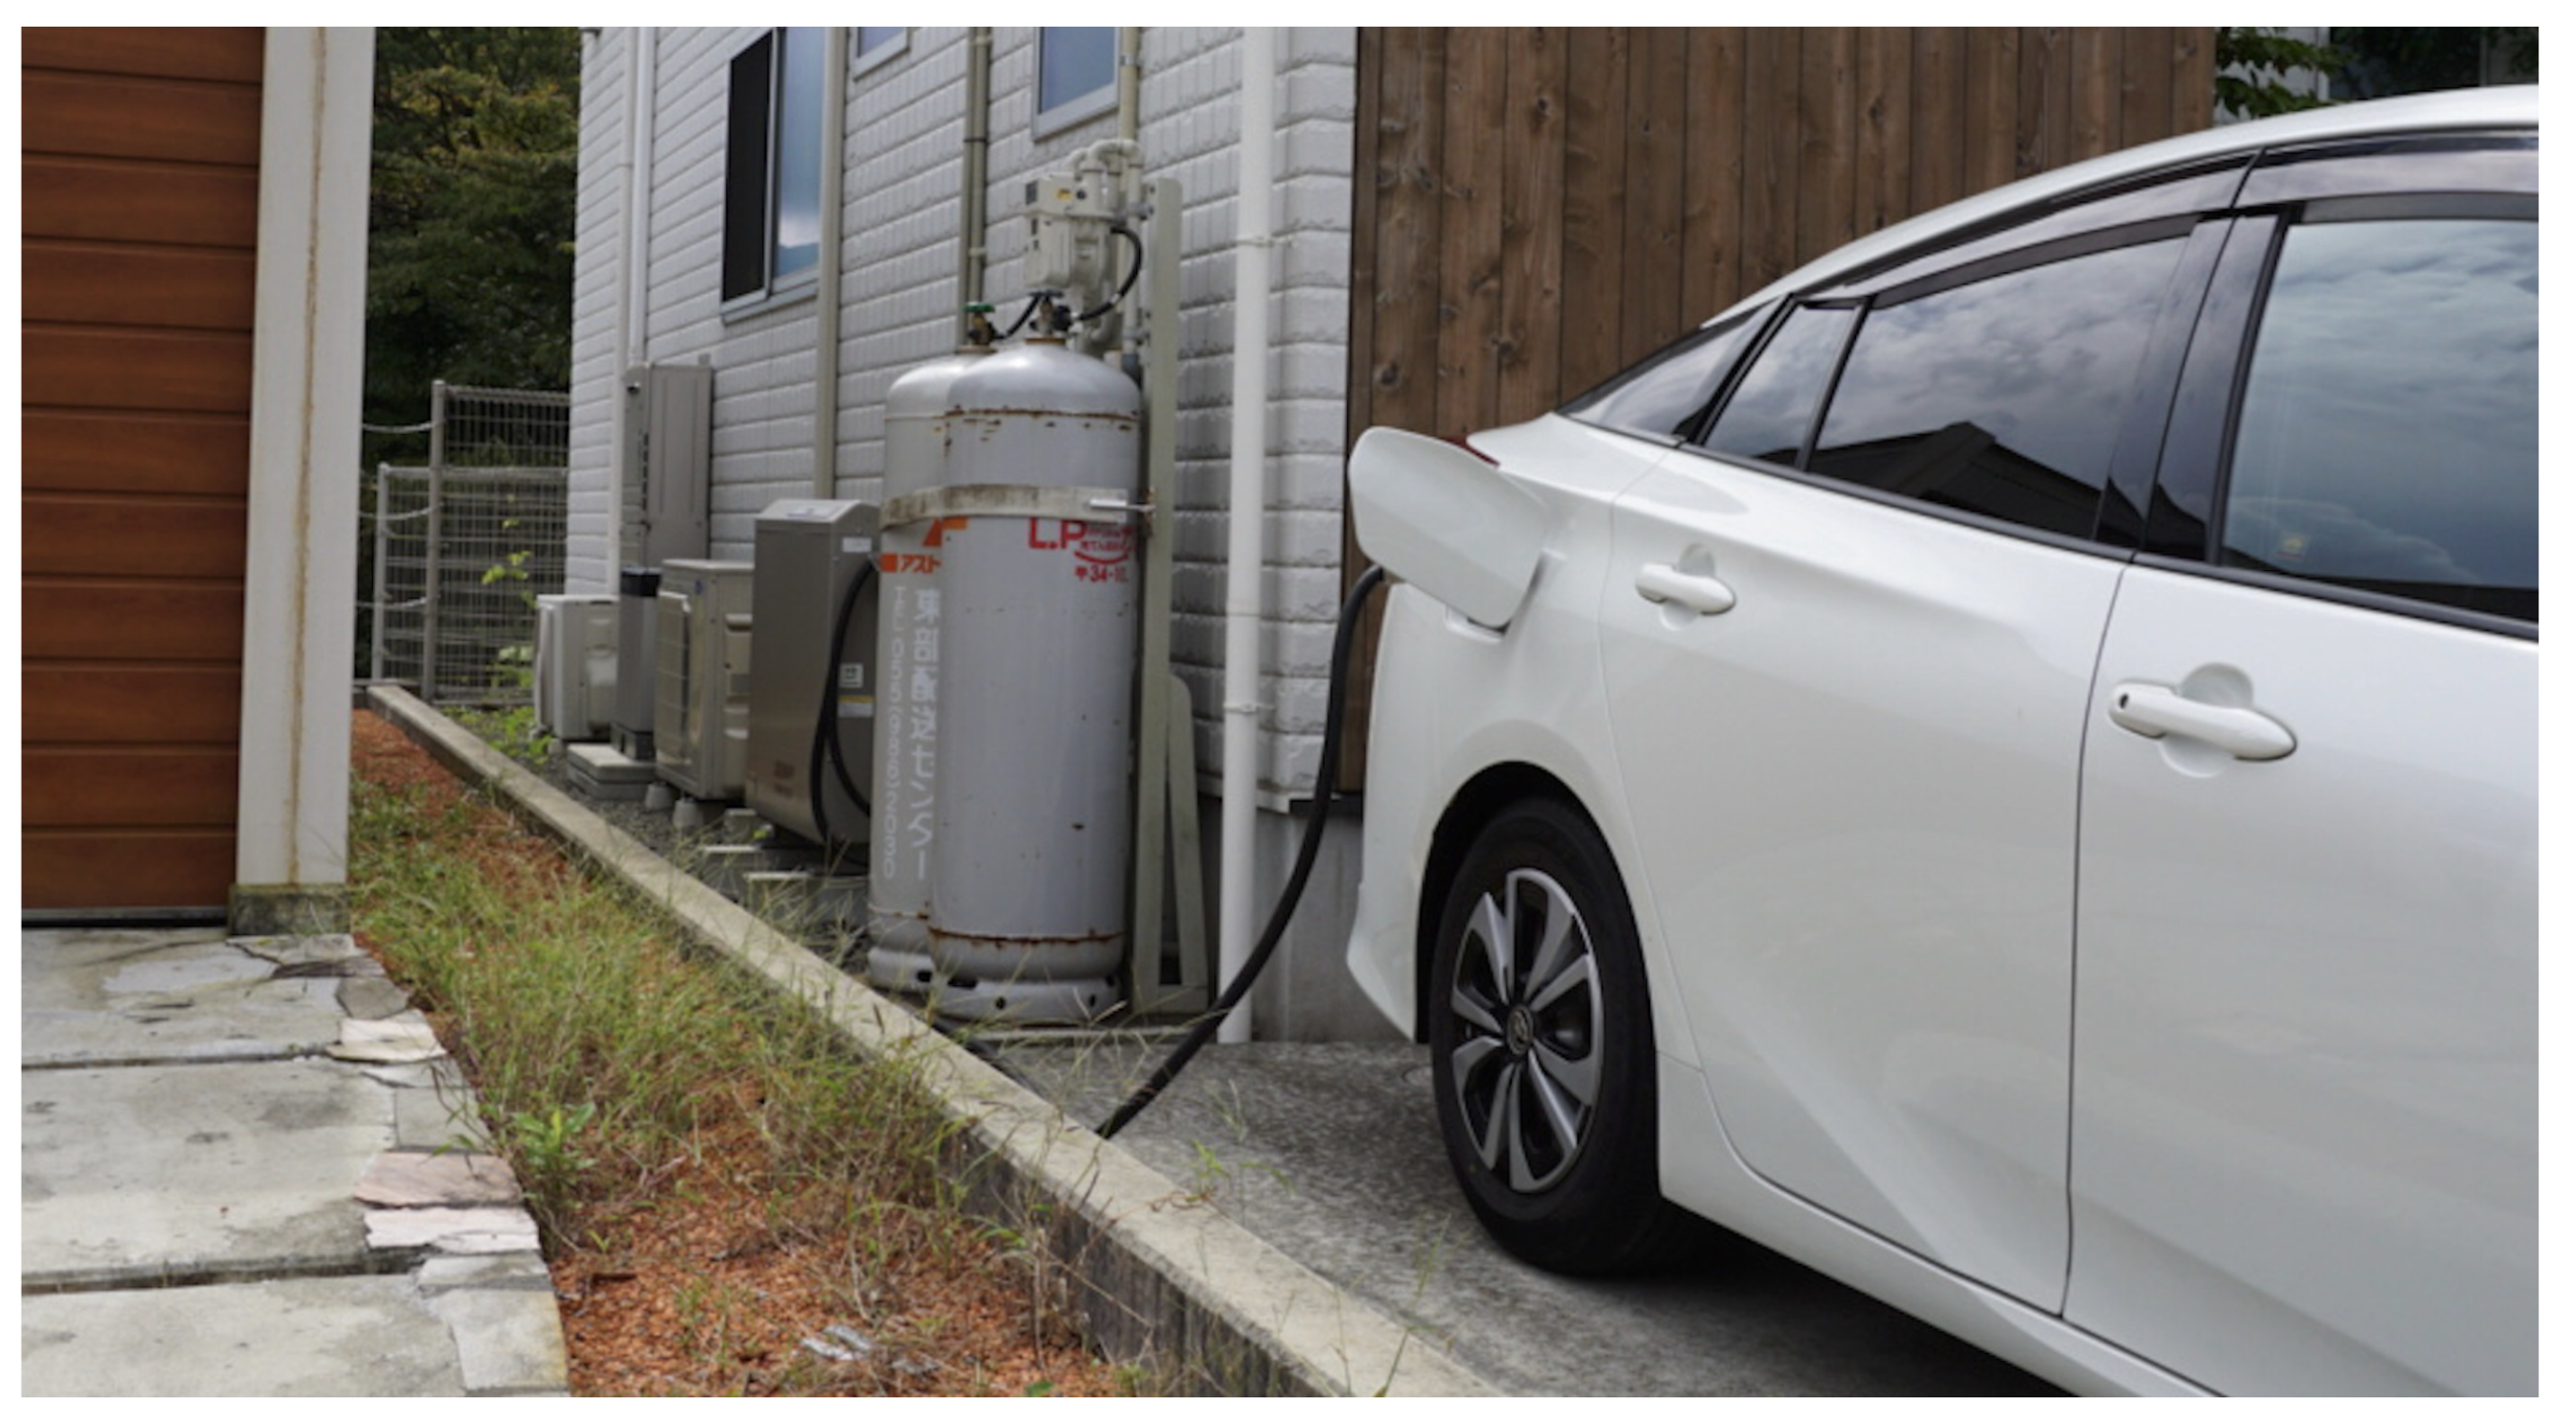
A total of nineteen households of volunteer participants were recruited. Initially, there was one more participant, but due to hardware trouble that could not be handled, the participant was excluded from this evaluation. Nine of them were loaned Toyota Prius (PHV) vehicles for the duration of the experiment (
Figure 6). The hardware (HEMS, PV, storage batteries, and EV chargers) used by each participant was different. The details of the equipment for each participant are described in
Section 3.2. The necessary construction work for the hardware and the application procedures for connecting the hardware to the grid was carried out before the start of the experiment. Actions were taken to resolve hardware problems that occurred during the demonstration experiment and daily balancing group [
27] operations were also conducted. If the participants decided not to continue to use the equipment after the experiment, construction to remove the equipment was also carried out. The entire period of this demonstration experiment was from 17 June 2019 to 31 August, 2020. During this period, new functions of the trading agents were developed, and their bugs were fixed.
PHV charging was assumed to be done at the owner’s house or office in this experiment. A grid agent sends an order that can be reliably executed if the other agent’s energy supply and demand are unmet. It works as an energy retailer in the real world. The order price is assumed to be a minimum price for selling and a maximum price for buying. An office agent aims to reduce the peak energy purchase from the grid, and when it is possible, provides favorable orders to vehicle agents, which act as employee benefits.
3.1. Market Settings
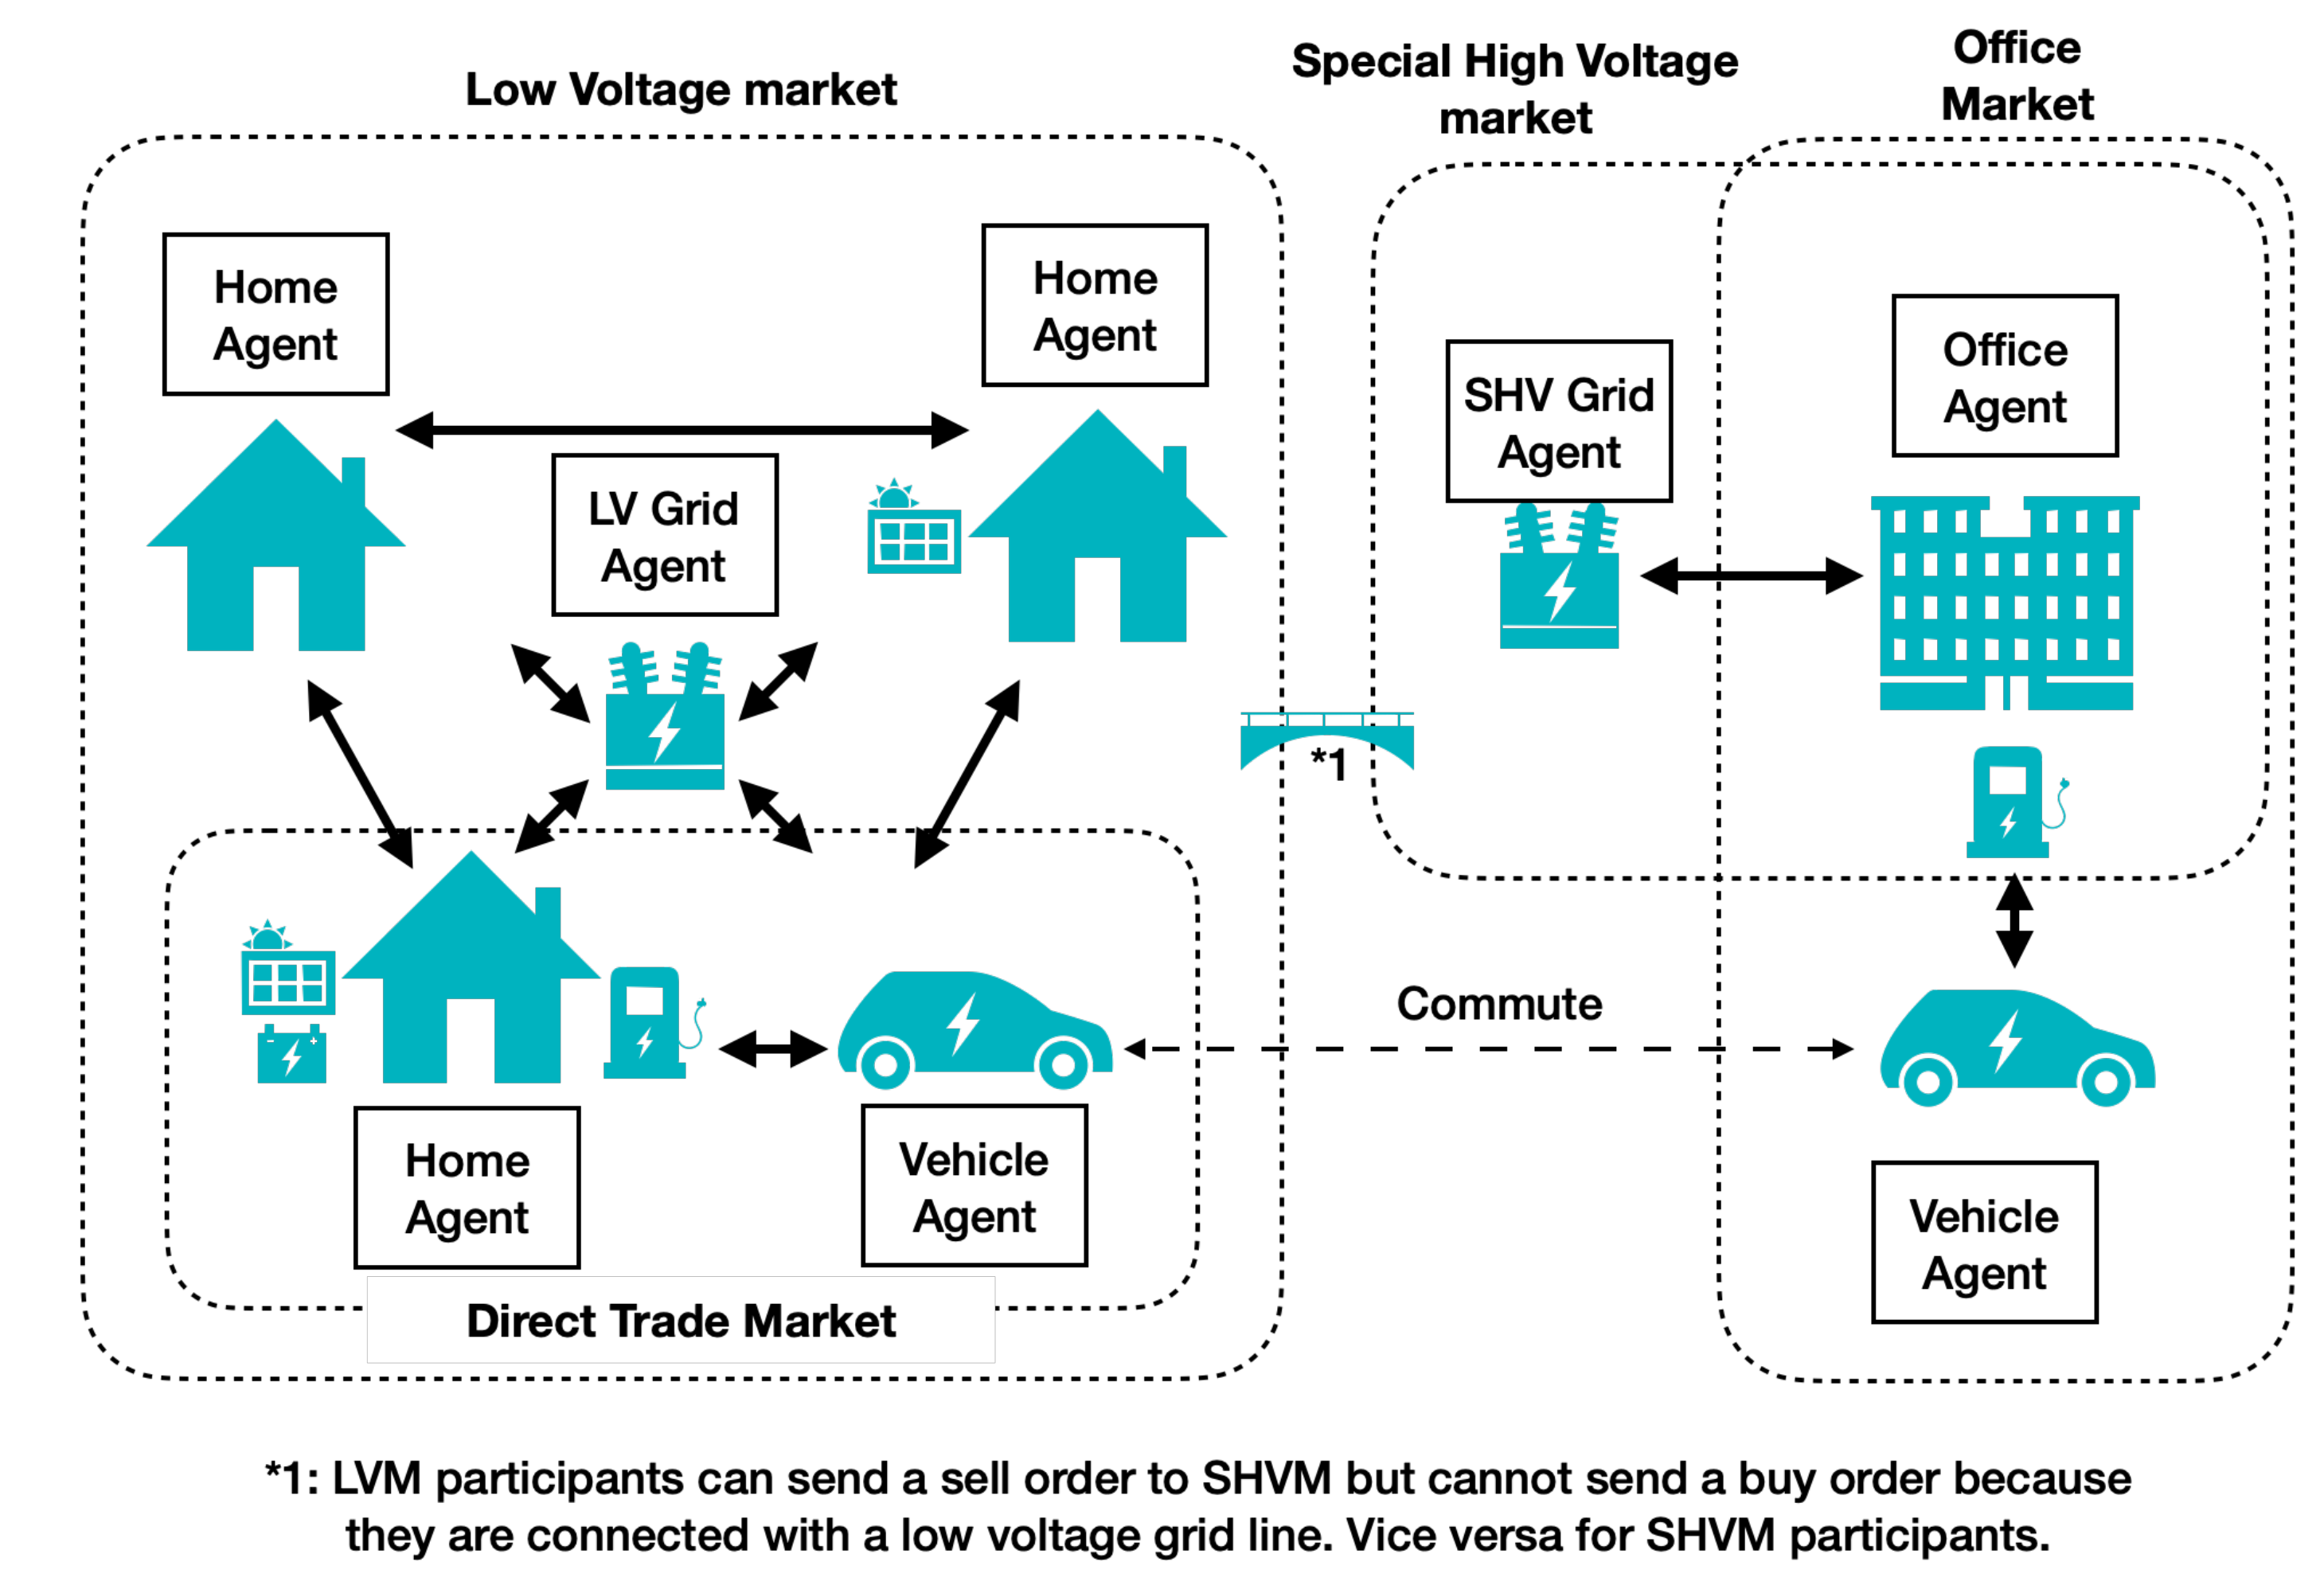
In this demonstration experiment, each trading agent had a particular market to participate in. This allowed for flexibility to change the transmission cost for each market and limit participant types.
Table 1 shows the correspondence between each market and its participants and transmission costs. The ordering price of the grid agent depends on the type of market (
Table 2). The buy order by the grid agent is the lowest offered price for the agent in that market, and the sell order is the highest buy price for the agent.
The office market (OM) does not have transmission costs because it uses a company-owned power line. Direct trade market (DTM), a private market for home agents and vehicle agents, is prepared for vehicle to home (V2H). Since the energy is exchanged over the home wiring, there is no transmission cost.
3.2. Home Agent Settings
Although vehicle agents and office agents participate in P2P energy tradings, this section describes the detail of the home agent that the authors worked on.
The home agent has several types depending on the assets it owns (
Table 3). The details of the 19 home agents are shown in
Table 4. All agents have smart meter and HEMS controller, which obtains energy usage on the smart meter via B-route and uploads the measured values to the cloud server using LTE. The B-route is a mechanism installed in smart meters in Japan that obtains electricity accumulation and instantaneous values using Wi-SUN (920 MHz wireless communication in compliance with IEEE 802.15.4 g) [
28].
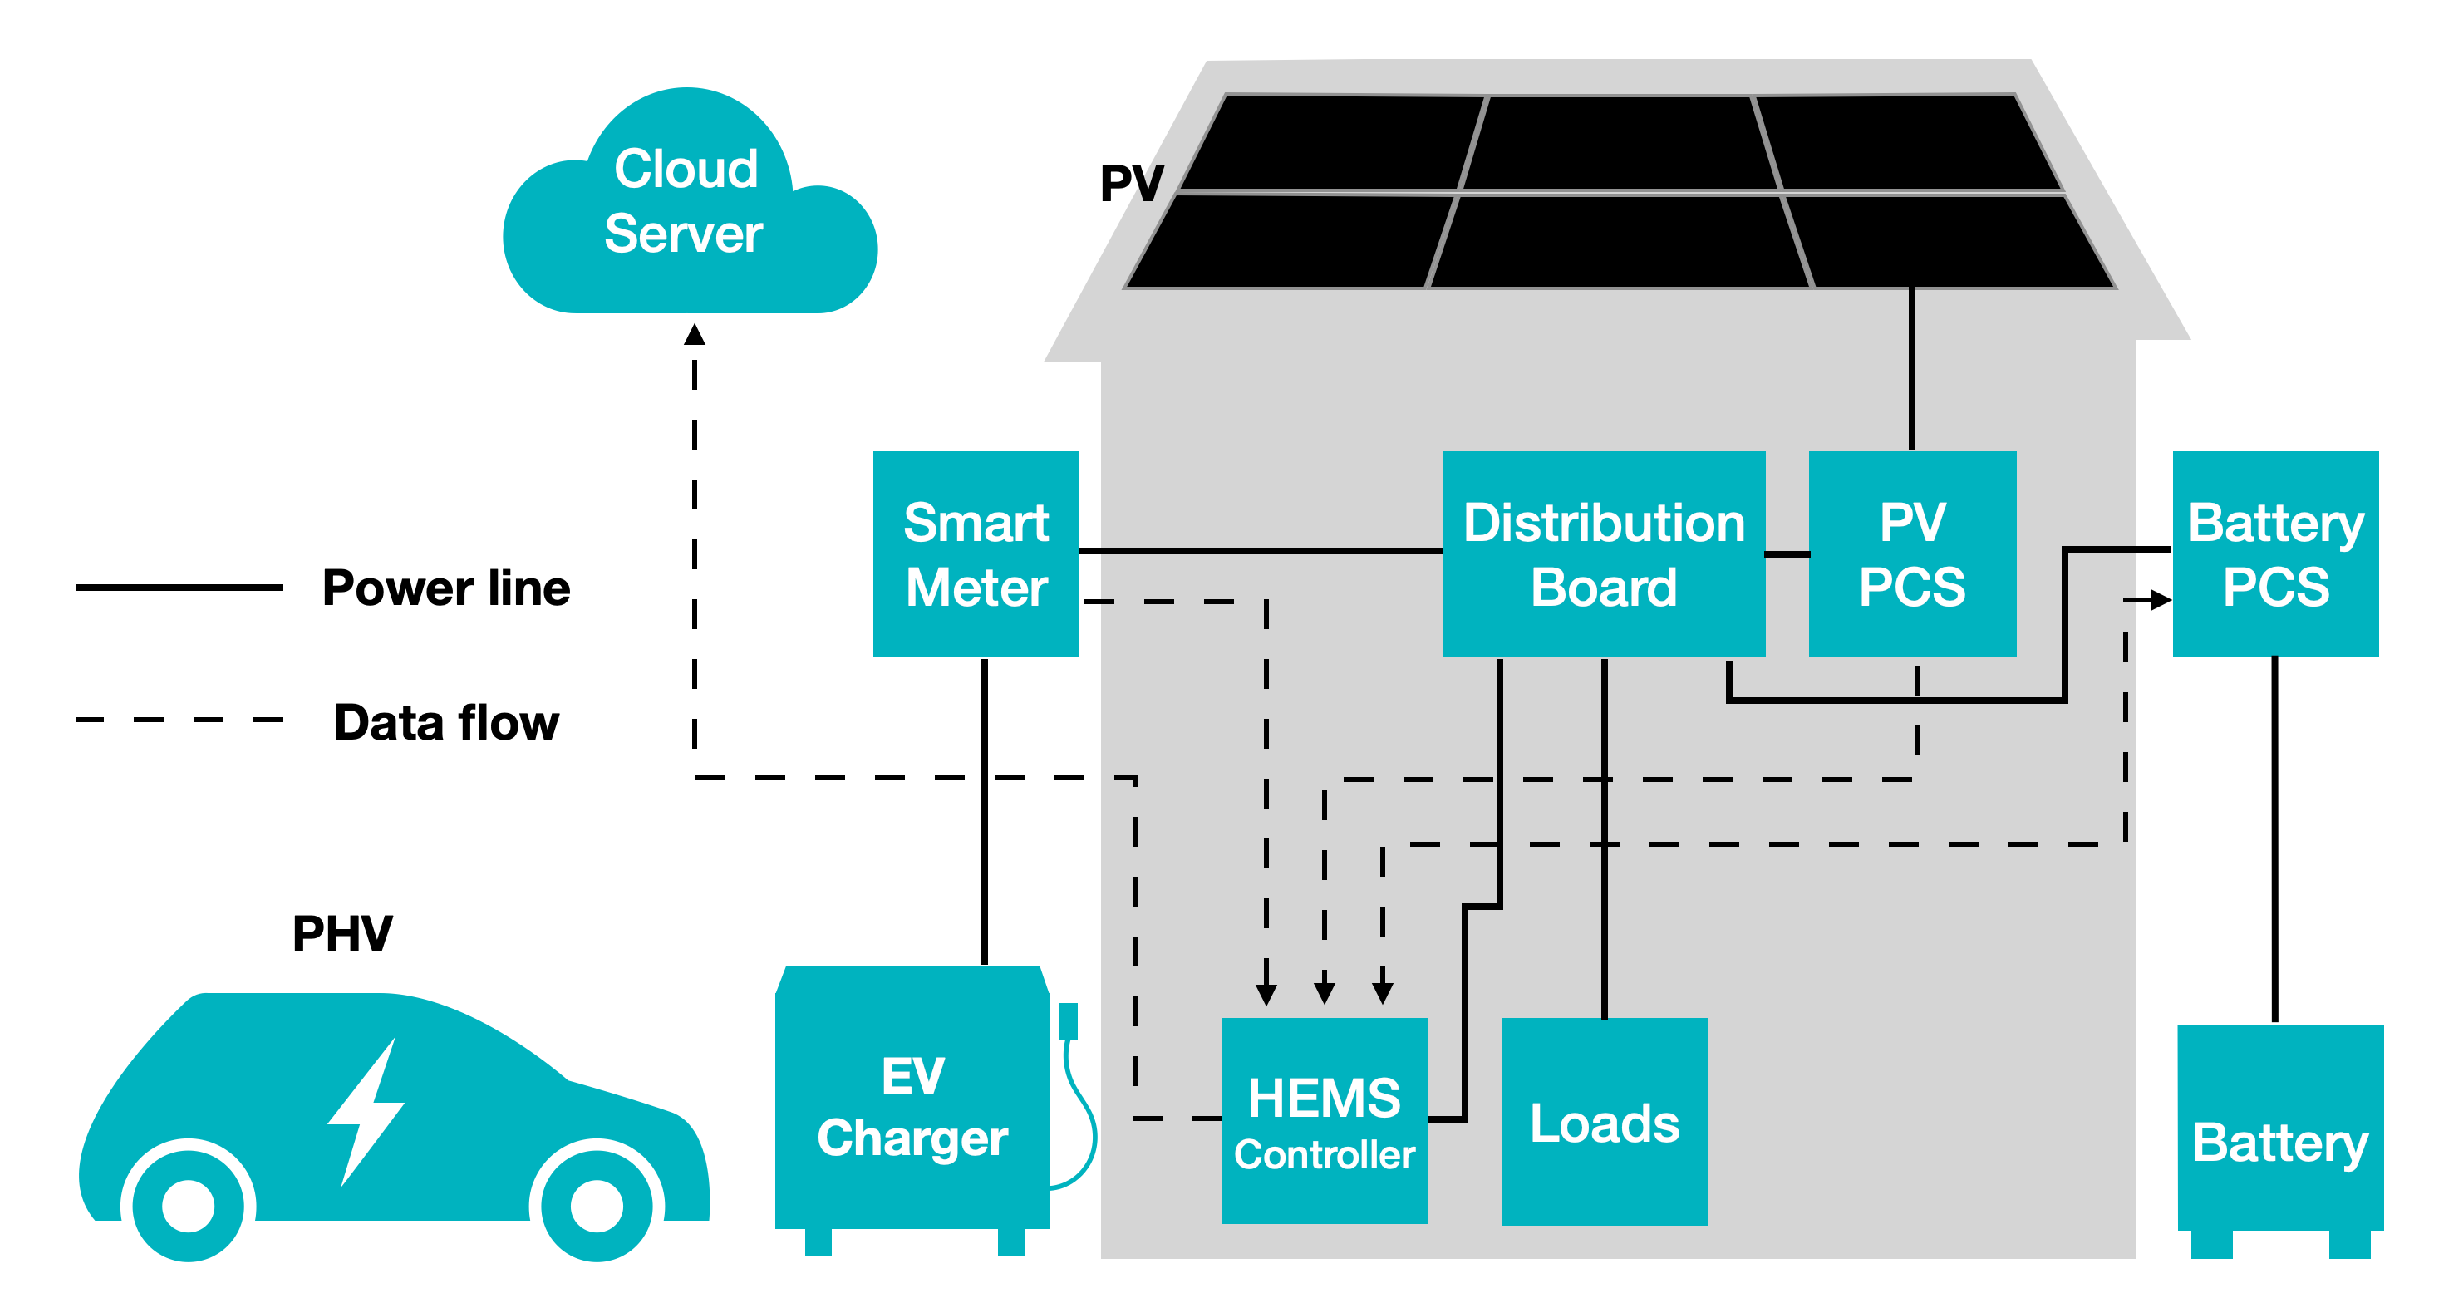
The agent that has all assets (P4) is shown in
Figure 7. The communication between the PV system and the HEMS controller was conducted using the Echonet Lite protocol [
29], but the battery system (9.8 kWh, OMRON) was the same. For deciding future market order amounts, predictions of power load and PV generation were made. In this case study, support vector regression (SVR) and moving average were adaptively used depending on the agent. Ordering was conducted twice, in 30 min. The markets for ordering were limited to markets that started 2.5 h ahead, including the real-time market.
4. Demonstration Experiment Result
This section describes the results of transactions conducted between 25 and 31 August, during the entire experiment period.
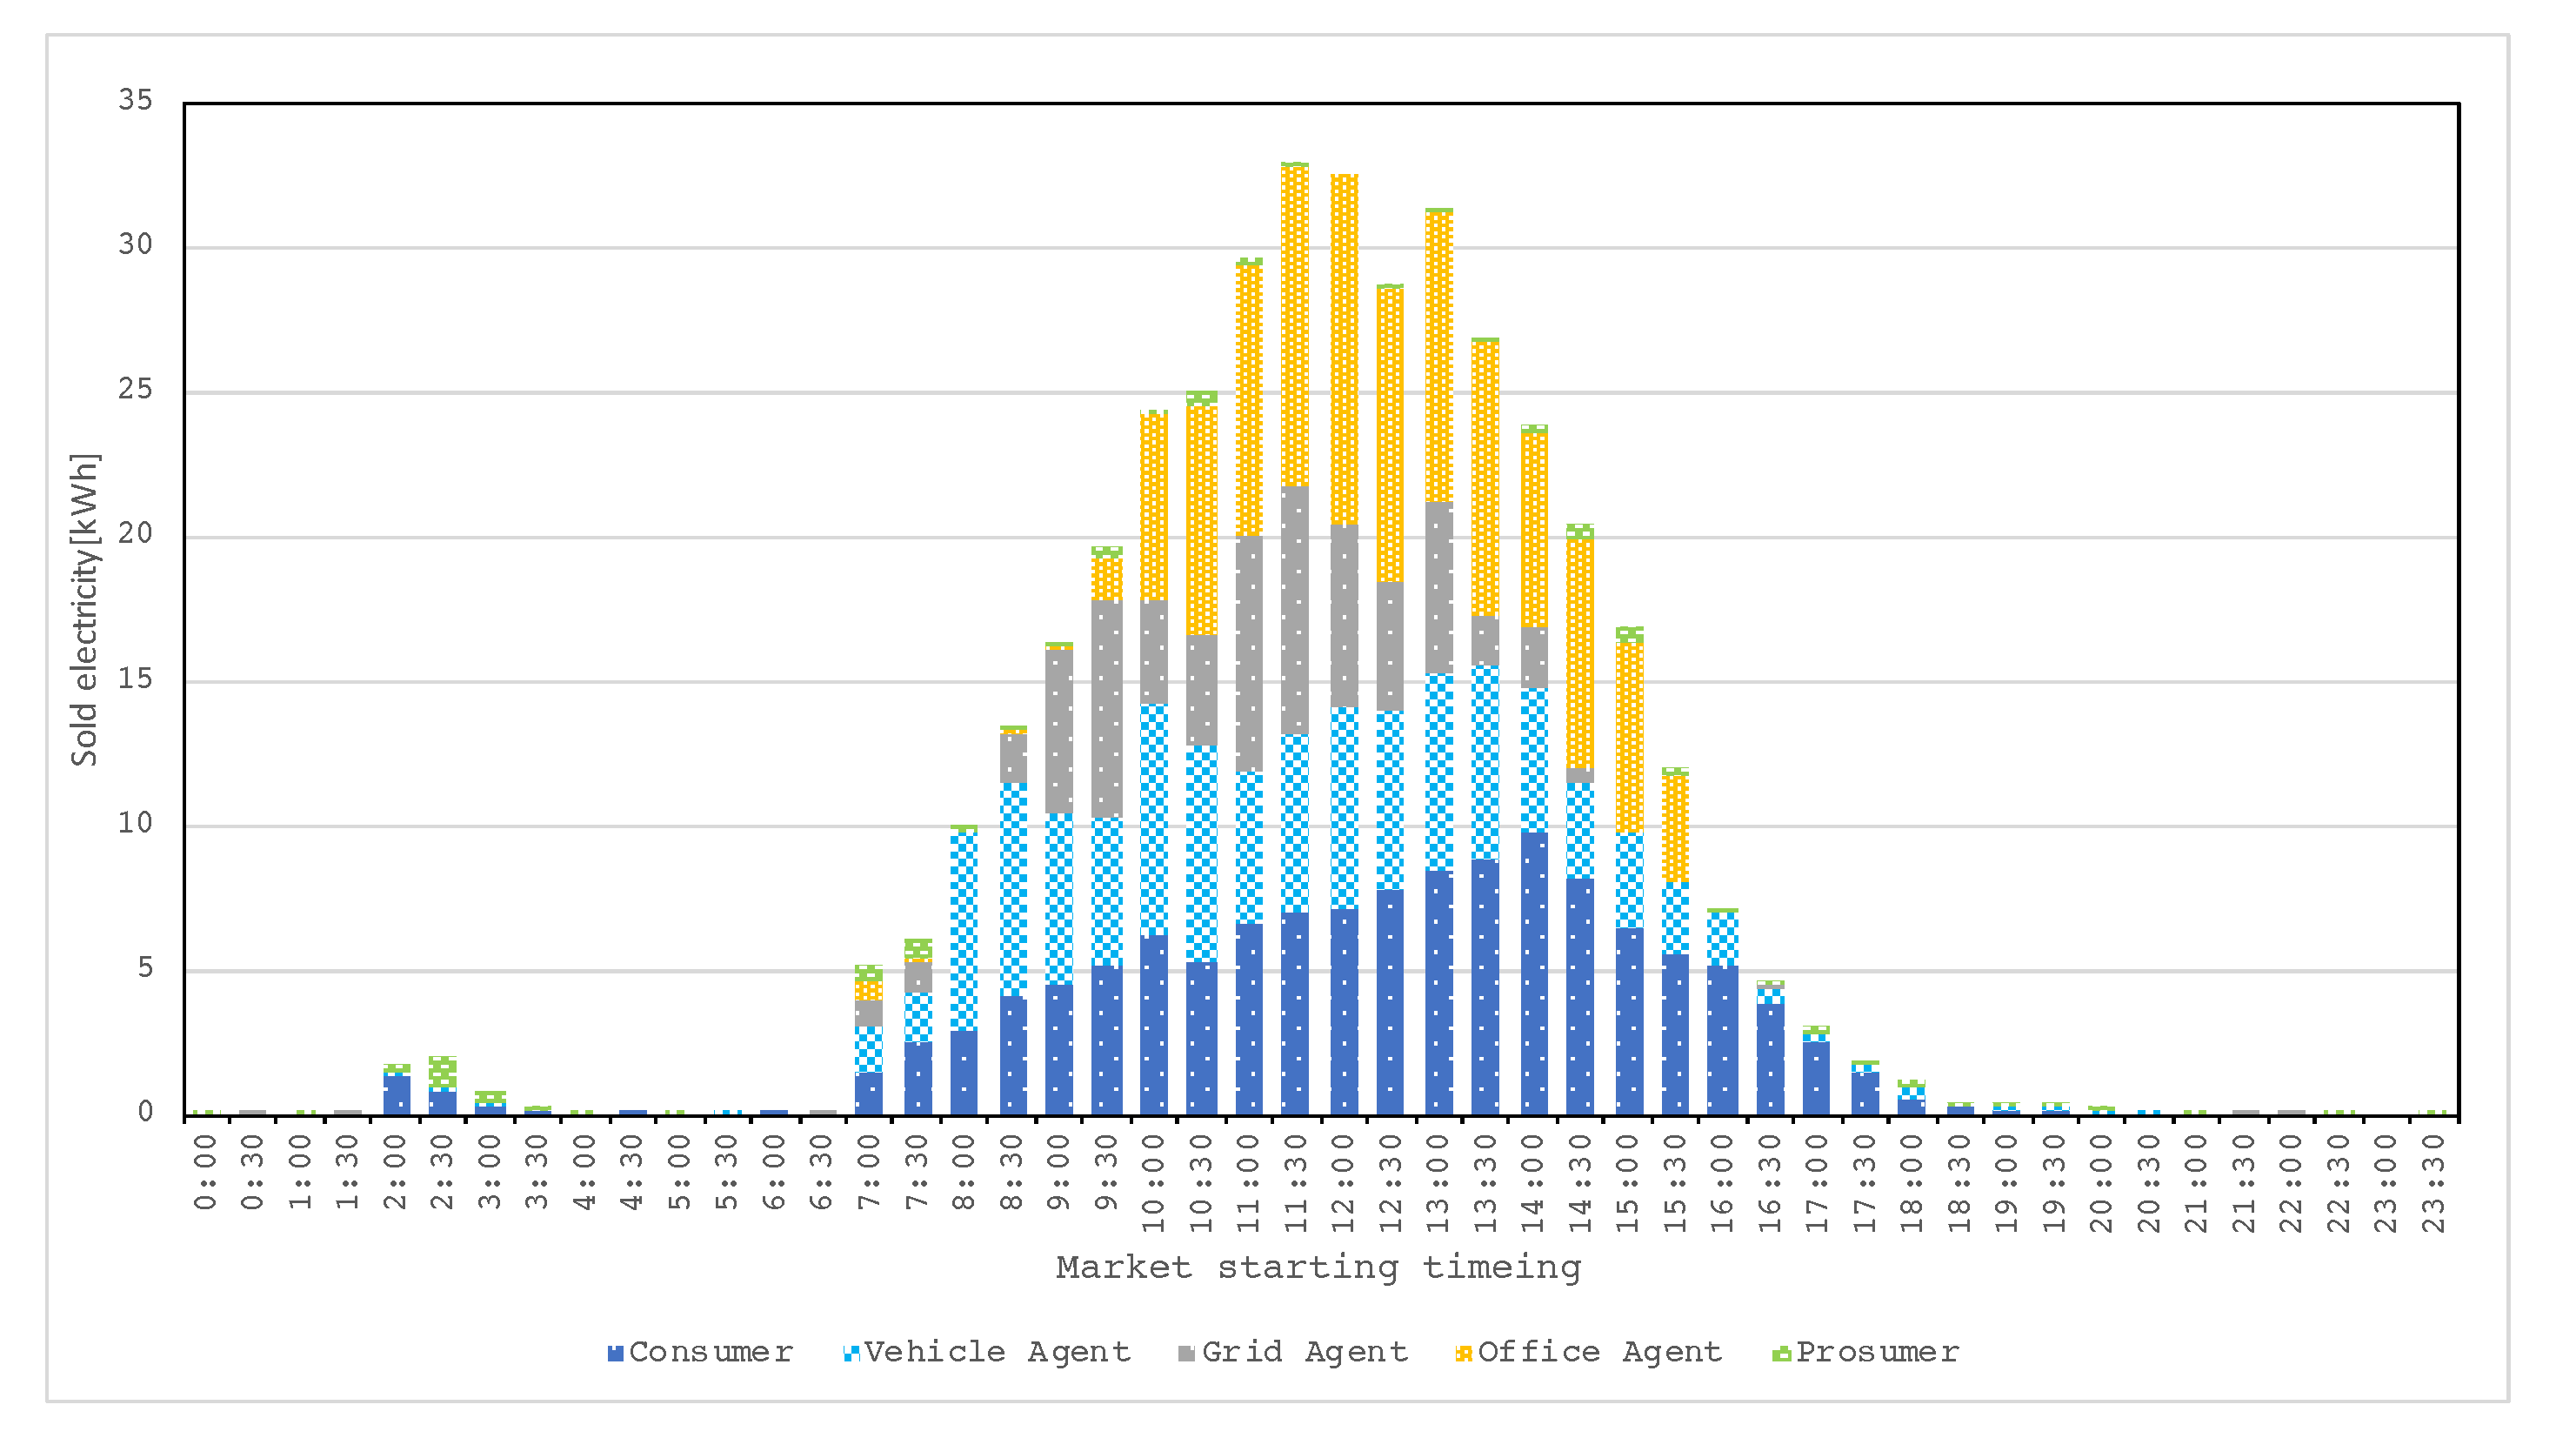
A breakdown of the trading partners of the energy sold by prosumers (P1–P4) is shown in
Figure 8. It shows that the transactions were concentrated between 8:00 and 19:00, with 15.4% of the unmatched energy sales absorbed by the grid agent and the remaining 84.6% of the energy sales purchased by other agents. The discharge of the battery made up the energy sold from 2:00 to 3:00. A breakdown of the sources of electricity purchased by consumers (C1–C2) is shown in
Figure 9. It shows that between 8:00 and 18:00, there were multiple purchases from prosumers and the percentage was 48.9%. These results indicate that redundant renewable energy is effectively absorbed within the P2P energy market. Purchases from the vehicle agents occurred between 18:30 and 7:30. The energy stored in the PHVs was purchased when no PV power was generated, indicating V2H behavior. There was a small amount of purchasing power from prosumers around 2:00 to 4:00. This was due to the discharge of the battery.
From these results, it was confirmed that the prosumer was able to sell surplus electricity, and the consumer was able to preferentially purchase renewable energy when it was available in the market. Therefore, it was confirmed that K1 was achieved.
The economic results are shown in
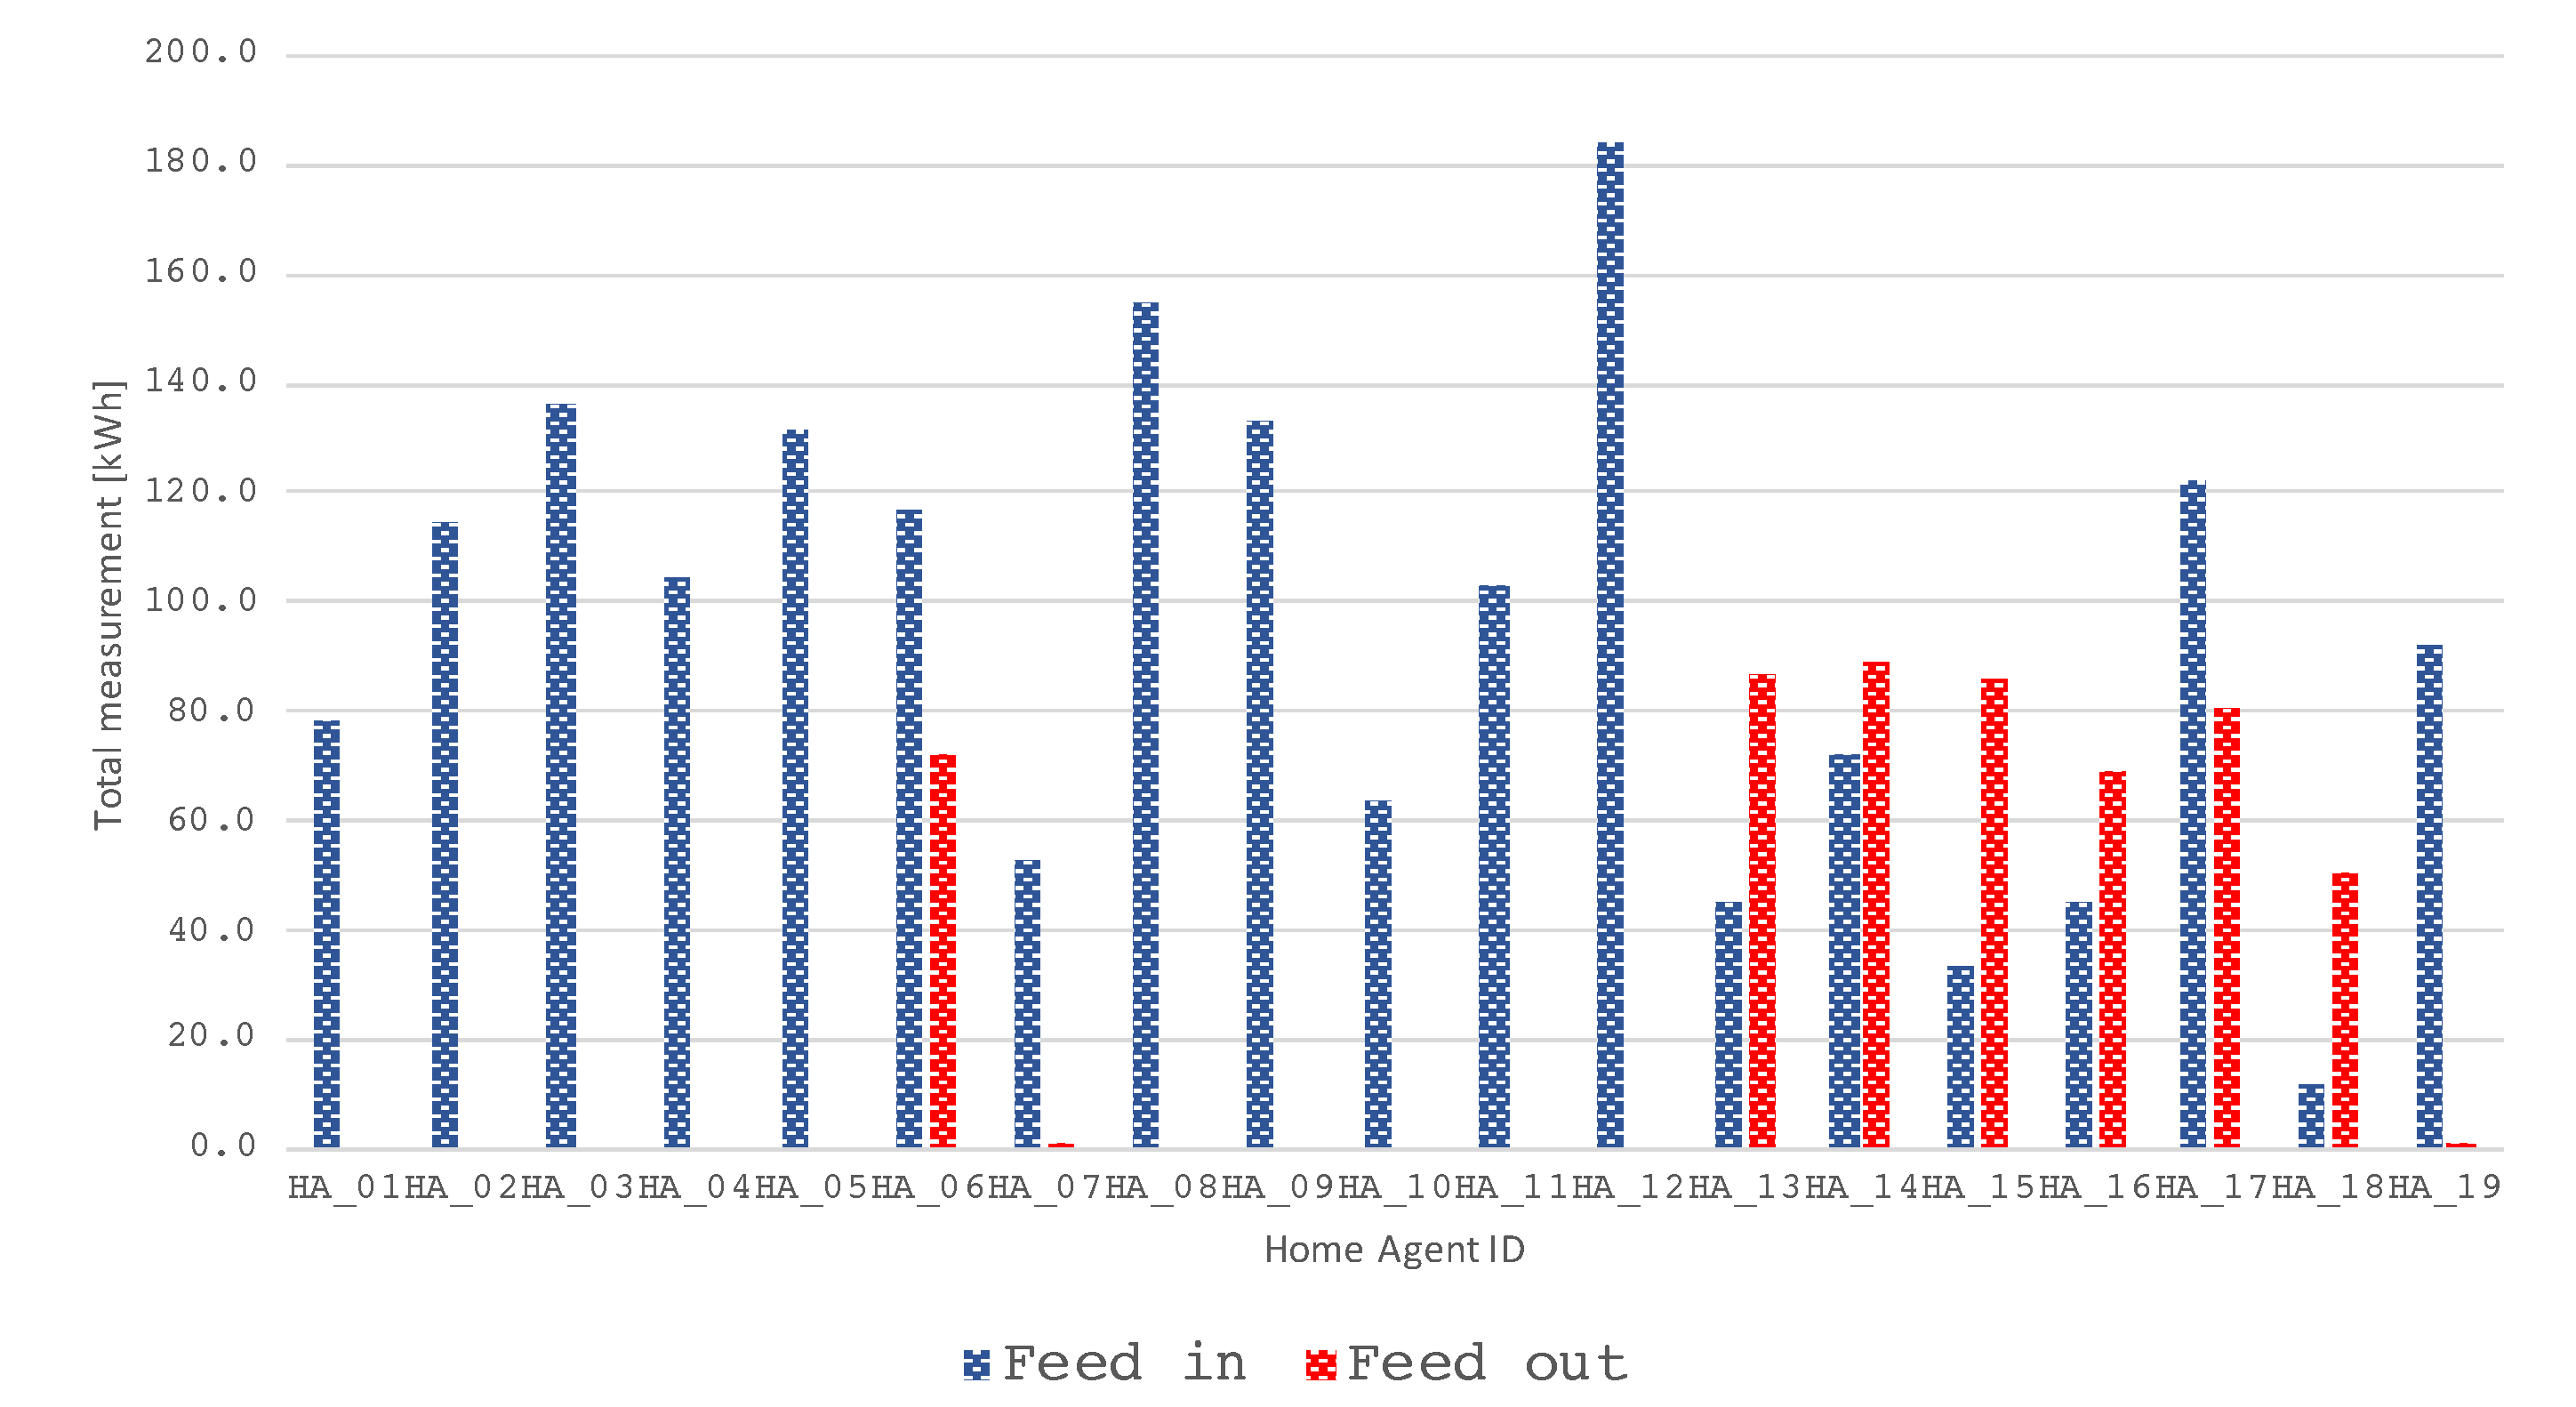
Table 5, with the price reduction rates comparing to when P2P energy trade was not used for transactions. The price reduction rates by agent type are 1.4% for C1, 2.2% for C2, 13.3% for P1, 60.3% for P2, 6.0% for P3, and 301.9% for P4. From this, it was confirmed that every agent type could get economic benefits. Meanwhile, P3 was lower than other prosumers although it was higher for agents with assets.
Figure 10 shows the feed-in and feed-out amount measured by each agent’s smart meter. It shows that P3 (HA_06, HA_17) had more feed-in amount than feed-out amount, and the amount sold was relatively low. That is the reason why the economic results were not as good as other prosumer agent types. P4 (HA_18) had the opposite result.
There was also an economic benefit for consumers without assets, but the reduction rate was about 2%; there is still room for improvement. One of the reasons why the consumer’s reduction rate was low is that the ordering amount was intentionally reduced to avoid the negative adjustment fee. If the execution amount has excess, the adjustment result becomes a negative balance. It will be further improved if the prediction accuracy can be enhanced and increase the order amounts to the P2P market.
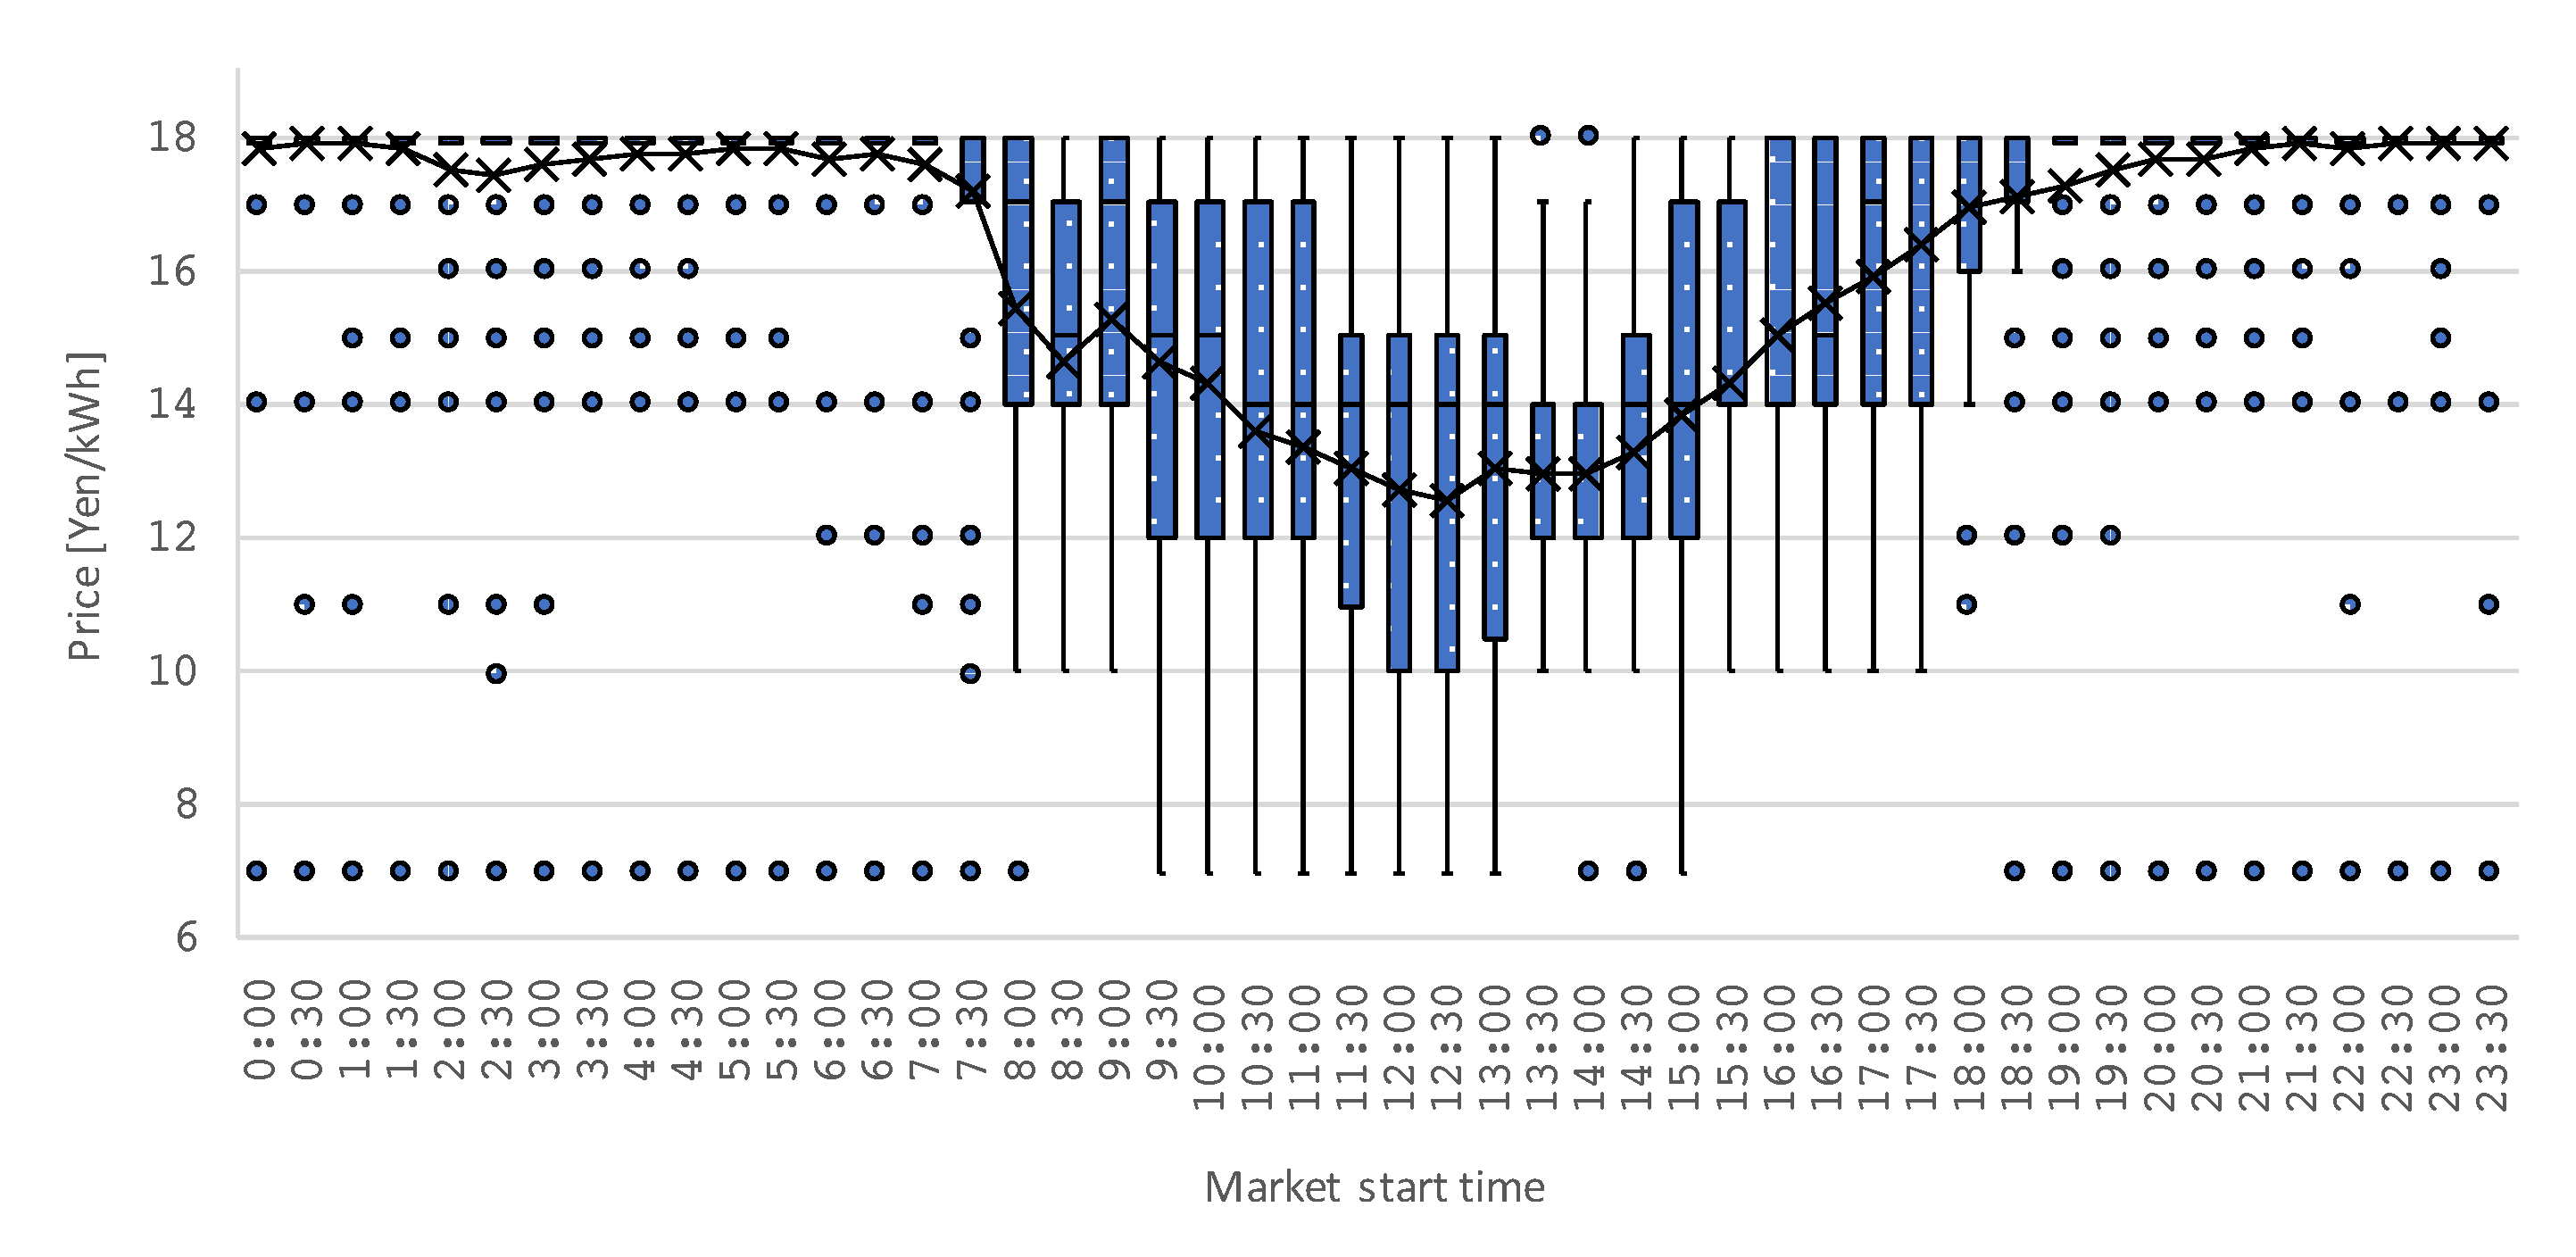
A boxplot of LVM executed prices for the P2P energy trading market is shown in
Figure 11. This shows that the nighttime price is almost the same as the grid price, but the price drops around 7:30 a.m., and around noon the average price is about 5 Yen/kWh lower than the grid price. This is because many orders are received during the daytime when PV generation is high and cheaper energy is available. From these results, it was confirmed that economic transactions (K2) could be conducted.
All transactions were done automatically by the trading agents, so participants did not have to perform manual actions to conduct P2P energy trading. Therefore, it was confirmed that P2P energy trading could be used by real users and that K3 was achieved. Participants provided comments on the demonstration experiment such as, “The reassurance of safety and security against disasters was a major attraction”, and, “The exchange of electricity also provided an opportunity to think about energy”.
5. Conclusions
This paper describes a mechanism that enhances users’ participation in P2P energy trading by providing a user-centric cooperative mechanism. Three key components were defined for evaluating the system as follows: reflect user preferences on the trade (K1); trade economically (K2); conduct P2P energy trading with low effort (K3).
In the proposed platform, tags are added to the orders to express users’ ordering intentions for K1, and continuous double auction (CDA) is incorporated as a market mechanism for K2. For K3, it is designed to execute orders automatically without any manual actions by the user.
As a case study, we verified a demonstration experiment consisting of the proposed contents. This experiment was conducted in Higashi-Fuji, Japan. Volunteer participants were recruited in a total of nineteen households, and nine of them were each loaned a Toyota Prius, a plugin hybrid vehicle (PHV), for the duration of the experiment.
As a result, the study confirmed that prosumers were able to sell their surplus electricity, and consumers were able to preferentially purchase renewable energy when it was available. In addition, those trades were made economically; the average price in the P2P energy trading market was about 27% (about 5 Yen) lower than the grid price when PV power was generated. Furthermore, every trade was made automatically, and this efficiency allowed the users to continue using the P2P energy trading. From all of this, K1, K2, and K3 were achieved.
The results show that if the prediction accuracy of user demand and supply can be improved, more orders can be placed in the P2P energy trading market, leading to improved economic efficiency. Therefore, future improvements to the prediction accuracy are needed. In addition, there were a few times when the connections of the HEMS devices were unstable, and measurement information could not be acquired. It is necessary to consider a hardware configuration that will enable a more stable connection.
In this demonstration experiment, the PHV charging locations were limited to homes and the office. This is because it was necessary to use chargers that could be controlled by the vehicle agent. In order to provide more general service, other locations, such as quick charging stations, should be considered. In addition, because the evaluation was conducted by actual participants, it was not possible to compare the results with existing P2P energy trading methods. For the comparison, it is necessary to set up an evaluation method in advance and work on verification.
In a future study, it may be necessary to work on the analysis of vehicle to home (V2H) control performed through direct trades between home and vehicle agents.
Author Contributions
Conceptualization, T.S. and K.T.; methodology, Y.T.; software, Y.T.; validation, Y.T., Y.N.; formal analysis, Y.T.; investigation, Y.T. and Y.N.; data curation, Y.T.; writing—original draft preparation, Y.T.; writing—review and editing, K.T.; visualization, Y.T.; supervision, T.S. and K.T.; project administration, T.S. and K.T. All authors have read and agreed to the published version of the manuscript.
Funding
This research received no external funding.
Acknowledgments
This project was made possible by the generous support of Toyota Motor Corporation in terms of resources and technology. We would like to express our sincere gratitude to them. The fourth author is supported by Grant-in-Aid for Scientific Research (A) 20H00285.
Conflicts of Interest
The authors declare no conflict of interest.
References
- Unitated Nation. The Paris Agreement. Available online: https://unfccc.int/sites/default/files/english_paris_agreement.pdf (accessed on 30 October 2021).
- International Energy Agency. World Energy Investment 2021. Available online: https://iea.blob.core.windows.net/assets/5e6b3821-bb8f-4df4-a88b-e891cd8251e3/WorldEnergyInvestment2021.pdf (accessed on 30 October 2021).
- International Energy Agency. Net Zero by 2050 A Roadmap for the Global Energy Sector. Available online: https://iea.blob.core.windows.net/assets/deebef5d-0c34-4539-9d0c-10b13d840027/NetZeroby2050-ARoadmapfortheGlobalEnergySector_CORR.pdf (accessed on 30 October 2021).
- Bloomberg New Energy Finance. New Energy Outlook 2020-Executive Summary. Available online: https://assets.bbhub.io/professional/sites/24/928908_NEO2020-Executive-Summary.pdf (accessed on 30 October 2021).
- International Renewable Energy Agency. Renewable Power Generation Costs in 2019. Available online: https://www.irena.org/-/media/Files/IRENA/Agency/Publication/2020/Jun/IRENA_Power_Generation_Costs_2019.pdf (accessed on 30 October 2021).
- Bremen, L.V. Large-Scale Variability of Weather Dependent Renewable Energy Sources. In Management of Weather and Climate Risk in the Energy Industry; Troccoli, A., Ed.; Springer: Amsterdam, The Netherlands, 2010; pp. 189–206. [Google Scholar]
- Chawda, G.S.; Shaik, A.G.; Shaik, M.; Padmanaban, S.; Holm-Nielsen, J.B.; Mahela, O.P.; Kaliannan, P. Comprehensive Review on Detection and Classification of Power Quality Disturbances in Utility Grid with Renewable Energy Penetration. IEEE Access 2020, 8, 146807–146830. [Google Scholar] [CrossRef]
- Mahela, O.P.; Khan, B.; Alhelou, H.H.; Tanwar, S. Assessment of power quality in the utility grid integrated with wind energy generation. IET Power Electron. 2020, 13, 2917–2925. [Google Scholar] [CrossRef]
- Diouf, B.; Pode, R. Potential of lithium-ion batteries in renewable energy. Renew. Energy 2015, 76, 375–380. [Google Scholar] [CrossRef]
- Keck, F.; Lenzen, M.; Vassallo, A.; Li, M. The impact of battery energy storage for renewable energy power grids in Australia. Energy 2019, 173, 647–657. [Google Scholar] [CrossRef]
- Yang, Y.; Bremner, S.; Menictas, C.; Kay, M. Battery energy storage system size determination in renewable energy systems: A review. Renew. Sustain. Energy Rev. 2018, 91, 109–125. [Google Scholar] [CrossRef]
- International Renewable Energy Agency. Peer-to-Peer Electricity Trading Innovation Landscape Brief. Available online: https://irena.org/-/media/Files/IRENA/Agency/Publication/2020/Jul/IRENA_Peer-to-peer_trading_2020.pdf (accessed on 30 October 2021).
- Soto, E.A.; Bosman, L.B.; Wollega, E.; Leon-Salas, W.D. Peer-to-peer energy trading: A review of the literature. Appl. Energy 2021, 283, 116268. [Google Scholar] [CrossRef]
- Zhang, C.; Wu, J.; Zhou, Y.; Cheng, M.; Long, C. Peer-to-Peer energy trading in a Microgrid. Appl. Energy 2018, 220, 1–12. [Google Scholar] [CrossRef]
- Morstyn, T.; McCulloch, M.D. Multiclass Energy Management for Peer-to-Peer Energy Trading Driven by Prosumer Preferences. IEEE Trans. Power Syst. 2019, 34, 4005–4014. [Google Scholar] [CrossRef]
- Takeda, Y.; Tanaka, K. Bidding Agent Model for P2P Energy Trading. IEEJ Trans. Ind. Appl. 2020, 140, 738–745. [Google Scholar] [CrossRef]
- Guerrero, J.; Sok, B.; Chapman, A.C.; Verbič, G. Electrical-distance driven peer-to-peer energy trading in a low-voltage network. Appl. Energy 2021, 287, 116598. [Google Scholar] [CrossRef]
- Khorasany, M.; Mishra, Y.; Ledwich, G. Design of auction-based approach for market clearing in peer-to-peer market platform. J. Eng. 2019, 2019, 4813–4818. [Google Scholar] [CrossRef]
- Lin, J.; Pipattanasomporn, M.; Rahman, S. Comparative analysis of auction mechanisms and bidding strategies for P2P solar transactive energy markets. Appl. Energy 2019, 255, 113687. [Google Scholar] [CrossRef]
- Flikkema, P.G. A multi-round double auction mechanism for local energy grids with distributed and centralized resources. In Proceedings of the IEEE International Symposium on Industrial Electronics, Santa Clara, CA, USA, 8–10 June 2016; pp. 672–677. [Google Scholar] [CrossRef]
- Mujeeb, A.; Hong, X.; Wang, P. Analysis of Peer-to-Peer (P2P) Electricity Market and Piclo’s Local Matching Trading Platform in UK. In Proceedings of the 2019 3rd IEEE Conference on Energy Internet and Energy System Integration: Ubiquitous Energy Network Connecting Everything, EI2 2019, Changsha, China, 8–10 November 2019; pp. 619–624. [Google Scholar] [CrossRef]
- Vandebron. 2021. Available online: https://vandebron.nl/ (accessed on 30 October 2021).
- Mengelkamp, E.; Gärttner, J.; Rock, K.; Kessler, S.; Orsini, L.; Weinhardt, C. Designing microgrid energy markets. A case study: The Brooklyn Microgrid. Appl. Energy 2017, 210, 870–880. [Google Scholar] [CrossRef]
- Toyota. The University of Tokyo, Toyota, and TRENDE to Begin Testing of Next-Generation Electricity System. 2020. Available online: https://global.toyota/en/newsroom/corporate/28231367.html (accessed on 30 October 2021).
- Shah, D.; Chatterjee, S. A comprehensive review on day-ahead electricity market and important features of world’s major electric power exchanges. Int. Trans. Electr. Energy Syst. 2020, 30, e12360. [Google Scholar] [CrossRef]
- Ilic, D.; Da Silva, P.G.; Karnouskos, S.; Griesemer, M. An energy market for trading electricity in smart grid neighbourhoods. In Proceedings of the IEEE International Conference on Digital Ecosystems and Technologies, Campione d’Italia, Italy, 18–20 June 2012; pp. 1–6. [Google Scholar] [CrossRef]
- Matschoss, P.; Nishimura, K. Analysis of Framework Conditions for Founding of Green Retailers in Japan. Available online: https://www.izes.de/sites/default/files/publikationen/EM_18_014.pdf (accessed on 30 October 2021).
- Harada, H.; Mizutani, K.; Fujiwara, J.; Mochizuki, K.; Obata, K.; Okumura, R. IEEE 802.15.4g based Wi-SUN communication systems. IEICE Trans. Commun. 2017, 100, 1032–1043. [Google Scholar] [CrossRef] [Green Version]
- Matsumoto, S. Echonet: A home network standard. IEEE Pervasive Comput. 2010, 9, 88–92. [Google Scholar] [CrossRef]
Figure 1.
P2P Energy trading system.
Figure 1.
P2P Energy trading system.
Figure 2.
Activity chart between the P2P energy market and an agent.
Figure 2.
Activity chart between the P2P energy market and an agent.
Figure 3.
Home agent mechanism flow chart. The main features are divided into 3 components, measurement, prediction, and ordering.
Figure 3.
Home agent mechanism flow chart. The main features are divided into 3 components, measurement, prediction, and ordering.
Figure 4.
The ordering price change curves. The y-axis is the order price and the x-axis is the future market time as seen from the current time.
Figure 4.
The ordering price change curves. The y-axis is the order price and the x-axis is the future market time as seen from the current time.
Figure 5.
Overall diagram of Higashi-Fuji P2P energy trading demonstration experiment.
Figure 5.
Overall diagram of Higashi-Fuji P2P energy trading demonstration experiment.
Figure 6.
A prosumer connects a Toyota Prius to a charger and conducts P2P energy trading.
Figure 6.
A prosumer connects a Toyota Prius to a charger and conducts P2P energy trading.
Figure 7.
Hardwares installed in the P4 agent type home.
Figure 7.
Hardwares installed in the P4 agent type home.
Figure 8.
Execution result breakdown of where prosumer sold the electricity to.
Figure 8.
Execution result breakdown of where prosumer sold the electricity to.
Figure 9.
Execution result breakdown of the source of electricity purchased by consumers.
Figure 9.
Execution result breakdown of the source of electricity purchased by consumers.
Figure 10.
The total feed-in and out amount measured by each agent’s smart meter.
Figure 10.
The total feed-in and out amount measured by each agent’s smart meter.
Figure 11.
Boxplots of executed prices in LVM. The circle means outlier and the x means mean value.
Figure 11.
Boxplots of executed prices in LVM. The circle means outlier and the x means mean value.
Table 1.
The relationship between agents, participating markets, and transmission costs. Check marks indicate the markets the agents can join. Δ means only selling. The office cannot buy in LVM because it is not connected with a low voltage power line. The same thing can be said of the home agent and the vehicle agent in SHVM.
| | Home Agent | Vehicle Agent | Office Agent | Grid Agent | Transmission Cost (Yen/kWh) |
|---|
| Low voltage market (LVM) | ✓ | ✓ | Δ | ✓ | 8 |
| Special high voltage market (SHVM) | Δ | Δ | ✓ | ✓ | 4 |
| Office market (OM) | - | ✓ | ✓ | - | 0 |
| Direct trade market (DTM) | ✓ | ✓ | - | - | 0 |
Table 2.
Buy or sell price depending on the target market of the grid agent. These prices are determined by referring to the grid tariffs for each voltage in Japan (not including transmission costs). The selling price here means the highest price in the market, and the buying price means the lowest price.
| | Buy Price (Yen/kWh) | Sell Price (Yen/kWh) |
|---|
| LVM | 7 | 18 |
| SHVM | 4 | 11 |
Table 3.
Correspondence table of the owned assets and agent types. Check marks indicate that the hardwares are owned by the agent types.
Table 3.
Correspondence table of the owned assets and agent types. Check marks indicate that the hardwares are owned by the agent types.
| | Smart Meter and HEMS Controller | PV | Battery | PHV and EV Charger |
|---|
| C1 | ✓ | - | - | - |
| C2 | ✓ | - | - | ✓ |
| P1 | ✓ | ✓ | - | - |
| P2 | ✓ | ✓ | ✓ | - |
| P3 | ✓ | ✓ | - | ✓ |
| P4 | ✓ | ✓ | ✓ | ✓ |
Table 4.
Composition of the household participants.
Table 4.
Composition of the household participants.
| Home Agent ID | Area | Agent Type | PV Capacity (W) | Battery Capacity (Wh) |
|---|
| HA_01 | Susono | C1 | - | - |
| HA_02 | Susono | C1 | - | - |
| HA_03 | Mishima | C1 | - | - |
| HA_04 | Yokohama | C1 | - | - |
| HA_05 | Susono | C1 | - | - |
| HA_06 | Yamanakako | P3 | 5880 | - |
| HA_07 | Fuji | C2 | - | - |
| HA_08 | Mishima | C2 | - | - |
| HA_09 | Susono | C2 | - | - |
| HA_10 | Mishima | C2 | - | - |
| HA_11 | Odawara | C1 | - | - |
| HA_12 | Susono | C2 | - | - |
| HA_13 | Gotenba | P1 | 4200 | - |
| HA_14 | Gotenba | P1 | 4800 | - |
| HA_15 | Gotenba | P2 | 6000 | 9800 |
| HA_16 | Mishima | P2 | 5400 | 9800 |
| HA_17 | Fuji | P3 | 7200 | - |
| HA_18 | Gotenba | P4 | 7200 | 9800 |
| HA_19 | Mishima | C2 | - | - |
Table 5.
Comparison of the P2P energy trading market and grid power trading prices for each agent. Sorted by agent type.
Table 5.
Comparison of the P2P energy trading market and grid power trading prices for each agent. Sorted by agent type.
| Home Agent ID | Agent Type | Incumbent Transaction (Yen) | P2P Transaction (Yen) | Difference (Yen) | Reduction Rate (%) |
|---|
| HA_01 | C1 | −2028.0 | −2012.2 | 15.8 | 0.8 |
| HA_02 | C1 | −2979.6 | −2962.3 | 17.3 | 0.6 |
| HA_03 | C1 | −3538.6 | −3456.1 | 82.5 | 2.3 |
| HA_04 | C1 | −2706.6 | −2691.6 | 15.0 | 0.6 |
| HA_05 | C1 | −3419.0 | −3341.9 | 77.1 | 2.3 |
| HA_11 | C1 | −2667.6 | −2616.9 | 50.7 | 1.9 |
| HA_07 | C2 | −1369.6 | −1339.0 | 30.5 | 2.2 |
| HA_08 | C2 | −4023.5 | −3943.0 | 80.5 | 2.0 |
| HA_09 | C2 | −3461.1 | −3358.3 | 102.8 | 3.0 |
| HA_10 | C2 | −1651.8 | −1658.4 | −6.6 | 0.4 |
| HA_12 | C2 | −4791.8 | −4647.4 | 144.4 | 3.0 |
| HA_19 | C2 | −2390.4 | −2333.0 | 57.4 | 2.4 |
| HA_13 | P1 | −568.1 | −464.5 | 103.6 | 18.2 |
| HA_14 | P1 | −1250.4 | −1146.8 | 103.6 | 8.3 |
| HA_15 | P2 | −274.9 | −28.0 | 246.9 | 89.8 |
| HA_16 | P2 | −684.0 | −473.5 | 210.5 | 30.8 |
| HA_06 | P3 | −2539.8 | −2433.1 | 106.7 | 4.2 |
| HA_17 | P3 | −2621.8 | −2417.5 | 204.3 | 7.8 |
| HA_18 | P4 | 42.6 | 171.2 | 128.6 | 301.9 |
| Publisher’s Note: MDPI stays neutral with regard to jurisdictional claims in published maps and institutional affiliations. |
© 2021 by the authors. Licensee MDPI, Basel, Switzerland. This article is an open access article distributed under the terms and conditions of the Creative Commons Attribution (CC BY) license (https://creativecommons.org/licenses/by/4.0/).


