
Numerical Study on the Performance and NOx Emission Characteristics of an 800cc MPI Turbocharged SI Engine

Abstract
:
1. Introduction
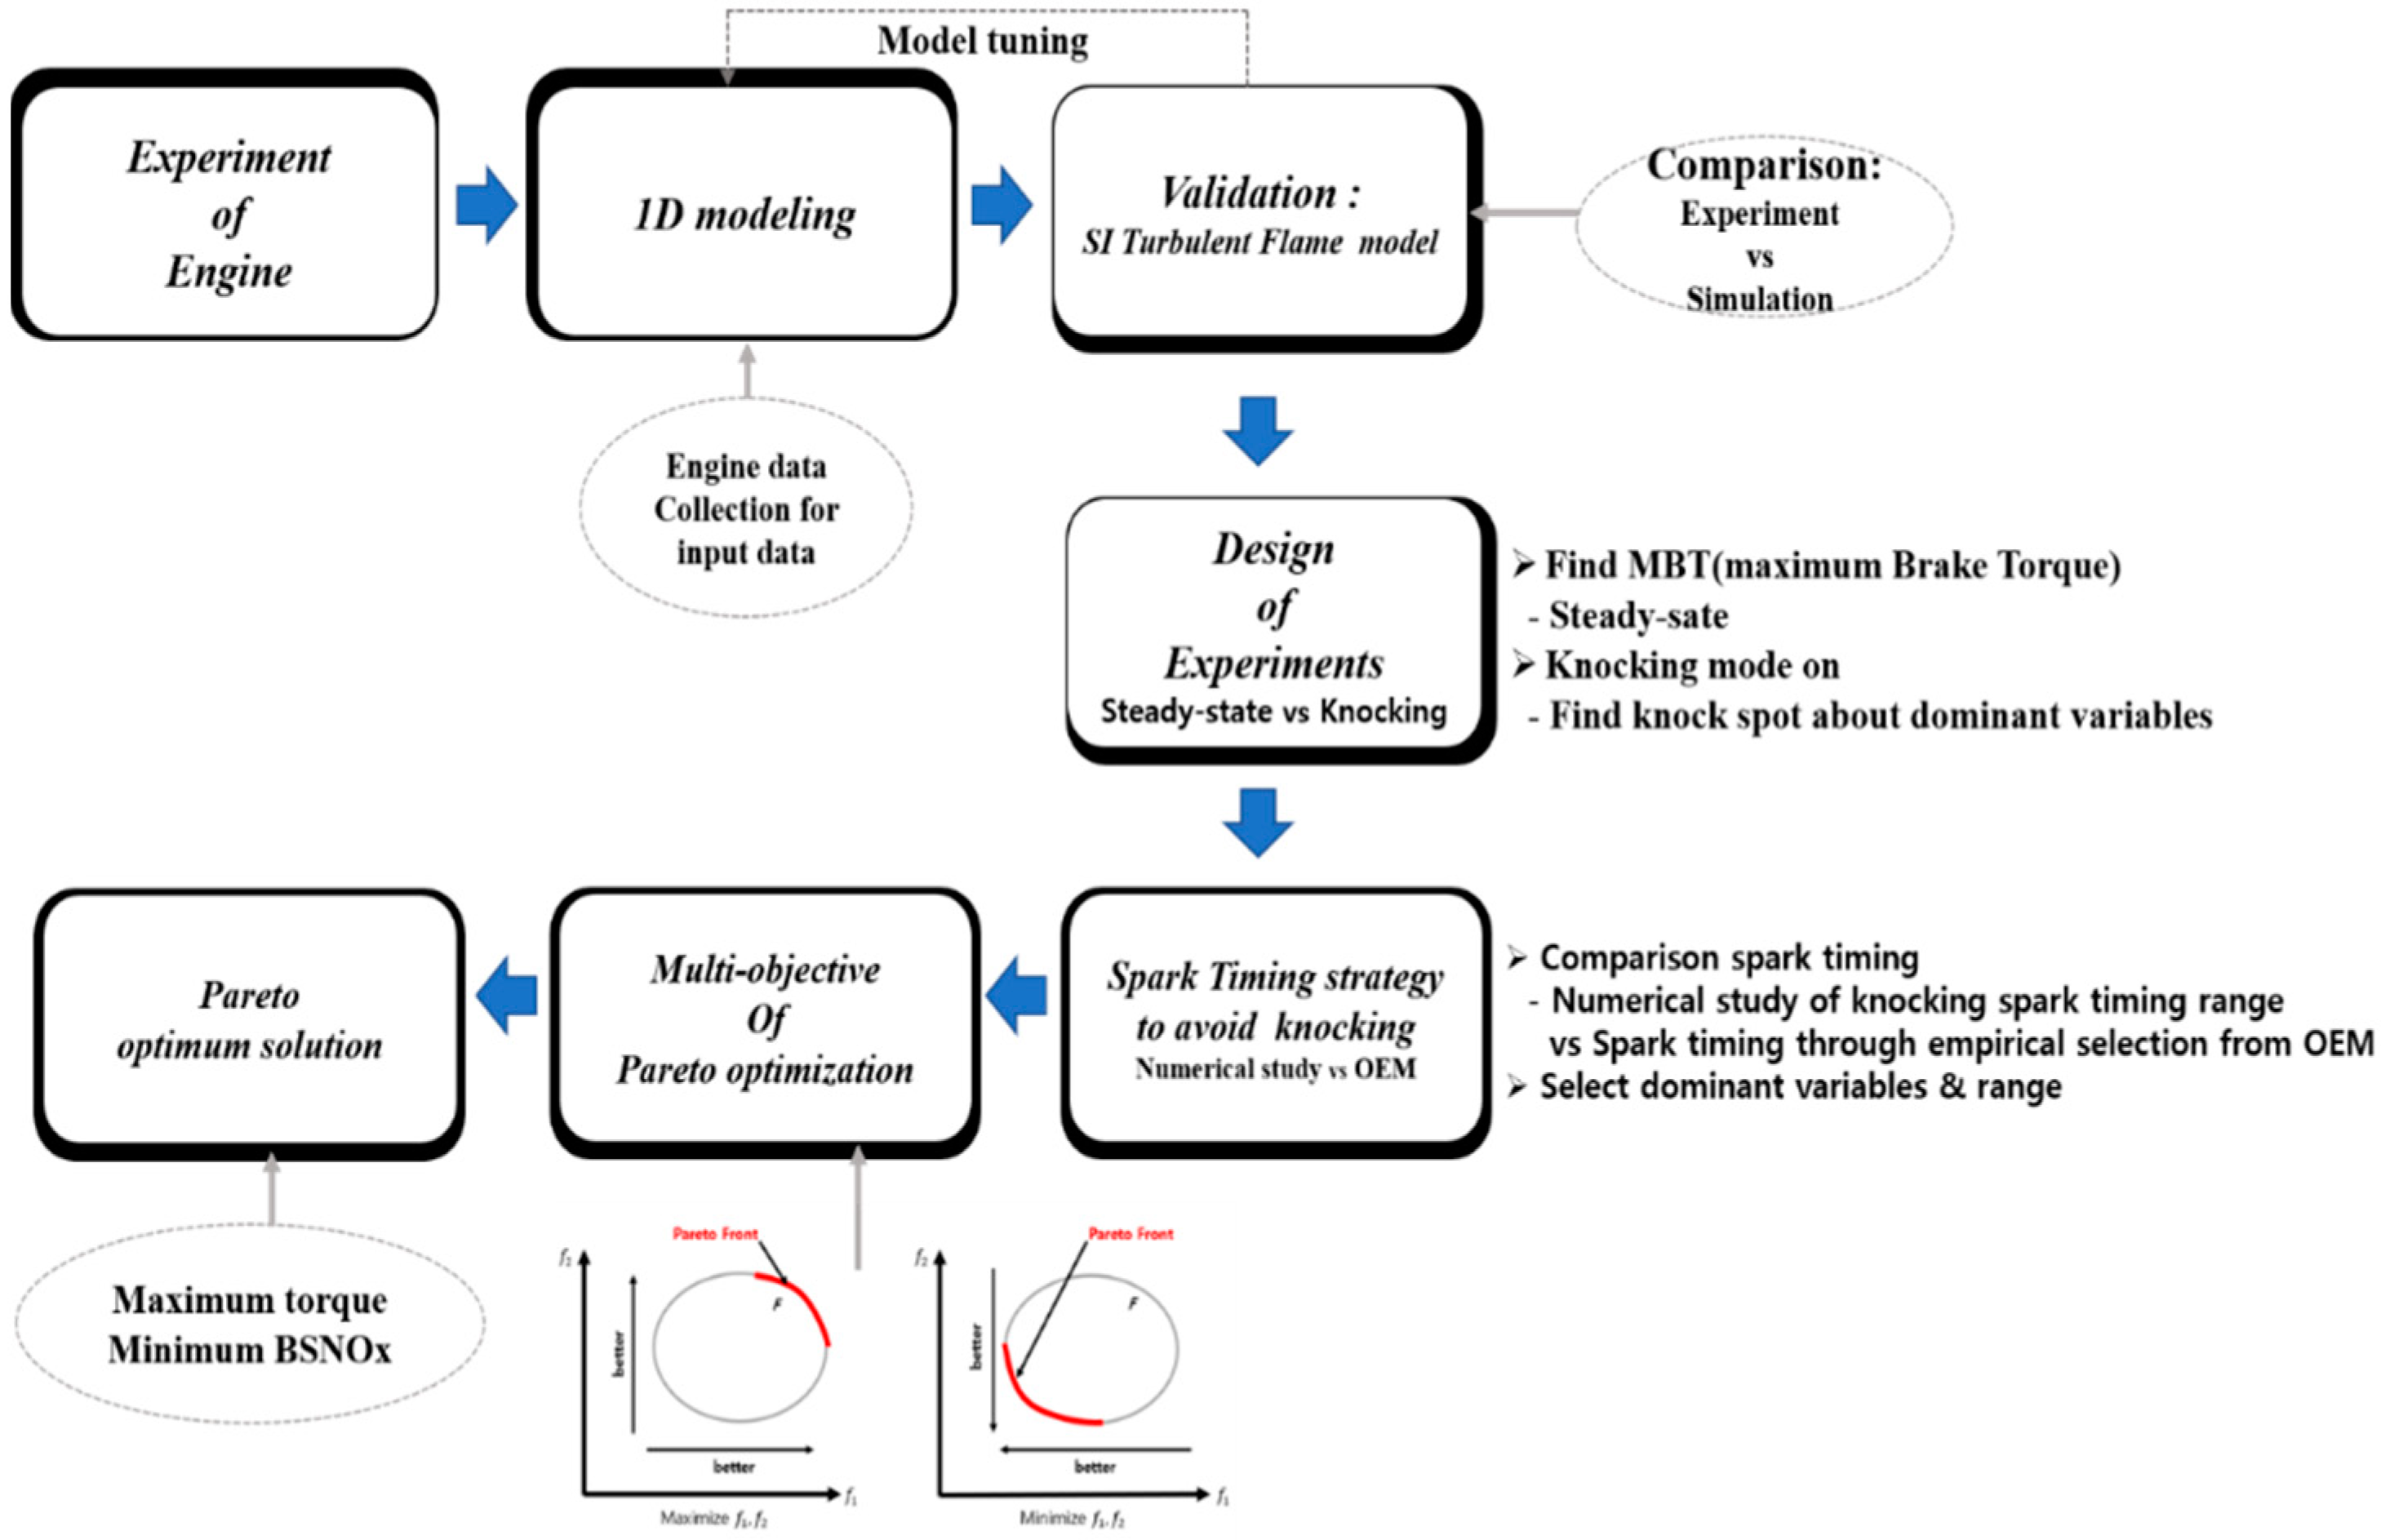
2. Methodologies
2.1. Experimental Set-Up
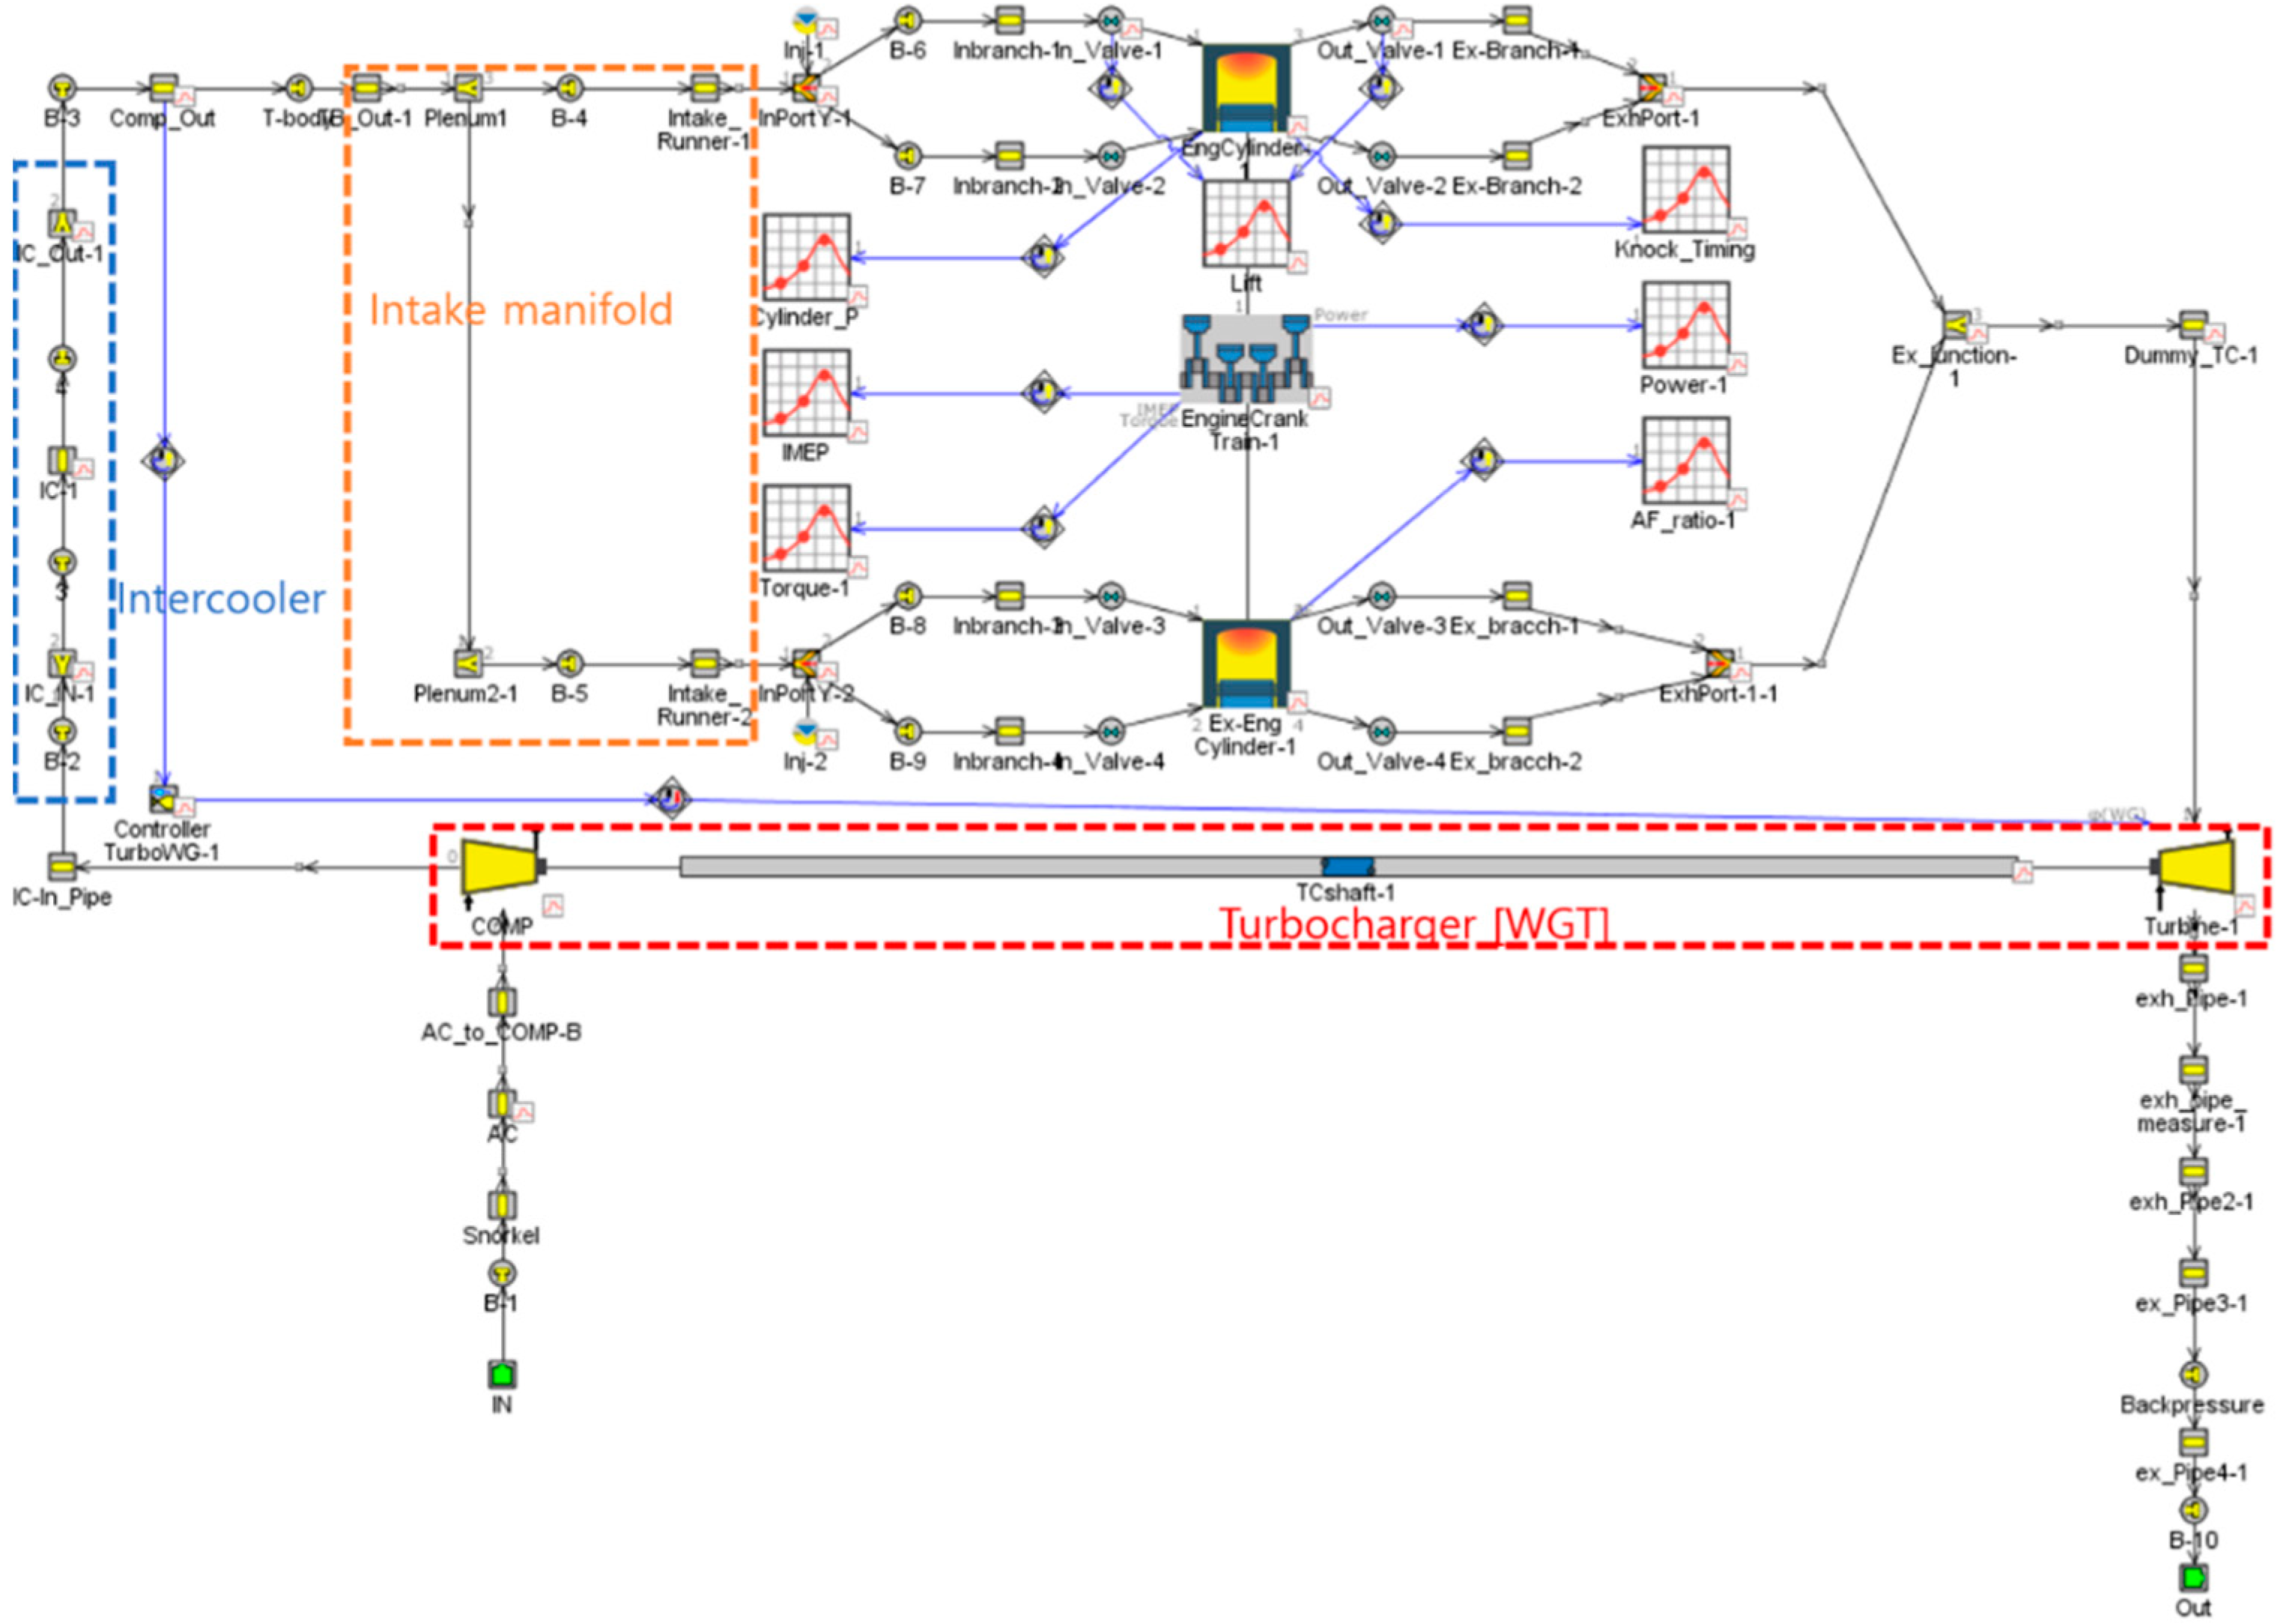
2.2. Detailed 1D Modeling
Numerical Study
2.3. Knock Analysis
2.4. Design of Experiment and Multi-Objective Pareto Optimization
3. Results and Discussion
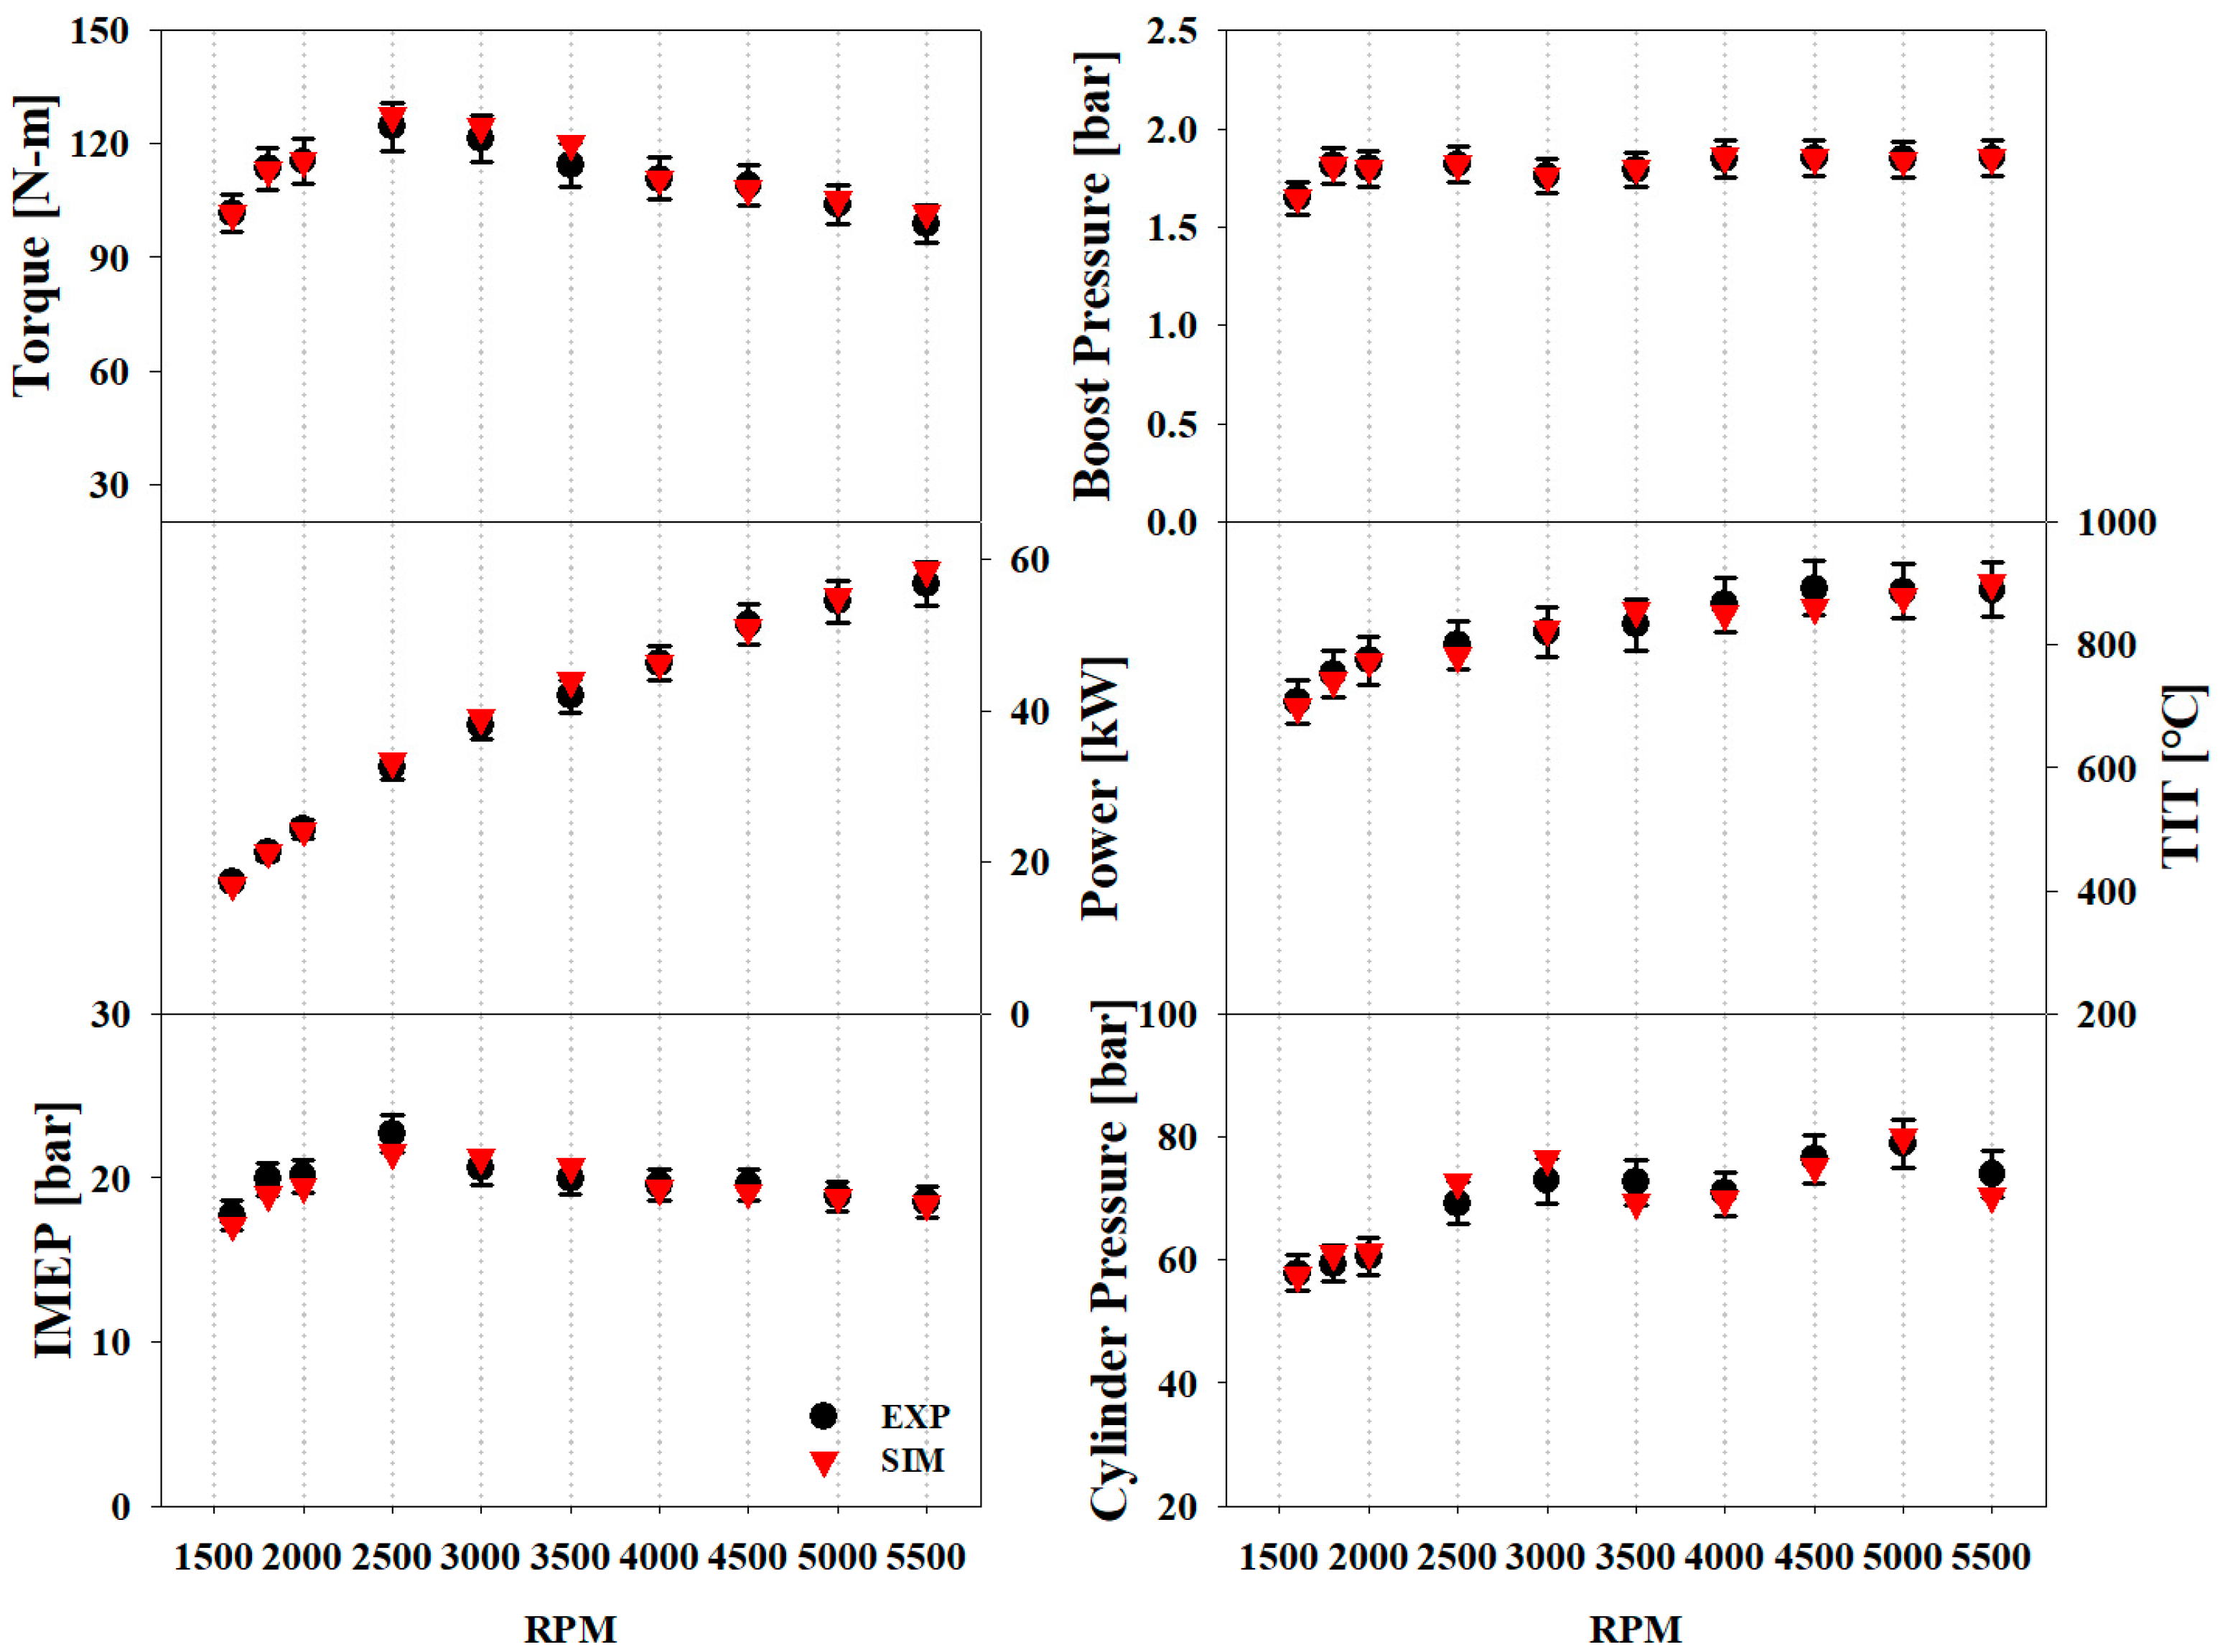
3.1. Comparison of the 1D Simulation and Experimental Results
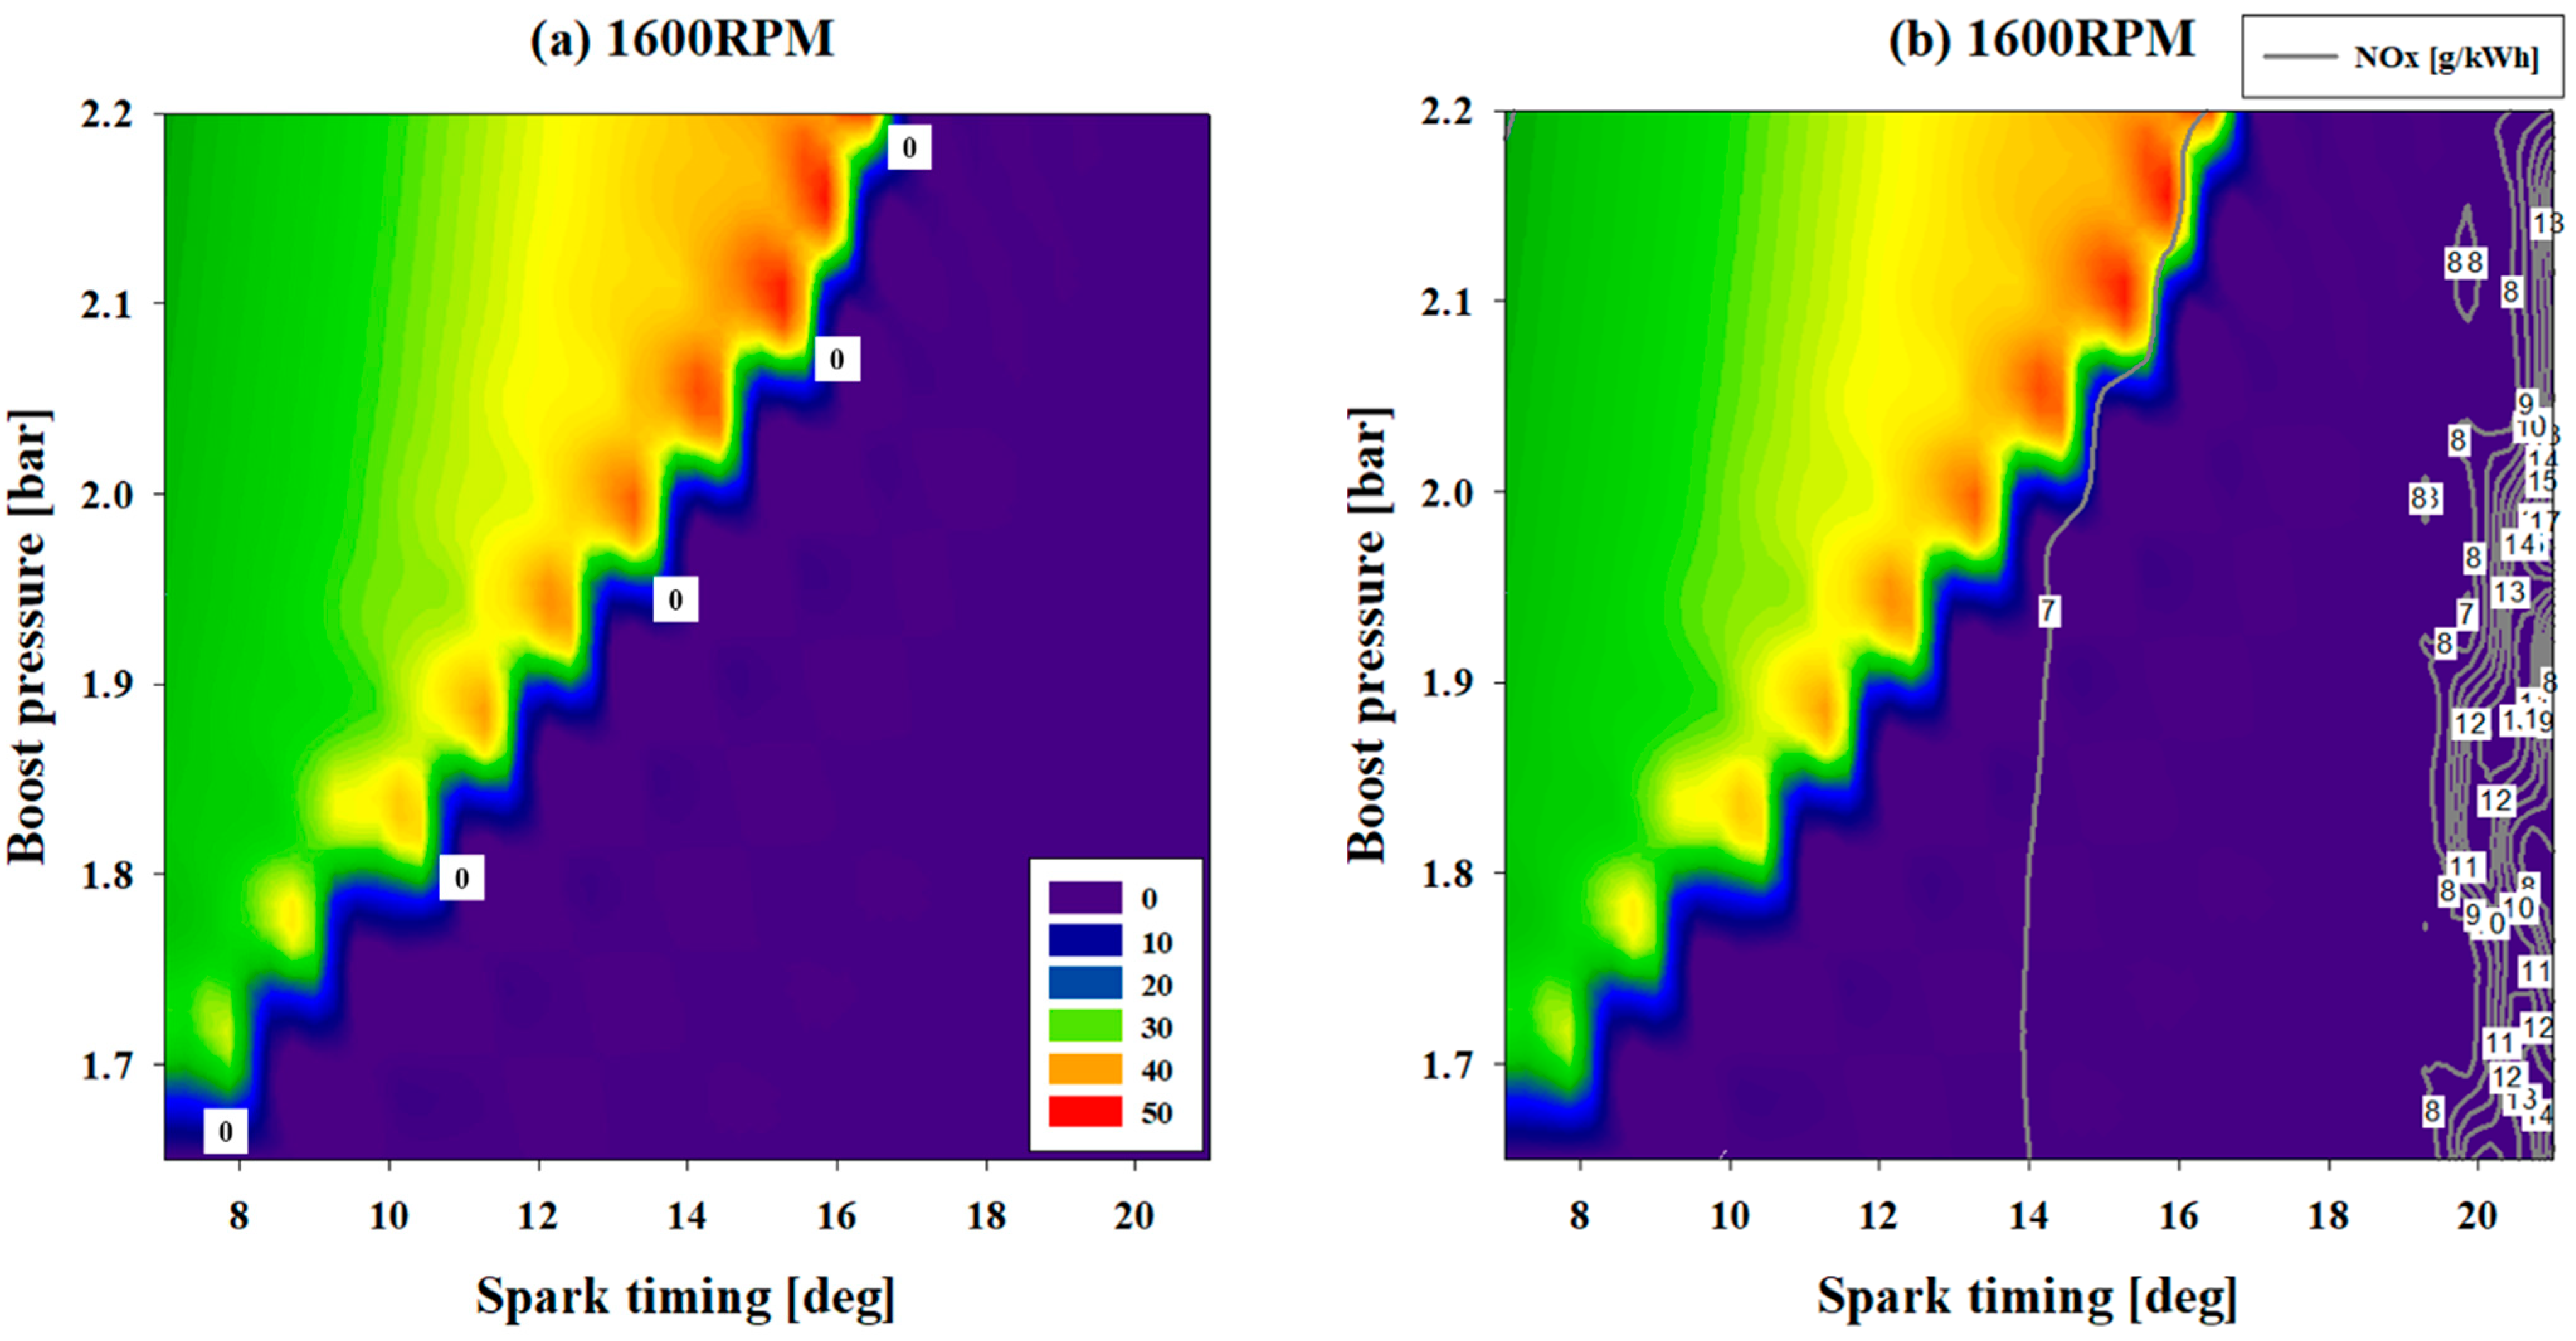
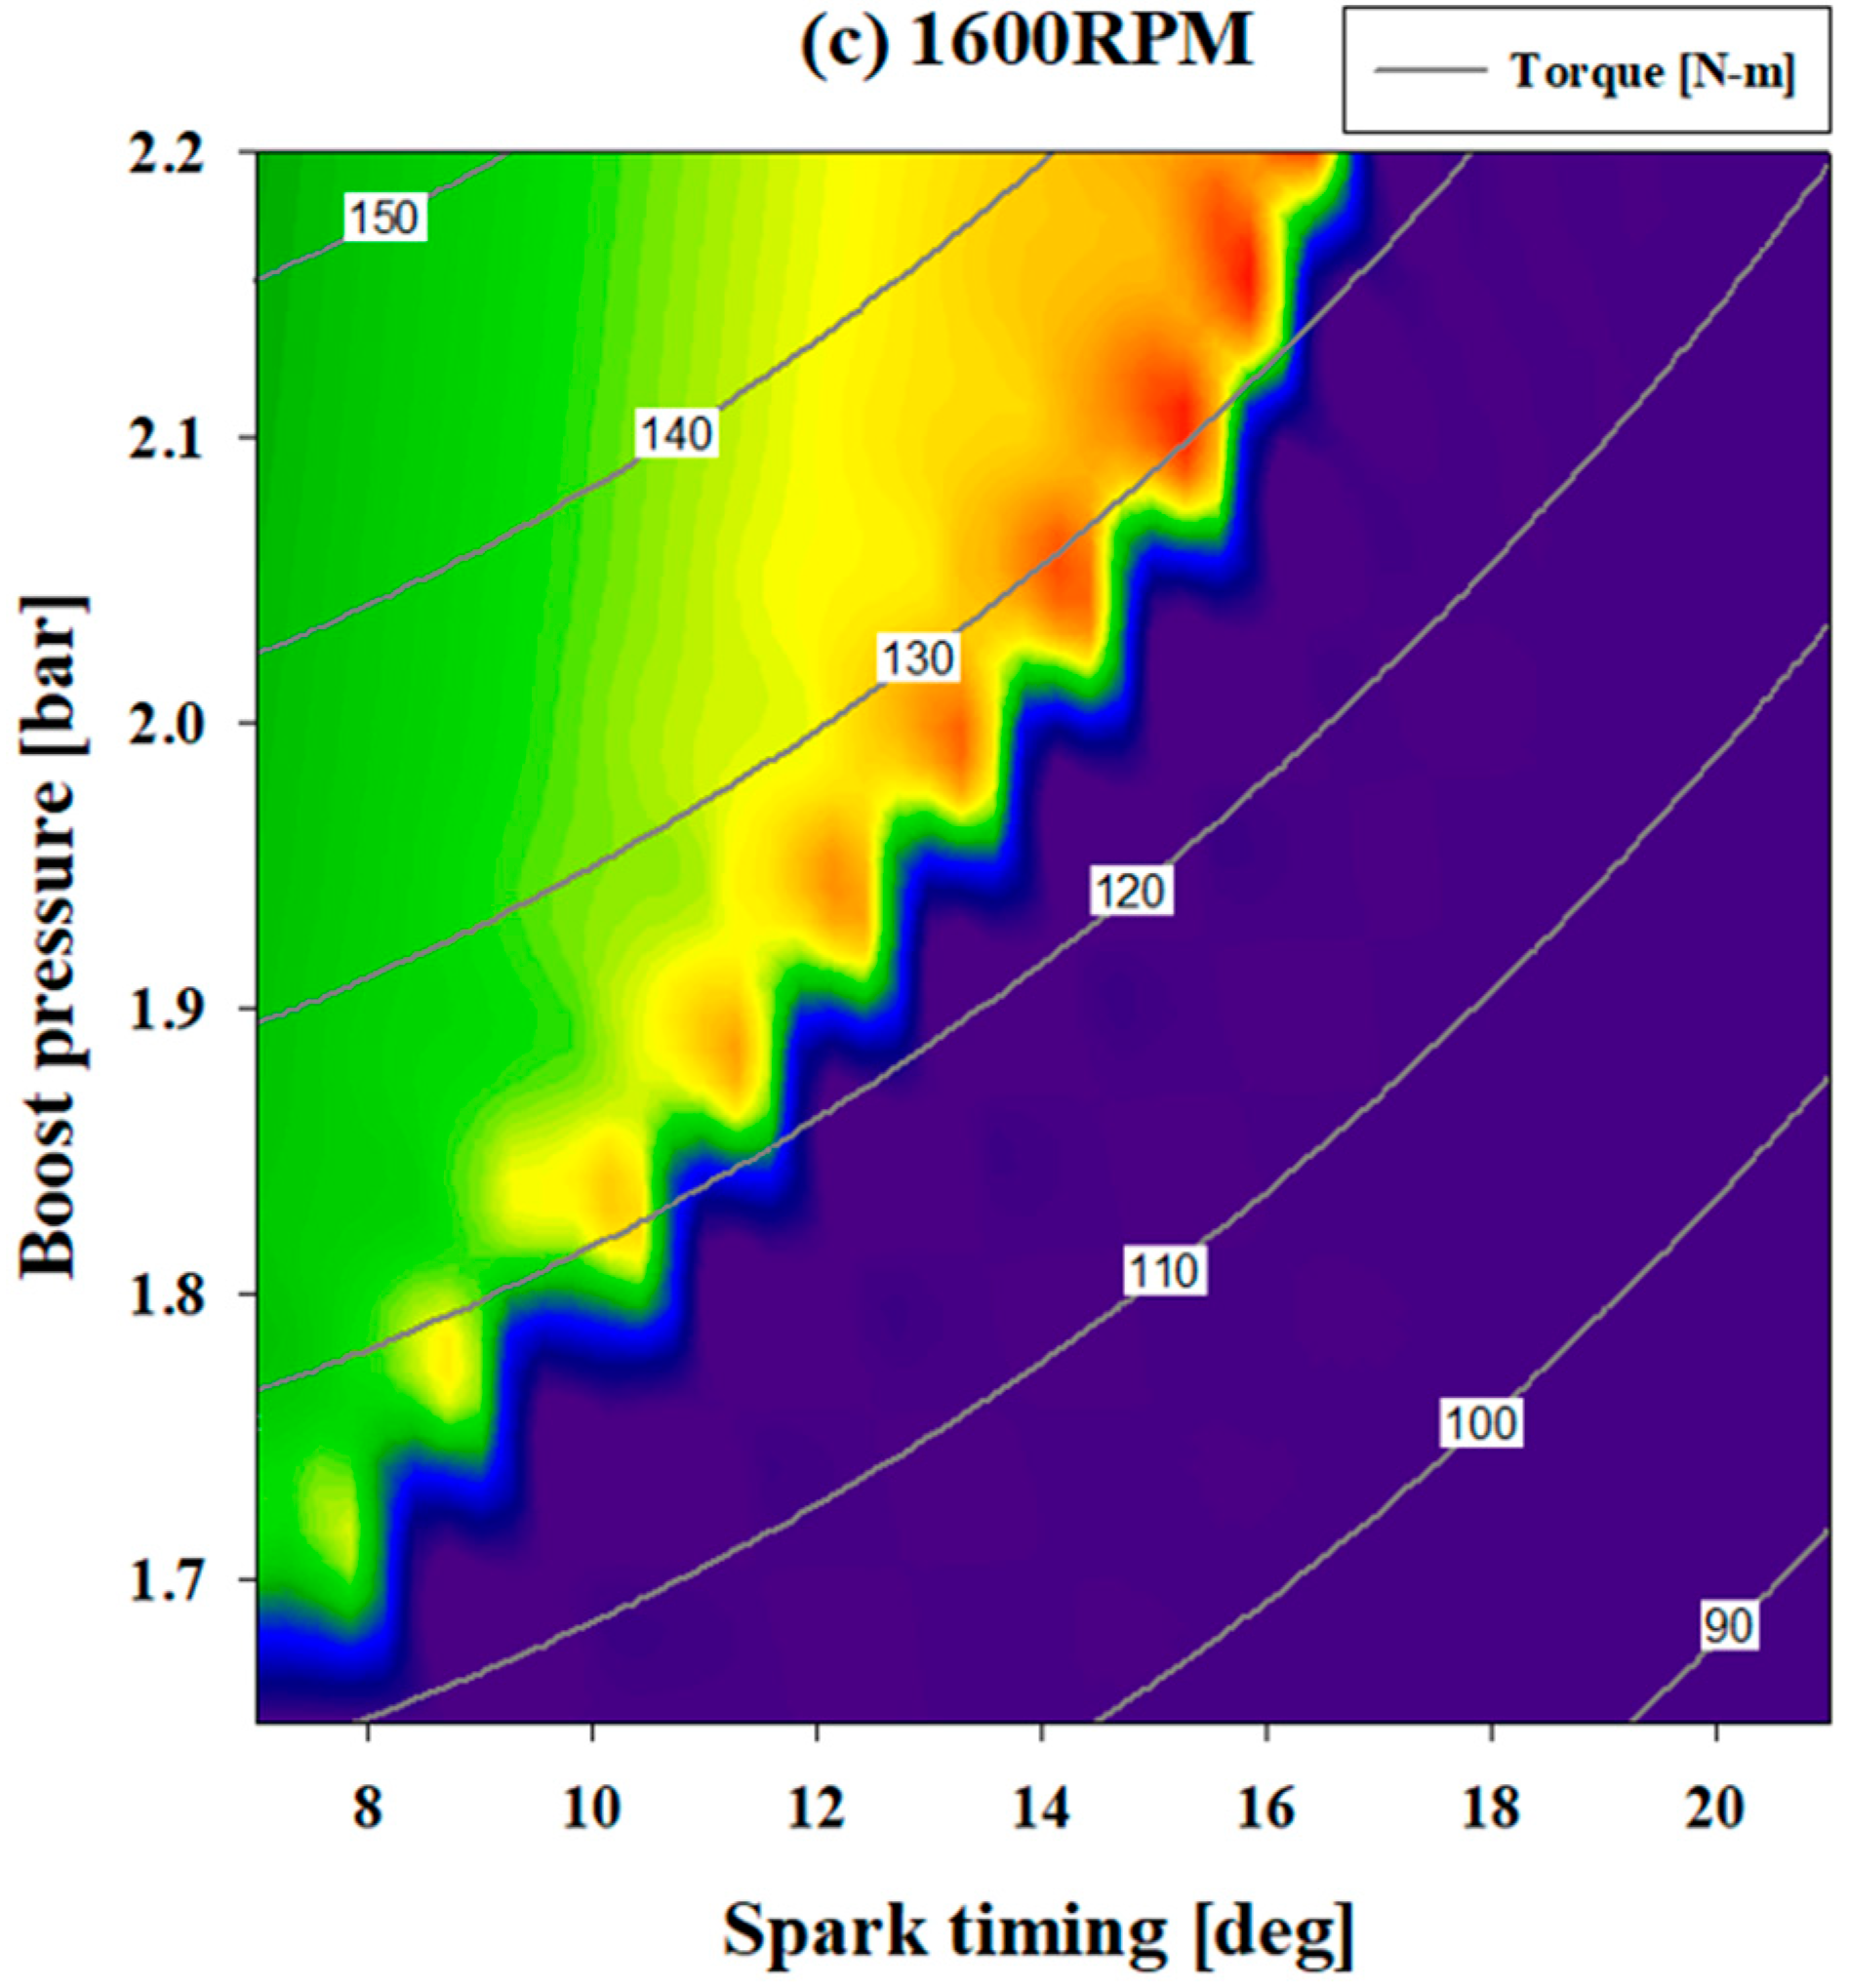
3.1.1. Effect of the Spark Timing
3.1.2. Effect of the Boost Pressure
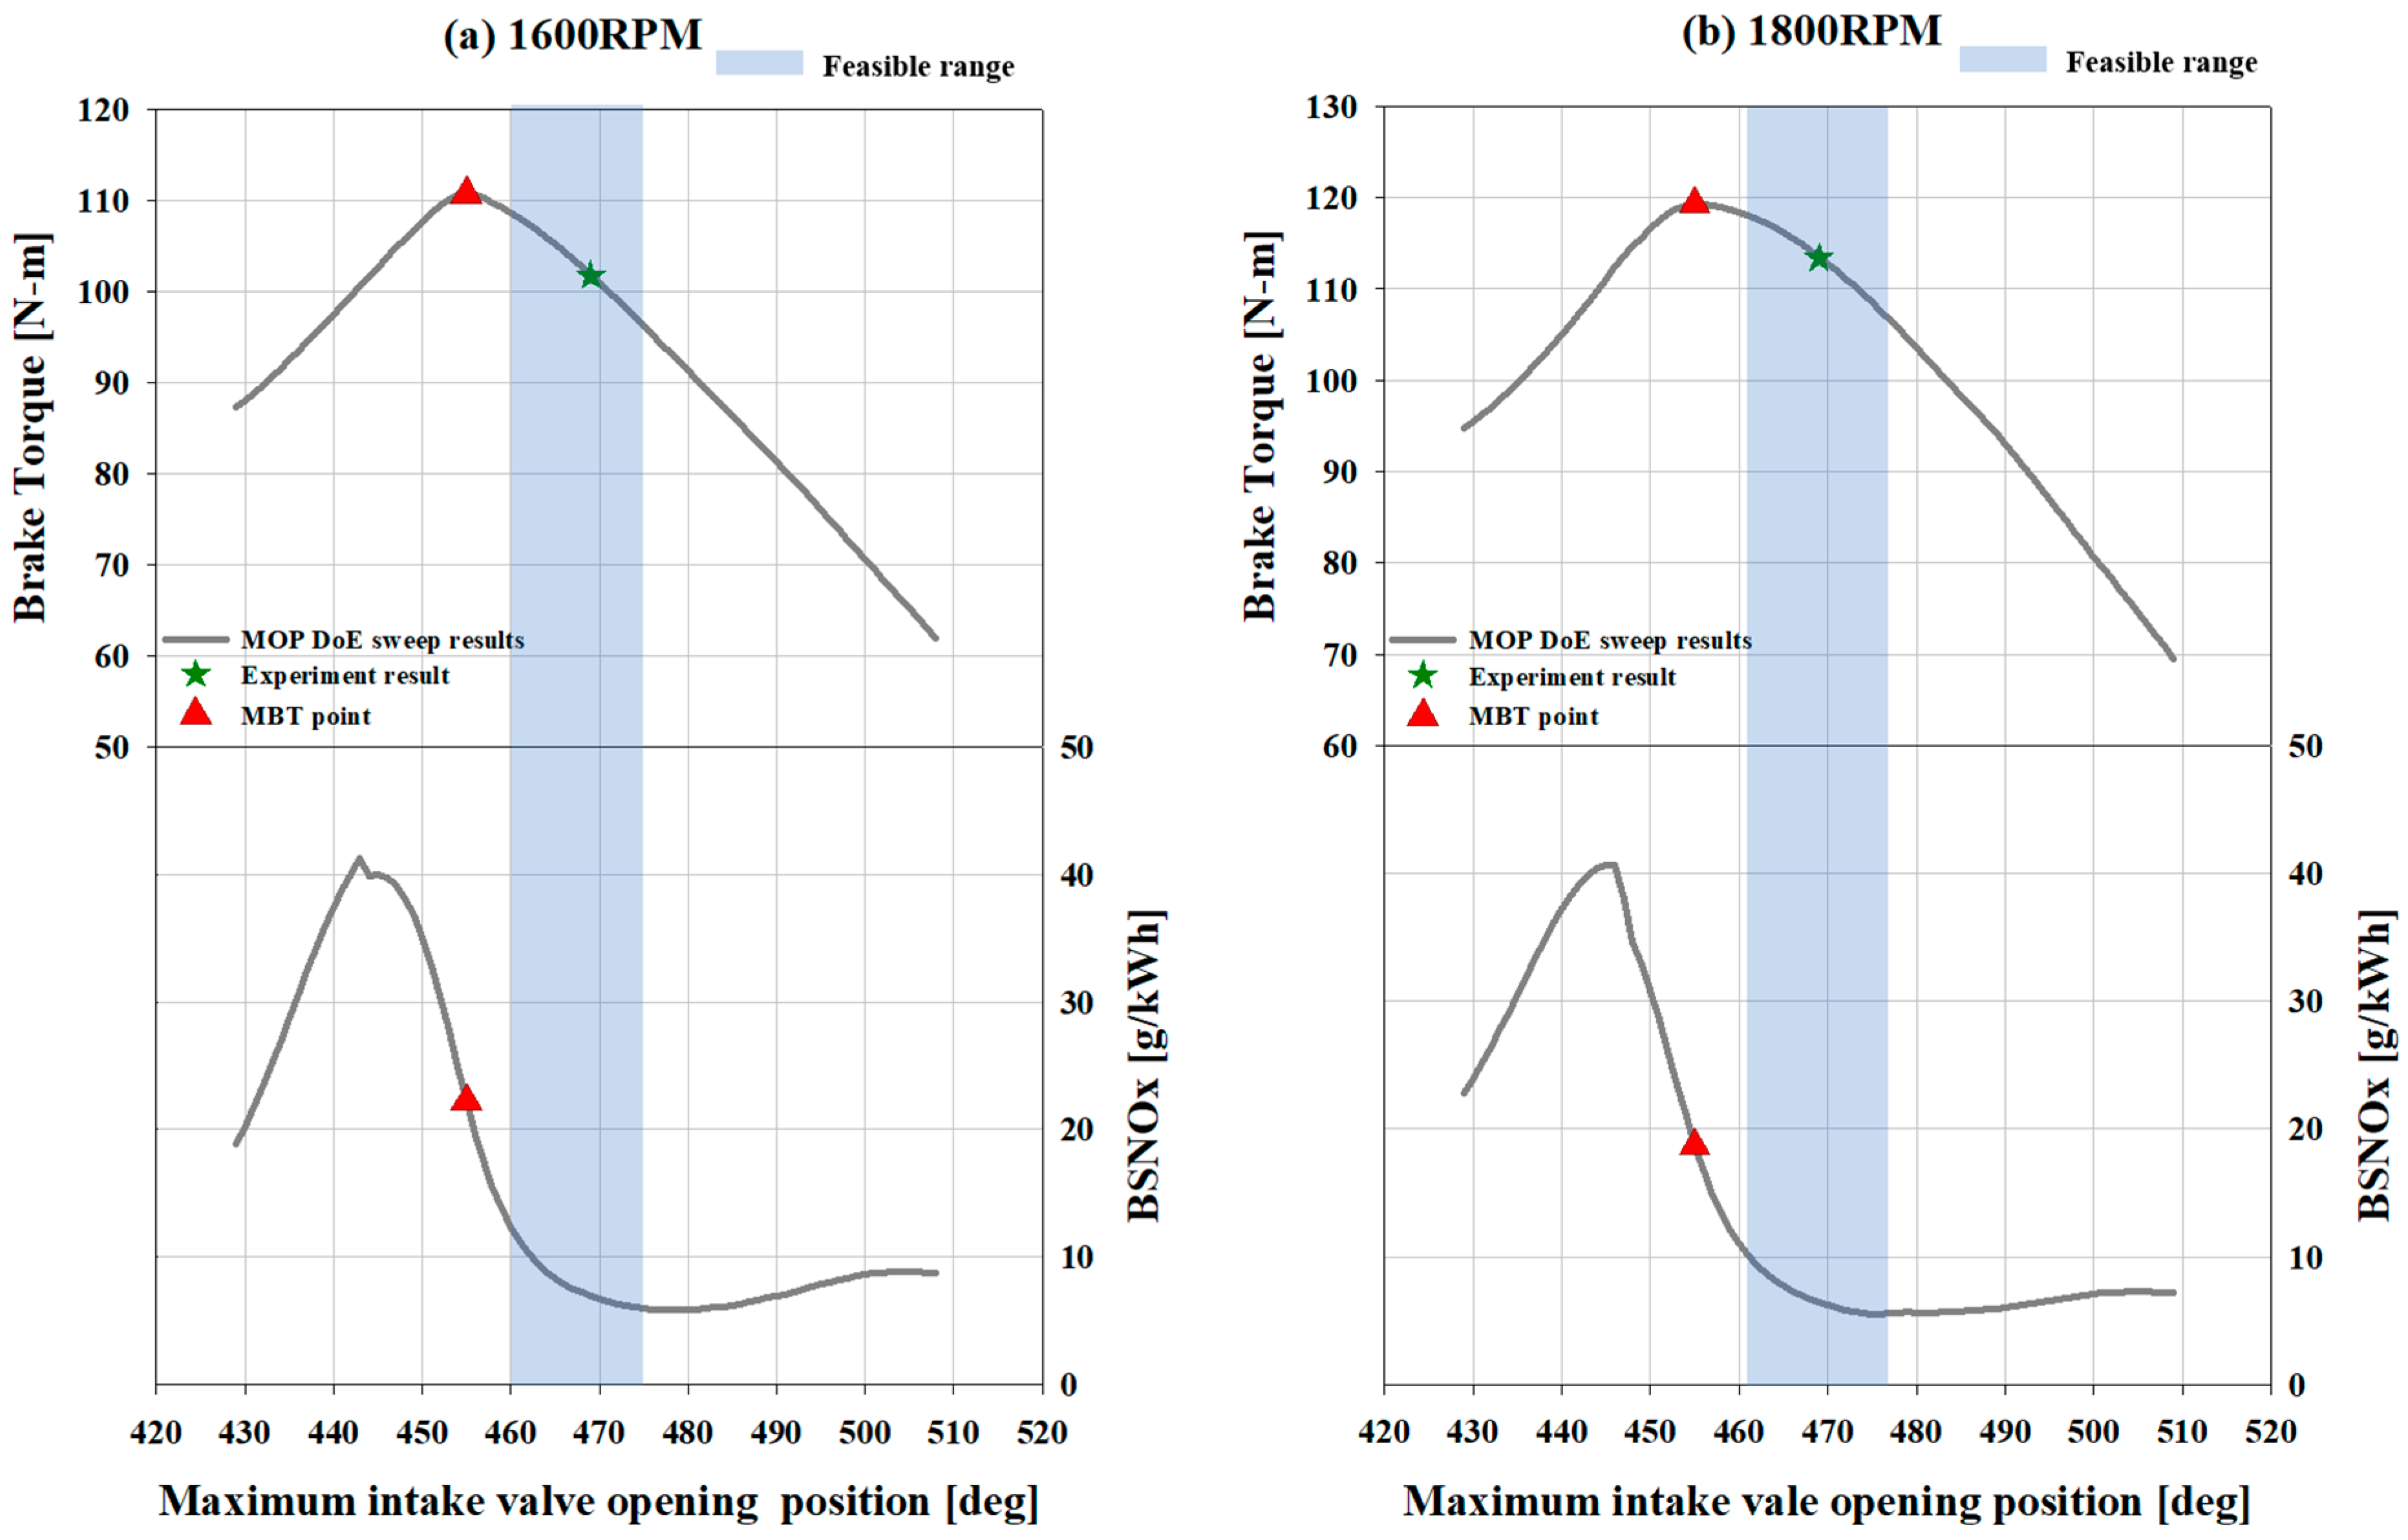
3.1.3. Effect of Intake Valve Opening Position
3.2. Multi Objective Pareto Solution
4. Conclusions
- Through DoE, it was confirmed whether torque and NOx tendency and knocking occurred according to the change in spark timing. An increase in RPM expanded the occurrence area of knocking, and it was confirmed that excessively retarded spark timing caused incomplete combustion, resulting in an unstable NOx tendency.
- Through the relationship between spark timing and boost pressure, it was possible to confirm the range of boost pressures that could be allowed at each spark timing without knocking. In addition, the optimization range could be selected to predict the occurrence of NOx.
- The tendencies of torque and NOx were confirmed through the DoE of the intake valve overlap. It was confirmed that the valve overlap affects the performance of the engine and exhaust gas emissions by controlling the residual gas and fresh air in the cylinder. Additionally, it was confirmed that the more minimal the overlap interval, the higher the residual gas fraction, which reduces the amount of NOx. It can be seen that the IVO is inversely proportional to performance and exhaust emissions, and it was confirmed that, if it exceeds the appropriate overlap, it adversely affects the performance and exhaust gas.
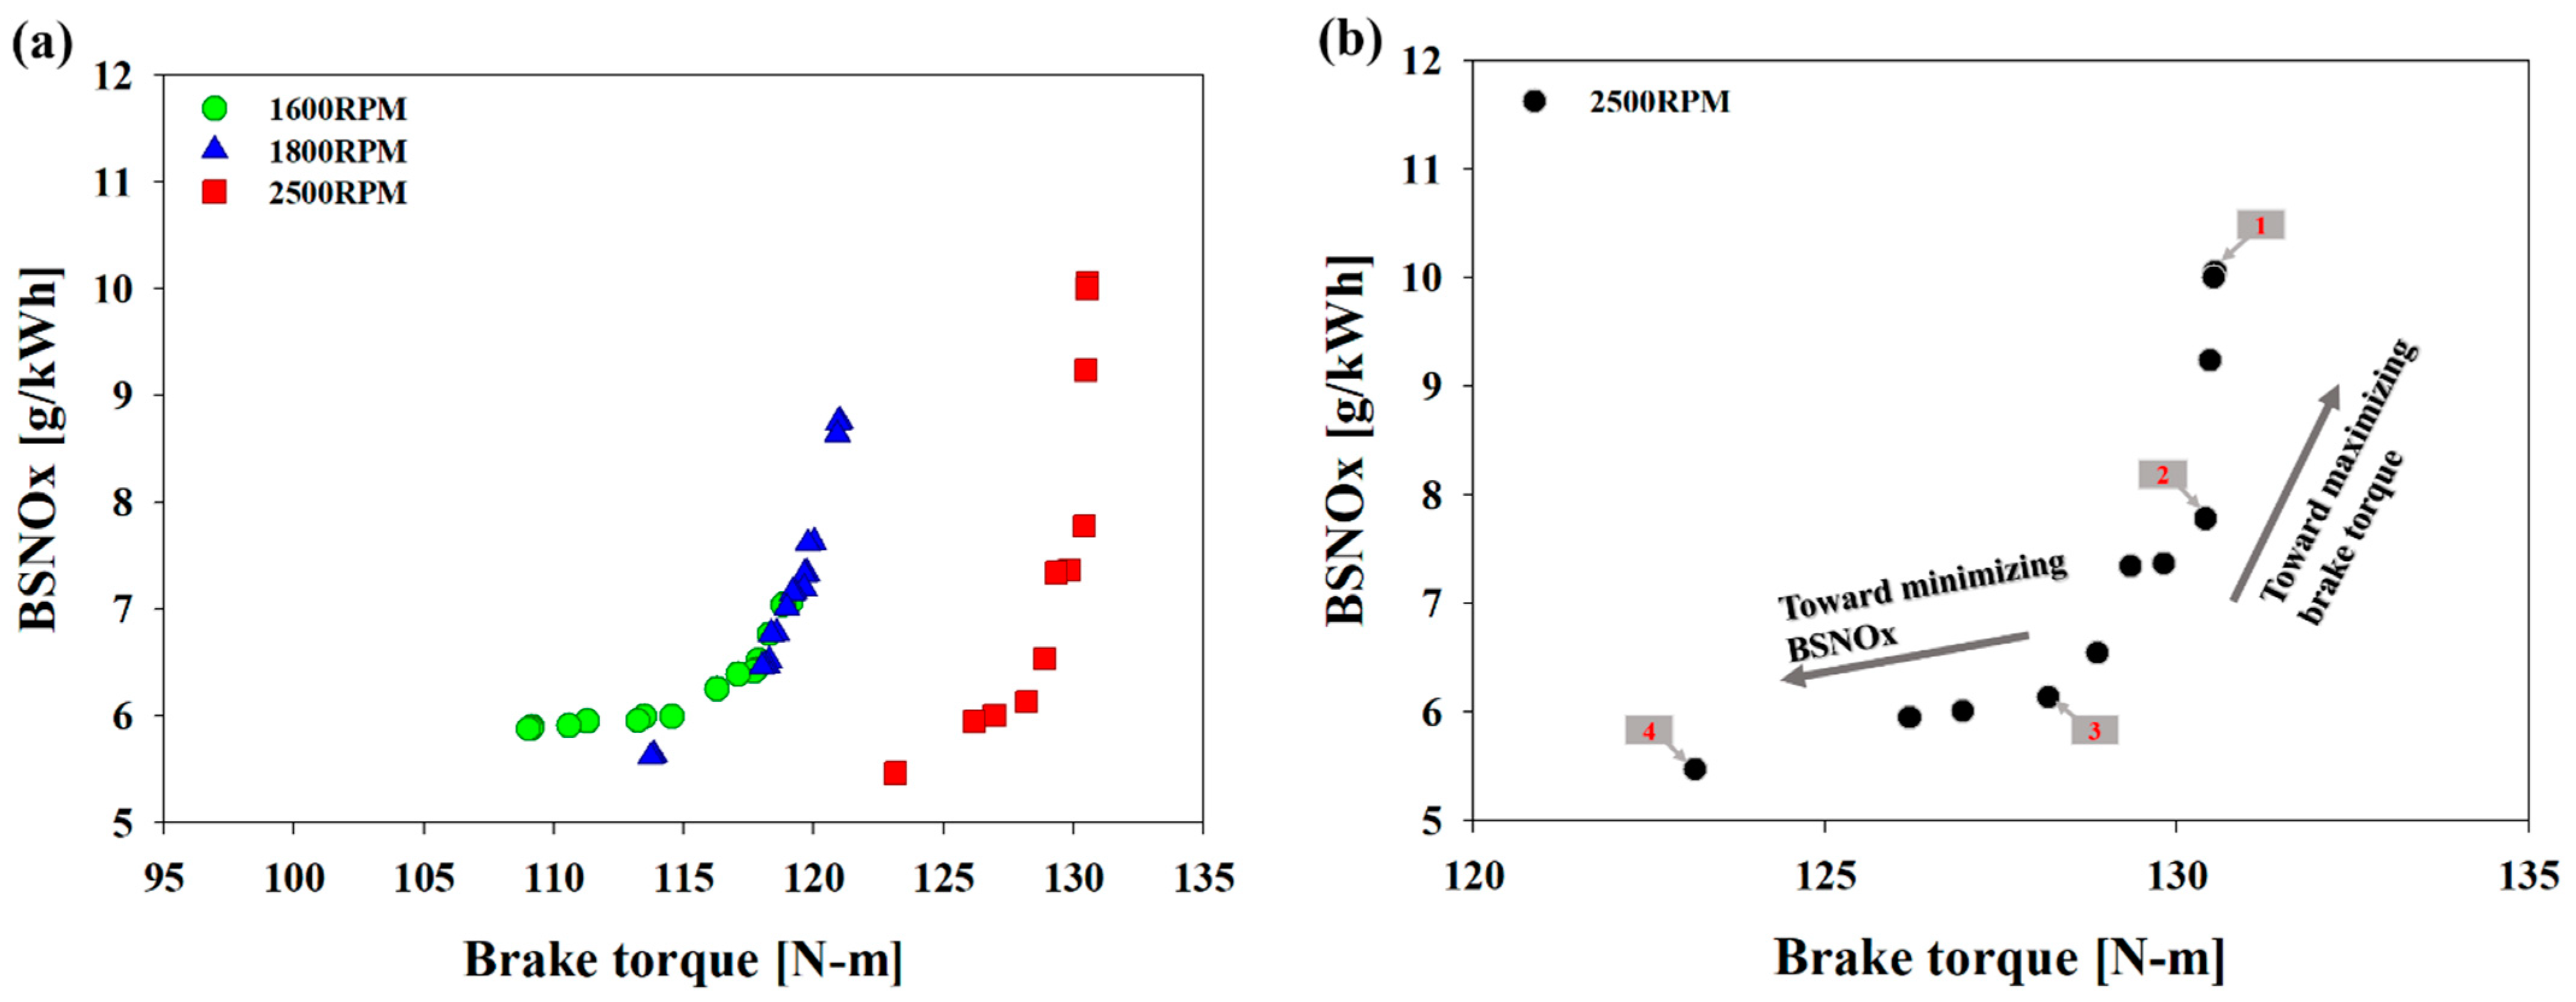
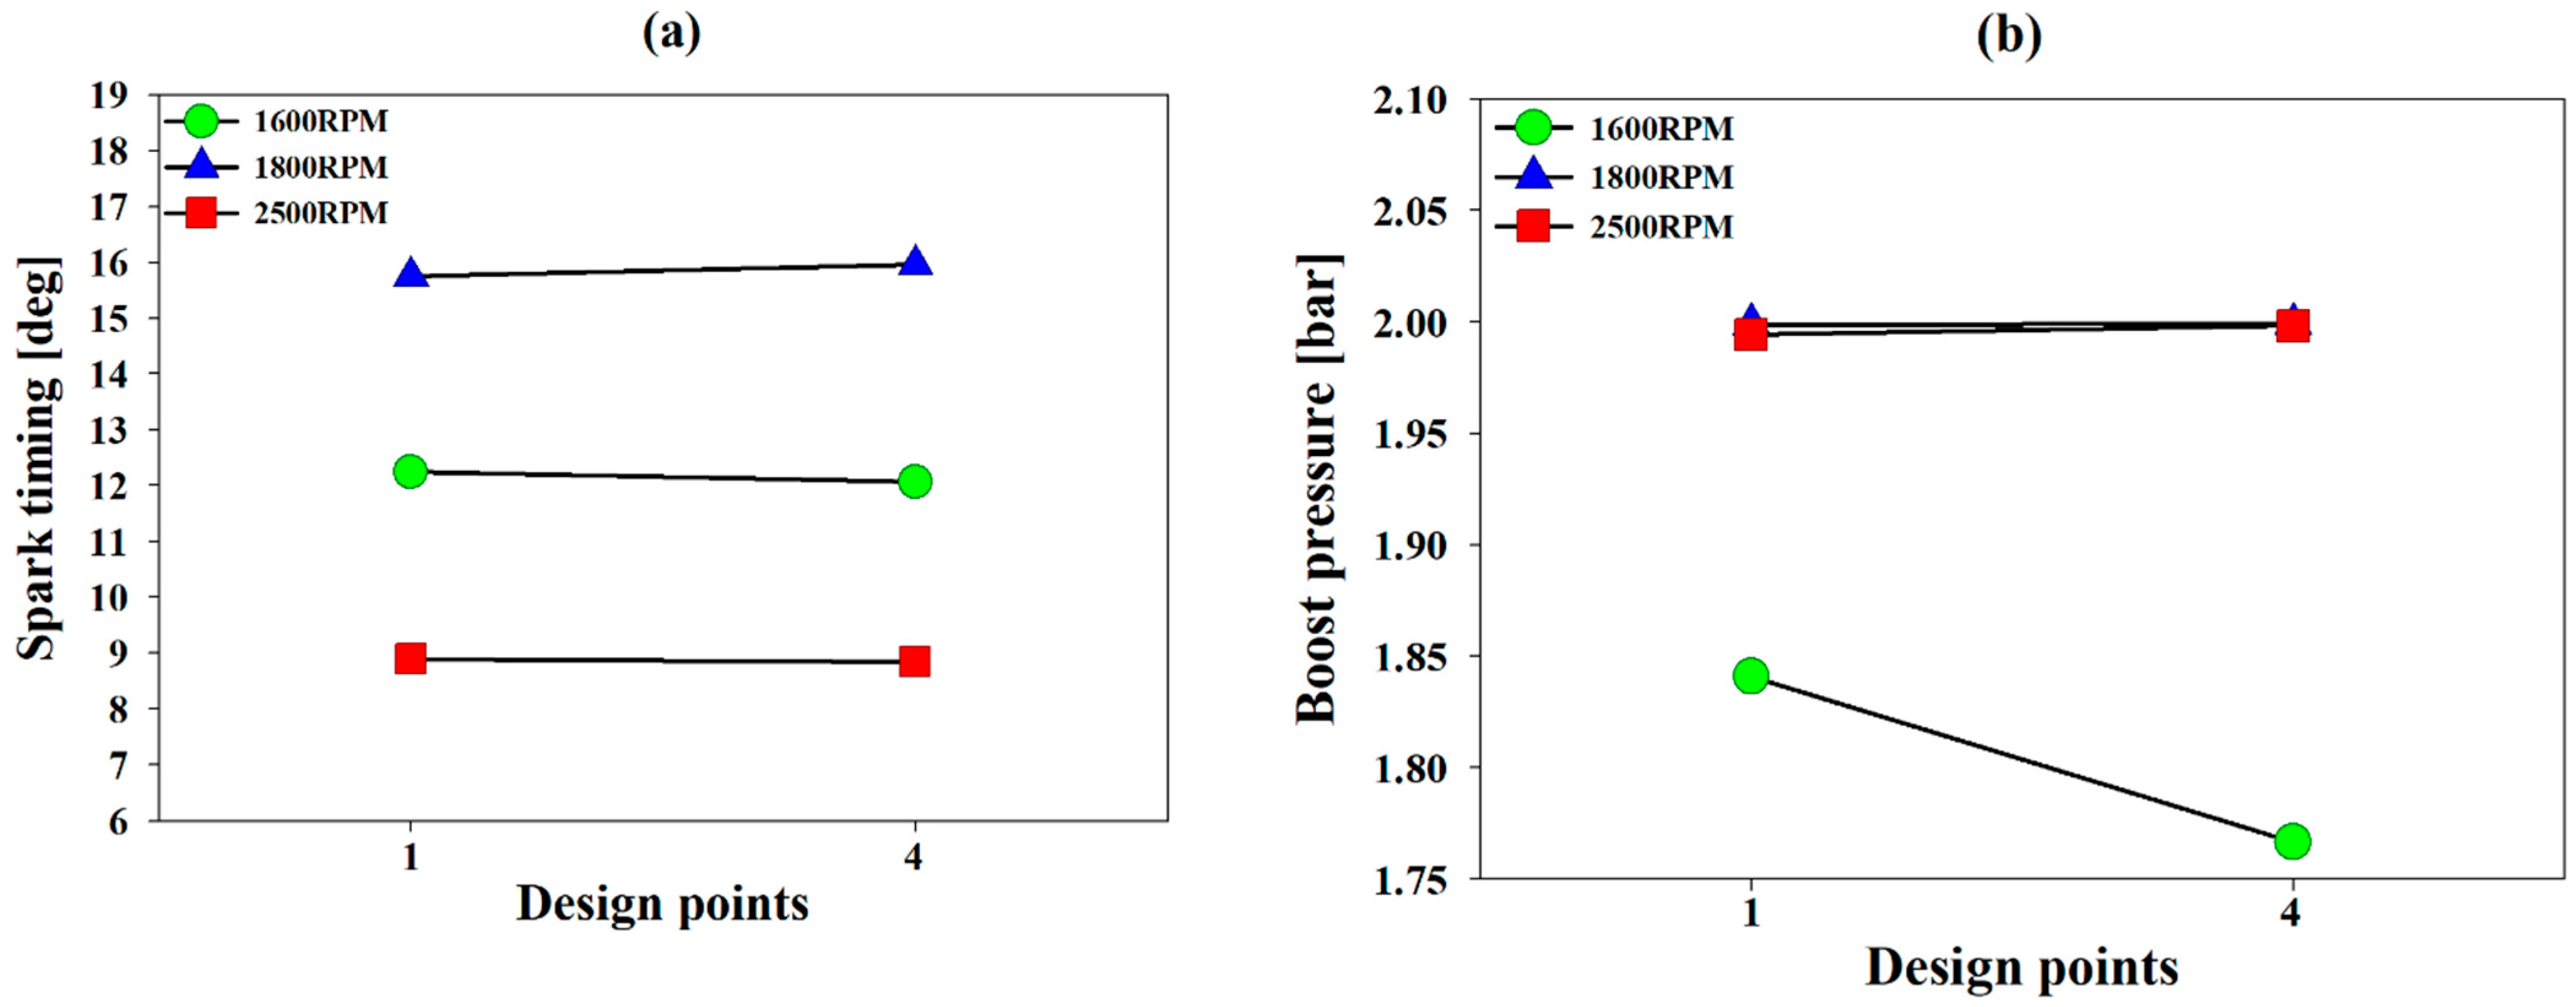
- The solution was presented using the Pareto technique. The trade-off relationship was confirmed through the Pareto front for each RPM, and through each design point, the area for maximizing torque and minimizing NOx emissions was determined. In addition, by studying the sensitivities of the variables, it was possible to confirm their relationships and effects on engine performance, and their effects on the exhaust gas. In the optimal solution, it was confirmed that IVO had the greatest impact.
- Figure 14a is a graph comparing the optimal Pareto solution selected at 1600 RPM with the results of the DoE simulation parameters. (1) shows a 6.98% increase from the base torque and a 5.57% decrease in NOx as a result of MOP 460° CA, which is 8° CA wider than the baseline overlap interval. (2) can confirm the effect of spark timing and boost pressure, and as a result of the 1° CA true timing and 0.15 bar increased boost pressure compared to the baseline value, the torque increased by 13.86% and NOx decreased by 48.21%. (3) is an optimization solution that uses the Pareto technique by synthesizing all the parameters. It has a 1.37° CA more advanced spark timing than the baseline value, a 0.19 bar greater boost pressure, and 4° CA reduced overlap interval. Although it has 1.1 N-m less torque than (2), it shows a 12.78% increase compared to the baseline value and a 54.31% decrease in NOx.
- Figure 14b is a comparative graph of 1800 RPM. (1) shows that the overlap section was widened by 7° CA, the torque increased by 4.11% compared to the baseline, and NOx decreased by 28.01%. (2) had a 4.7° retard spark timing compared to the baseline, but the boost pressure increased by 0.25 bar, resulting in a 3.42% increase in torque and a 42.82% decrease in NOx. (3) confirmed that the 2.93° CA retarded spark timing, 0.19 bar increase in boost pressure, and an overlap interval that was widened by 1° CA resulted in a 5.88% increase in torque compared to the baseline and a 43.75% decrease in NOx. Furthermore, at 1800 RPM, we found that even when spark timing, which has a significant impact on performance control was somewhat retarded, the relationship between the other variables, such as the increase in boost pressure, could compensate for the torque and reduce NOx.
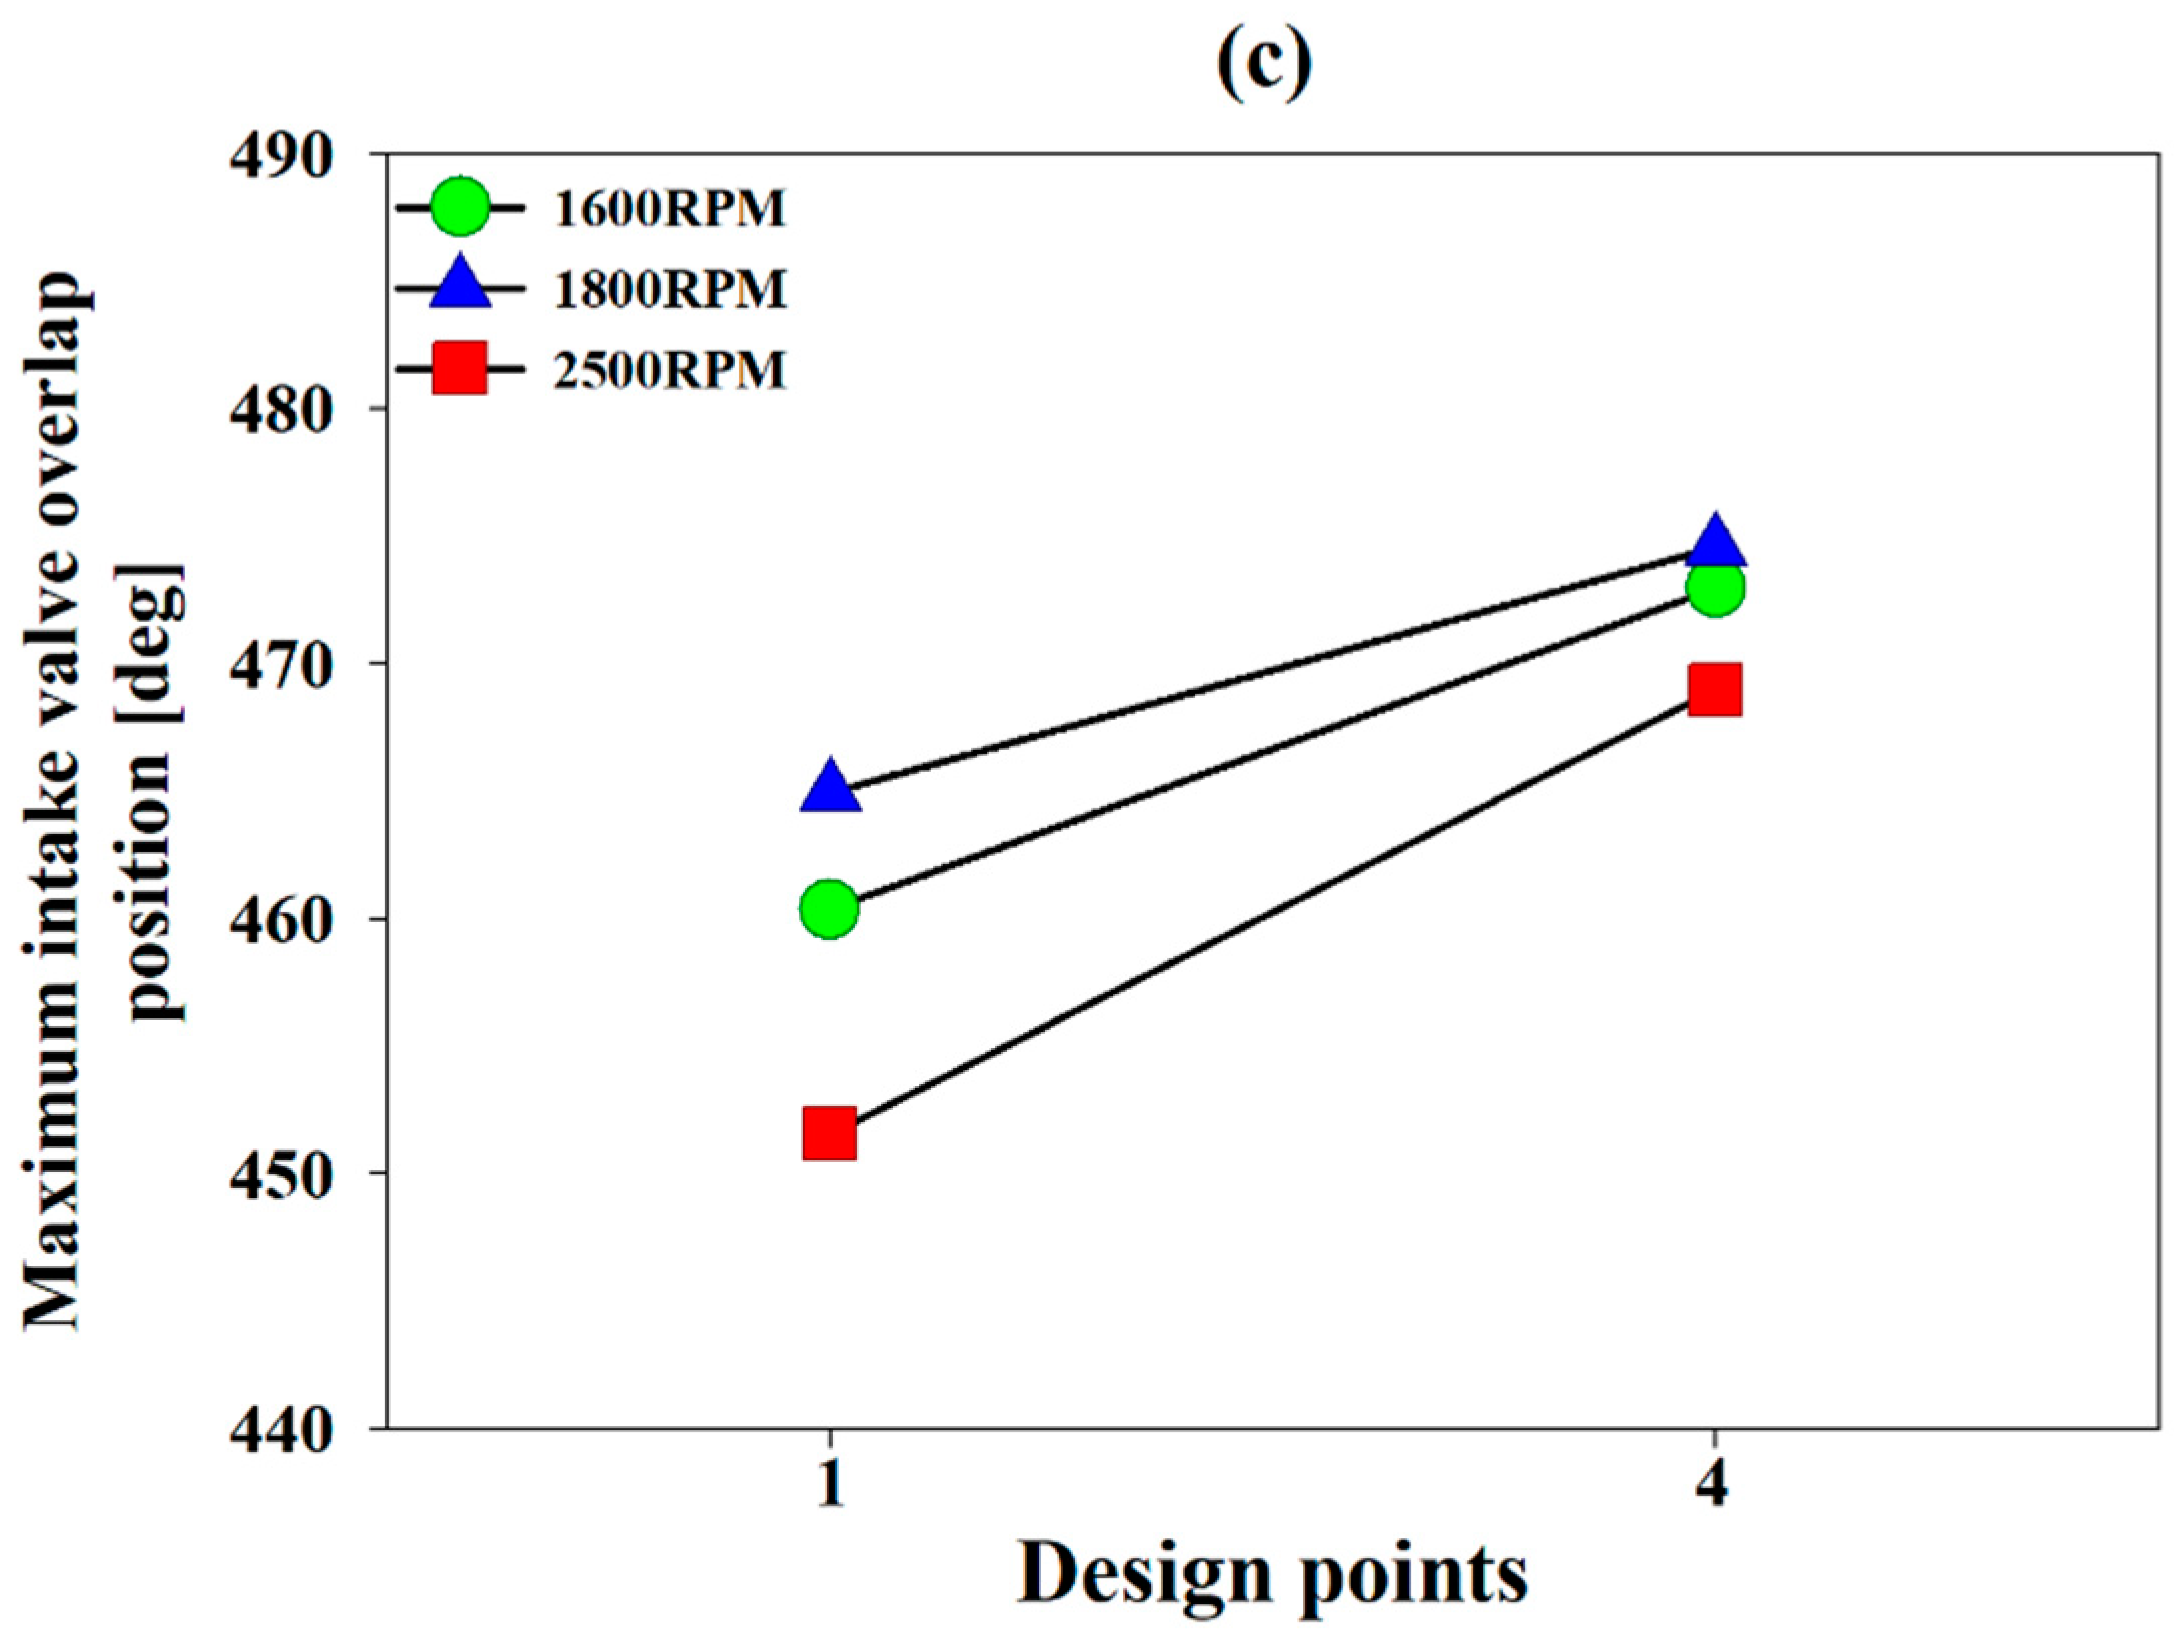
- Figure 14c shows a comparison of the 2500 RPM results. (1) can confirm a 37.52% NOx reduction and a 1.91% torque increase as the overlap intervals widens by 6° CA. (2) had a spark timing that was retarded by 4.1° CA compared to the baseline, but through an increase in boost pressure, the torque increased by 3.58% and NOx decreased by 42.64%. It can be seen that spark timing and boost pressure may offset one another. (3) offset the effect of the retarded spark timing through an increase in boost pressure and the decreased overlap interval; as a result, a 2.38% torque increase and 49.74% NOx decrease compared to the baseline were obtained.
Author Contributions
Funding
Institutional Review Board Statement
Informed Consent Statement
Data Availability Statement
Acknowledgments
Conflicts of Interest
Abbreviations
| 1D | One-dimensional |
| 3D | Three-dimensional |
| aTDC | After top dead center |
| CA | Crank angle |
| CAFE | Corporate Average Fuel Economy |
| CO | Carbon monoxide |
| DI | Direct injection |
| DOC | Diesel oxidation catalyst |
| DoE | Design of experiment |
| DPF | Diesel particulate filter |
| DPI | Dual port injection |
| EVC | Exhaust valve closed timing |
| GA | Genetic algorithms |
| IVO | Intake valve opening timing |
| MO | Multi-objective |
| MOGA | Multi-objective genetic algorithm |
| MOP | Maximum intake valve opening position |
| MPI | Multi point injection |
| NA | Naturally aspirated |
| NOx | Nitric oxides |
| PFI | Port fuel injection |
| PM | Particulate matter |
| RON | Research octane number |
| SCR | Selective catalytic reduction |
| SI | Spark ignition |
| SITurb | SI Turbulent Flame combustion model |
| UTV | Utility terrain vehicles |
| VCR | Variable compression ratio |
| VVT | Variable valve timing |
| WGT | Waste gate turbocharger |
| WOT | Wide-open throttle |
References
- Heywood, J.B. Internal Combustion Engine Fundamentals; McGraw-Hill Education: New York, NY, USA, 2018. [Google Scholar]
- Arbab, M.; Varman, M.; Masjuki, H.H.; Kalam, M.; Imtenan, S.; Sajjad, H.; Fattah Rizwanul, I.M. Evaluation of combustion, performance, and emissions of optimum palm–coconut blend in turbocharged and non-turbocharged conditions of a diesel engine. Energy Convers. Manag. 2015, 90, 111–120. [Google Scholar] [CrossRef] [Green Version]
- Feneley, A.J.; Pesiridis, A.; Andwari, A.M. Variable geometry turbocharger technologies for exhaust energy recovery and boosting-A Review. Renew. Sustain. Energy Rev. 2017, 71, 959–975. [Google Scholar] [CrossRef]
- Pawlowski, A.; Splitter, D. SI Engine Trends: A Historical Analysis with Future Projections; SAE Technical Paper; SAE International: Warrendale, PA, USA, 2015. [Google Scholar]
- Yokoyama, T.; Hoshi, T.; Yoshida, T.; Wakashima, K. Development of twin-entry scroll radial turbine for automotive turbochargers using unsteady numerical simulation. In Proceedings of the 11th International Conference on Turbochargers and Turbocharging, London, UK, 13–14 May 2014; pp. 471–478. [Google Scholar]
- Walkingshaw, J.; Iosifidis, G.; Scheuermann, T.; Filsinger, D.; Ikeya, N. A comparison of a mono, twin and double scroll turbine for automotive applications. Turbo. Expo. Power Land Sea Air 2015, 56796, V008T23A17. [Google Scholar]
- Zi, D.; Zhang, L.; Chen, B.; Zhang, Q. Study of the electric-booster and turbo-generator system and its influence on a 1.5 L gasoline engine. Appl. Therm. Eng. 2019, 162, 114236. [Google Scholar] [CrossRef]
- Wang, Z.; Huang, R.; Wang, W.; Jiang, G. Optimization on performance of a turbocharged MPI gasoline engine by working process simulation based on target control method. In Proceedings of the 2011 International Conference on Electric Information and Control. Engineering (IEEE), Wuhan, China, 15–17 April 2011; pp. 6000–6004. [Google Scholar]
- Duchaussoy, Y.; Barbier, P.; Schmelzle, P. Impact of Gasoline RON and MON on a Turbocharged MPI SI Engine Performances. SAE Trans. 2004, 113, 1446–1453, paper number 2004-01-2001. [Google Scholar]
- Zhang, Q.; Xu, Z.; Li, M.; Shao, S. Combustion and emissions of a Euro VI heavy-duty natural gas engine using EGR and TWC. J. Nat. Gas Sci. Eng. 2016, 28, 660–671. [Google Scholar] [CrossRef]
- Kim, C.; Lee, D.; Oh, S.; Kang, K.; Choi, H.; Min, K. Enhancing Performance and Combustion of an LPG MPI Engine for Heavy Duty Vehicles; SAE Technical Paper; SAE International: Warrendale, PA, USA, 2002. [Google Scholar]
- Nozawa, R.; Morita, Y.; Shimizu, M. Effects of engine downsizing on friction losses and fuel economy. Tribol. Int. 1994, 27, 31–37. [Google Scholar] [CrossRef]
- Shibata, M.; Komatsu, H.; Maeyama, K.; Asari, M.; Hotta, N.; Nakada, K.; Daicho, H. New 1.0 L I3 Turbocharged Gasoline Direct Injection Engine; SAE Technical Paper; SAE International: Warrendale, PA, USA, 2017. [Google Scholar]
- Mastrangelo, G.; Micelli, D.; Sacco, D. Extreme downsizing by the two-cylinder gasoline engine from Fiat. MTZ Worldw. 2011, 72, 4–11. [Google Scholar] [CrossRef]
- Eriksson, L.; Nielsen, L.; Brugård, J.; Bergström, J.; Pettersson, F.; Andersson, P. Modeling of a turbocharged SI engine. Annu. Rev. Control 2002, 26, 129–137. [Google Scholar] [CrossRef] [Green Version]
- Ahmadi, M. Intake, Exhaust and Valve Timing Design Using Single and Multi-Objective Genetic Algorithm; SAE Technical Paper; SAE International: Warrendale, PA, USA, 2007. [Google Scholar]
- Su, T.; Ji, C.; Wang, S.; Shi, L.; Yang, J.; Cong, X. Effect of spark timing on performance of a hydrogen-gasoline rotary engine. Energy Convers. Manag. 2017, 148, 120–127. [Google Scholar] [CrossRef]
- Panda, K.; Ramesh, A. Diesel injection strategies for reducing emissions and enhancing the performance of a methanol based dual fuel stationary engine. Fuel 2021, 289, 119809. [Google Scholar] [CrossRef]
- Park, J.; Lee, K.S.; Kim, M.S.; Jung, D. Numerical analysis of a dual-fueled CI (compression ignition) engine using Latin hypercube sampling and multi-objective Pareto optimization. Energy 2014, 70, 278–287. [Google Scholar] [CrossRef]
- Park, S.; Cho, J.; Park, J.; Song, S. Numerical study of the performance and NOx emission of a diesel-methanol dual-fuel engine using multi-objective Pareto optimization. Energy 2017, 124, 272–283. [Google Scholar] [CrossRef]
- Liu, J. Dumitrescu CE. 3D CFD simulation of a CI engine converted to SI natural gas operation using the G-equation. Fuel 2018, 232, 833–844. [Google Scholar] [CrossRef]
- Gamma Technologies. GT-SUITE Engine Performance Application Manual Version 2020; Gamma Technologies LLC: Westmont, IL, USA, 2020. [Google Scholar]
- Lavoie, G.A. Spectroscopic measurements of nitric oxide in spark ignition engines. Combust. Flame 1970, 15, 97–108. [Google Scholar] [CrossRef]
- Zhen, X.; Wang, Y.; Xu, S.; Zhu, Y.; Tao, C.; Xu, T.; Song, M. The engine knock analysis—An overview. Appl. Energy 2012, 92, 628–636. [Google Scholar] [CrossRef]
- Livengood, J. Correlation of autoignition phenomena in internal combustion engines and rapid compression machines. Symp. Int. Combust. 1995, 5, 347–356. [Google Scholar] [CrossRef] [Green Version]
- Ra, Y.; Reitz, R.D. A reduced chemical kinetic model for IC engine combustion simulations with primary reference fuels. Combust. Flame 2008, 155, 713–738. [Google Scholar] [CrossRef]
- Coello, C.C.; Van Veldhuizen, D.; Lamont, G. Evolutionary Algorithms for Solving Multi-Objective Problems; Kluwer Academic Publishers: Norwell, MA, USA, 2002. [Google Scholar]
- Ngatchou, P.; Zarei, A.; El-Sharkawi, A. Pareto multi objective optimization. In Proceedings of the 13th International Conference on, Intelligent Systems Application to Power Systems (IEEE), Arlington, VA, USA, 6–10 November 2005; pp. 84–91. [Google Scholar]
- Kanazaki, M.; Morikaw, M.; Obayashi, S.; Nakahashi, K. Multiobjective design optimization of merging configuration for an exhaust manifold of a car engine. International Conference on Parallel Problem Solving from Nature; Springer: Berlin/Heidelberg, Germany, 2002. [Google Scholar]
- Jimenez, F.; Gómez-Skarmeta, A.F.; Sánchez, G.; Deb, K. An evolutionary algorithm for constrained multi-objective optimization. In Proceedings of the 2002 Congress on Evolutionary Computation. CEC’02 (Cat. No. 02TH8600). 2. IEEE, Honolulu, HI, USA, 12–17 May 2002. [Google Scholar]


| Item | Specification |
|---|---|
| Engine volume (cc) | 798 |
| Cylinder arrangement | 2cyl., I-type |
| Bore -Stroke (mm) | 77.4–84.8 |
| Compression ratio | 9.2 |
| Connecting rod length (mm) | 128.4 |
| Wrist pin to crank offset (mm) | 10 |
| Firing intervals (° CA) | 360 |
| Injection type | MPI |
| Max. torque@ RPM | 124.5 N-m@2500 RPM |
| Max. power@ RPM | 56.8 kW@5500 RPM |
| Case No. | RPM | IMEP (Bar) | Boost Pressure (Bar) | Spark Timing (deg) | Maximum Intake Valve Opening Position (Deg) | Peak Cylinder Pressure (Bar) | Brake Torque (N-m) | Pareto Solution |
|---|---|---|---|---|---|---|---|---|
| 1 | 1600 | 17.7 | 1.648 | 13.5 | 469 | 53.8 | 101.7 | √ |
| 2 | 1800 | 19.9 | 1.814 | 12.8 | 469 | 59.4 | 113.4 | √ |
| 3 | 2000 | 20.1 | 1.796 | 9 | 469 | 60.5 | 115.4 | |
| 4 | 2500 | 21.8 | 1.819 | 5.4 | 459 | 69.2 | 124.5 | √ |
| 5 | 3000 | 20.6 | 1.759 | 2.3 | 459 | 66.8 | 121.3 | |
| 6 | 3500 | 20 | 1.792 | −6 | 459 | 72.6 | 114.4 | |
| 7 | 4000 | 19.6 | 1.846 | −8.6 | 459 | 75.5 | 110.8 | |
| 8 | 4500 | 19.5 | 1.851 | −11.3 | 459 | 76.3 | 109.0 | |
| 9 | 5000 | 18.9 | 1.844 | −14.3 | 459 | 78.9 | 103.9 | |
| 10 | 5500 | 18.5 | 1.850 | −17.3 | 81.2 | 98.7 |
| i | A | b | c | d | e | f |
|---|---|---|---|---|---|---|
| 1 | 4.445 × 10⁻⁷ | 3.613 | −0.64 | −0.564 | 0.3978 | 12,920 |
| 2 | 11,941.423 | 3.613 | −0.64 | −1.4596 | 0.4867 | −1957 |
| 3 | 8.905 × 10⁻⁷ | 0 | −0.25 | −0.547 | 0 | 166,856 |
| Input Variables | Ranges | |||
|---|---|---|---|---|
| 1600 RPM | 1800 RPM | 2500 RPM | ||
| DoE | Spark Timing [CA ATDC] | 12–15 | 15.5–17.5 | 8.5–10.5 |
| Intake valve overlap [CA] | 460–474 | 461– 476 | 449–471 | |
| Boost pressure [bar] | 1.65–1.85 | 1.8–2.0 | 1.8–2.0 | |
| Total | 240–280 points [DoE] 200 points [Pareto optimization] | |||
Publisher’s Note: MDPI stays neutral with regard to jurisdictional claims in published maps and institutional affiliations. |
© 2021 by the authors. Licensee MDPI, Basel, Switzerland. This article is an open access article distributed under the terms and conditions of the Creative Commons Attribution (CC BY) license (https://creativecommons.org/licenses/by/4.0/).
Share and Cite
Kim, S.; Sim, J.; Cho, Y.; Sung, B.-S.; Park, J. Numerical Study on the Performance and NOx Emission Characteristics of an 800cc MPI Turbocharged SI Engine. Energies 2021, 14, 7419. https://doi.org/10.3390/en14217419
Kim S, Sim J, Cho Y, Sung B-S, Park J. Numerical Study on the Performance and NOx Emission Characteristics of an 800cc MPI Turbocharged SI Engine. Energies. 2021; 14(21):7419. https://doi.org/10.3390/en14217419
Chicago/Turabian StyleKim, Seungmin, Jaesam Sim, Youngsoo Cho, Back-Sub Sung, and Jungsoo Park. 2021. "Numerical Study on the Performance and NOx Emission Characteristics of an 800cc MPI Turbocharged SI Engine" Energies 14, no. 21: 7419. https://doi.org/10.3390/en14217419