Article

Solar-Powered Cellular Base Stations in Kuwait: A Case Study

Department of Electrical Engineering, College of Engineering and Petroleum, Kuwait University, P.O. Box 5969, Safat, Kuwait City 13060, Kuwait
*
Author to whom correspondence should be addressed.
Energies 2021, 14(22), 7494; https://doi.org/10.3390/en14227494
Submission received: 4 October 2021 / Revised: 2 November 2021 / Accepted: 5 November 2021 / Published: 9 November 2021
(This article belongs to the Section A2: Solar Energy and Photovoltaic Systems)

Abstract

:
With the rapidly evolving mobile technologies, the number of cellular base stations (BSs) has significantly increased to meet the explosive demand for mobile services and applications. In turn, this has significantly increased the capital and operational expenses, due to the increased electricity prices and energy consumption. To generate electricity, power plants mainly rely on fossil fuels, which are non-renewable energy resources. As a result, CO 2 emissions also increase, which adversely affect health and environment. For wireless access technologies and cellular networks, BSs are the largest power consumer, and the network energy consumption is mainly dominated by the network infrastructure, which makes the telecommunications sector liable for energy consumption as well as CO 2 emissions around the globe. Alternatively, solar energy is considered as an eco-friendly and economically attractive solution, due to its cost-effectiveness and sustainability. In this paper, the potentials of photovoltaic (PV) solar power to energize cellular BSs in Kuwait are studied, with the focus on the design, implementation, and analysis of off-grid solar PV systems. Specifically, system components, such as the number of PV panels, batteries, and converters needed for the design are determined and evaluated via HOMER software, with the focus on minimizing the net present cost (NPC). A comparison between various PV, diesel generator (DG), and battery bank (BB) system configurations is also performed. Moreover, a comparison of system deployment area will be presented for different PV panels that have different output power and panel sizes, in addition to utilizing a solar tracking system. It is revealed that utilizing a hybrid system configuration (i.e., PV-DG-BB) decreases fuel consumption per year by almost 95% in comparison to the conventional DG-only based electric systems. Not only that, but utilizing a pure off-grid solar PV system (i.e., PV-BB) can significantly reduce the total NPC while completely eliminating CO 2 emissions; however, at the expense of more land.

1. Introduction

In the last decade, there has been a tremendous growth in the cellular networks market, with the number of subscribers and demand for wireless applications and services escalating dramatically [1]. Future wireless communication systems and networks are not only expected to accommodate the rapid increase in the number of subscribers, data rates and real-time services, but also achieve significantly better energy-efficiency and complete network coverage [2]. For wireless access technologies and cellular networks, the base stations (BSs) are the largest power consumer, accounting for about 57% of the total energy consumption [3,4,5]. Furthermore, the network energy consumption is mainly dominated by network infrastructure. Most of today’s BSs are either off-grid (i.e., powered via diesel generators (DGs)), or operated through electrical grids from fossil-fuel-dependent power plants. Therefore, the telecommunications sector is liable for energy consumption as well as carbon dioxide (CO 2 ) and greenhouse gas (GHG) emissions around the globe.
Recently, the integration of renewable energy sources has become crucial and indispensable in the design and implementation of future wireless networks and systems [6]. Most cellular network operators aim at increasing energy independence by efficiently utilizing the temporally varying renewable energy—coupled with energy storage solutions—to ensure sustainability and cleaner energy [7]. One of the key technologies that could help towards this aim is the application of renewable-energy-powered base stations (REPBSs), which primarily rely on locally harvested and stored energy while also utilizing renewable solutions, such as photovoltaic (PV) solar panels and wind turbines. Particularly, REPBSs can minimize (or completely eliminate) dependency on the electrical grid and thus pose themselves as a long-term ideal solution for cellular network operators. This is especially in the new residential and remote areas.
Most cellular network operators are continuously expanding their network coverage to provide services to subscribers in residential as well as remote areas. This has created a push to install more equipment, towers, and BSs that are off-grid with no infrastructure (It has been reported in [8] that at least 10% of telecommunication systems are being off-grid connected, and around 10,000 base stations today are partially powered by renewable energy as grid-connected or hybrid systems [9].). In some scenarios, extending the grid connection to provide energy to off-grid base-station sites is not economic (or possible), due to geographical limitations. As mentioned earlier, off-grid BSs mainly rely on DGs, which run for 8–10 h/day or even 24 h/day, making them emissions-intensive. In addition to that are the high fossil fuel costs, which are due to increasing fuel transportation costs, labor, spillage, and theft. Therefore, deploying off-grid DG-based BSs in such areas increases both operational expenditures (OPEX) and capital expenditures (CAPEX), making energy a critical-cost determinant for cellular network operators and subscribers. Hence, energizing cellular networks via off-grid BSs requires very careful network planning in addition to a well-designed electric generation system. This is essential to strike an optimal balance between harvested energy, energy consumption, and energy storage [10].

1.1. Related Works

Several studies have recently been conducted to analyze, deploy, and optimize solar-powered cellular base stations, while focusing on the net present cost (NPC) and cost-of-energy (COE) (It should be noted that the NPC of a system is the present value of all the costs the system incurred during its lifetime, minus the present value of all the revenues made over its lifetime. On the other hand, COE is defined as the average cost per kW-hour (kWh) of useful electrical energy produced by the system.). For instance, PV solar-powered mobile BSs have been technically analyzed in [11]. Specifically, the authors proposed that PV solar-powered BSs can be either grid-connected, hybrid, or stand-alone and discussed the differences between each configuration. Current scenarios, issues, and proposed solutions of PV solar-powered BSs are discussed in [9]. The energy optimization of hybrid off-grid remote fourth-generation (4G) BSs in Malaysia has been studied in [12], with the aim of minimizing OPEX and GHG emissions with guaranteed sustainability. In particular, a PV-DG system with a battery bank has been designed and simulated, where it has been shown that 43–47% of annual OPEX savings can be achieved. Additionally, a comparison to the same BS load in Germany has been considered, where it has been shown that although the solar system components are cheaper in Germany, the NPC of the designed system is almost double that of Malaysia. In [13], the authors study the potential of applying solar energy to 4G cellular BSs in South Korea and demonstrated that up 48.6% of savings can be achieved for OPEX. The work in [14] considers the feasibility of using solar energy for grid-connected BSs in Bangladesh and the possibility of minimizing the dependency on the DG-based power supply while also considering load-shedding hours. To be specific, a conventional DG-based back-up system is compared with the proposed grid-connected PV-battery-converter system. It has been demonstrated that the proposed system is more cost-effective and significantly reduces CO 2 emissions than the existing system. In [15], the feasibility and simulation of a solar PV-battery hybrid power system is studied in the Soshanguve, South Africa, for a BS site with a load of 241.10 kWh/day and peak load of 20.31 kW. It has been demonstrated that the PV-battery system achieves about 59.62% saving in the NPC and COE, whereas 80.87% is achieved in OPEX in comparison to the conventional DG-battery power systems. The potentials of using a PV-DG-battery system to power six base station locations in Nigeria have been analyzed in [16] and were shown to be more effective than conventional DG-based systems. An off-grid PV-battery electric system is proposed in [17] to meet the load demand of a 4G BS, where it has been shown to minimize the total OPEX by about 15.24% in comparison to the conventional DG-based system. The work in [18] considers the deployment of a solar PV/fuel cell hybrid system to power a remote BS in Ghana, with the goal of minimizing the COE and GHG emissions. The proposed system has been shown to lower the COE when compared to grid-connected BSs. Moreover, it has been shown that the COE of proposed system is 67% lower than the diesel power system at the same site and 30% cheaper than a PV-battery-diesel hybrid system, while saving about 43 tCO 2 /yr and 67 tCO 2 /yr in comparison to the PV-battery-diesel and diesel power systems, respectively. Lastly, a comprehensive analysis of solar-powered base stations for various generations of cellular networks is presented in [19], ultimately suggesting REPBSs as a long-term solution for cellular networks industry. All the aforementioned works demonstrate a momentous shift towards REPBSs and the emerging significance of such base stations. As the REPBSs concept is still in early stages, to open the way for wider adoption, a number of issues need further investigations to optimize and improve its reliability and stability aspects under various conditions and scenarios.

1.2. 4G vs. 5G Cellular Networks

4G wireless systems and networks—represented by Long-Term Evolution (LTE) and its extension, LTE-Advanced (LTE-A)—were first deployed in 2009 and then spread worldwide [20], providing new transmission protocols and multiple-antenna schemes that improve cell-edge coverage, handover between cells, connectivity, mobility, and roaming. Not only that, but 4G systems support All-IP services and applications, such as multiple-user video conferencing, location-based services, tele-medicine, HDTV, video games on demand, cloud computing, and much more [21]. Despite the success of LTE-A-based 4G networks, there is still a continuously increasing demand for higher data rates, spectral- and energy-efficiency, ubiquitous mobility, and higher network capacity [22]. Particularly, 4G networks have approached the theoretical limits on the achievable data rates (download rates ∼3 Gbps and upload rates ∼1.5 Gbps), and there is an urgent need for more sophisticated bandwidth-intensive mobile broadband applications and services that further push the limits on future wireless systems and standards to cope with the exponentially (∼1000×/decade) growing mobile data traffic [23]. Added to that, there is a continuous need for optimized energy performance not only to enable longer battery life of mobile devices, but also to reduce overall network energy consumption while stuffing more bits per second into each hertz of spectrum [24]. In the second quarter (Q2) of 2020, the number of mobile subscriptions around the world reached about 6.4 billion, which reflects a 7% annual increase [25]. Moreover, LTE has accounted for about 57% of all mobile subscribers, and the mobile network data traffic grew 53% between Q2 2019 and Q2 2020.
The fifth generation (5G) wireless systems and cellular networks were introduced in late 2019 not only to accommodate the rapid increases in the number of subscribers, data rates, and real-time services, but also to achieve significantly better energy efficiency and complete network coverage in a sustainable and more resource-efficient way [26]. By 2024, 5G mobile subscriptions are expected to reach about 8.9 billion globally, while there are currently 4.1 billion cellular Internet-of-Things (IoT) connections, amounting to about 136 ExaBytes (EB) per month of data traffic [27]. More importantly, 5G costs more and also consumes much more power than 4G, since 5G networks need 3 × BSs for the same coverage as 4G, which is mainly due to the use of higher frequencies and the massive antenna arrays (MIMO) (and hence more power amplifiers, analog-to-digital paths, and digital circuitry). For instance, 4G BSs use four transmitter and four receiver (4T4R) elements, while 5G is expected to use 32R32R or 64T64R MIMO arrays [28]. Nevertheless, the intelligent energy-saving features (e.g., sleep mode) of New Radio (NR) 5G networks make them much more energy-efficient (Watt/bit) than 4G networks [29,30]. Currently, several mobile network operators operate both 4G and 5G transmissions on their BSs [31], and thus, it is essential to consider the design and optimization of solar-powered cellular BSs to meet the required network data rates and BS load demands.

1.3. Kuwait’s Energy Consumption and Renewable Energy Prospects

In the State of Kuwait, weather is characterized by extremely hot and dry summers (between April and October), with temperatures exceeding 50 °C with very low cloud cover, while strong winds and severe dust storms frequently occur. In winter (between December and February), air temperature drops below 10 °C, with short and rare rainy seasons spreading over winter months. Autumn and spring seasons are rather brief with intermittent weather patterns [32]. Buildings account for 85% of peak power, 80% of Kuwait’s electricity use, and 37% of the primary energy consumption [33]. Every year, higher consumption of electricity (kWh/year) is noticed due to the rising temperatures and construction of new cities and residential areas. More importantly, Kuwait’s only sources of primary energy, such as oil and natural gas, are non-renewable resources that emit GHGs. Kuwait’s current method of generating electricity relies upon conventional power plants, which cannot keep up with the increasing demand of electricity unless more plants are constructed (which are costly and cause environmental damage) (Kuwait power plants generate about 870 gCO 2 for each kWh of electricity, which significantly exceeds the world average of 573 gCO 2 /kWh [34]). It has been reported that Kuwait imports about 3.75–4 billion cubic meters of liquefied natural gas (LNG) each year to operate its power plants [35]. Additionally, several new residential areas and cities are being built in Kuwait on the outskirts of the capital—by the Public Authority for Housing Welfare (PAHW)—to meet the demands for affordable housing solutions [36]. The first city currently being built, South of Al-Mutla’a City, is expected to include around 30,000 homes with a population of about 400,000 people. This city will include parks, schools, medical centers, governmental buildings, and other structures. Another city to be built, South of Saad Al-Abdullah, is expected to be similar in size and capacity. Both cities will be built as eco-friendly cities with smart engineering strategies for sustainable and cost-effective development. This puts pressure on Kuwait’s government to consider sources of clean and green energy and reduce the demand for power through energy-efficient technologies in buildings, power stations, and industries. Specifically, exploiting renewable resources in Kuwait would allow it to be independent from the LNG imports as well as respond to its increasing demand for electricity, which is expected to grow to 32 Gigawatts in 2035 [37].
In Kuwait, the predominant and abundant renewable energy source is in the form of solar power. In particular, Kuwait’s solar potential—measured in terms of global horizontal irradiance (GHI) (GHI is the total amount of shortwave radiation received from above by a surface horizontal to the ground, which is an essential metric for PV installations [38])—is estimated at 1900–2100 kWh/m 2 /year with maximum annual sun and average peak hours of about 12 and 9.2 h daily, respectively [39]. Figure 1 depicts the average daily GHI and clearness index per month, where it is clear that the daily GHI in each month averages between 3 kWh/m 2 and 8 kWh/m 2 [40]. Evidently, Kuwait is a country with one of the highest levels and quality of solar irradiation in the world [41]. In fact, it has been demonstrated in [42] that Kuwait has plenty of solar energy capability due to the almost cloudless atmosphere for nine months and the high solar time per day over the year.

1.4. Motivation and Contributions

This work addresses the sustainability of future cellular networks in Kuwait by reducing the use of electrical grids and diesel generators in operating base stations via solar PV solutions. Since new cities and residential areas are being built in Kuwait, the benefits of using such base stations are to: (1) enable the deployment of off-grid base stations to provide network coverage and access to most areas, where a reliable energy source does not exist, (2) reduce OPEX and CAPEX for cellular network operators and thus lower costs for network subscribers, (3) significantly reduce energy consumption as well as CO 2 and GHG emissions, and (4) provide insulation from tariffs and fossil fuel prices and their fluctuations, which reduces dependency on oil exports and improves the economy of Kuwait. In turn, this paper studies the potentials of PV solar power to energize cellular BSs in Kuwait, with the focus on the design, implementation, and analysis of an off-grid system. Particularly, system components, such as the number of PV panels, batteries, and converters needed for the design, are determined and evaluated via the hybrid optimization model for electric renewables (HOMER) software package [43,44,45] (Other software packages (e.g., PVsyst [46] and HolioScope [47]) can be used; however, HOMER has been considered due to its extensive techno-economic tools, micro-grid optimization capability, and wide acceptance by similar works [12,13,14,15,16,17,18,19]). HOMER will be used to design, simulate, and optimize various system configurations and designs to meet the realistic load demand of a 4G/5G BS, with the aim of minimizing the NPC. Various PV, DG, and battery bank (BB) system configurations are evaluated in terms of NPC, COE, and CO 2 emissions. It will be shown that utilizing a hybrid system configuration (i.e., PV-DG-BB) decreases fuel consumption per year by almost 95% in comparison to the conventional DG-only based electric systems. Not only that, but utilizing a pure off-grid solar PV system (i.e., PV-BB) can significantly reduce the total NPC while completely eliminating CO 2 emissions; however, this is at the expense of more land. Nevertheless, utilizing a dual-axis solar tracking system will be shown to be effective in reducing the required system area. The main contributions of this work can be summarized as follows:
  • Designed PV-based off-grid electric generation systems to meet the realistic load demand of a 4G/5G cellular BS at cell-site in Kuwait, while considering different system configurations and PV panels.
  • Simulated various electric generation systems via HOMER, with the focus on minimizing the NPC, while meeting the required BS load demand.
  • Determined the NPC, COE, and CO 2 emissions of the designed system configurations, in addition to the optimal sizing of the system components based on realistic economic factors.
  • Presented extensive comparisons in terms of energy production, NPC, and area requirements.
  • Studied the impact of utilizing a dual-axis solar tracking system on the NPC, PV energy production, and required system area.
To the best of the authors’ knowledge, no prior work has studied solar-powered cellular base stations in Kuwait and provided extensive numerical comparisons in terms of the NPC, COE, CO 2 emissions, and system area. This work constitutes an important step towards deploying practical renewable-energy-powered cellular base stations in Kuwait.
The rest of this paper is organized as follows. Section 2 outlines the proposed off-grid electric system design, while the simulation results are presented in Section 3. Finally, Section 4 draws the conclusions.

2. Modeling and Design

In this section, the system workflow and modeling is detailed.

2.1. Methodology and Workflow

The optimal electric generation system design, modeling, and simulation starts off with the problem definition. Particularly, the aim is to design an off-grid renewable energy system that meets the base-station load demand. In turn, a cell-site must be selected, and the annual base-station load profile must be obtained. In addition, the system specifications (e.g., type of renewable energy resource and technical constraints) must be clearly defined along with the system economics (i.e., cost model, project lifetime, and interest rate). Furthermore, the component modeling, including both technical specifications (e.g., type of PV panels, DG operational lifetime, battery type, etc.) are considered, while accounting for their economic specifications (e.g., initial and replacement costs). After that, the system design is carefully performed while considering various system configurations. Then, the system design and configuration as well as the base-station load profile are incorporated into HOMER to determine the optimal system sizing, cost factors, and resulting fuel consumption and CO 2 emissions. The detailed workflow using HOMER is illustrated in Figure 2.

2.2. System Model and Design

The system model comprises two main subsystems, the electric power system and the telecommunication load. The schematic of the electric energy generation system to power the base station is shown in Figure 3.
A brief description of each component is listed below.
  • PV Panels: Each PV panel absorbs the sun irradiance and converts it into DC electricity.
  • Battery Bank (BB): A battery bank consists of a number of batteries connected in parallel. Each battery stores excess energy from the PV panels to meet the load demand of the BS at night or when the output power of the PV panels is insufficient to cover the BS load. Specifically, this may happen when the PV panels malfunction, and thus, the BB must provide the BS with sufficient energy to meet the load demand before being deeply discharged.
  • Solar Charge Controller (SCC): The controller is added to protect the batteries by controlling the charging and discharging processes. Moreover, it delivers power from the PV array to the system loads and the battery. Furthermore, it prevents overcharging, and maintains the battery life cycle by preventing complete depletion, which may reduce the battery lifespan.
  • Converter: The converter is used to convert the DC voltage from the load bus-bar and battery bank into AC voltage that is used to feed the AC load in the BS (i.e., the air conditioning units).
  • Diesel Generator: This is a back-up power source, used in case of a malfunction in the system or if maintenance is required. The DG can be used to directly feed the AC load and also power the BS when the solar energy is insufficient (In practice, the efficiency of DGs is low, as approximately 30% of the fuel energy is converted to electrical energy, while the rest is dissipated as heat [48]. Clearly, this is energy-inefficient and adversely affects the environment).
  • Control Unit: A key element in the solar power system, which manages and controls the power flow of the power sources that work in parallel to meet the BS load demand, and prevent power shortages to the BS. Typically, for solar systems with batteries and without a DG, the dispatch strategy is simple as the battery bank charges if the PV energy exceeds the load demand and discharges if the load demand exceeds the solar energy. However, the control strategies can become more complex if the DG along with batteries are present in the system. Thus, it is essential to determine the control strategy that will be utilized, how batteries are charged, and which component (the DG or batteries) has the priority to supply energy when the load demand exceeds the supplied renewable energy.
In the proposed design, the PV panels power the cellular BS, but in case of a malfunction of the PV panels (resulting in failure to provide the sufficient energy to power the BS), the battery bank compensates for the shortage of energy. However, if the battery bank reaches its maximum depth-of-discharge (DoD), and loses the ability to provide the required energy for the BS, then the DG is used to supply the energy. In other words, the DG is provided as a back-up power source to the batteries to assure the continuity of power supply during maintenance, a system malfunction, or insufficient solar energy.

2.3. HOMER Cost Model

HOMER evaluates the maximum number of possible system component combinations with the aim of minimizing the NPC and is subject to constraints on the annual energy demand (i.e., BS load demand), energy production sources (i.e., PV and/or DG), and energy storage devices (i.e., battery bank). Intuitively, the energy production (along with the battery units) must satisfy the load demand of the BS. The NPC encompasses all costs and revenues incurred throughout the project lifetime, while discounting the future cash flows to present values using the discount rate. The NPC also incorporates the cost of any component replacements, initial capital cost of system components, and overall maintenance and operation (O&M); whereas any salvage value (SV) at the end of the project lifetime reduces the NPC [44].
The total annualized cost C T represents the project’s annual cost (USD/year) and is given by
C T = C I C + C R C + C O & M ,
where C I C , C R C , and C O & M represent the initial costs, replacement costs, and O&M costs, respectively. Moreover, the total annualized cost can be expressed in terms of the annualized value of the NPC as
C T = C N P C × C C R F ( i , N ) C N P C = C T C C R F ( i , N ) ,
where C N P C represents all costs incurred during the project lifetime, whereas C C R F ( i , N ) denotes the capital recovery factor that converts C N P C into a flow of equal annual payments over a specified time period. Particularly, C C R F ( i , N ) is based on the annual interest rate i and number of years N and is given by
C C R F ( i , N ) = i ( i + 1 ) N ( i + 1 ) N 1 .
On the other hand, the salvage value C S V defines the remaining value of each component at the end of the project’s lifetime, which is calculated as [49]
C S V = C R e p , c × L c R c ,
where C R e p , c is the replacement cost of the component, L c is the lifetime of the component (years), and R c is the remaining lifetime of the component (years).
Lastly, the COE is defined as the mean value of cost per kWh of the electrical energy produced by the off-grid system. Typically, the BS electrical load is divided into AC load and DC load. Thus, the COE is calculated as [50]
C O E = C T L A C + L D C ,
where L A C and L D C represent the AC and DC loads, respectively.

3. Simulation Results

In this section, the proposed electric system design will be implemented and evaluated in HOMER Pro (version 3.13.8) [43,44,45], which will simulate a viable system for the proposed system design and determine the optimal system design in terms of the NPC. To design an adequate and accurate system model, realistic pricing and practical components must be considered, as will be detailed in the following subsections.

3.1. Electric Generation System Configurations

Four electric generation system configurations will be considered, which are as follows (Note that no solar tracking system has been assumed, which represents the worst-case solar energy harvesting from a cell-site; later in this work, a dual-axis solar tracking system will be incorporated into the system design for comparative purposes):
  • PV-diesel generator with a battery bank (PV-DG-BB): In this configuration, the PV panels will be supplemented with a DG and a battery bank. The DG will be used to charge the battery, supplement the BS load, or serve as a back-up in the case of a system malfunction, maintenance, or insufficient solar energy.
  • PV with a battery bank (PV-BB): This configuration is mainly based on using PV panels with a battery bank, while the DG will not be used.
  • DG with a battery bank (DG-BB): In this configuration, the DG will be used along with a battery bank, and the PV panels will not be utilized.
  • DG without a battery bank (DG-WBB): This configuration relies solely on the DG to power the base station.
The operation modes of the PV-based electric generation system configurations are as follows [51]:
Mode 1:
This mode resembles the normal operation of a PV-based system configuration, in which it feeds the required energy to the BS and stores the excess energy in the battery bank for later use (e.g., at night, or when the output power of the PV panels is insufficient to cover the load).
Mode 2:
In this mode, the output power of the PV panels is insufficient to cover the load. Specifically, this may happen when the PV panels malfunction, and the battery bank compensates for the shortage in energy. In the case when the battery bank is insufficient to cover the load (i.e., maximum DoD is reached), a backup system (i.e., the diesel generator) is used to supply energy to the BS, as in the PV-DG-BB configuration.
It should be noted that the DG-BB and DG-WBB configurations represent conventional electric generation systems for current DG-powered cellular base stations. In case the DG malfunctions or runs out of fuel, the BB supplies energy to the base station in the DG-BB configuration; however, this is not the case for the DG-WBB configuration, which leads to cellular network coverage outage. Lastly, and for comparative purposes, the designated system configurations will be analyzed in terms of NPC, COE, CO 2 emissions (In this paper, the indirect CO 2 emissions (i.e., emissions resulting from the manufacturing process) are neglected.), and overall area.
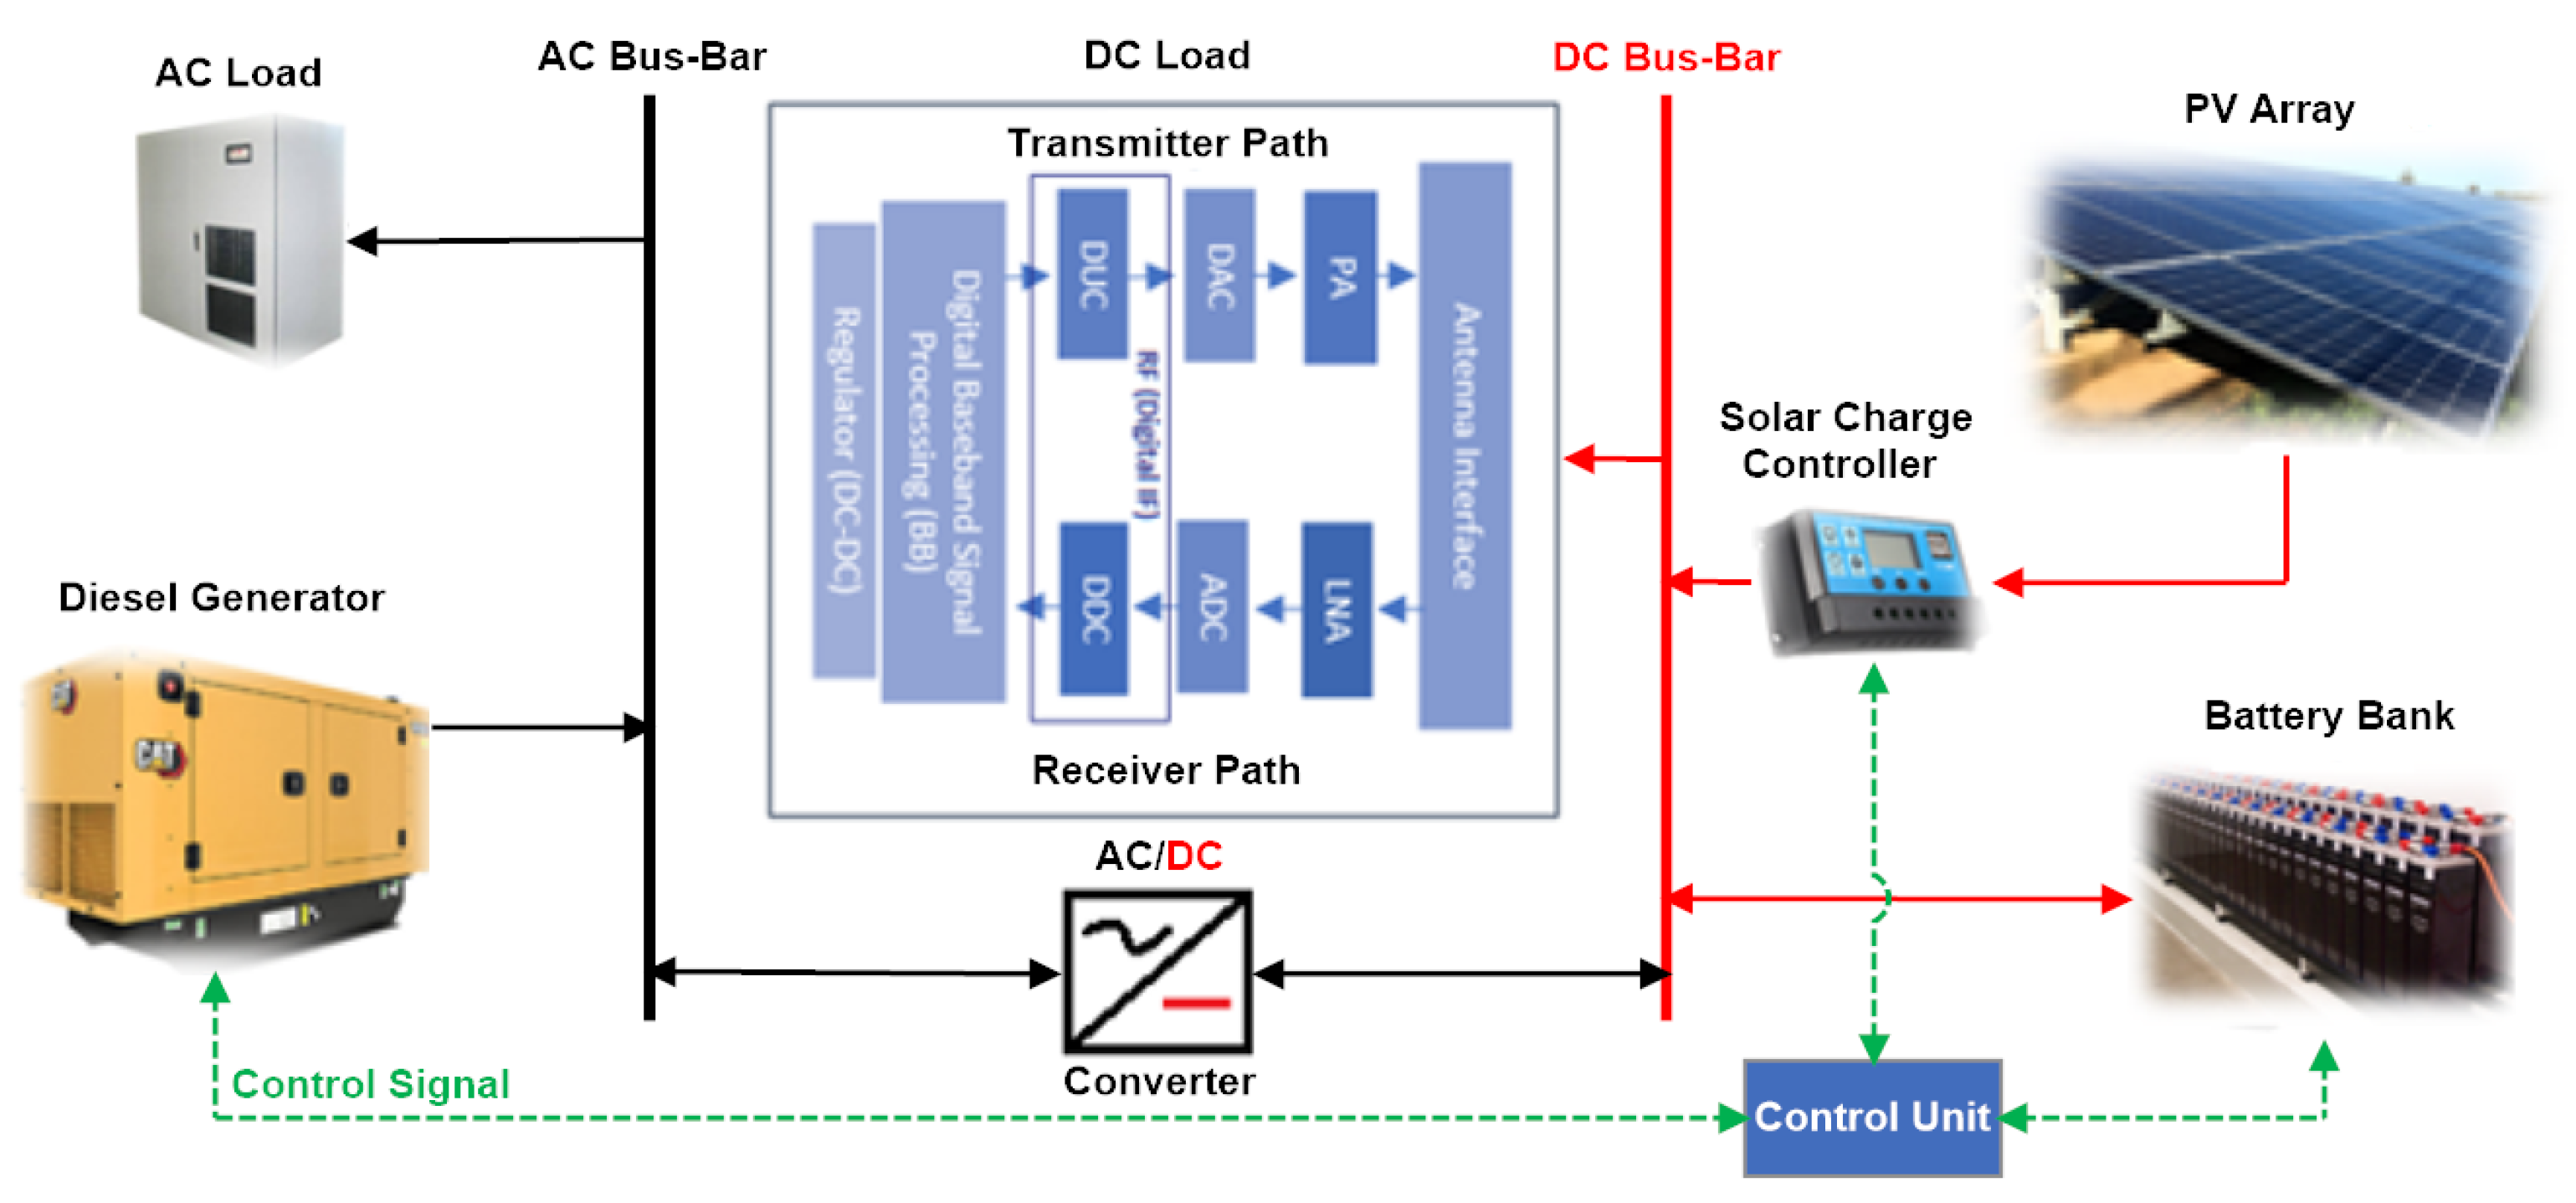
The simulated system design in HOMER is illustrated in Figure 4.

3.2. Cell-Site and Load Profile

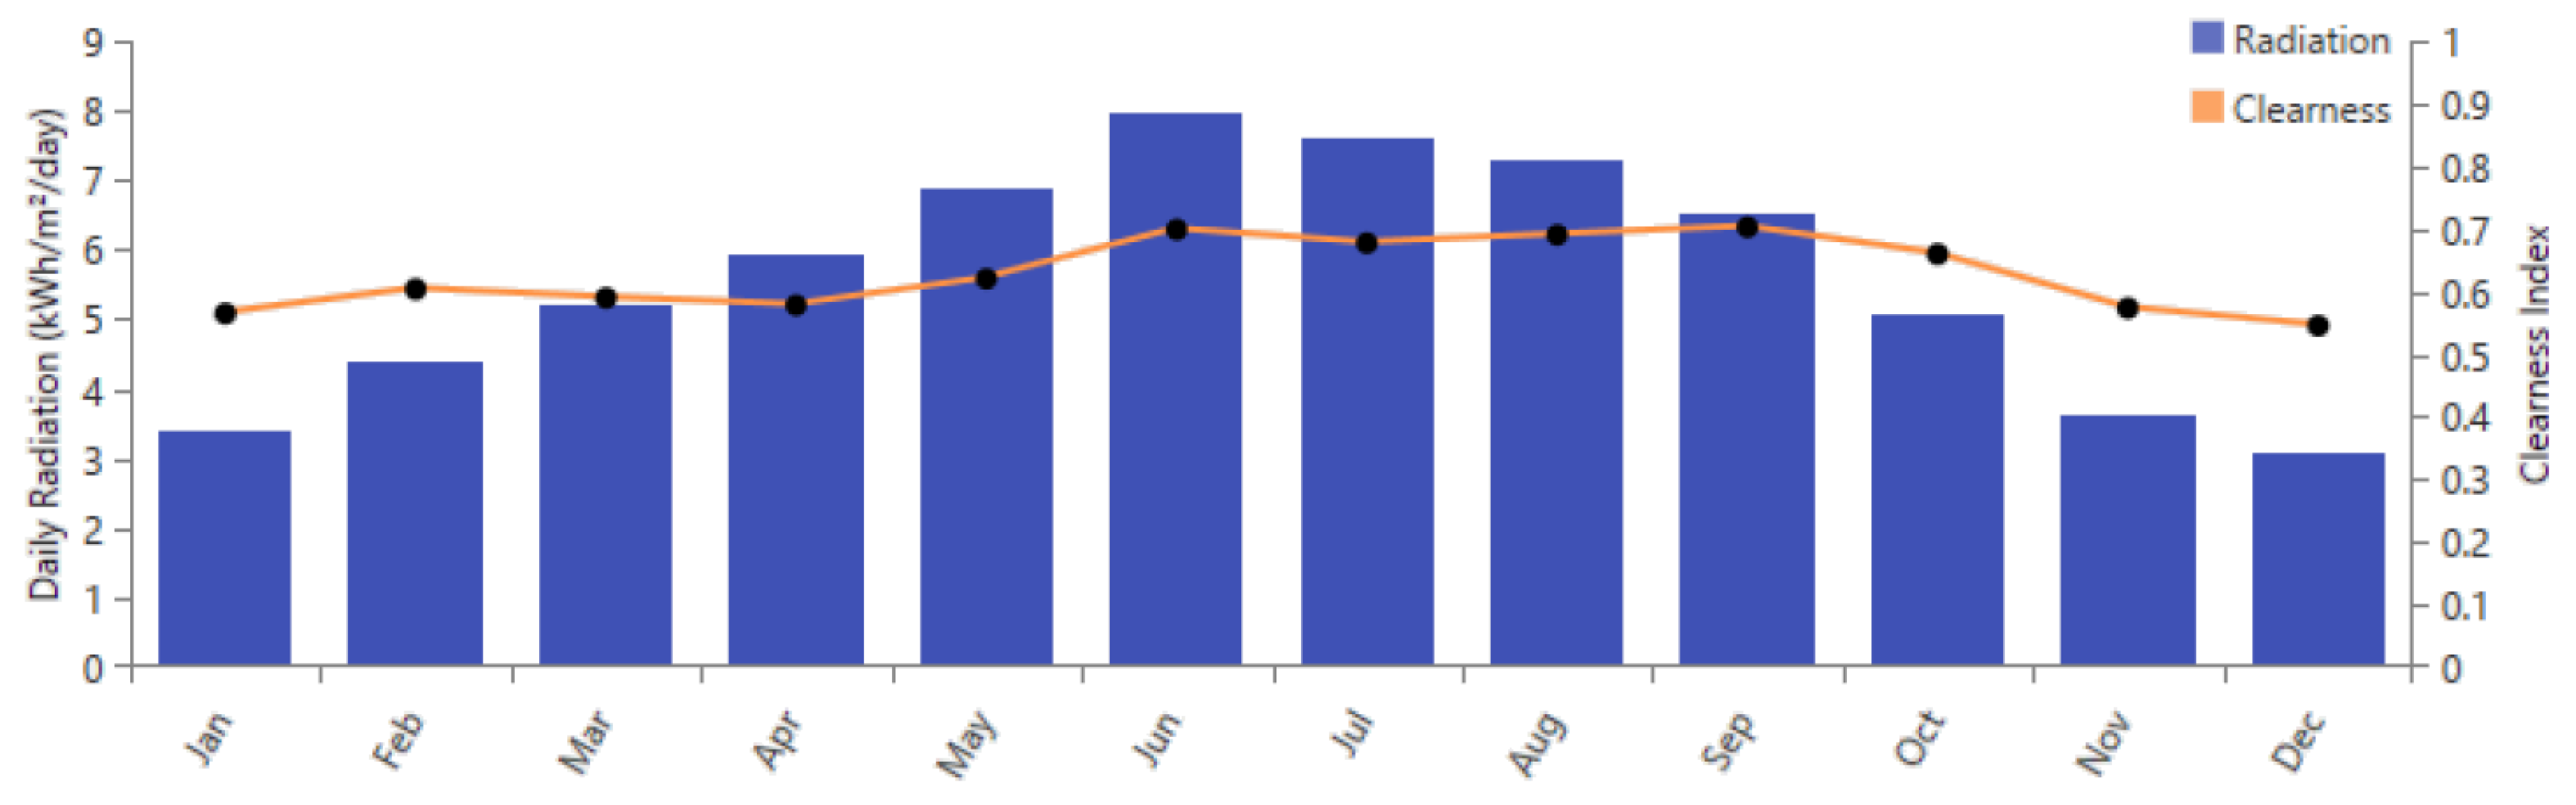
In the simulations, a cell-site at Salmiya (longitude 48.0716° E and latitude 29.3353° N) is considered (Salmiya is located near the capital City of Kuwait, and is densely populated; in densely deployed networks (e.g., city centers and residential areas), the network traffic load can fluctuate very much during the day [52], and thus, this cell-site can be considered as a worst-case scenario), which is located as shown in Figure 5 and characterized by an annual average GHI of 5.57 kWh/m 2 /day (As of NASA prediction of Worldwide Energy Resource (POWER) database [40]). The BS tower at Salmiya cell-site is operated by Zain, which is a leading mobile telecommunications provider in Kuwait and the Middle East, with over 48.9 million customers to date [
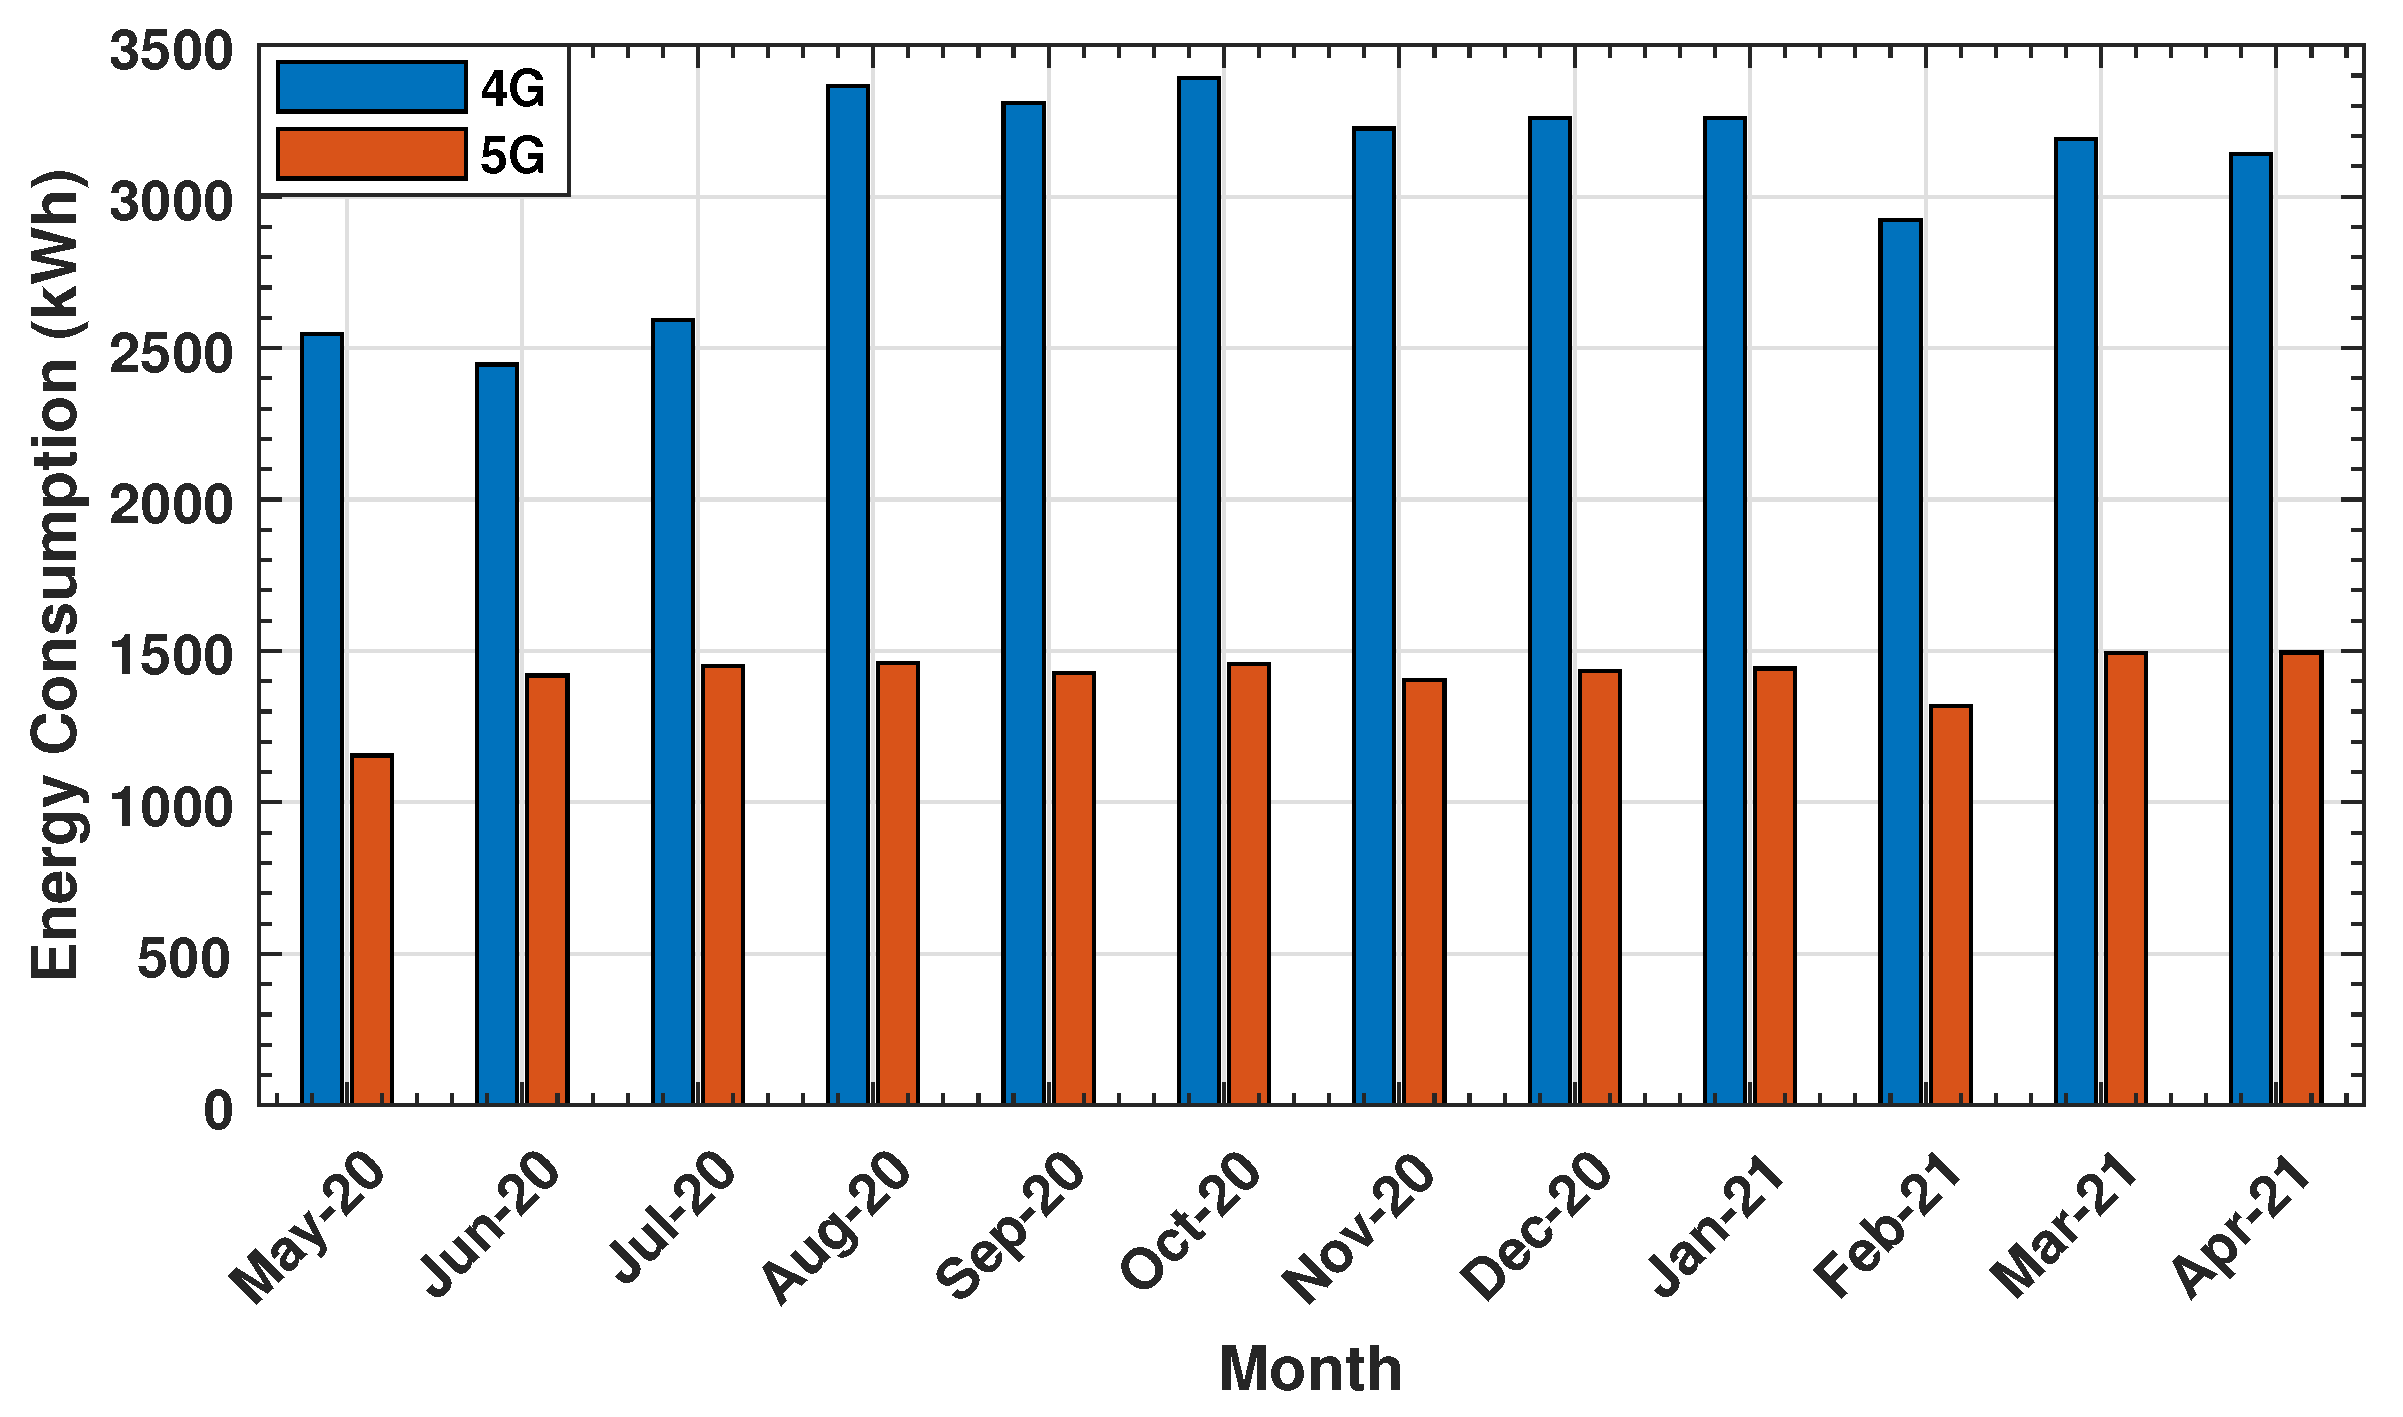
53]. The BS operates both 4G and 5G technologies and is configured as shown in Table 1. The average load profile from May 2020 to April 2021 is shown in Figure 6. Particularly, the annual average DC load has been determined as 146.95 kWh/day, and the average AC load is 110 kWh/day. The total load averages at 256.95 kWh/day and has a peak power of 31.77 kW (This load profile is considered as a worst-case scenario, which is due to COVID-19. This is particularly in alignment with working from home and lockdown restrictions, which led to a surge in data traffic and network usage).

3.3. Technical and Economic Specifications

In the following subsections, the technical and economic specifications of the system components are outlined. Several parameters and values of the system components are considered for efficient performance of the proposed electric generation system design. Additionally, the lifespan of the system is assumed to be 25 years, which represents the lifetime of the base station and electric system components. Currently, the annual real interest according to the Central Bank of Kuwait (CBK) is 1.5% [54].

3.3.1. PV Panels

Two mono-crystalline silicon (Mono-Si) PV panels of different rated power values (285 W and 475 W) are considered, which are summarized in Table 2 (The price in USD/kW per PV panel has been obtained by surveying various vendors and data sheets). The detailed electrical and mechanical characteristics of the different PV panels can be found in [55,56]. It should be noted that the Mono-Si PV panels have been selected in this work as they happen to be more efficient in warmer weather than their poly-crystalline silicon (Poly-Si) counterparts. This is due to the fact that Mono-Si panels have relatively lower temperature coefficients (TCs) than Poly-Si panels [57,58] (The TC is a measure of how much the output power drops when the temperature of the PV panel rises).
The output energy of the PV array is calculated as
E P V = R P V × ξ S H × f P V × 365 days / year ,
where R P V is the capacity of the PV array (kW), ξ P S H is the peak solar hour (PSH), and f P V is the PV array derating factor (or performance ratio). To clarify, the PSH represents the solar irradiance at a specific location when the sun shines at its maximum value for a number of hours, whereas the derating factor resembles the effect of dust, temperature, wire loss, and other factors that may lead the PV arrays to yield lower output energy than under nominal conditions.

3.3.2. Battery Bank

The chosen battery type for the system is lithium-ion (Li-ion) (Li-ion batteries will be widely installed in future PV standalone systems, as discussed in [59]), since this type of battery is reliable, modular, and durable [60,61]. The battery characteristics play a major role in the design of off-grid renewable energy system configurations. Particularly, battery capacity, voltage, state-of-charge (SoC), DoD, and days of autonomy are among the most important parameters in the selection of any battery. The nominal capacity of the battery bank S o C max is defined as the maximum SoC of the battery. Contrarily, the minimum SoC S o C min specifies the lower limit below which the battery should not be discharged, and is defined as a percentage of the total capacity [44]. Typically, S o C min is set to 20–50% to avoid damaging the battery by excessive discharge. For instance, when S o C min is 20% of the battery capacity, the maximum energy that will be delivered by the battery is 80%. This value is the DoD, which describes how deeply the battery is discharged and is given by
D o D = 1 S o C min .
In this work, the “Sunverge SIS-XWplus 6848” battery has been selected, which has high DoD rate (∼80%), and thus, the system can use more of the stored energy without harming the battery. The main parameters of the battery used in this study are listed in Table 3 [62].
Since solar irradiance is intermittent, off-grid PV systems must be appropriately sized to meet the BS load demand. Thus, the autonomy of the battery bank is a critical parameter to be considered in the system design. Specifically, the battery bank autonomy A b a t t refers to the potential number of days that the battery bank can feed the BS load without the contribution of any other energy source, starting from a “fully charged” battery state to the maximum DoD. In particular, A b a t t is defined as the ratio of the battery bank size to the BS load, as
A b a t t = N b a t t × V B × Q B × D o D × ( 24 h / day ) L B S ,
where N b a t t is the number of battery units, V B is the nominal voltage of each battery, Q B is the nominal battery capacity (Ah), and L B S is the average daily BS load (kWh). Another important parameter is the battery life-cycle B c y c l e , which plays a predominant role in reducing the total replacement cost of the battery during the project lifetime. The battery life-cycle is dependent upon the throughout and battery float-life and is calculated as [44]
B c y c l e = min N b a t t × Q l i f e Q t h r , B ¯ c y c l e ,
where Q l i f e is the lifetime throughput of single battery (kWh), Q t h r is the annual battery throughput (kWh/year), and B ¯ c y c l e is the battery float-life (years).

3.3.3. Solar Charge Controller

In this work, the “SPT-4830” SCC is used, which has a rated power of 1600 W, input voltage range of 65–150 V, and input current range of 10.67–24.62 A [63].

3.3.4. Converter

A genetic converter is utilized in the system design, with an efficiency of 90% and lifetime of 15 years. In general, the total rated power capacity of the converter (kW) is determined as [49]
C c o n v = L A C η c o n v × μ s f ,
where L A C is the maximum AC load, η c o n v is the converter efficiency, and μ s f is the safety factor. The specifications of the converter are summarized in Table 4 [64]. It should be noted that various sizes of converters can be used in the system design to efficiently convert electrical energy and meet the load demand [12].

3.3.5. Diesel Generator

The technical and economic specifications of the DG are given in Table 5 (The price of Diesel in Kuwait is USD 0.38/L [65]). It should be noted that DGs can operate from 12,000 h up to 20,000 h—provided they are well-maintained—before requiring engine overhauls [66]. For instance, a DG with 15,000 operational lifetime hours and 4 h a day of operation time should last a minimum of 10 years of service before major engine or generator maintenance is required.
The energy generated by a DG (kWh) is given by
E D G = P D G × η D G × τ ,
where P D G is the rated output power of the DG, η D G is the DG efficiency, and τ refers to the operation duration. Additionally, the fuel consumption is determined as
F c = E D G × F s f c ,
where F s f c is the specific fuel consumption (L/kWh).

3.3.6. Control Unit

Two control strategies are considered in the proposed system design: (a) cycle charging (CC) and (b) load following (LF). Cycle charging is a dispatch strategy, whereby the DG is used to serve the load and produce excess electricity to charge the battery. When a set-point SoC is applied to the CC strategy, the DG starts to charge the battery bank and continues to do so until it reaches the set-point SoC. On the other hand, for the LF strategy, whenever the DG operates, it produces only enough power to meet the primary load and never charges the storage bank, as this is left to the PV panels (An extended discussion of hybrid system dispatch strategies can be found in [67]). Lastly, the operating reserve (as percentage of the hourly load) is set to 80%.

3.4. Discussion of Results

Table 6 summarizes the optimal sizing, cost factors, fuel consumption, and CO 2 emissions of the PV-DG-BB and PV-BB system configurations for both PV panels. Firstly, one can see that the PV array capacity of the PV-DG-BB configuration with the 285 W panel is greater than that with the 475 W panel. This is due to the higher number of 285 W PV panels, which is a result of their lower price. A similar observation can be made for the PV-BB configuration. That is, the greater the PV panel peak power is, the fewer the number of panels required to meet the BS load demand. Secondly, one can observe that the LF dispatch strategy is optimal for the PV-DG-BB configuration, while the CC strategy is optimal for the PV-BB. Thirdly, the PV-DG-BB configuration with the 285 W (475 W) panel obtains 95.4% (94.2%) of its energy from the PV panels. This slight decrease in the renewable energy fraction is due to the decreased PV array capacity, while the DG rated power remains fixed at 35 kW. As for the PV-BB configuration, 100% of its energy supply is obtained from the PV panels, as would be expected. More importantly, the PV-BB system configuration requires more PV panels (to produce more power) and batteries than the PV-DG-BB configuration, since it depends solely on the PV panels for energy generation and the back-up battery bank for energy storage. On the other hand, it is evident from Table 6 that the PV-DG-BB with the 285 W panel yields the lowest NPC and COE and entails the least initial capital; however, it results in 4713 kg/year of CO 2 emissions. Remarkably, and in comparison to the PV-DG-BB, the PV-BB configuration significantly increases the initial capital and NPC by about 35.7% and 34.71% for the 285 W and 475 W panels, respectively. This is attributed to the increase in the number of PV panels and battery units, which is to compensate for the power that would have been generated by the DG, while still meeting the BS load demand. However, by eliminating the DG, the PV-BB configuration yields zero CO 2 emissions, which is an important step towards minimizing the global CO 2 footprint.
From Table 7, it can be seen that the CC dispatch strategy is optimal for the DG-BB and DG-WBB configurations. Moreover, it is clear that the DG-WBB configuration—despite the lower initial capital—incurs significantly higher NPC and COE than its DG-BB counterpart configuration. This is in addition to the significantly higher annual fuel consumption and CO 2 emissions, which are attributed to the absence of the battery bank. By comparing Table 6 and Table 7, one can see that the cost of the PV-DG-BB and PV-BB configurations—though very high during installation (i.e., initial cost)—have lower NPCs throughout the system lifespan than the DG-BB and DG-WBB configurations, which is in addition to the significantly lower CO 2 emissions. From an economic aspect, the PV-DG-BB configuration with 285 W panels is the best as it has the lowest NPC and COE among all system configurations. Contrarily, the worst configuration in this site is the DG-WBB as it has the highest NPC and COE. On the other hand, from an environmental-economic aspect, the PV-BB with 285 W panels is the optimal since it achieves zero CO 2 emissions at the lowest NPC. Figure 7 summarizes the CO 2 emissions of the different configurations. Particularly, it is evident that the PV-BB configuration yields zero CO 2 emissions, while the PV-DG-BB configuration achieves significantly lower CO 2 emissions than the DG-BB and DG-WBB configurations.
In Figure 8, the energy production of the PV-DG-BB configuration is illustrated. Particularly, Figure 8a,b show that the backup DG mainly contributes to serve the BS load in the months of November 2020–April 2021 (i.e., during the winter), which is due to the relatively lower average GHI. Nevertheless, the PV production is significantly higher than that of the DG, which amounts to 95.4% and 94.2% for the PV-DG-BB configuration with the 285 W and 475 W PV panels, respectively, as can be seen in Table 6. Contrarily, Figure 9a and Figure 9b respectively depict the energy production of the PV-BB configuration with the 285 W and 475 W PV panels, where it is evident that 100% of the produced energy comes from the PV arrays. As noted earlier, the lowest energy production occurs in the months of November 2020–April 2021.
Figure 10a illustrates the NPC savings of the PV-DG-BB and PV-BB configurations in comparison to the DG-BB configuration. Specifically, PV-DG-BB configuration with the 285 W (475 W) panel saves about 64.45% (63.1%) in terms of the NPC for the DG-BB configuration. Similarly, the PV-BB configuration with the 285 W (475 W) yields an NPC saving of about 51.75% (50.29%). On the other hand, Figure 10b depicts the NPC savings of the PV-DG-BB and PV-BB configurations when compared to the DG-WBB configuration. In particular, the PV-DG-BB configuration with the 285 W (475 W) panels yields an NPC saving of 74.94% (74.03%), while the PV-BB configuration saves about 66.04% and 65.01% of the NPC with the 285 W and 475 W PV panels, respectively.
Another important factor worth considering is the days of autonomy of the PV-DG-BB and PV-BB configurations. Table 8 summarizes the hours/days of autonomy for the PV-DG-BB and PV-BB configurations. It is observed that the PV-DG-BB configuration guarantees 17.5 h (less than a day) of autonomy for both PV panels (This is based on (8), and is calculated as (20 batteries × 48 V nominal voltage × 244 Ah nominal capacity × DoD 0.8 × 24 h/day) divided by (daily average BS power demand of 256.95 kWh) [44].), which is due to the fact that the PV-DG-BB configuration is based on 20 battery units for both panels, as can be seen in Table 6. On the other hand, for the PV-BB configuration with the 285 W PV panel, the total number of required batteries is 40, as given in Table 6, which implies that the PV-BB configuration with the 285 W PV panel can autonomously supply the BS for 35 h (i.e., 1 day and 11 h). Similarly, for the 475 W PV panel and total number of required batteries of 45, the operation duration that the battery bank can autonomously supply the BS is 39.3 h (i.e., 1 day, 15 h, and 18 min). Generally speaking, the recommended minimum days of autonomy for a sustainable operation of a cellular BS—powered via a standalone electric system—is at least 3 days before reaching the maximum DoD [19] (Conventionally, 3 days of autonomy are considered rather sufficient for cellular network operators to maintain/repair the PV panels while ensuring continuous network operation [19]).
A comparative analysis for the cost of ensuring various days of autonomy—as a function of the number of battery units—is shown in Figure 11. It is clear that increasing the battery bank days of autonomy increases the NPC accordingly, so there is a trade off between the battery bank days of autonomy and the cost of the overall system. However, note that for 3 days of autonomy (i.e., 72 h), the NPC of the PV-DG-BB configuration with the 285 W and 475 W PV panels is USD 212,224 and USD 215,944, respectively. On the other hand, the NPC is about USD 210,499 (USD 214,864) for the PV-BB configuration with the 285 W (475 W) PV panels. Clearly, the NPCs of both configurations for both PV panels and increased days of autonomy are still significantly lower than the NPC of the DG-BB and DG-WBB configurations. Interestingly, although the PV-DG-BB configuration has lower initial capital and NPC, increasing the number of batteries (and hence the days of autonomy) increases the NPC at a rate that is higher than the PV-BB configuration. In other words, for a minimum of 3 days of autonomy, the PV-BB configuration yields lower NPC than the PV-DG-BB configuration. It should be noted that increasing the PV energy generation capacity (i.e., increasing the number of PV panels)—instead of battery storage capacity—can overcome this issue, as it will be more cost effective; however, this is at the expense of more land (as will be demonstrated shortly).

3.5. Overall System Area

The number of required PV panels, strings, and the number of series and parallel panels in each string have been calculated, as listed in Table 9. Moreover, a comparison of system overall area (with and without PV array spacing) is provided (The PV array inter-row spacing takes into account the shading due to tilting [68]. Refer to Appendix A for detailed mathematical expressions of area calculations with spacing). It can be verified that the PV-DG-BB system configuration requires significantly less area than its PV-BB counterpart configuration by around 44% for the 285 W panel and 42% for the 475 W panel. By considering Table 9, and from the required area perspective, the best panel for both configurations is the 475 W panel. This is due to the fact that the 475 W panel meets the load demand with fewer panels than the 285 W panel. In other words, increasing the rated power of the PV panel decreases the required system area since it requires fewer PV panels.

3.6. Utilization of Tracking Systems

Utilizing solar tracking systems could increase the total amount of energy produced by a solar power system [19]. Thus, and to further reduce the required land, a solar tracking system is applied to study its effect on the PV production and the required area. Particularly, the PV-DG-BB and PV-BB configurations with the 475 W PV panels have been modified to incorporate dual-axis solar trackers. In the dual-axis trackers, the PV panels are rotated around both the horizontal and vertical axes to keep the sun rays always perpendicular to the panel. Although this type is the most expensive among all solar trackers, it maximizes the energy production of the PV panels, which in turn reduces the total area [69,70,71] (Other solar trackers have been simulated but were found to produce less energy and require more land and thus have not been included in the results.). Now, Table 10 compares the simulation results of both system configurations without tracking and with the dual-axis tracking. In general, it is noticed that the PV array capacity (kW) under both configurations has decreased, while still meeting the BS load demand. For the PV-DG-BB configuration, the DG rated power and number of battery units remained the same, while converter-rated power increased. As for the PV-BB configuration, the number of battery units has increased, which implies higher energy-storing capability so as not to excessively increase the NPC. To see this, the NPC of the PV-DG-BB configuration has decreased slightly, which is due to the decrease in the number of panels; however, the NPC of the PV-BB configuration marginally increased due to the use of additional battery units, despite the decrease in the number of panels. This can be seen from Table 11, which compares the required land area without and with spacing. As would be expected, utilizing the dual-axis solar tracking decreases the required area, while marginally decreasing (increasing) the NPC for the PV-DG-BB (PV-BB) configuration.
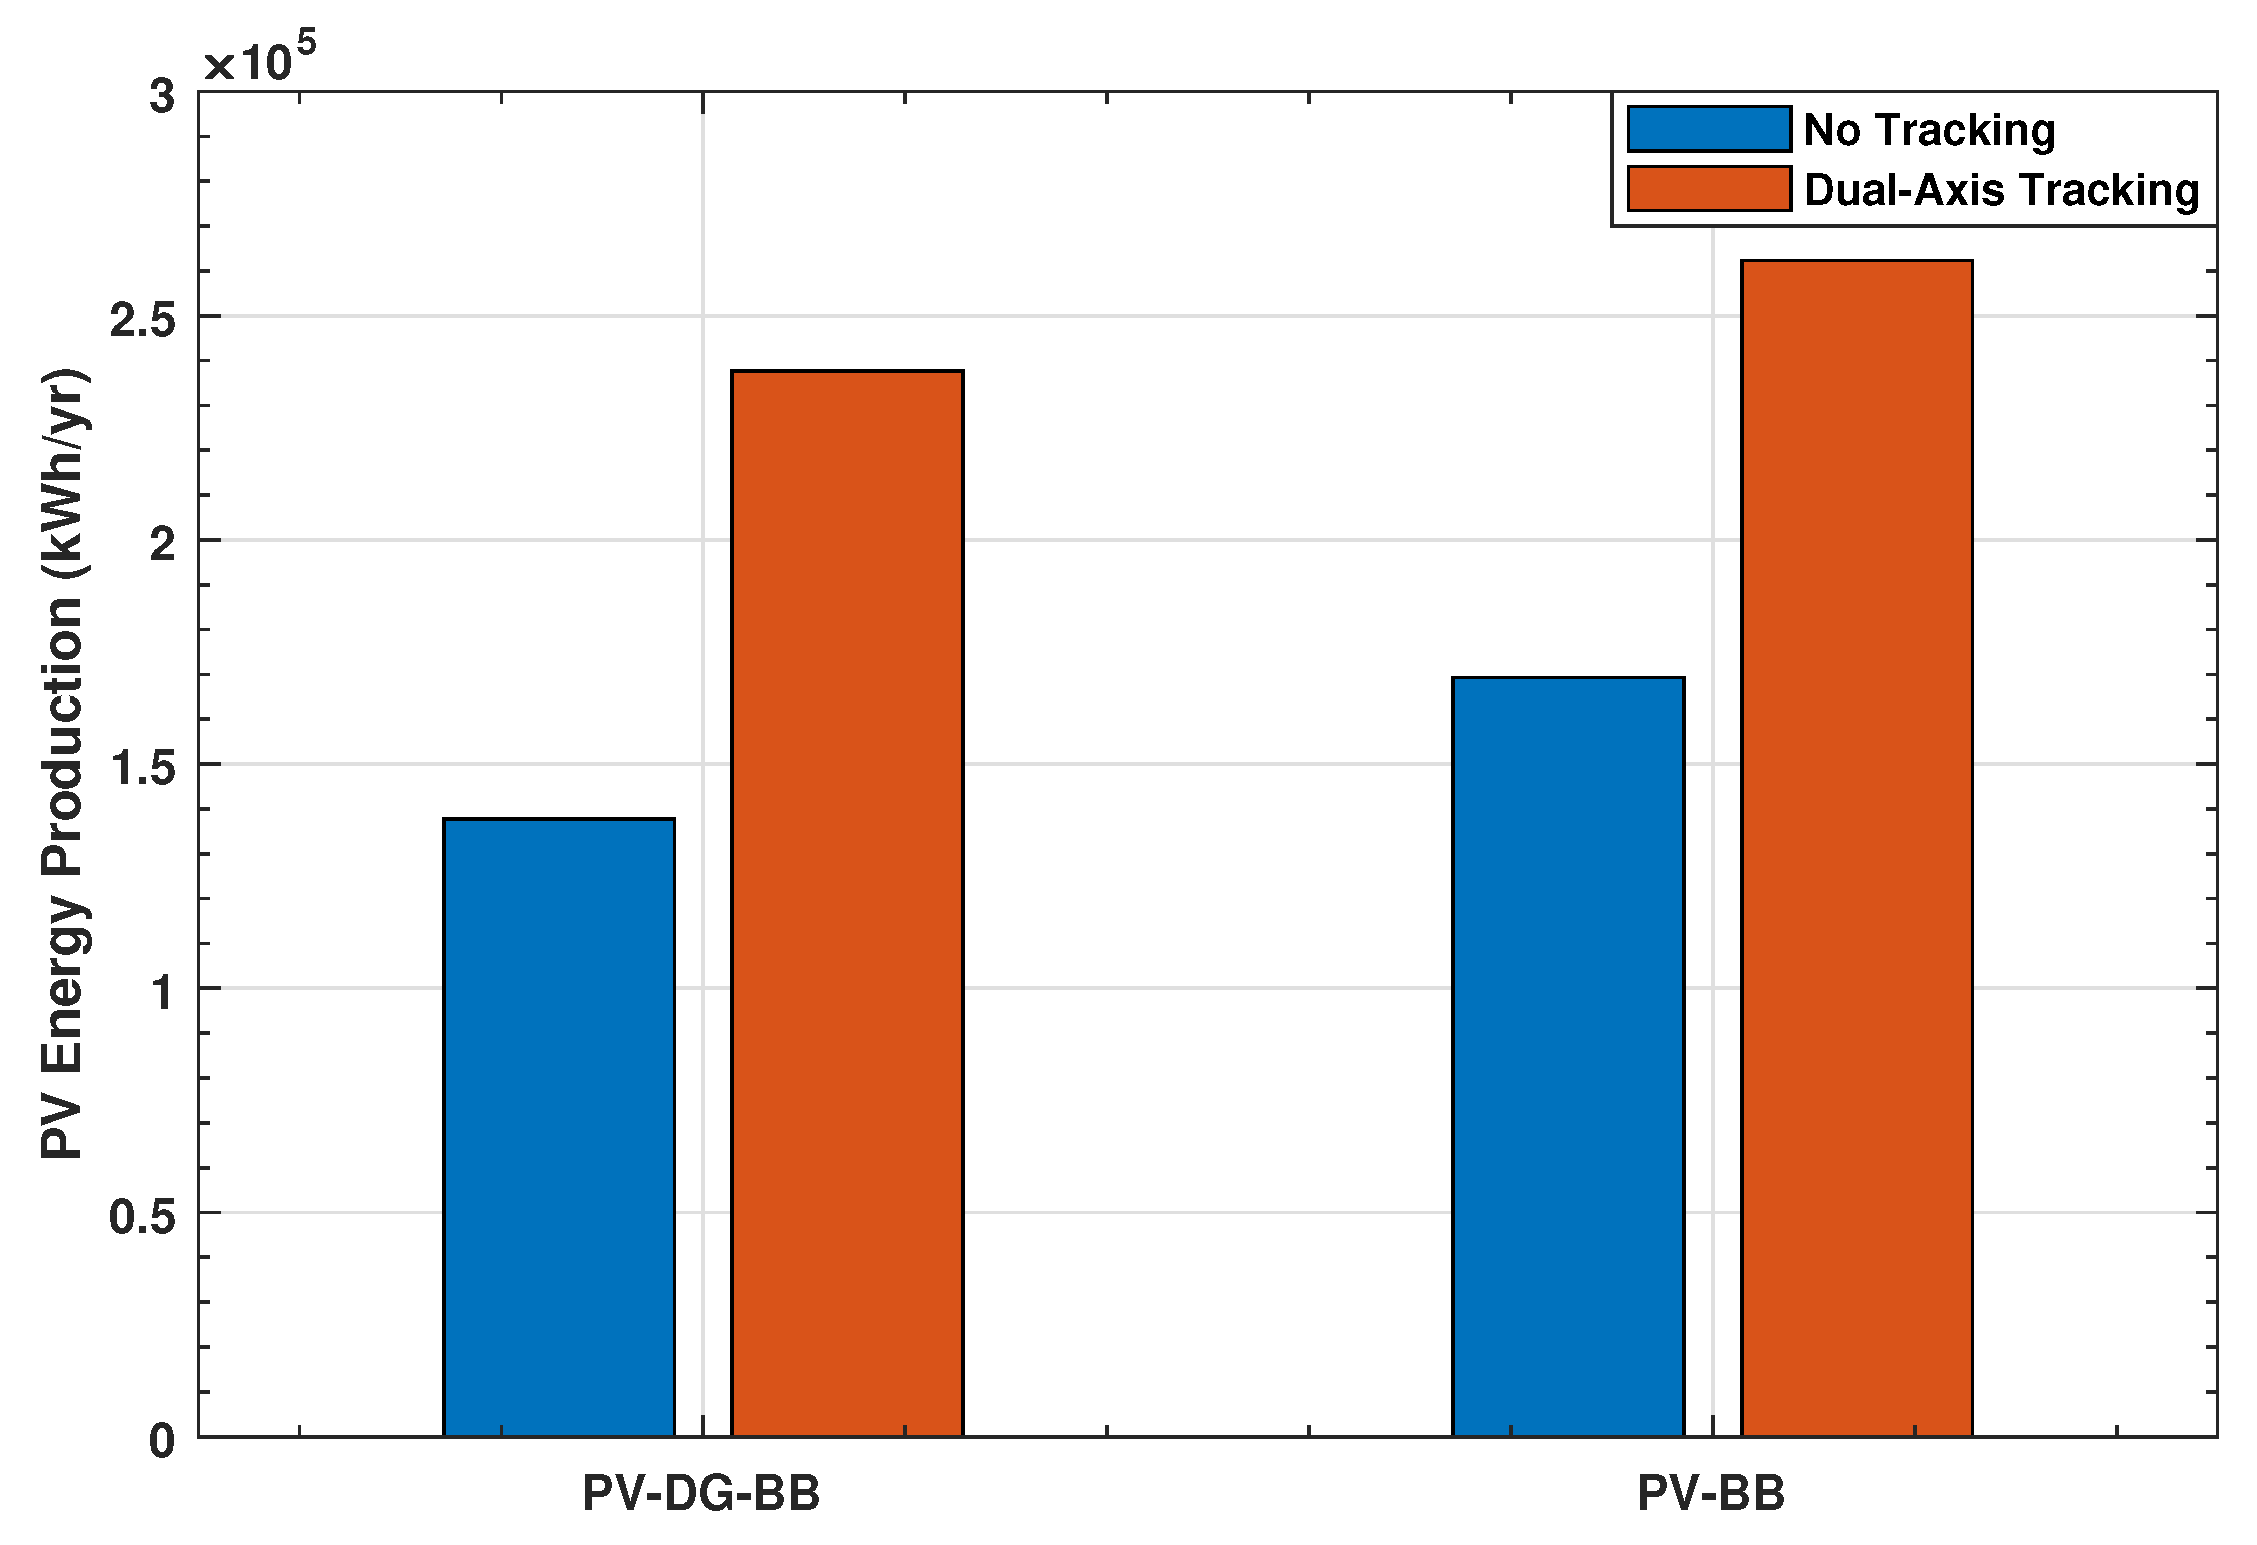
From an energy production perspective, Figure 12 depicts the impact of utilizing a dual-axis tracking on the PV energy production (kWh/yr) of the PV-DG-BB and PV-BB configurations. It is evident that the dual-axis tracker significantly increases the annual PV energy production for both configurations. That is, with the dual-axis tracking, the produced energy is significant, such that the number of PV panels is reduced while meeting the BS load demand. Additionally, and as noted earlier, the PV-BB configuration with the dual-axis tracker utilizes more battery units to store the energy produced.

3.7. Summary of Findings

The following findings can be stated, which are based on the presented results. Firstly, the PV-DG-BB configuration with the 285 W PV panels achieves the lowest NPC and COE while yielding 95.4% of renewable energy, but at the expense of an average of 4713 kg/yr of CO 2 emissions. The PV-BB configuration with the 285 W panels results in an increase in the NPC by about 35.7%; however, this is with 100% renewable energy and zero CO 2 emissions. Secondly, the DG-WBB incurs significantly higher NPC, COE, annual fuel consumption, and CO 2 emissions than all the other configurations. More importantly, the PV-DG-BB and PV-BB configurations yield significant NPC savings in comparison to the DG-BB and DG-WBB configurations. Thirdly, it has been demonstrated that by ensuring a minimum of 3 days of autonomy, the PV-DG-BB and PV-BB configurations still yield NPCs that are lower than the DG-BB and DG-WBB configurations. Moreover, by increasing the days of autonomy, the PV-BB configuration becomes more cost-effective than the PV-DG-BB configuration.
From an overall system area perspective, the PV-DG-BB configuration requires less area than its PV-BB counterpart by around 40% for the 285 W panel and 44.4% for the 475 W panel. To further reduce the required area of the PV-DG-BB and PV-BB configurations, a dual-axis tracker has been utilized, while considering the 475 W PV panel. Specifically, it has been demonstrated that the dual-axis tracker effectively reduces the required system area, while significantly improving the PV energy production, and thus meeting the required BS load demand.

4. Conclusions

In this paper, the design, implementation, and analysis of off-grid solar PV systems to power cellular BSs in Kuwait have been studied. Specifically, various electric generation system configurations have been considered, with the aim of determining the number of PV panels, batteries, and converters to meet the BS load demand. The designed electric generation systems have been evaluated using HOMER, with the NPC being the main optimization parameter. Moreover, five key aspects have been discussed in this paper: (1) economic factors; (2) electrical production; (3) CO 2 emissions; (4) overall area; and (5) the effect of utilizing tracking systems. The simulation results showed that the cost of the PV-DG-BB and PV-BB system configurations—though very high during installation (i.e., initial capital)—have lower NPCs than the conventional DG-BB and DG-WBB configurations throughout the system lifespan. Moreover, the DG-based system configurations (i.e., DG-BB and DG-WBB) are costly and release significantly higher CO 2 emissions than the PV-DG-BB configuration. Moreover, utilizing the PV-DG-BB configuration rather than the DG-only system configurations decreases fuel consumption per year by almost 95%. Furthermore, the PV-DG-BB (PV-BB) configuration can save around 63.1–64.45% (50.29–51.75%) of the total NPC when compared to the DG-BB configuration. In comparison to the DG-WBB configurations, the PV-DG-BB and PV-BB configurations respectively reduce the NPC by about 74% and 65%. Hence, they are a better choice for cellular network operators to reduce both operational expenses and CO 2 emissions. However, there is a trade-off between using the PV-BB system and achieving absolute clean energy (but at the expense of more land), and using a PV-DG-BB system with little fuel consumption and with less land. Not only that, but utilizing a dual-axis tracker has been shown to be effective at reducing the required system area, while still meeting the required BS load demand. Such trade-offs and findings are fundamental for the choice of an appropriate electric system configuration to be used under various practical constraints and cell-sites in Kuwait and the rest of the world.

Author Contributions

M.W.B.: Conceptualization; Data curation; Funding acquisition; Project administration; Investigation; Supervision; Writing—original draft; Writing—review and editing. R.W.H.: Investigation; Software; Validation; Writing—original draft; Writing—review and editing. R.M.K.: Formal analysis; Investigation; Supervision; Validation; Writing—review and editing. S.S.A.: Formal analysis; Visualization; Validation; Writing—review and editing. All authors have read and agreed to the published version of the manuscript.

Funding

This work was partially supported by the Kuwait Foundation for the Advancement of Sciences (KFAS), under project code PN17-15EE-02.

Institutional Review Board Statement

Not applicable.

Informed Consent Statement

Not applicable.

Data Availability Statement

Data sharing is not applicable to this article.

Acknowledgments

The authors would like to express their sincere gratitude and appreciation for Nawaf Al-Gharabally, Chief Technology Office (CTO), Zain, and for Omar Al-Saleh, Radio Networks Optimization Division, Zain, for providing the base-station load profile and technical specifications.

Conflicts of Interest

The authors declare no conflict of interest. The funders had no role in the design of the study; in the collection, analyses, or interpretation of data; in the writing of the manuscript, or in the decision to publish the results.

Appendix A. PV Overall Area Calculations

The overall area of a solar-PV electric generation system can be calculated as follows. First, the total number of PV panels in the system is determined as
P V t o t a l = E P V P V P P ,
where E P V is the total output energy of the system’s PV panels, and P V P P is the PV panel peak power. The number of panels in series can be calculated as
P V s e r i e s = S C R V m p p P V V m p p ,
where S C R V m p p is the maximum power point (MPP) voltage of the solar charge controller, while P V V m p p is the MPP voltage of the PV panel. On the other hand, the number of panels in parallel is determined as
P V p a r a l l e l = S C R I m p p P V I m p p ,
where S C R I m p p is the MPP current of the solar charge regulator, whereas P V I m p p is the MPP current of the PV panel. Moreover, the total number of solar charge controllers in the system is obtained as
S C R t o t a l = P V t o t a l P V s e r i e s × P V p a r a l l e l .
After calculating the above parameters, the length of the required area is determined as
L e n g t h = P V p a r a l l e l × P V l e n g t h ,
in which P V l e n g t h is the length of a PV panel. In order to calculate the width of the PV deployment area, the PV array Row-Spacing must be calculated first; however, it depends on the PV Row-Height which depends on the tilt angle (i.e., the angle between the horizontal plane and the solar panel). Thus, the Row-Height is calculated as
R h e i g h t = P V w i d t h × sin ( θ ) ,
where P V w i d t h is the width of a PV panel, and θ is the optimal tilt angle in the system’s location, in which the sun rays are perpendicular on the panel surface. Now, the spacing between PV rows can be calculated as
P V s p a c i n g = R h e i g h t × R S F ,
where R S F is the Row-Space Factor, which is constant and equals 2.3 [72]. In turn, the width of the string area is determined as
W i d t h = P V s e r i e s × P V s p a c i n g + P V w i d t h 2 R h e i g h t 2 P V s p a c i n g .
Then, the total area of each string is calculated as
A r e a s t r i n g = L e n g t h × W i d t h .
Lastly, the overall PV system area is obtained as
A r e a s y s t e m = A r e a s t r i n g × S C R t o t a l .

References

  1. Saad, W.; Bennis, M.; Chen, M. A Vision of 6G Wireless Systems: Applications, Trends, Technologies, and Open Research Problems. IEEE Netw. 2020, 34, 134–142. [Google Scholar] [CrossRef] [Green Version]
  2. Jiang, W.; Han, B.; Habibi, M.A.; Schotten, H.D. The Road Towards 6G: A Comprehensive Survey. IEEE Open J. Commun. Soc. 2021, 2, 334–366. [Google Scholar] [CrossRef]
  3. Alsharif, M.H.; Nordin, R.; Ismail, M. Survey of Green Radio Communication Networks: Techniques and Recent Advances. J. Comput. Netw. Commun. 2013, 2013, 453893. [Google Scholar] [CrossRef] [Green Version]
  4. Alsharif, M.H.; Nordin, R.; Ismail, M. Classification, Recent Advances and Research Challenges in Energy Efficient Cellular Networks. Wirel. Pers. Commun. 2014, 77, 1249–1269. [Google Scholar] [CrossRef]
  5. Alsharif, M.H.; Kim, J.; Kim, J.H. Green and Sustainable Cellular Base Stations: An Overview and Future Research Directions. Energies 2017, 10, 587. [Google Scholar] [CrossRef]
  6. Masoudi, M.; Khafagy, M.G.; Conte, A.; El-Amine, A.; Francoise, B.; Nadjahi, C.; Salem, F.E.; Labidi, W.; Sural, A.; Gati, A.; et al. Green Mobile Networks for 5G and Beyond. IEEE Access 2019, 7, 107270–107299. [Google Scholar] [CrossRef]
  7. Syed, S.; Arfeen, A.; Uddin, R.; Haider, U. An Analysis of Renewable Energy Usage by Mobile Network Operators. Sustainability 2021, 13, 1886. [Google Scholar] [CrossRef]
  8. Kaldellis, J.K. Optimum Hybrid Photovoltaic-Based Solution for Remote Telecommunication Stations. Renew. Energy 2010, 35, 2307–2315. [Google Scholar] [CrossRef]
  9. Chamola, V.; Sikdar, B. Solar powered cellular base stations: Current scenario, issues and proposed solutions. IEEE Commun. Mag. 2016, 54, 108–114. [Google Scholar] [CrossRef]
  10. Lorincz, J.; Bule, I.; Kapov, M. Performance Analyses of Renewable and Fuel Power Supply Systems for Different Base Station Sites. Energies 2014, 7, 7816–7846. [Google Scholar] [CrossRef] [Green Version]
  11. Ike, D.U.; Adoghe, A.U.; Abdulkareem, A. Analysis Of Telecom Base Stations Powered By Solar Energy. Int. J. Sci. Technol. Res. 2014, 3, 369–374. [Google Scholar]
  12. Alsharif, M.H.; Nordin, R.; Ismail, M. Energy Optimisation of Hybrid Off-Grid System for Remote Telecommunication Base Station Deployment in Malaysia. EURASIP J. Wirel. Commun. Netw. 2015, 64, 1–15. [Google Scholar] [CrossRef] [Green Version]
  13. Alsharif, M.; Kim, J. Optimal Solar Power System for Remote Telecommunication Base Stations: A Case Study Based on the Characteristics of South Korea’s Solar Radiation Exposure. Sustainability 2016, 8, 942. [Google Scholar] [CrossRef] [Green Version]
  14. Moury, S.; Khandoker, M.; Haider, S. Feasibility Study of Solar PV Arrays in Grid Connected Cellular BTS Sites. In Proceedings of the 2012 International Conference on Advances in Power Conversion and Energy Technologies (APCET), Mylavaram, India, 2–4 August 2012; pp. 1–5. [Google Scholar]
  15. Aderemi, B.A.; Chowdhury, S.O.D.; Olwal, T.O.; Abu-Mahfouz, A.M. Techno-Economic Feasibility of Hybrid Solar Photovoltaic and Battery Energy Storage Power System for a Mobile Cellular Base Station in Soshanguve, South Africa. Energies 2018, 11, 1572. [Google Scholar] [CrossRef] [Green Version]
  16. Babatunde, O.M.; Denwigwe, I.H.; Babatunde, D.E.; Ayeni, A.O.; Adedoja, T.B.; Adedoja, O.S. Techno-Economic Assessment of Photovoltaic-Diesel Generator-Battery Energy System for Base Transceiver Stations Loads in Nigeria. Cogent Eng. 2019, 6, 1684805. [Google Scholar] [CrossRef]
  17. Alsharif, M.H.; Raju, K.; Jahid, A.; Albreem, M.A.; Uthansakul, P.; Nebhen, J.; Chandrasekaran, V. Optimal Cost-Aware Paradigm for Off-Grid Green Cellular Networks in Oman. Comput. Mater. Contin. 2021, 68, 2666–2680. [Google Scholar]
  18. Odoi-Yarke, F.; Woenagnon, A. Techno-Economic Assessment of Solar PV/fuel cell hybrid power system for telecom base statios in Ghana. Cogent Eng. 2021, 8, 1911285. [Google Scholar] [CrossRef]
  19. Alsharif, M.H. Comparative Analysis of Solar-Powered Base Stations for Green Mobile Networks. Energies 2017, 10, 1208. [Google Scholar] [CrossRef] [Green Version]
  20. Bleicher, A. LTE-Advanced Is the Real 4G: More Network Capacity, Faster Data Speeds and Beter Coverage Will Come From LTE-Advanced Mobile Technologies. IEEE Spectr. 2013. Available online: http://spectrum.ieee.org/telecom/standards/lte-advanced-is-the-real-4g (accessed on 1 August 2021).
  21. Akyildiz, I.F.; Gutierrez-Esteves, D.M.; Reyes, E.C. The Evolution to 4G Cellular Systems: LTE-Advanced. Phys. Commun. 2010, 3, 217–244. [Google Scholar] [CrossRef]
  22. Agiwal, M.; Roy, A.; Saxena, N. Next Generation 5G Wireless Networks: A Comprehensive Survey. IEEE Commun. Surv. Tutor. 2016, 18, 1617–1655. [Google Scholar] [CrossRef]
  23. Cisco. Visual Networking Index: Global Mobile Data Traffic Forecast Update (2013–2018). White Paper. 2014. Available online: https://blogs.cisco.com/news/cisco-vni-global-mobile-data-forecast-update-2013-2018 (accessed on 1 August 2021).
  24. Ericsson. 5G Energy Performance. White Paper. 2015. Available online: https://www.ericsson.com/assets/local/publications/white-papers/wp-5g-energy-performance.pdf (accessed on 1 August 2021).
  25. Ericsson Mobily Report. Mobile Subscriptions Q2 2020. Available online: https://www.ericsson.com/4a4e5d/assets/local/mobility-report/documents/2020/emr-q2-update-03092020.pdf (accessed on 1 August 2021).
  26. Ericsson. 5G Radio Access—Technology and Capabilities. White Paper. 2015. Available online: http://www.ericsson.com/res/docs/whitepapers/wp-5g.pdf (accessed on 1 August 2021).
  27. Ericsson Mobily Report. The Power of 5G, 2018. Available online: https://www.ericsson.com/assets/local/mobility-report/documents/2018/ericsson-mobility-report-november-2018.pdf (accessed on 1 August 2021).
  28. Huawei. 5G Power: Creating a Green Grid that Slashes Costs, Emissions & Energy Use. Technology Insights. 2021. Available online: https://www.huawei.com/en/technology-insights/publications/huawei-tech/89/5g-power-green-grid-slashes-costs-emissions-energy-use (accessed on 1 August 2021).
  29. Frenger, P.; Tano, R. More Capacity and Less Power: How 5G NR can Reduce Network Energy Consumption. In Proceedings of the 2019 IEEE 89th Vehicular Technology Conference (VTC2019-Spring), Kuala Lumpur, Malaysia, 28 April–1 May 2019; pp. 1–5. [Google Scholar]
  30. Chih-Lin, I.; Han, S.; Bian, S. Energy-Efficient 5G for a Greener Future. Nat. Electron. 2020, 3, 182–184. [Google Scholar]
  31. Liu, G.; Huang, Y.; Chen, Z.; Liu, L.; Wang, Q.; Li, N. 5G Deployment: Standalone vs. Non-Standalone from the Operator Perspective. IEEE Commun. Mag. 2020, 58, 83–89. [Google Scholar] [CrossRef]
  32. Al-Rasheedi, M.; Gueymard, C.A.; Ismail, A.; Al-Hajraf, S. Solar Resource Assessment over Kuwait: Validation of Satellite-Derived Data and Reanalysis Modeling. Proc. Int. Sol. Energy Soc. Conf. 2014. Available online: http://proceedings.ises.org/paper/eurosun2014/eurosun2014-0137-AlRasheedi.pdf (accessed on 1 August 2021).
  33. Al-Mulla, A. Energy Efficiency Program for the State of Kuwait. Energy Efficiency Policies for the SEMED/Arab Region Workshop 2013. Available online: https://iea.blob.core.windows.net/assets/imports/events/278/Session2AhmadAlMulla.pdf (accessed on 1 August 2021).
  34. Krarti, M. Case Study: Kuwait—Analysis of Economical and Environmental Benefits of Promoting Energy Efficiency in Buildings. United Nations Development Account Project: Promoting Energy Efficiency Investments for Climate Change Mitigation and Sustainable Development 2014. Available online: https://www.unece.org/fileadmin/DAM/energy/se/pdfs/gee21/projects/others/Kuwait.pdf (accessed on 1 August 2021).
  35. Hirtenstein, A. Kuwait’s Shagaya Renewable Energy Park Sees Construction Begin. Bloomberg 2015. Available online: https://www.bloomberg.com/news/articles/2015-12-14/kuwait-s-shagaya-renewable-energy-park-sees-construction-begin (accessed on 1 August 2021).
  36. Public Authority for Housing Welfare, Kuwait. Available online: https://www.pahw.gov.kw (accessed on 1 August 2021).
  37. Kuwait Energy Outlook: Sustaining Prosperity Through Strategic Energy Management. Energy Building and Research Center—Kuwait Institute for Scientific Research (KISR) 2019. Available online: https://www.undp.org/content/dam/rbas/doc/Energy%20and%20Environment/KEO_report_English.pdf (accessed on 1 August 2021).
  38. 3Tier by Vaisala, What Is Global Horizontal Irradiance? Available online: http://www.3tier.com/en/support/solar-prospecting-tools/what-global-horizontal-irradiance-solar-prospecting/ (accessed on 1 August 2021).
  39. Hadi, M.A.; Abdel-Razek, R.H.; Chakroun, W.M. Economic Assessment of the Use of Solar Energy in Kuwait. Glob. J. Int. Bus. Res. 2013, 7, 73–82. [Google Scholar]
  40. The POWER Project. Available online: https://power.larc.nasa.gov/data-access-viewer/ (accessed on 1 August 2021).
  41. AlJandal, S. Overview of Grid Connected Rooftop Solar PV Projects in Kuwait. Accelerating Residential Solar 2015. Available online: http://docplayer.net/45188879-Overview-of-grid-connected-rooftop-solar-pv-projects-in-kuwait.html (accessed on 1 August 2021).
  42. Al-Enezi, F.Q.; Sykulski, K.; Ahmed, N.A. Visibility and Potential of Solar Energy on Horizontal Surface at Kuwait Area. Energy Procedia 2011, 12, 862–872. [Google Scholar] [CrossRef] [Green Version]
  43. HOMER Energy. Available online: https://www.homerenergy.com/ (accessed on 1 August 2021).
  44. Lambert, T.W.; Gilman, P.; Lilienthal, P. Micropower System Modeling with HOMER: Integration of Alternative Sources of Energy; Farret, F.A., Simões, M.G., Eds.; John Wiley & Sons: New York, NY, USA, 2005. [Google Scholar]
  45. Lilienthal, P.D.; Lambert, T.W.; Gilman, P. Computer Modeling of Renewable Power Systems. In Encyclopedia of Energy; NREL Report No. CH-710-36771; Elsevier Inc.: Amsterdam, The Netherlands, 2004; Volume 1, pp. 633–647. [Google Scholar]
  46. PVsyst. Available online: https://www.pvsyst.com/ (accessed on 1 November 2021).
  47. HelioScope. Available online: https://www.helioscope.com/ (accessed on 1 November 2021).
  48. Kusakana, K.; Vermaak, H.J. Hybrid Renewable Power Systems for Mobile Telephony Base Stations in Developing Countries. Renew. Energy 2013, 51, 419–425. [Google Scholar] [CrossRef]
  49. Alsharif, M.H.; Kannadasan, R.; Jahid, A.; Albreem, M.A.; Nebhen, J.; Choi, B.J. Long-Term Techno-Economic Analysis of Sustainable and Zero Grid Cellular Base Station. IEEE Access 2021, 9, 54159–54172. [Google Scholar] [CrossRef]
  50. Nurunnabi, M.; Roy, N.K.; Hossain, E.; Pota, H.R. Size Optimization and Sensitivity Analysis of Hybrid Wind/PV Micro-Grids—A Case Study for Bangladesh. IEEE Access 2019, 7, 150120–150140. [Google Scholar] [CrossRef]
  51. Alsharif, M.H.; Kelechi, A.H.; Kim, J.; Kim, J.H. Energy Efficiency and Coverage Trade-Off in 5G for Eco-Friendly and Sustainable Cellular Networks. Symmetry 2019, 11, 408. [Google Scholar] [CrossRef] [Green Version]
  52. ITU-R. Report ITU-R M.2410-0: Minimum Requirements Related to Technical Performance for IMT-2020 Radio Interfaces 2017. Available online: https://www.itu.int/dms_pub/itu-r/opb/rep/R-REP-M.2410-2017-PDF-E.pdf (accessed on 1 August 2021).
  53. ZAIN Group. Available online: https://www.zain.com/en/ (accessed on 1 August 2021).
  54. CBK Press Releases. Available online: https://www.cbk.gov.kw/en (accessed on 1 August 2021).
  55. Canadian Solar-CS6K-285M Datasheet. Available online: https://www.solaris-shop.com/content/CS6K-285M-T4%20Specs.pdf (accessed on 1 August 2021).
  56. Sunpower-SPR-P3-475-UPP Datasheet. Available online: https://sunpower.maxeon.com/au/sites/default/files/2020-12/sp_mst_P3_UPP_35mm_ds_AU.pdf (accessed on 1 August 2021).
  57. Khalis, M.; Masrour, R.; Khrypunov, G.; Kirichenko, M.; Kudiy, D.; Zazoui, M. Effect Temperature and Concentration Mono and Polycrystalline Silicon Solar Cells: Extraction Parameters. J. Phys. Conf. Ser. 2016, 758, 012001. [Google Scholar] [CrossRef] [Green Version]
  58. Adeeb, J.; Farhan, A.; Al-Salaymeh, A. Temperature Effect on Performance of Different Solar Cell Technologies. J. Ecol. Eng. 2019, 20, 249–254. [Google Scholar] [CrossRef]
  59. Lopez, R.; Arcos, T.; Sevil, J.; Agustín, J. Comparison of Lead-Acid and Li-Ion Batteries Lifetime Prediction Models in Stand-Alone Photovoltaic Systems. Appl. Sci. 2021, 11, 1099. [Google Scholar] [CrossRef]
  60. Brinsmead, T.; Graham, P.; Hayward, J.; Ratnam, E.; Reedman, L. Future Energy Storage Trends: An Assessment of the Economic Viability, Potential Uptake and Impacts of Electrical Energy Storage on the NEM 2015–2035. Report Prepared for the Australian Energy Market Commission; 2015. Available online: https://www.aemc.gov.au/sites/default/files/content/fa7a8ca4-5912-4fa9-8d51-2f291f7b9621/CSIRO-Future-Trends-Report.pdf (accessed on 1 August 2021).
  61. Lithium-ion Battery Cost. BloomberNEF 2020. Available online: https://about.bnef.com/blog/battery-pack-prices-cited-below-100-kwh-for-the-first-time-in-2020-while-market-average-sits-at-137-kwh/ (accessed on 1 August 2021).
  62. Battery “Sunverge SIS XWplus 6848” Datasheet. Available online: http://www.sunverge.com/ (accessed on 1 August 2021).
  63. Solar Charge Controller-spt-4830 Datasheet. Available online: https://cdn.enfsolar.com/Product/pdf/ChargeController/5e7ac3a5d6869.pdf?_ga=2.57094250.1550836877.1624560834-897292098.1618607377 (accessed on 1 August 2021).
  64. Hossain, C.A.; Chowdhury, N.; Longo, M.; Yaïci, W. System and Cost Analysis of Stand-Alone Solar Home System Applied to a Developing Country. Sustainability 2019, 11, 1403. [Google Scholar] [CrossRef] [Green Version]
  65. Kuwait Diesel Prices. Available online: https://www.globalpetrolprices.com/Kuwait/diesel_prices/ (accessed on 1 August 2021).
  66. WORLDWIDE POWER PRODUCTS. How Long Do Diesel Generators Last? Available online: https://www.wpowerproducts.com/news/diesel-engine-life-expectancy/ (accessed on 1 August 2021).
  67. Barley, C.; Winn, C. Optimal dispatch strategy in remote hybrid power systems. Sol. Energy 1996, 58, 165–179. [Google Scholar] [CrossRef]
  68. Sanchez-Carbajal, S. Optimum Array Spacing in Grid-Connected Photovoltaic Systems Considering Technical and Economic Factors. Int. J. Photoenergy 2019, 1–15. [Google Scholar] [CrossRef]
  69. Hafez, A.Z.; Yousef, A.M.; Harag, N.M. Solar Tracking Systems: Technologies and Trackers Drive Types—A Review. Renew. Sustain. Energy Rev. 2019, 91, 754–784. [Google Scholar] [CrossRef]
  70. Seme, S.; Stumberger, B.; Hadziselimovic, M.; Sredensek, K. Solar Photovoltaic Tracking Systems for Electricity Generation: A Review. Energies 2020, 13, 4224. [Google Scholar] [CrossRef]
  71. Awasthi, A.; Shukla, A.K.; Maohar, M.; Dondariya, C.; Shuhkla, K.N.; Porwal, D.; Richhariya, G. Review on Sun Tracking Technology in Solar PV System. Energy Rep. 2020, 6, 392–405. [Google Scholar] [CrossRef]
  72. FOLSOM LABS. Modeling 101—Performance Modeliwg Overview—Row-to-Row Spacing and Ground Coverage Ratio. Available online: https://www.folsomlabs.com/modeling (accessed on 1 August 2021).
Figure 1. Average GHI (kWh/m 2 /day) and clearness index in Kuwait.
Energies 14 07494 g001
Figure 2. A flow diagram describing the system modeling and workflow.
Energies 14 07494 g002
Figure 3. Schematic of the solar-powered cellular base station.
Energies 14 07494 g003
Figure 4. Simulated system designin HOMER.
Energies 14 07494 g004
Figure 5. Kuwait map—Salmiya cell-site.
Energies 14 07494 g005
Figure 6. Base-station load profile at Salmiya cell-site.
Energies 14 07494 g006
Figure 7. Comparison of CO 2 emissions for the different system configurations.
Energies 14 07494 g007
Figure 8. Energy production vs. month for: (a) 285 W panel and (b) 475 W panel—PV-DG-BB configuration.
Energies 14 07494 g008
Figure 9. Energy production vs. month for: (a) 285 W panel and (b) 475 W panel—PV-BB configuration.
Energies 14 07494 g009
Figure 10. Percentage of NPC savings with respect to the conventional (a) DG-BB and (b) DG-WBB configurations.
Energies 14 07494 g010
Figure 11. Number of batteries vs. NPC for: (a) PV-DG-BB configuration and (b) PV-BB configuration.
Energies 14 07494 g011
Figure 12. Comparison of PV energy production for the 475 W panel without and with a dual-axis tracking system.
Energies 14 07494 g012
Table 1. Base-station configuration at Salmiya cell-site.
Technology4G5G
Number of sectors33
Number of antennas per sector11
Bandwidth per sector (MHz)10, 15, 20100
Output power per sector (W)20, 40200
Table 2. PV panels and their specifications.
PanelCS6K-285MSPR-P3-475-UPP
VendorCanadianSolarSunPower
Peak Power (W)285475
Dimensions (mm)1650 × 992 × 402066 × 1160 × 35
Panel Area (m 2 )1.642.4
Efficiency (%)17.4119.8
Temperature Range (°C)−40 to 85
Power Temperature Coefficient (%/°C)−0.41−0.34
Initial Capital/Replacement Cost (USD/kW)230290
O&M Cost (USD/yr)10
Operational Lifetime (years)25
Table 3. Battery specifications.
ParameterValue
VendorSunverge
Battery ModelSIS-XWplus 6848
Nominal Voltage (V)48
Nominal Capacity (kWh)11.6
Nominal Charge (Ah)244
Roundtrip Efficiency (%)90
Maximum Charge Current (A)110
Maximum Discharge Current (A)125
Throughput (kWh)64.35
Initial State-of-Charge (%)100
Minimum State-of-Charge (%)20
Maximum Depth-of-Discharge (%)80
Initial Capital/Replacement Cost (USD)1603
O&M Cost (USD/yr)60
Table 4. Converter specifications.
ParameterValue
Operational Lifetime (years)15
Efficiency (%)90
Initial Capital/Replacement Cost (USD/kW)310
O&M Cost (USD/yr)10
Table 5. Diesel generator specifications.
ParameterValue
FuelDiesel
Operational Lifetime (hours)15,000
Fuel price (USD/L)0.38
Initial Capital/Replacement Cost (USD/kW)216
O&M Cost (USD/operation hour)0.01
Table 6. Simulation results for PV-DG-BB and PV-BB configurations.
PV Panel285 W475 W
ConfigurationPV-DG-BBPV-BBPV-DG-BBPV-BB
Optimal System SizingPV Array Capacity (kW)89.416279.2137
Number of Panels314569167289
DG Rated Power (kW)35-35-
Battery (units)20402045
Converter Rated Power (kW)13.615.512.614.3
Dispatch StrategyLFCCLFCC
Renewable Energy Fraction (%)95.410094.2100
Cost FactorsNPC (USD)126,970172,345131,808177,560
COE (USD)0.06520.08860.06770.0913
Initial Capital (USD)64,390106,16066,474116,150
Fuel ConsumptionTotal Fuel Consumption (L/yr)1801-2272-
and CO 2 EmissionsCO 2 Emissions (kg/yr)4713059460
Table 7. Simulation results for DG-BB and DG-WBB configurations.
ConfigurationDG-BBDG-WBB
Optimal System SizingDG Rated Power (kW)3535
Battery (units)6-
Converter Rated Power (kW)28.215.8
Dispatch StrategyCCCC
Cost FactorsNPC (USD)357,162507,446
COE (USD)0.1830.261
Initial Capital (USD)25,91212,443
Fuel ConsumptionTotal Fuel Consumption (L/yr)30,84743,014
and CO 2 EmissionsCO 2 Emissions (kg/yr)80,746112,593
Table 8. Days of autonomy for the PV-DG-BB and PV-BB configurations.
PV Panel Peak
Power (W)
ConfigurationHours of AutonomyDays of Autonomy
285PV-DG-BB17.5Less than a day
PV-BB351 day and 11 h
475PV-DG-BB17.5Less than a day
PV-BB39.31 day, 15 h, and 18 min
Table 9. Comparison of system area for the PV-DG-BB and PV-BB configurations.
PV Panel PeakConfigurationNo. ofNo. ofSeries × ParallelArea (withoutArea (with
Power (W)PanelsStringsSpacing) (m 2 )Spacing) (m 2 )
285PV-DG-BB314404 × 2515897.6
PV-BB569724 × 2933.21615.7
475PV-DG-BB167283 × 2400.8653.5
PV-BB289493 × 2693.61143.7
Table 10. Simulation results for 475 W PV panel without and with tracking.
Tracking SystemNo TrackingDual-Axis Tracking
ConfigurationPV-DG-BBPV-BBPV-DG-BBPV-BB
PV Array Capacity (kW)79.213772.3112
DG Rated Power (kW)35-35-
Battery (units)20452053
Converter Rated Power (kW)12.614.313.513.8
NPC (USD)131,808177,560128,151178,416
Table 11. Area comparison when applying dual-axis tracking for the 475 W PV panel.
ConfigurationTrackingNo. ofNo. ofSeries × ParallelArea (withoutArea (with
SystemPanelsStringsSpacing) (m 2 )Spacing) (m 2 )
PV-DG-BBNo Tracking167283 × 2400.8653.5
Dual-Axis Tracking153263 × 2367.2606.8
Area Reduction (%)8.387.15
PV-BBNo Tracking289493 × 2693.61143.7
Dual-Axis Tracking236403 × 2566.4933.6
Area Reduction (%)18.3418.37
Publisher’s Note: MDPI stays neutral with regard to jurisdictional claims in published maps and institutional affiliations.

