
Power Sharing and Control Strategy for Provisionally Coupled Microgrid Clusters through an Isolated Power Exchange Network


Abstract
:1. Introduction
1.1. Background and Literature Review
1.2. Contribution and Organization
- An effective power exchange strategy to alleviate overload and over-generation problems in autonomous/islanded MGs by temporarily connecting them via a common three-phase power exchange link, in order to retain the desired voltage and frequency level and, thus, enhance their reliability, resilience, and stability.
- A decentralized control mechanism to exchange power among the MGs within the CMG network using only local frequency measurement with no data communication. Such a technique can be expanded to connect any number of MGs with different voltages, frequencies, and operational standards.
- Proper power-sharing amongst the MGs by employing a suitable droop control technique.
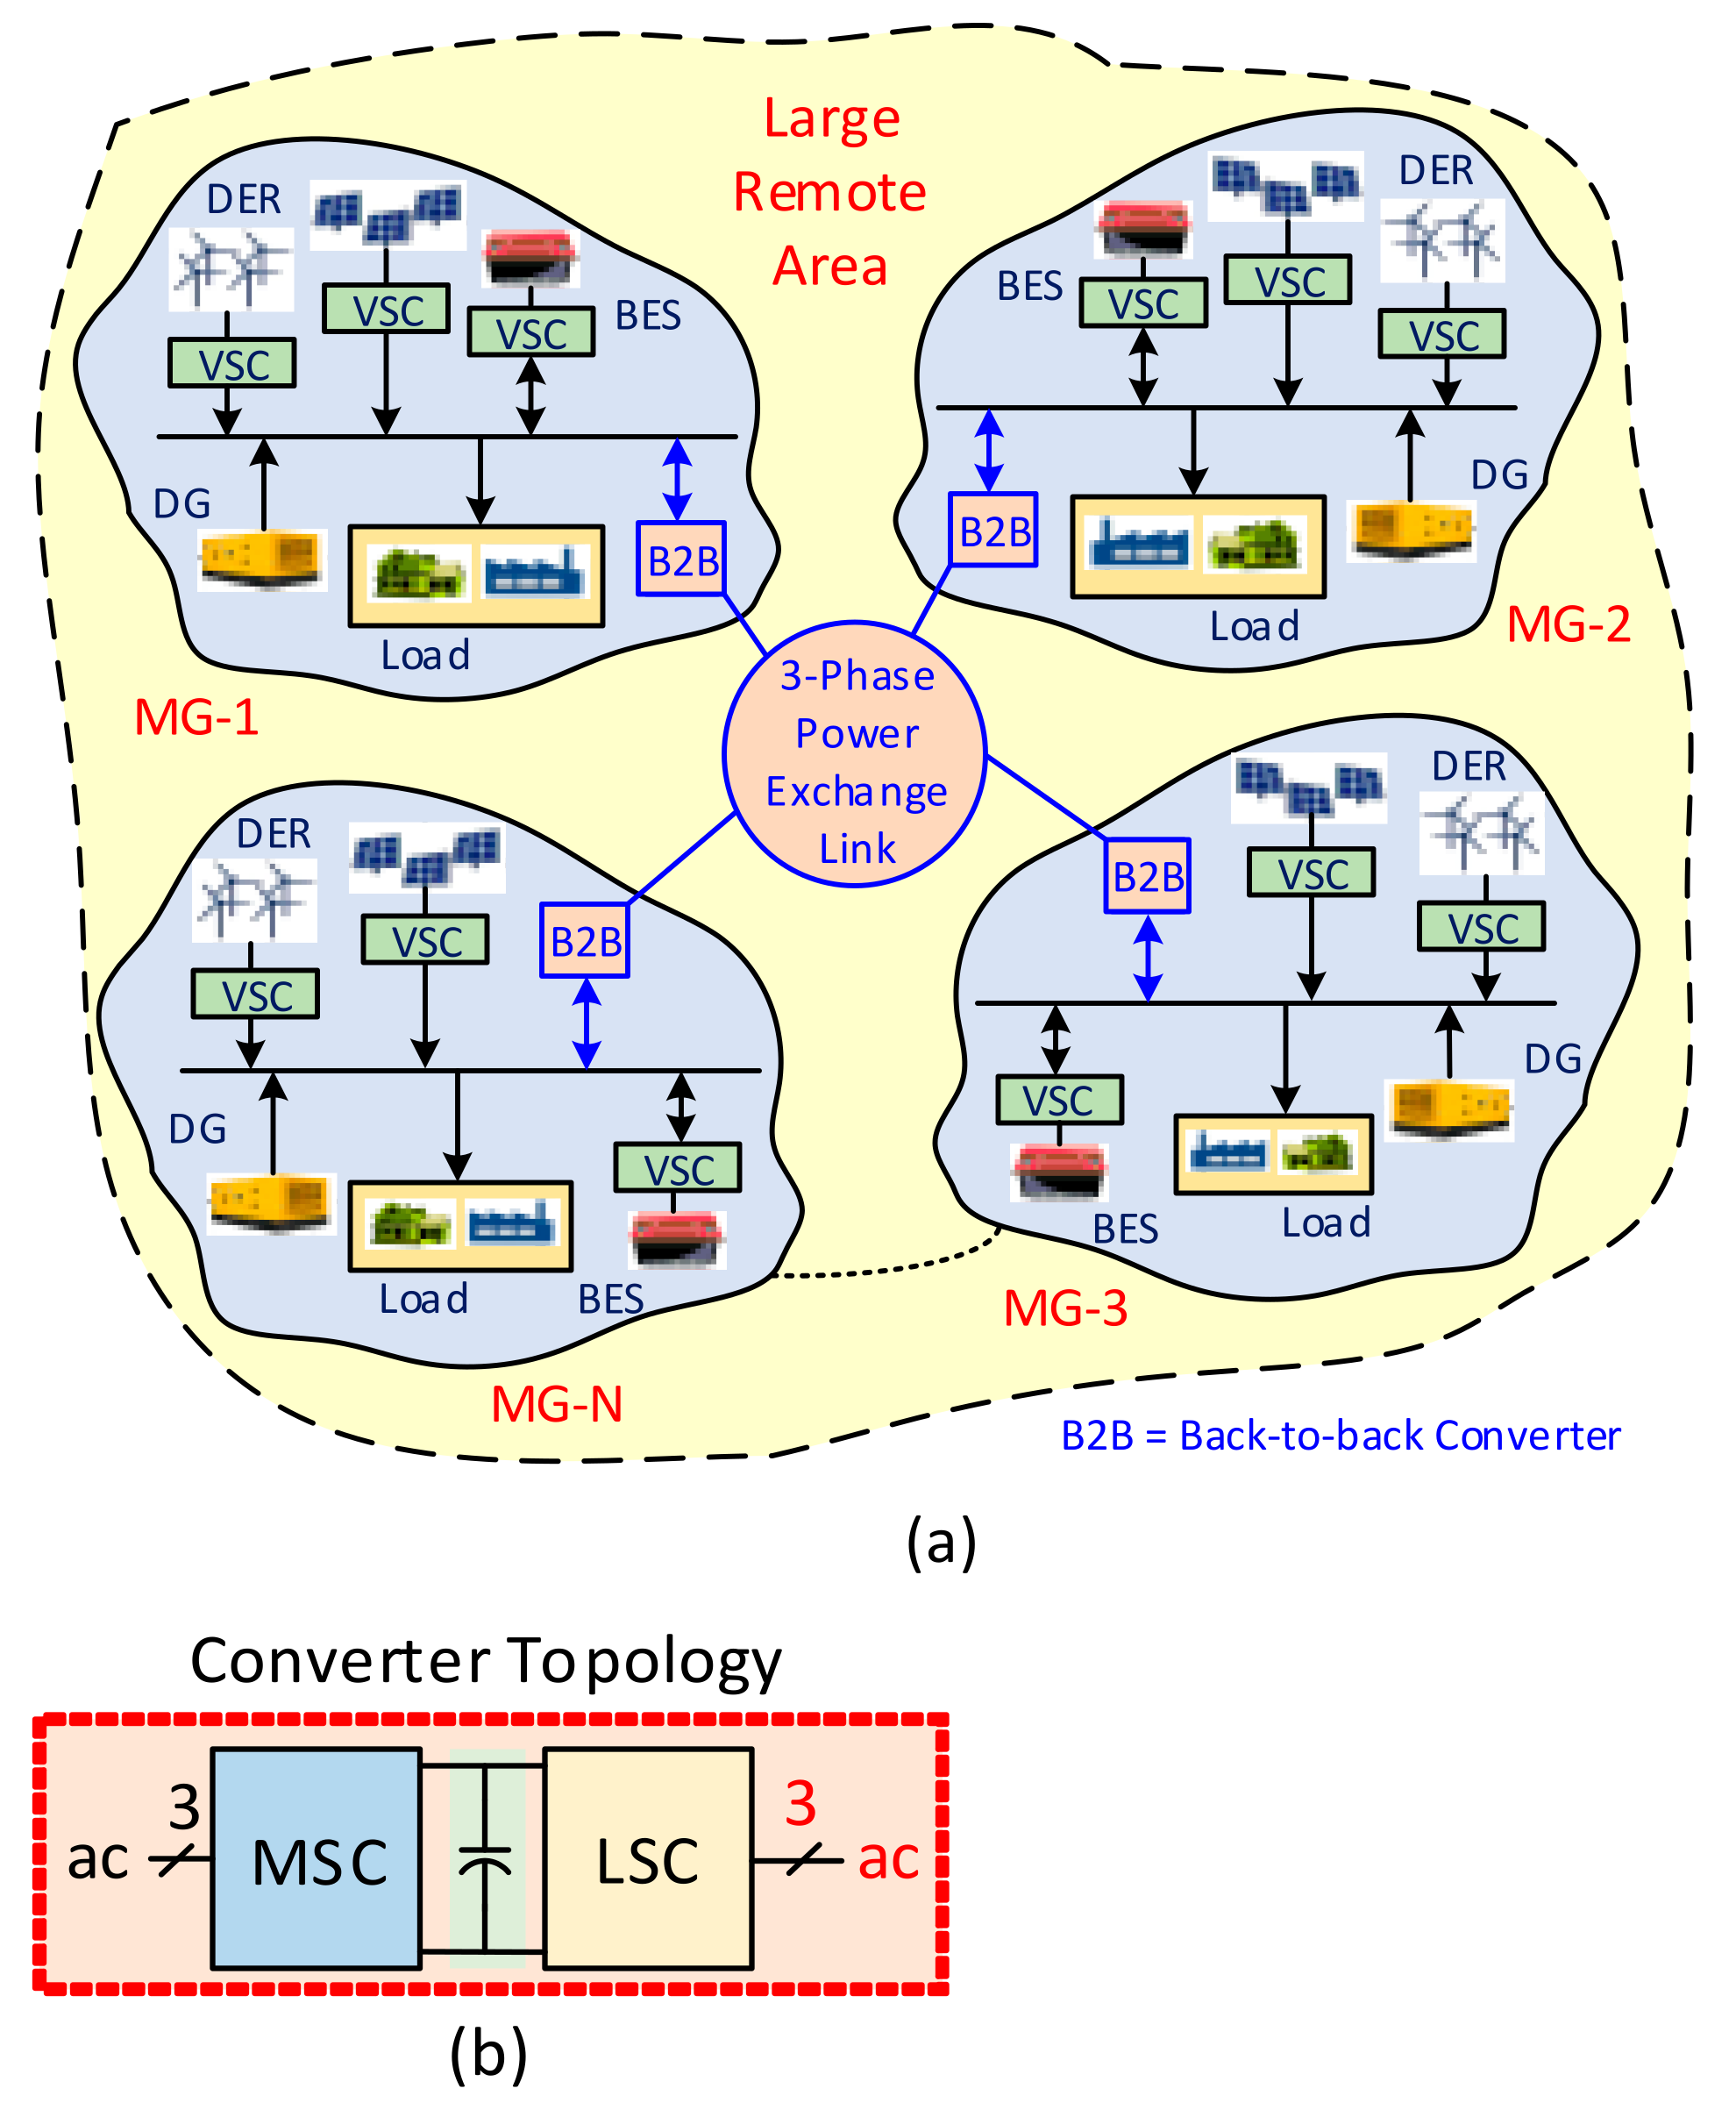
2. CMG Structure and Operation
| Algorithm 1: MG status detection and LSC mode of operation. |
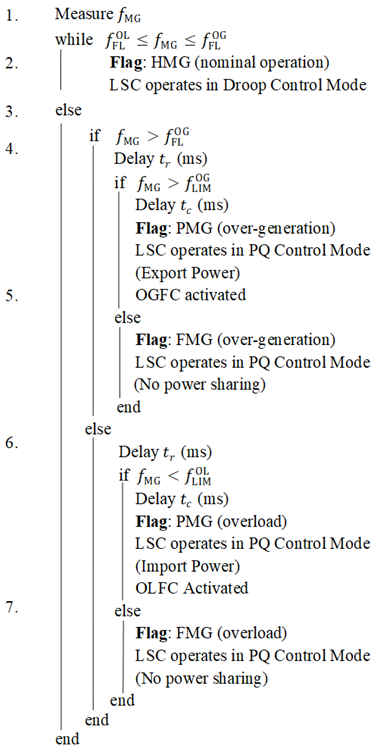 |
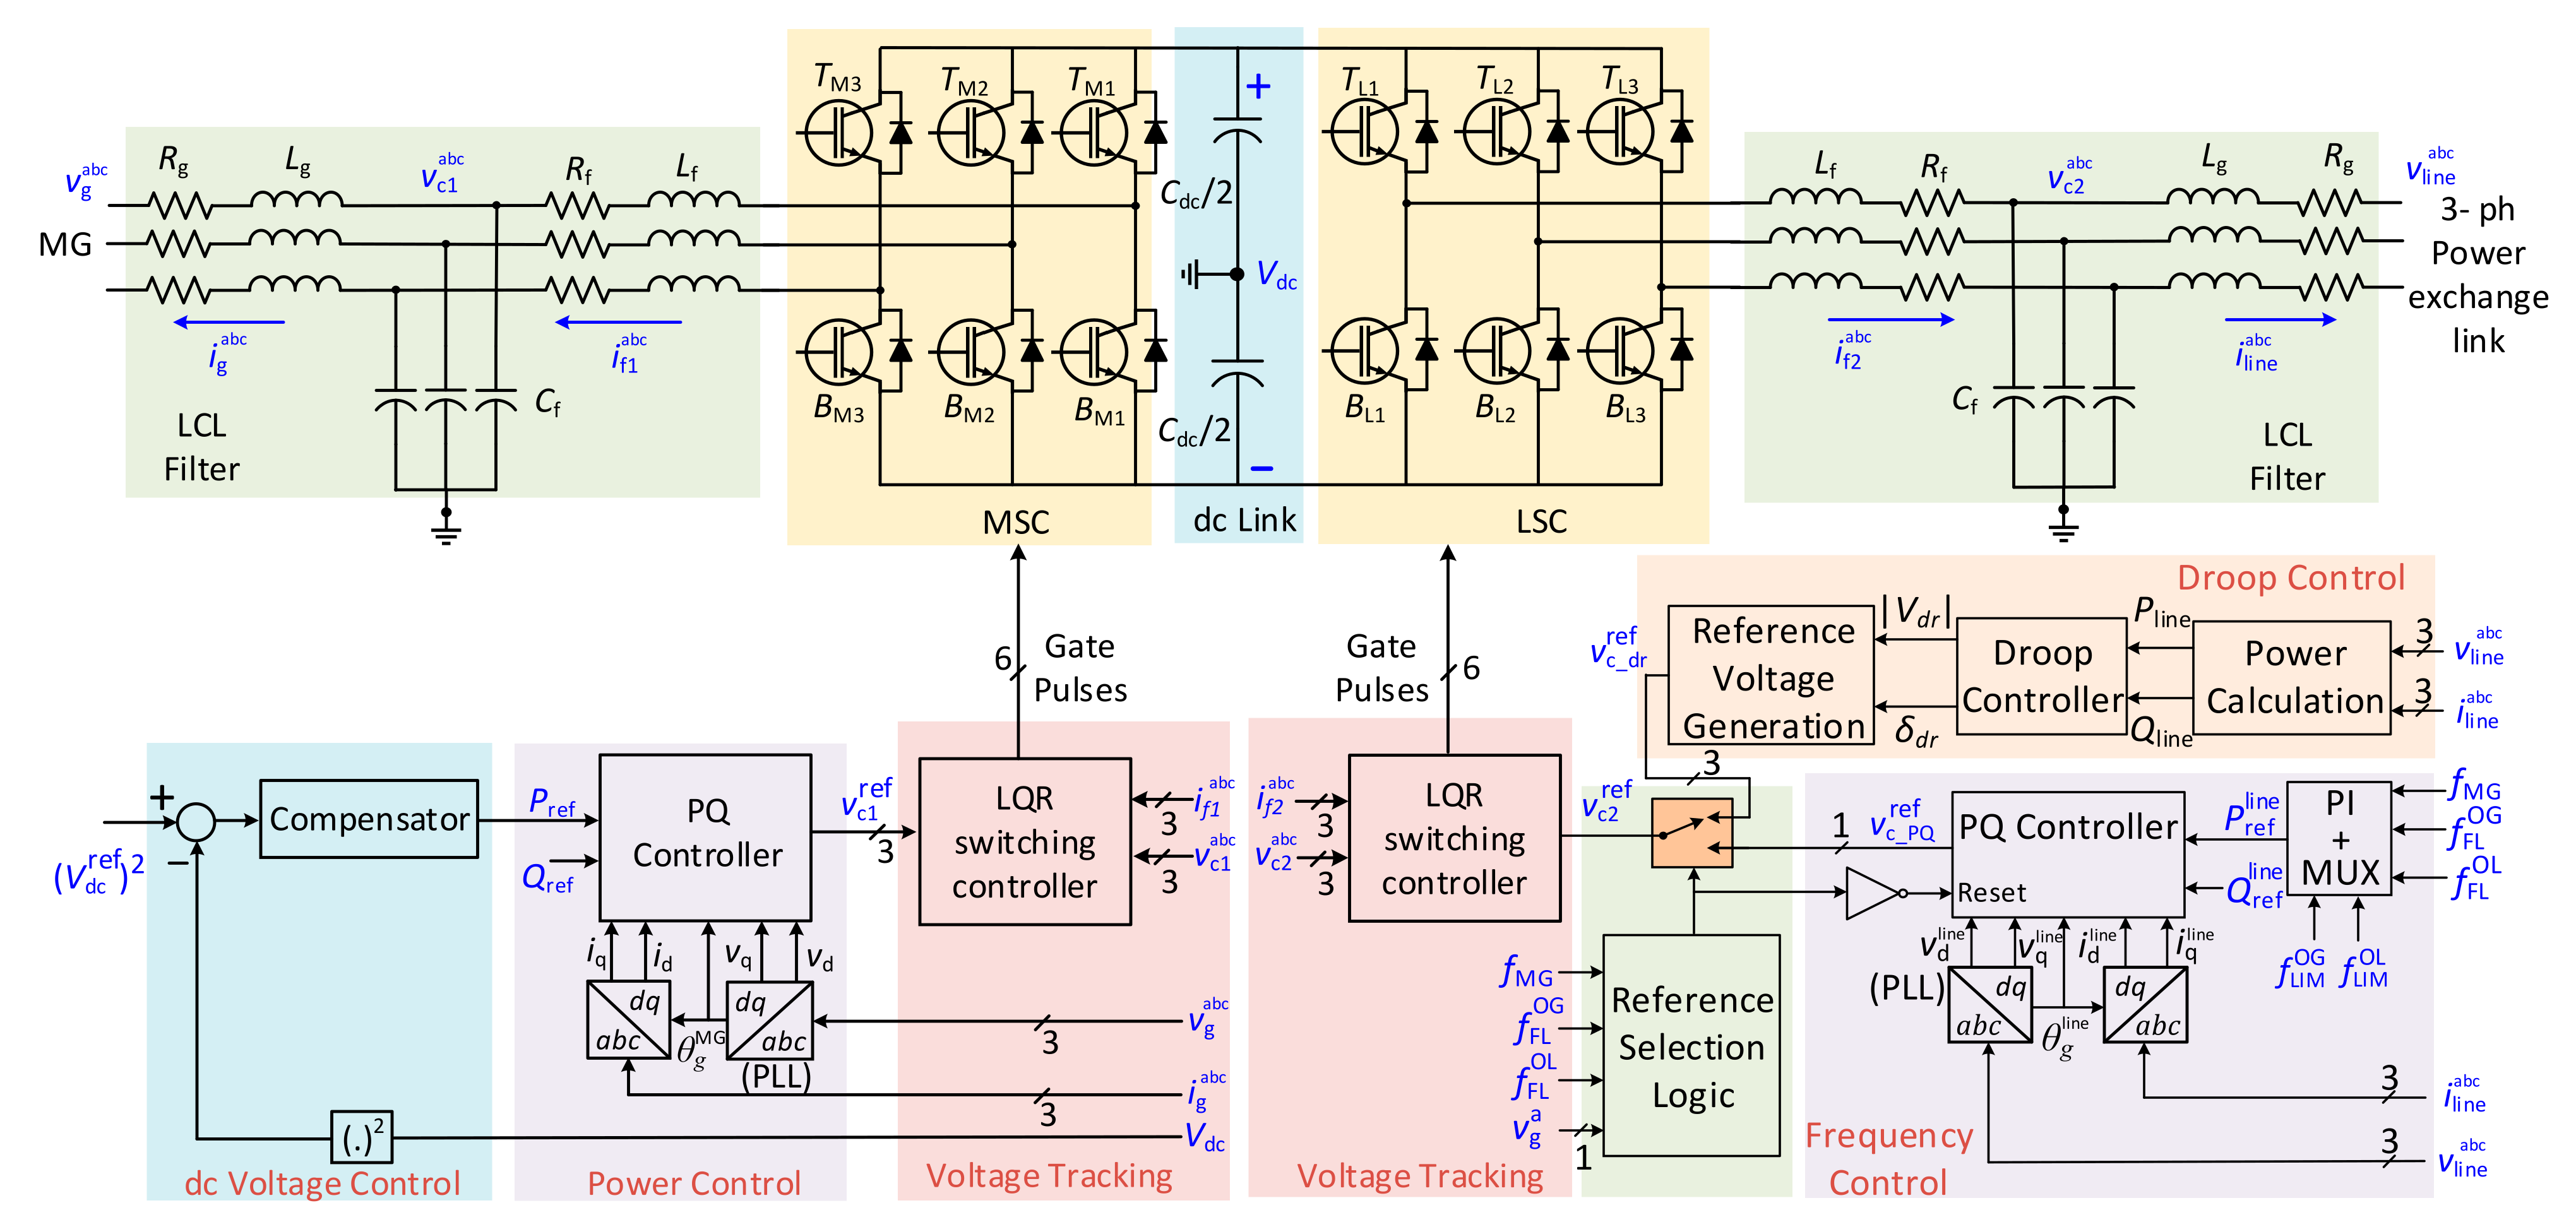
3. Converter Topologies and Control Mechanism
3.1. MSC Control
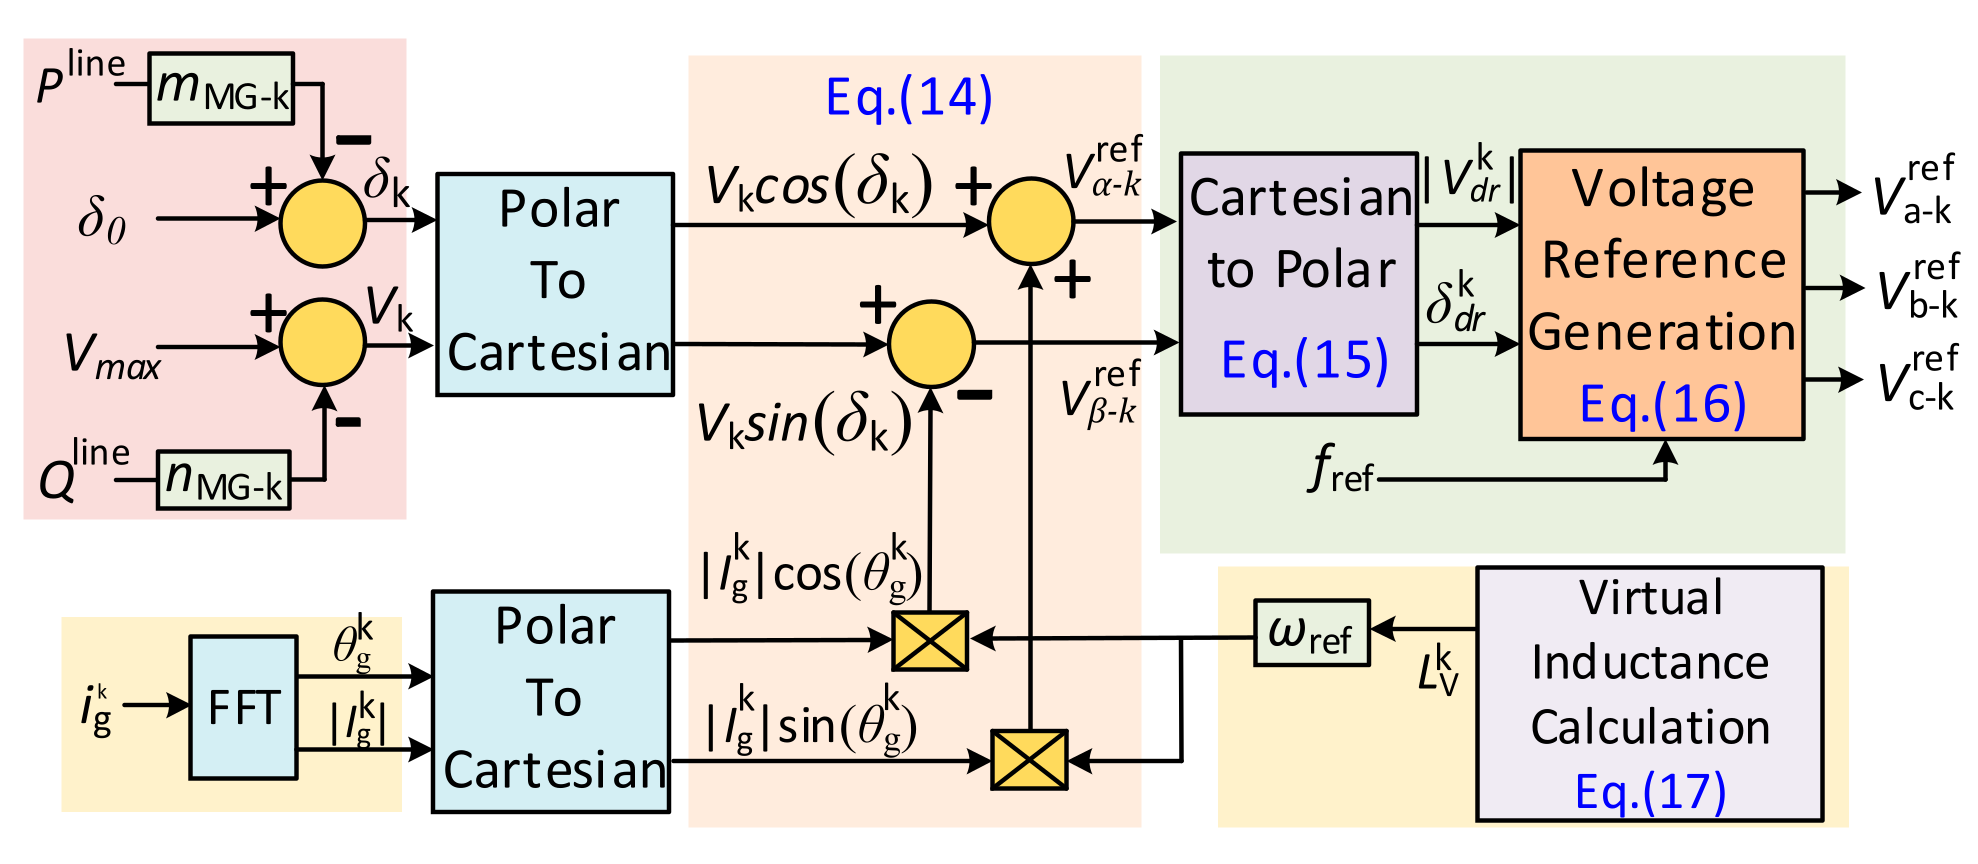
3.1.1. Voltage Tracking and Switching Control
3.1.2. Power Control
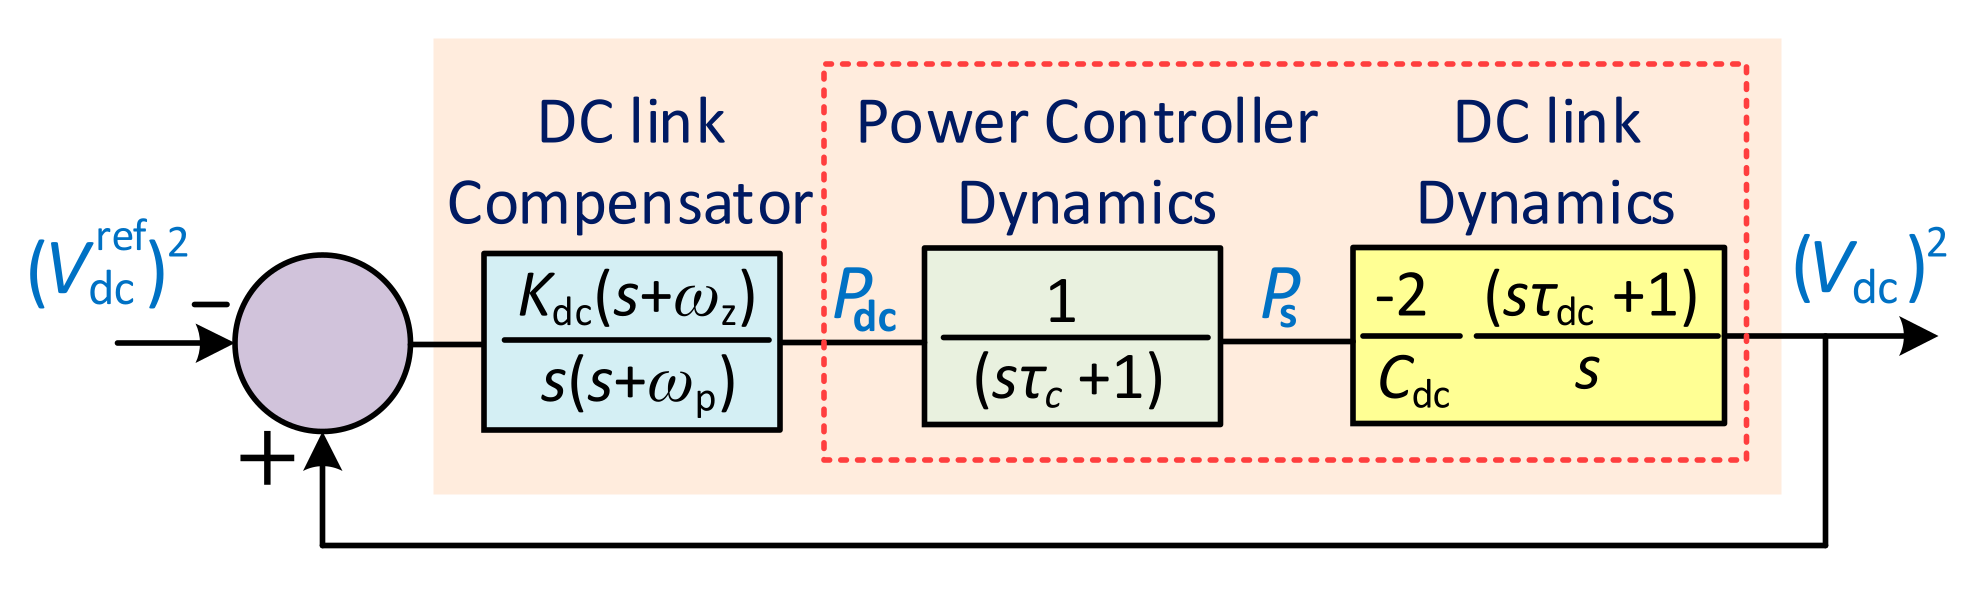
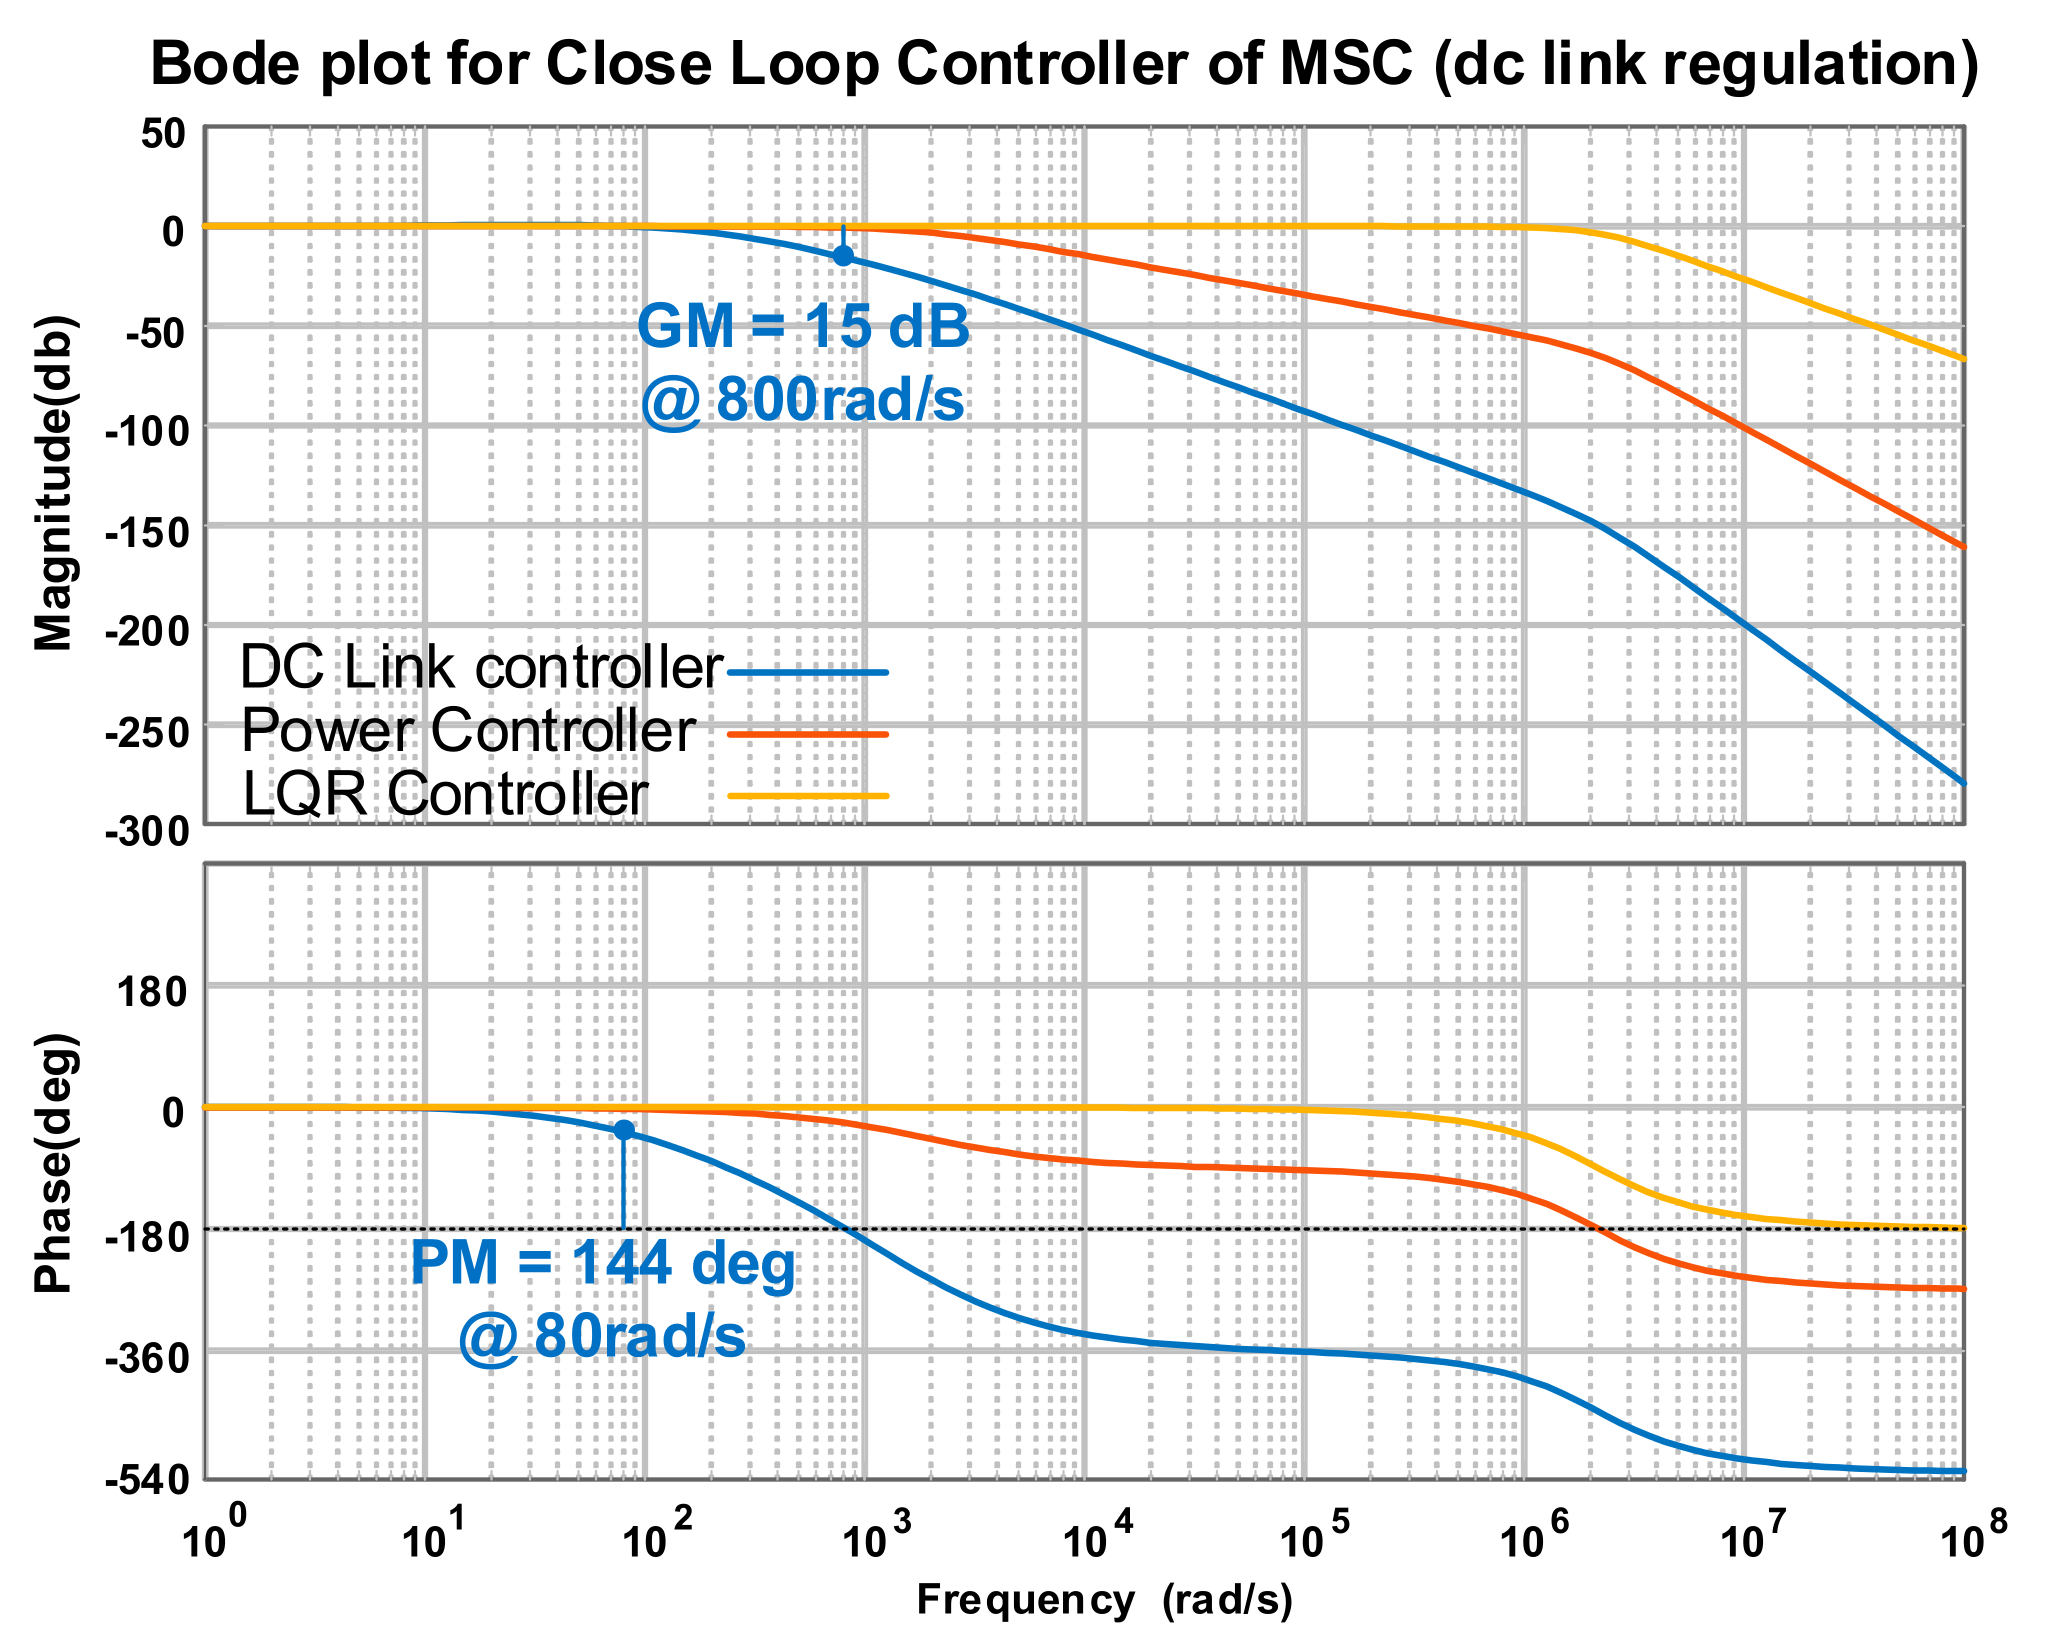
3.1.3. DC-Link Voltage Control
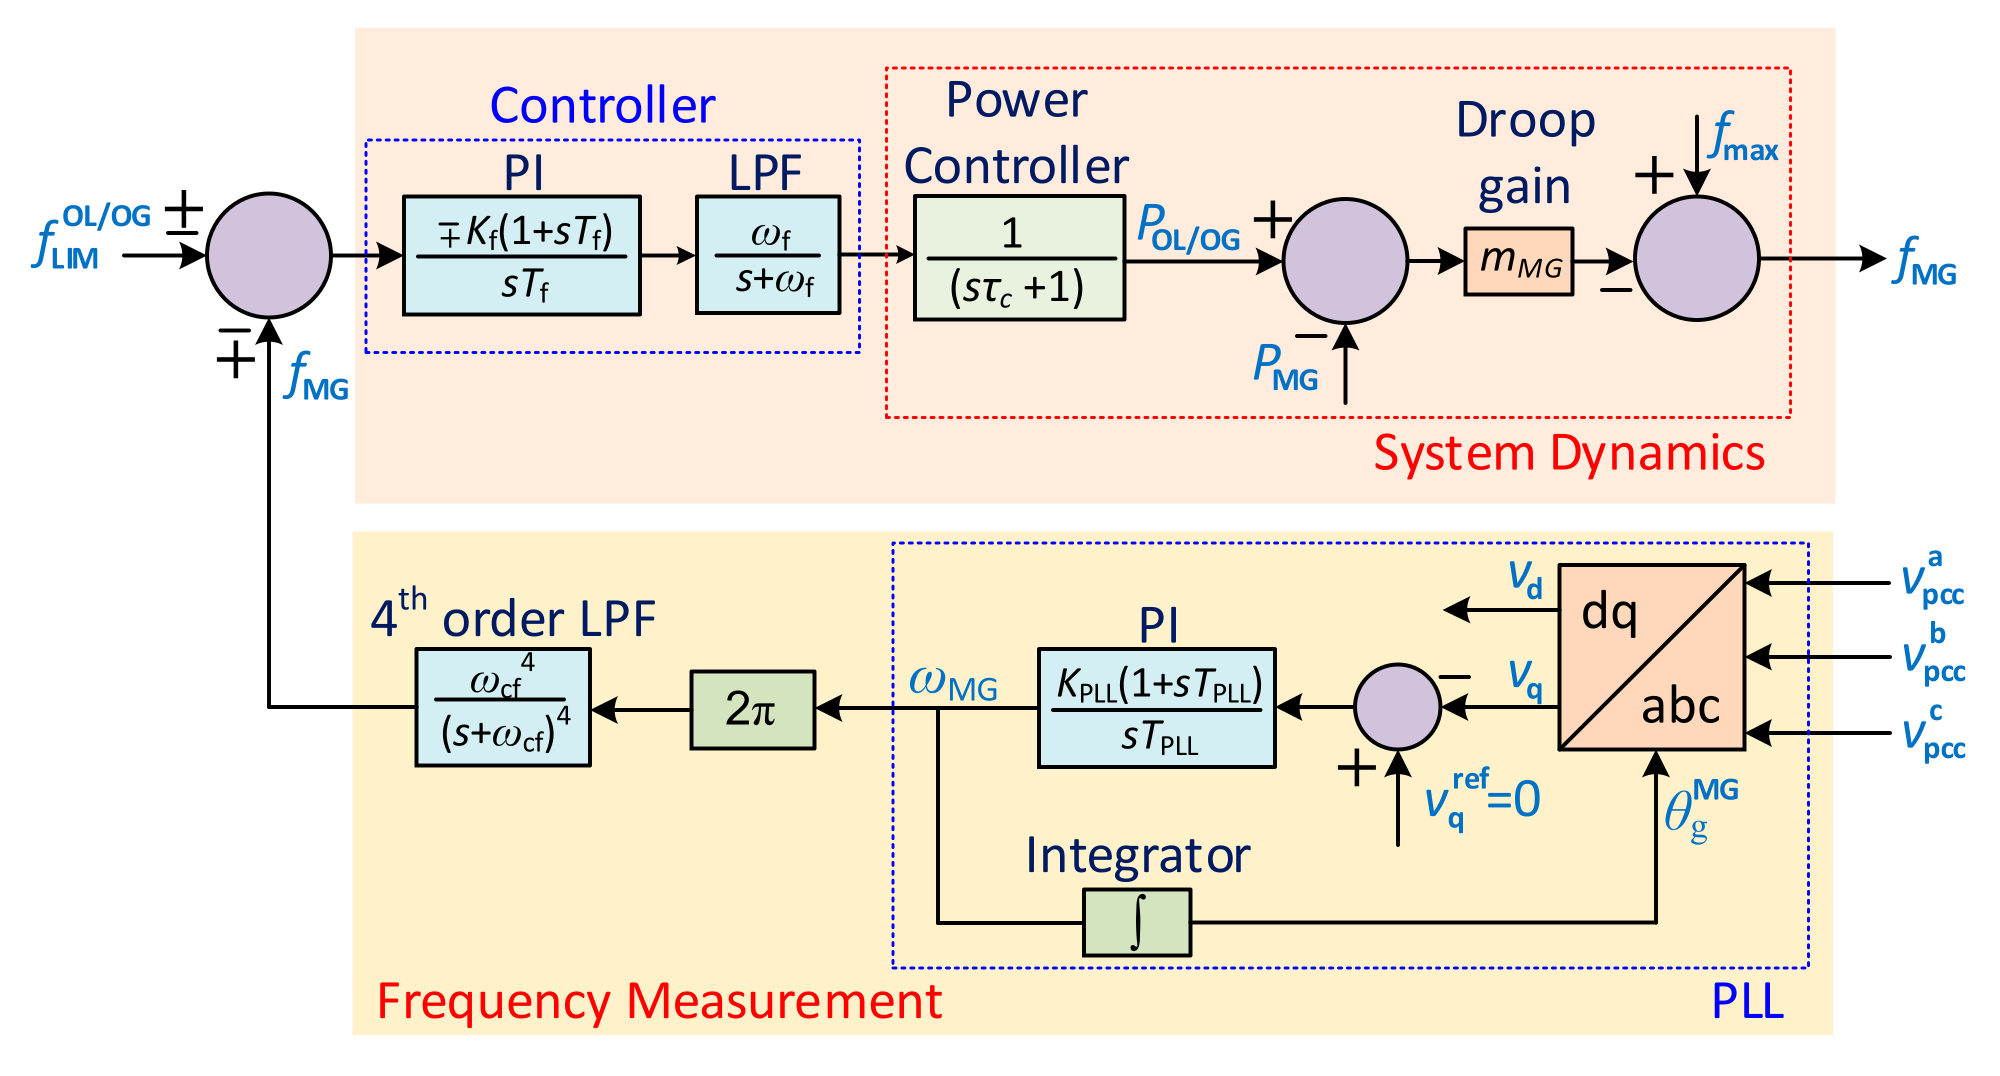
3.2. LSC Control
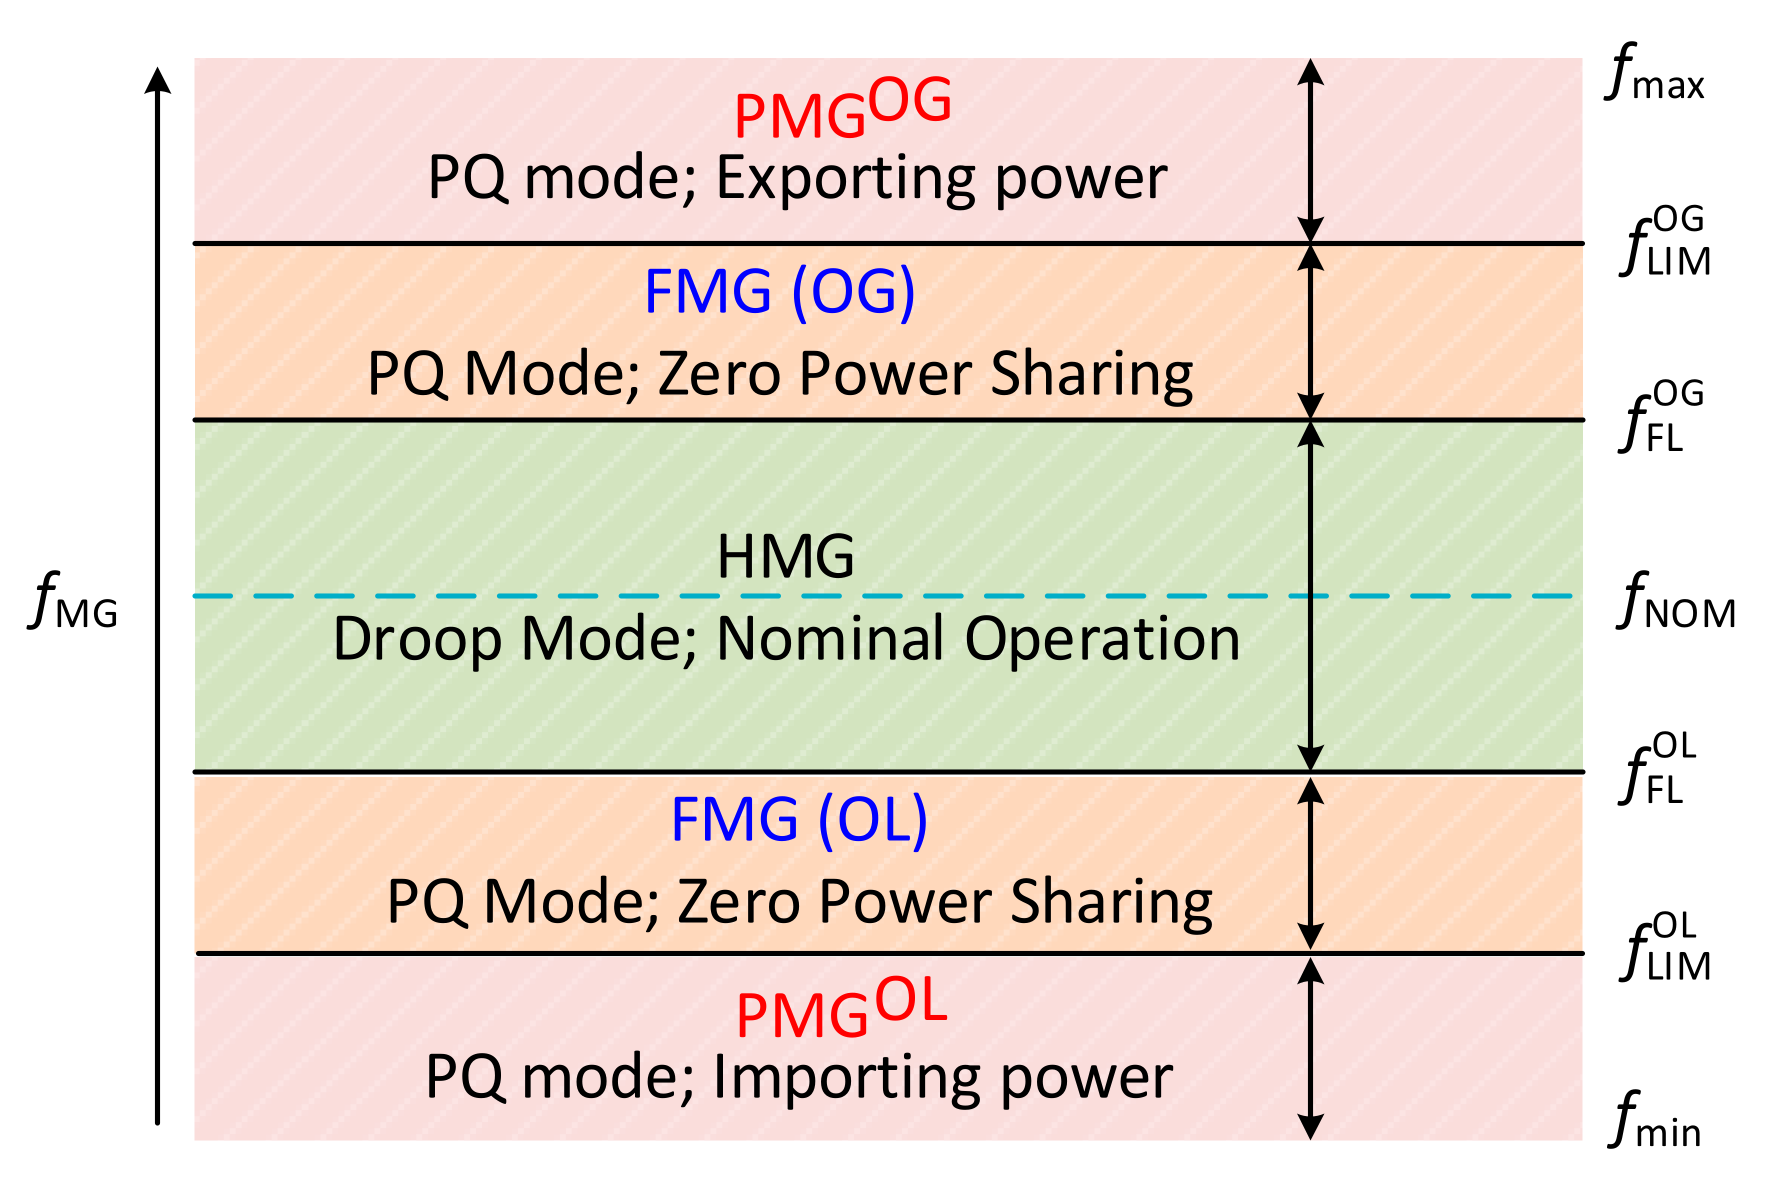
3.2.1. HMG Operation (Droop Control Mode)
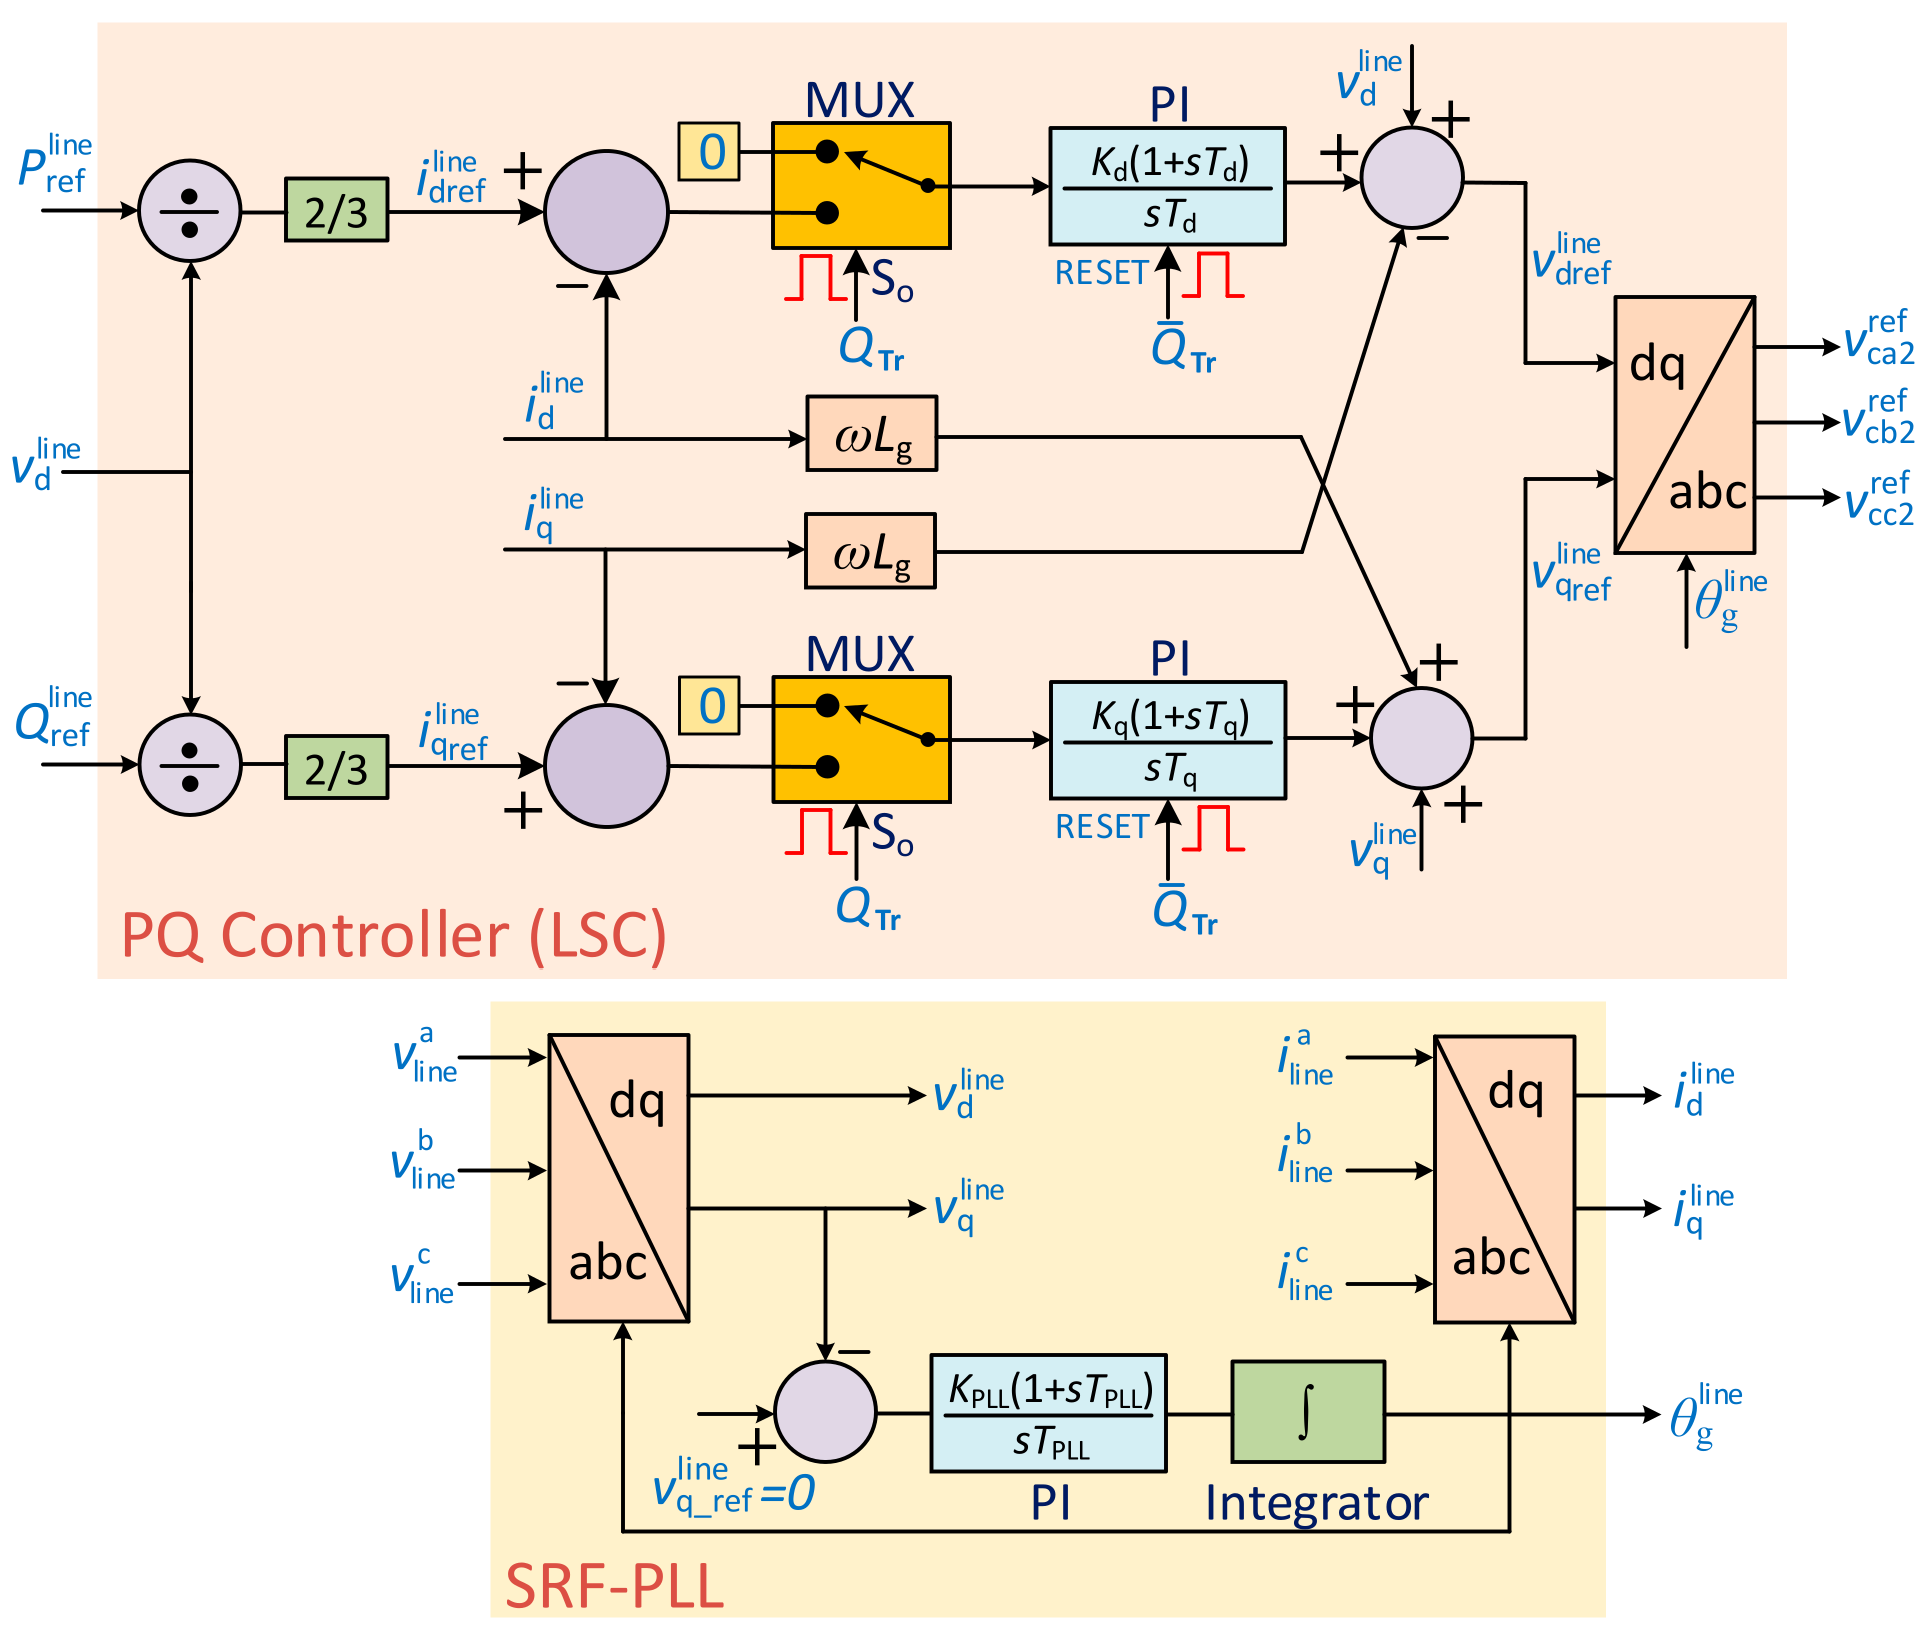
3.2.2. PMG Operation (PQ Control Mode)
4. Performance Evaluation
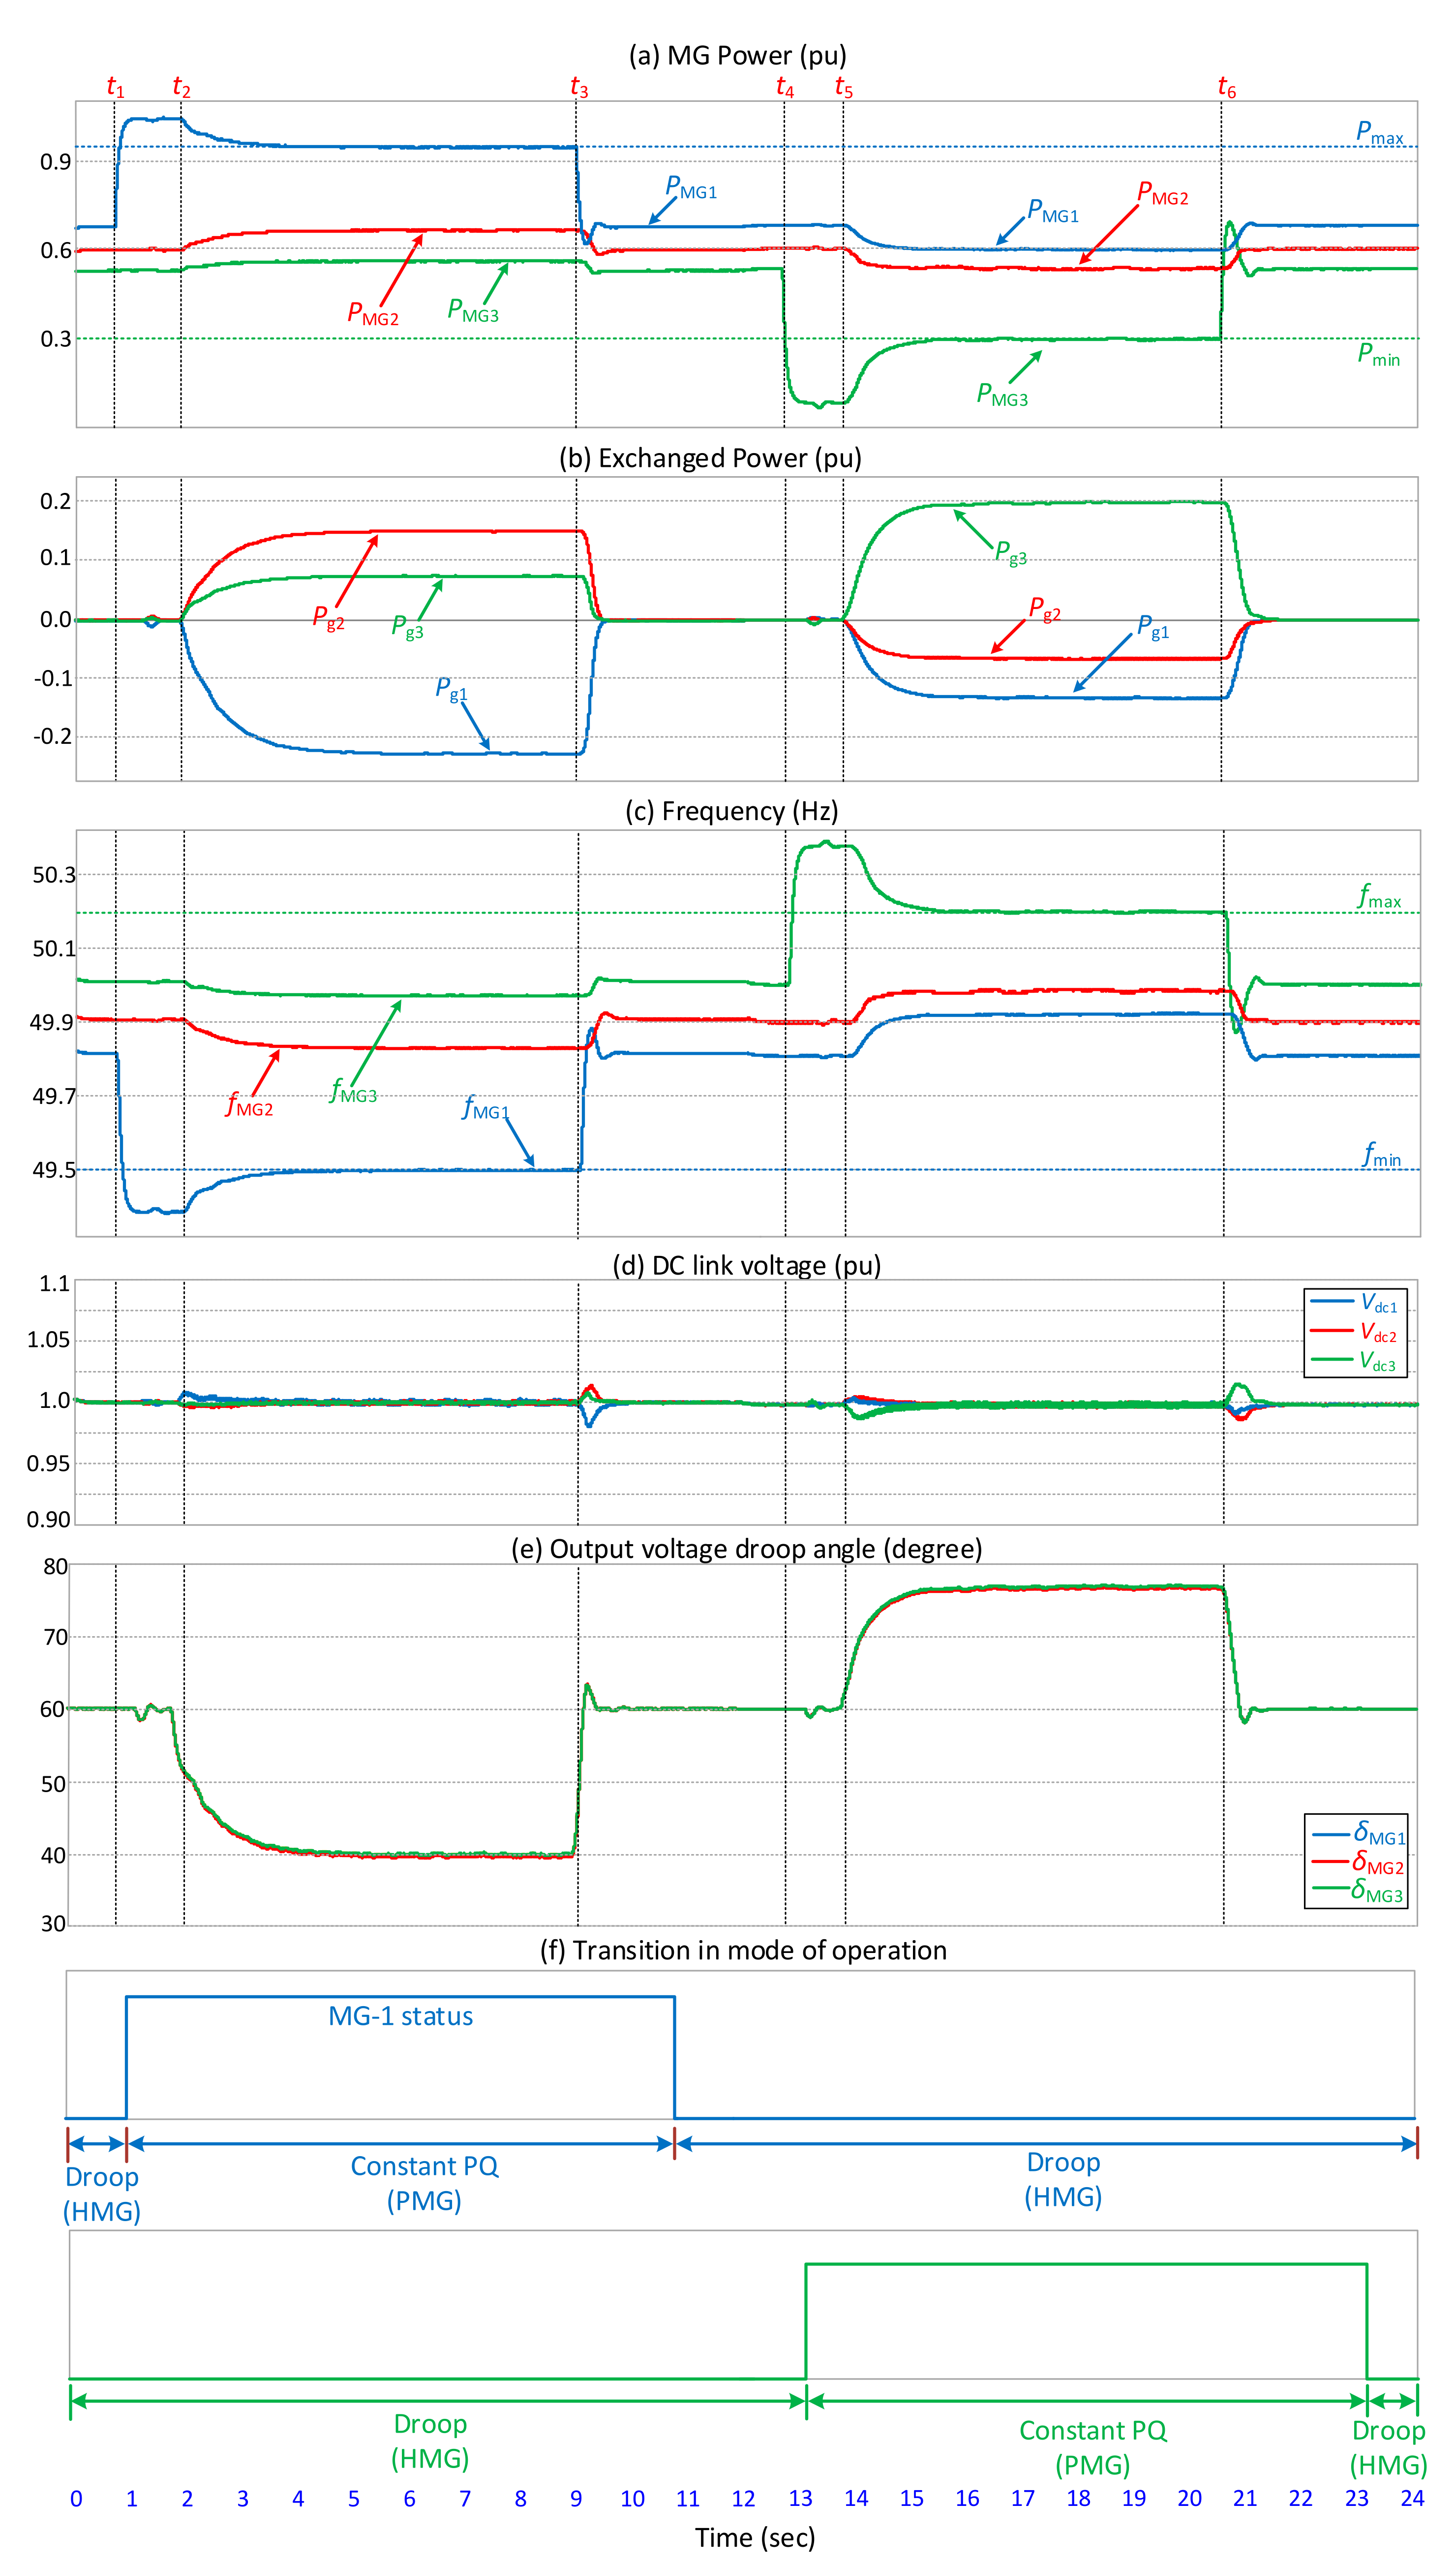
4.1. Case Study 1
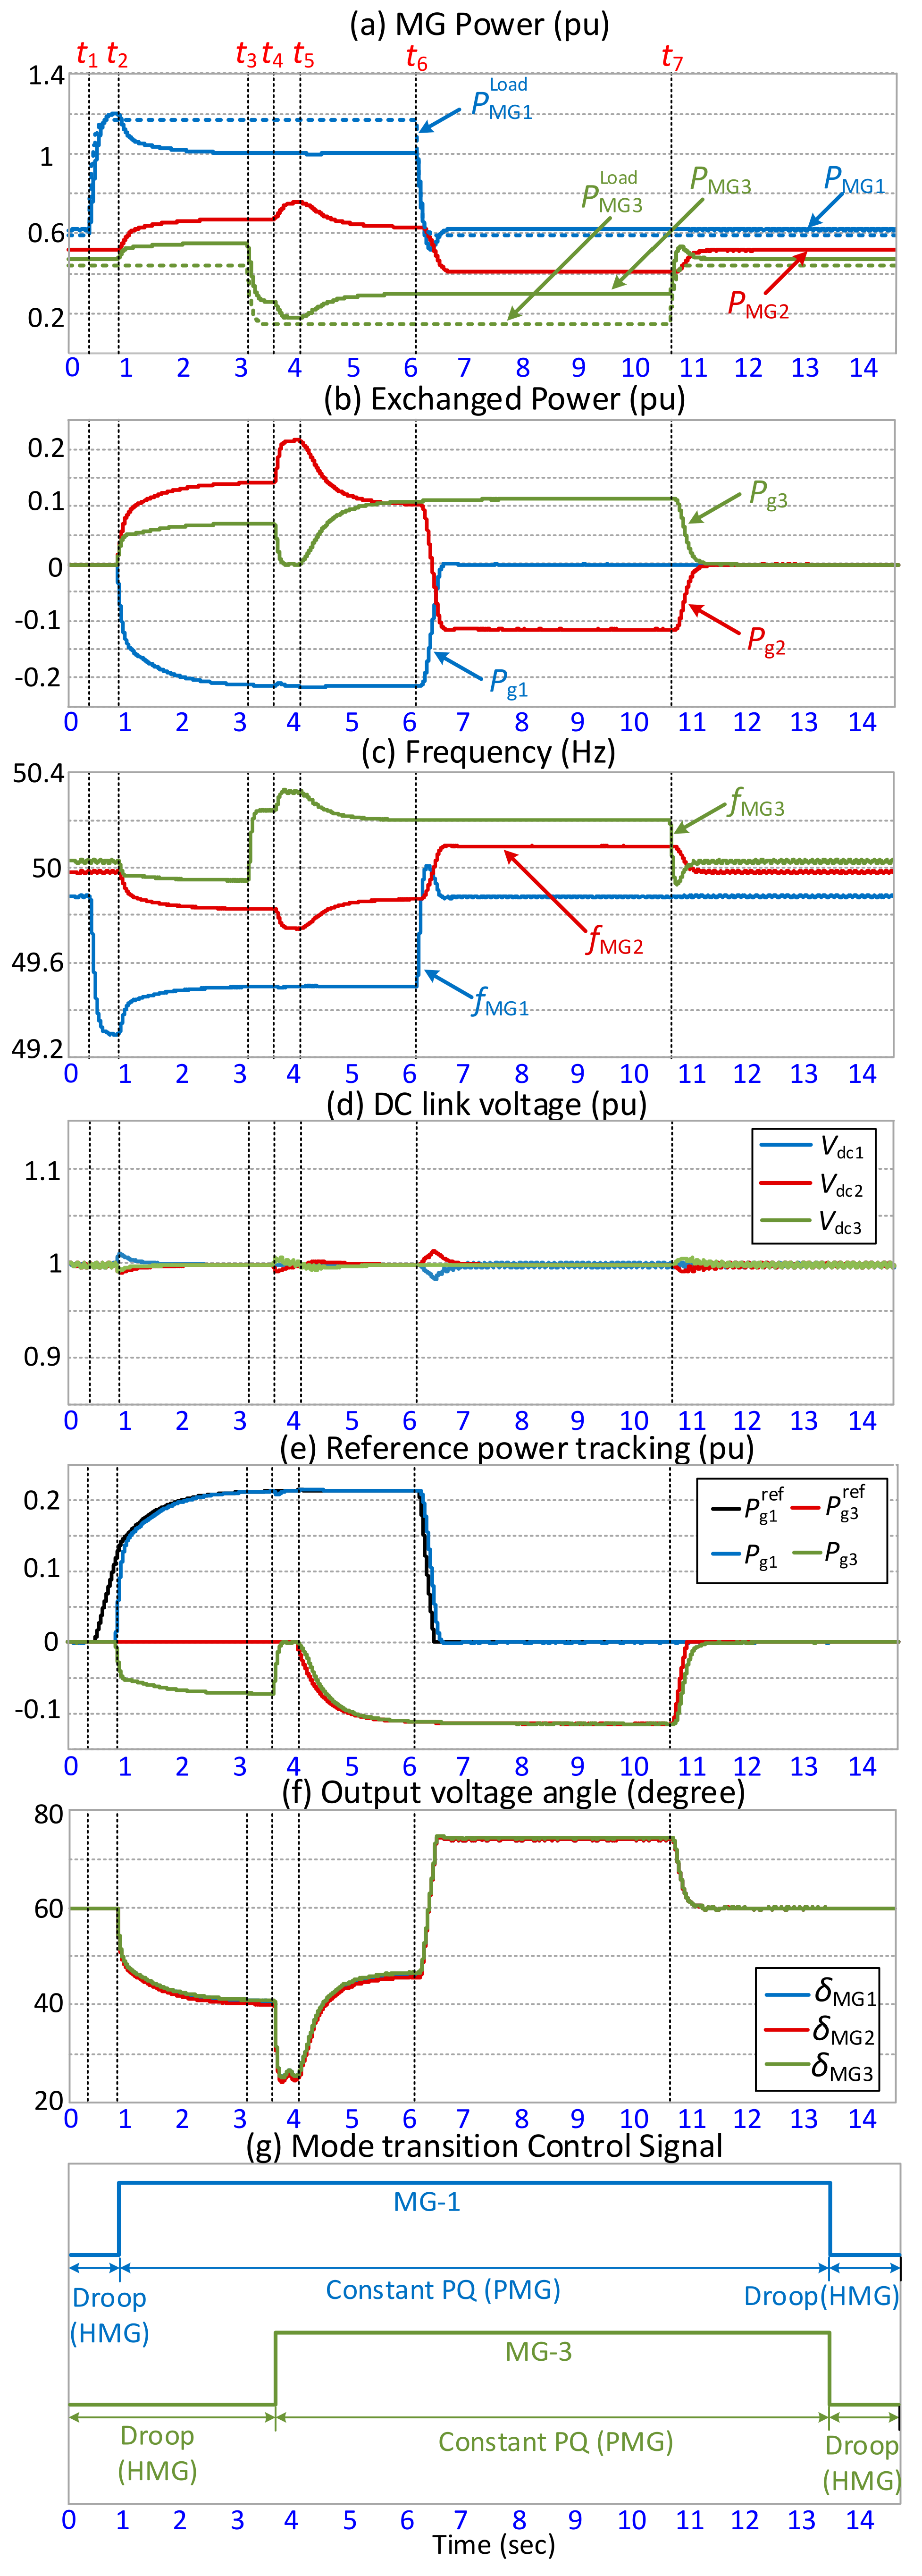
4.2. Case Study-2
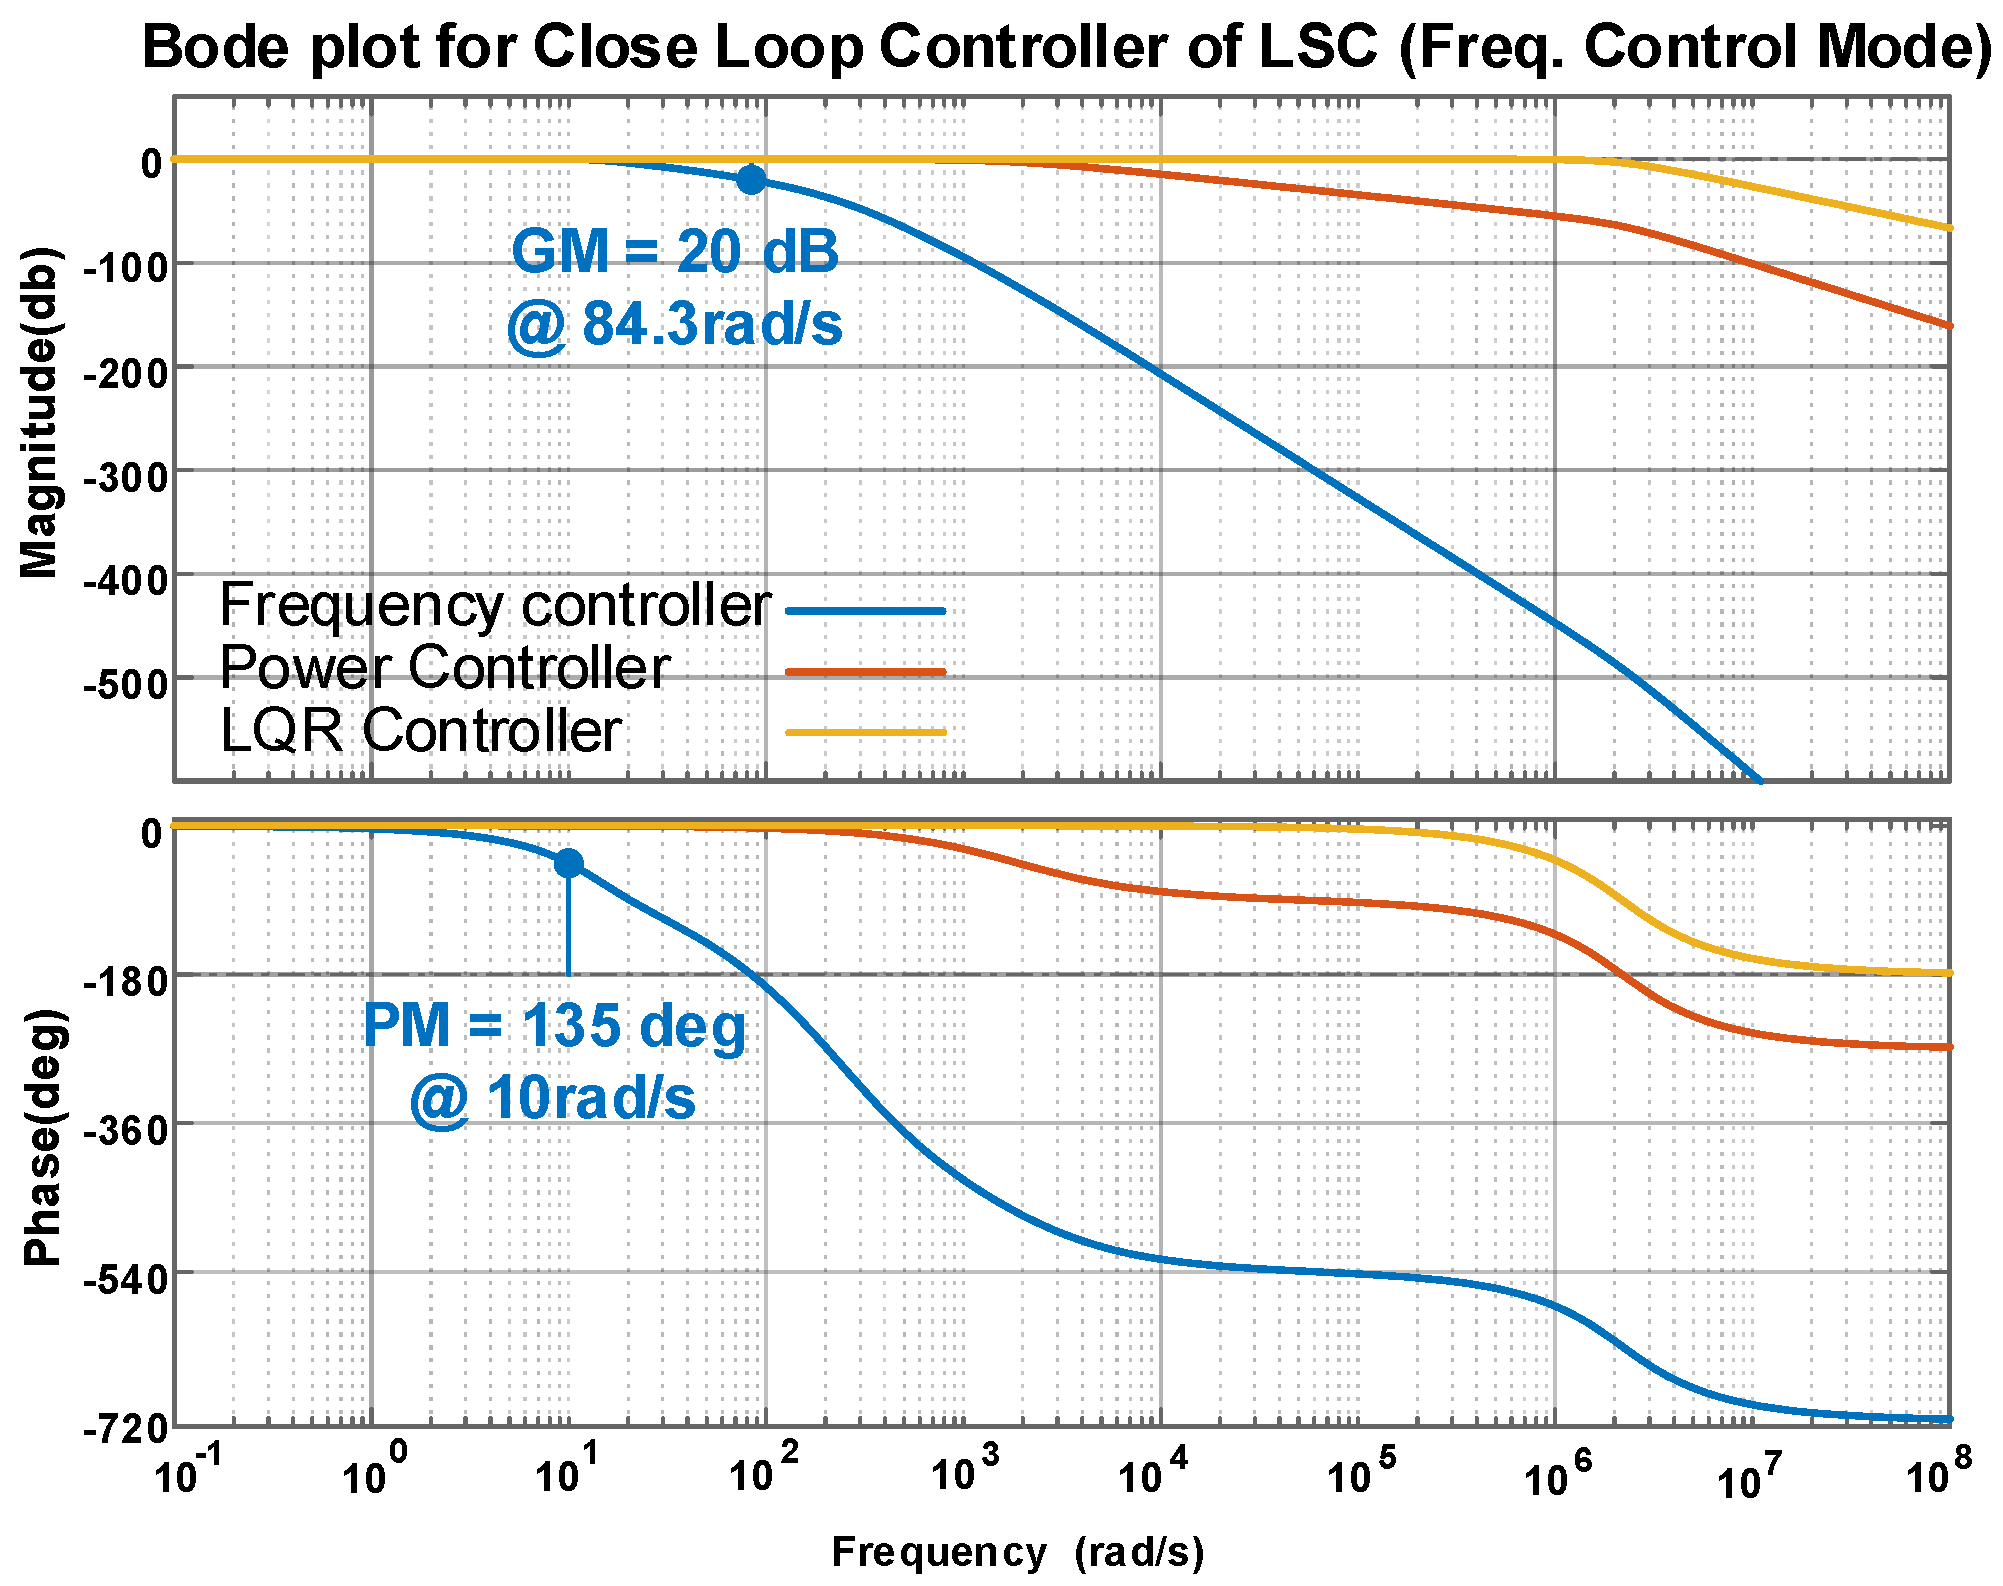
5. Stability Analysis
5.1. Droop Coefficients
5.2. PMG Power
5.3. Interconnecting Line Impedance
5.4. Discussion of Results
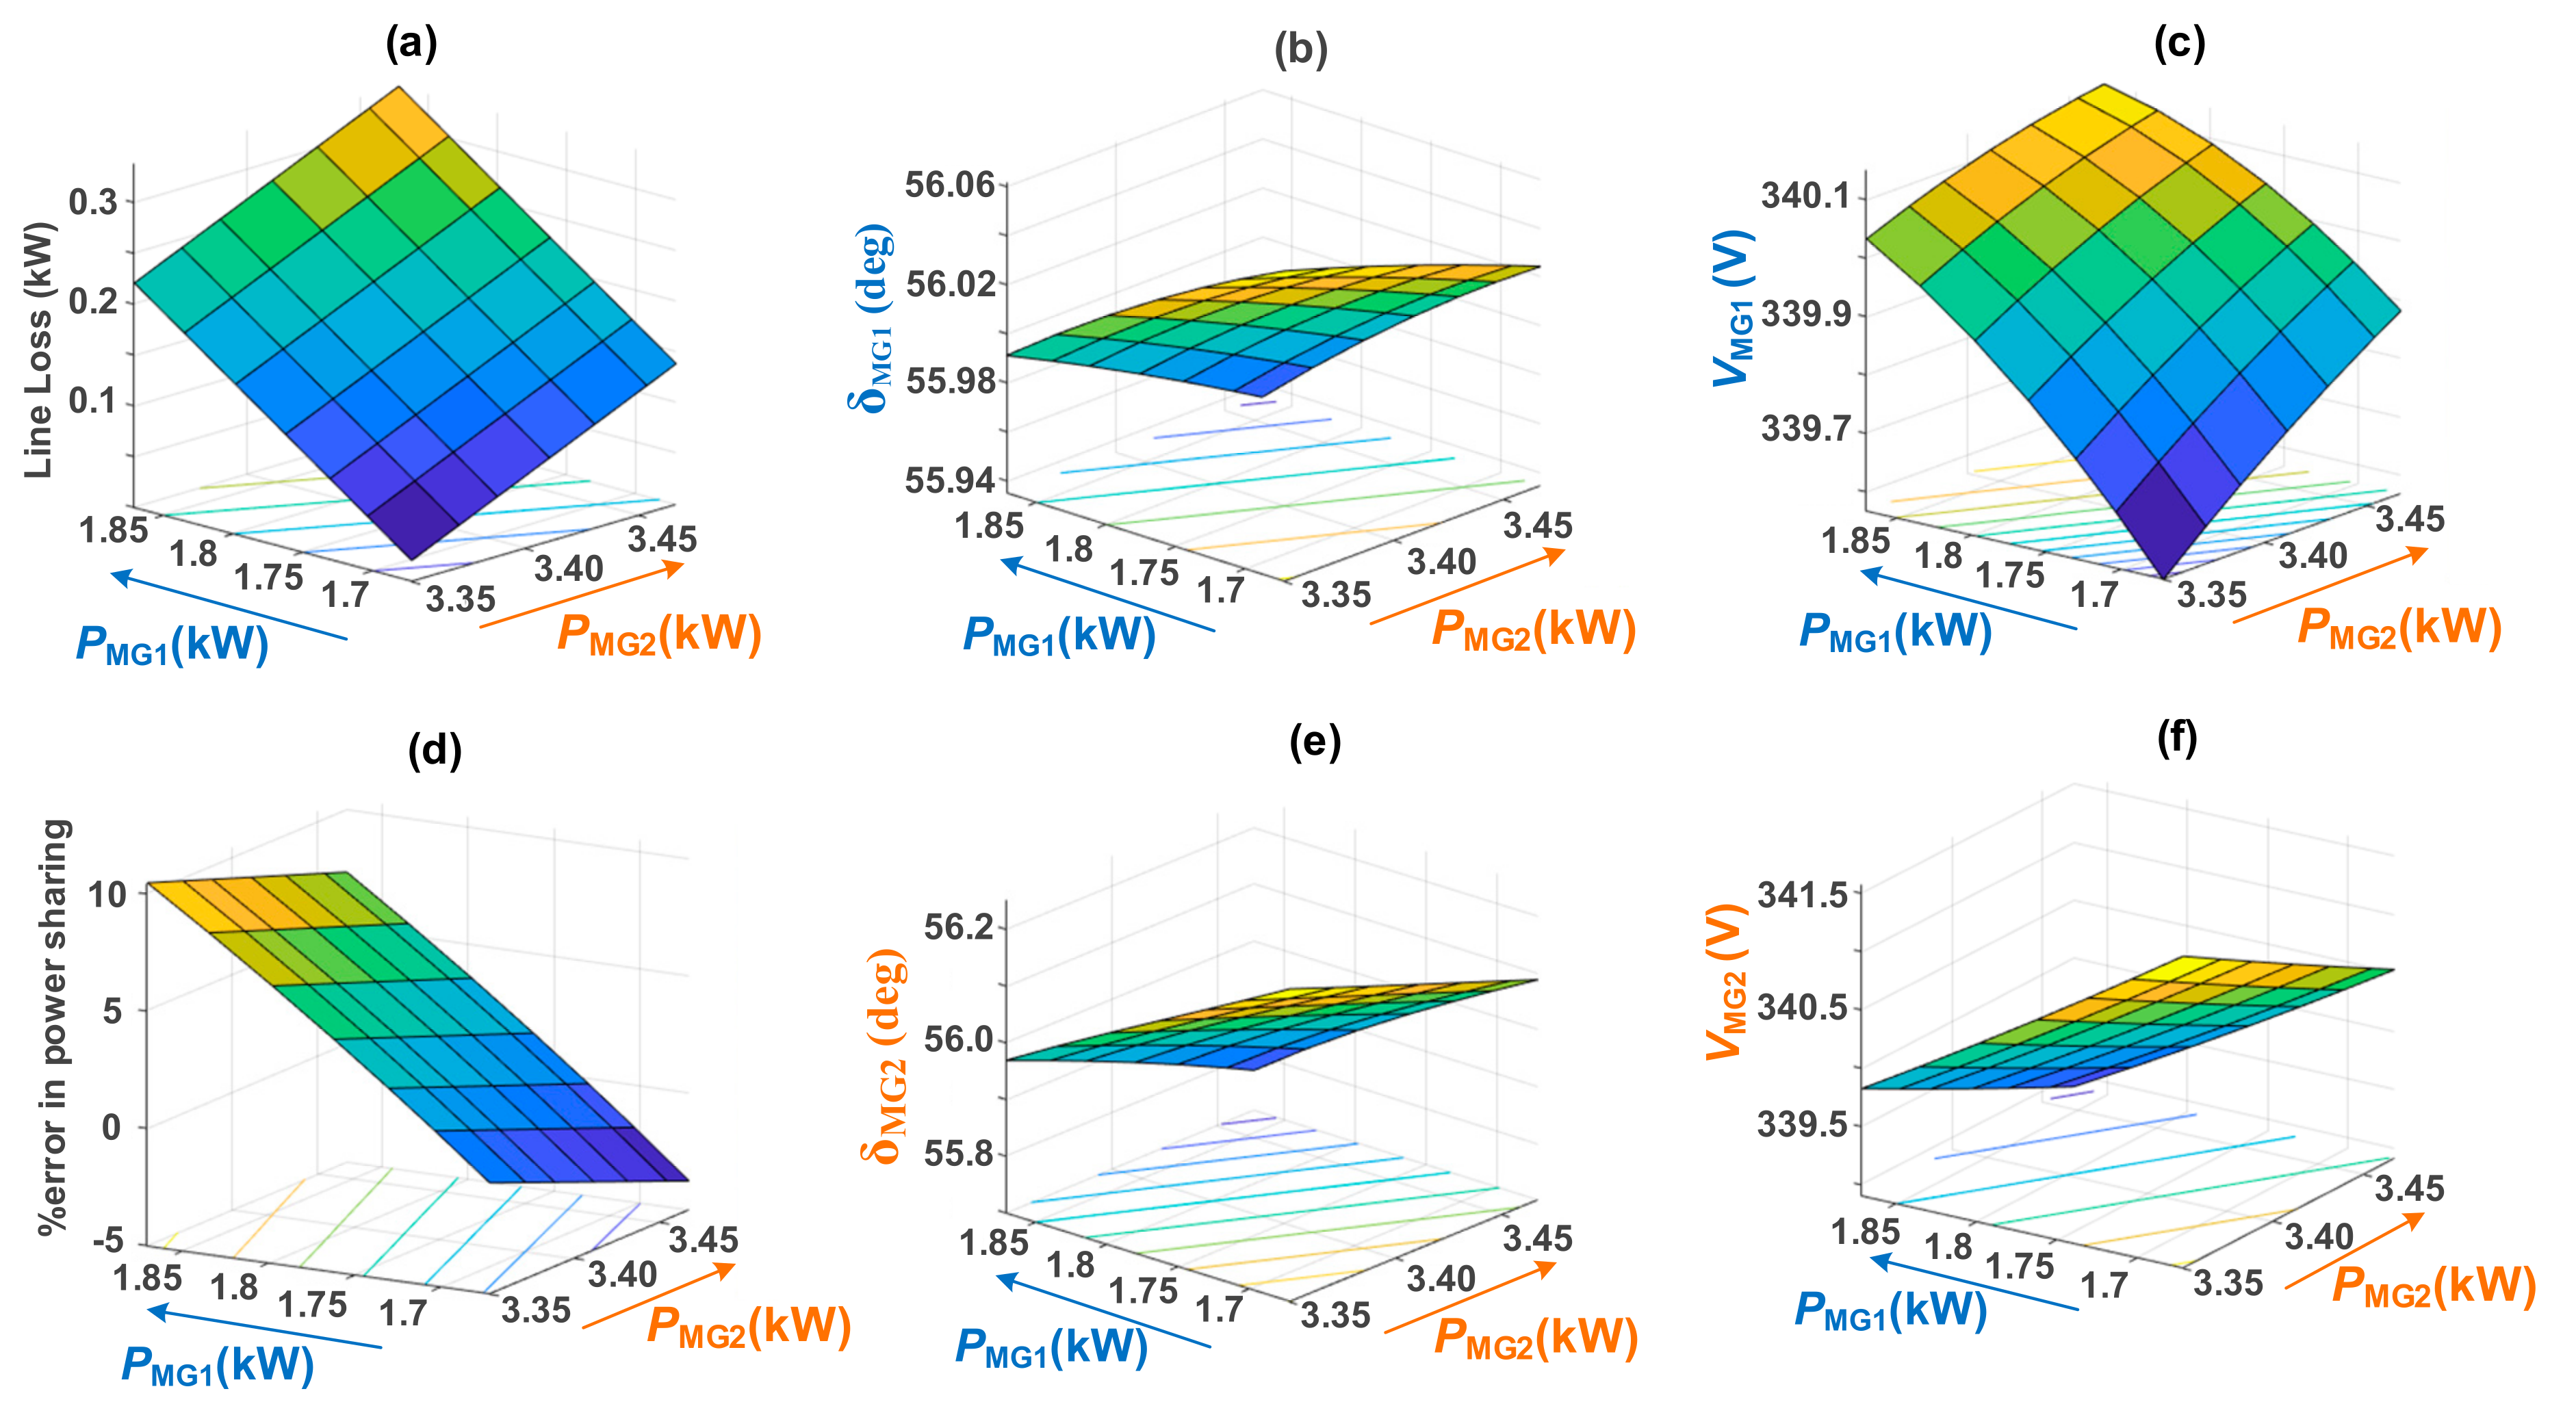
6. Sensitivity Analysis
6.1. Line Impedance Variation
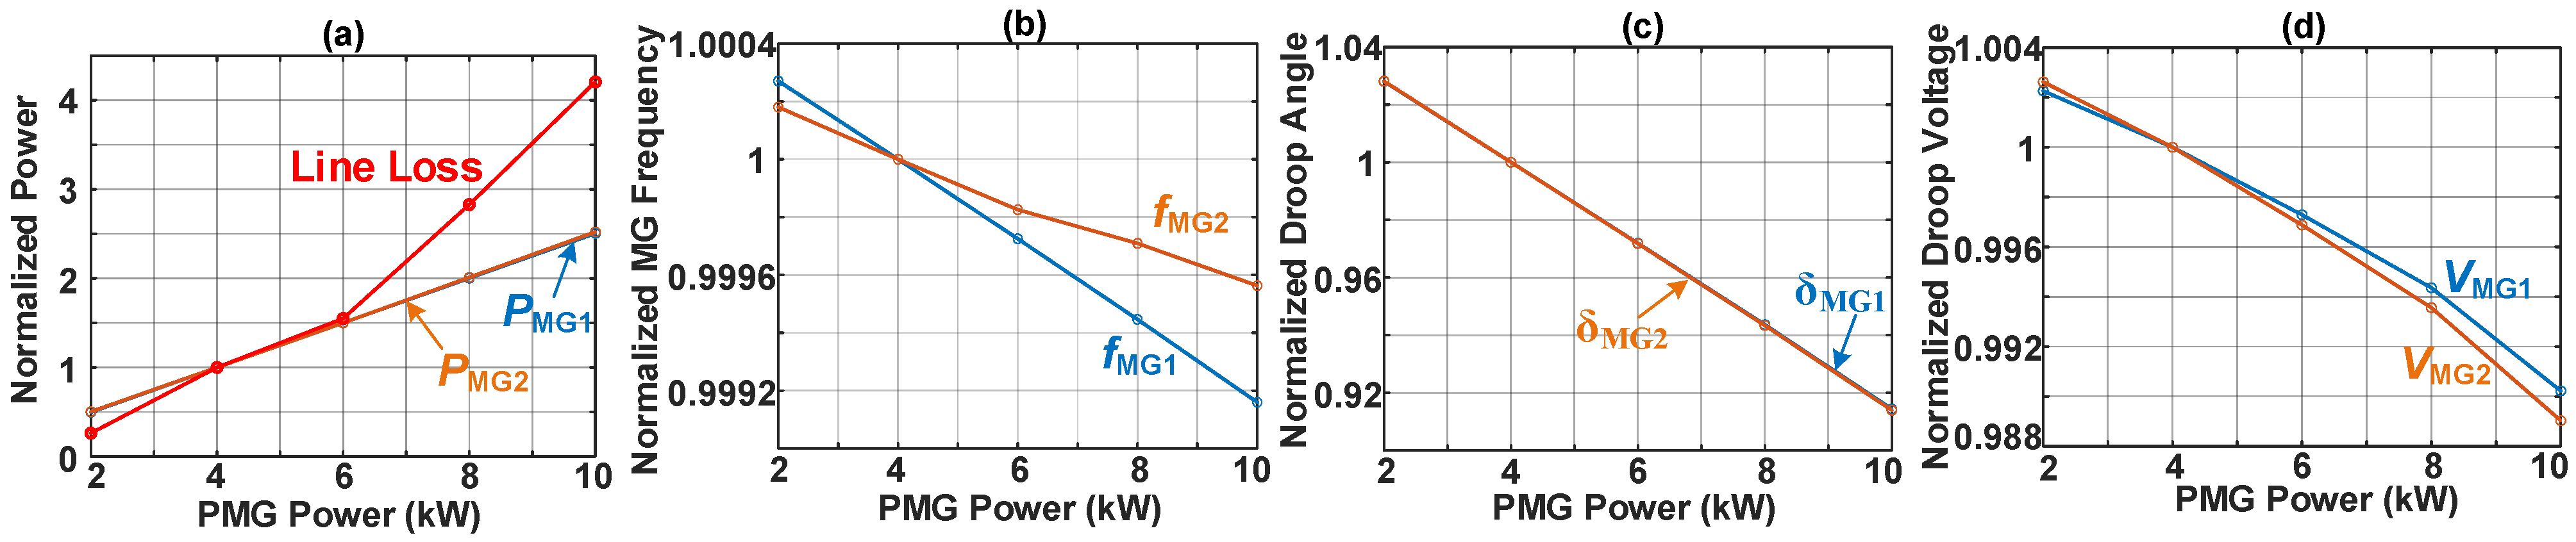
6.2. PMG Power Variation
6.3. Number of Interconnected MG Variation
6.4. Discussion of Results
7. Conclusions
Author Contributions
Funding
Institutional Review Board Statement
Informed Consent Statement
Data Availability Statement
Conflicts of Interest
Nomenclature
| CMG | Coupled Microgrid |
| DER | Distributed energy resource |
| FFT | Fast Fourier Transform |
| FMG | Floating Microgrid |
| HMG | Healthy Microgrid |
| LPF | Low pass filter |
| LQR | Linear Quadratic Equation |
| LSC | Line Side Converter |
| MG | Microgrid |
| MSC | Microgrid Side Converter |
| OG | Over-generation |
| OGFC | Over-generation Frequency Controller |
| OL | Overload |
| OLFC | Overload Frequency Controller |
| PMG | Problem Microgrid |
| PCC | Point of Common Coupling |
| PI | Proportional-integral |
| PLL | Phase-Locked Loop |
| VSC | Voltage source converter |
Appendix A

| Network | |
| DER droop | |
| Angle droop | |
| Converter and filters | |
| LQR gains | |
| PI–PQ controller for MSCs | , bandwidth, |
| PI–PQ controller for LSCs | , bandwidth, |
| Frequency controller | |
| DC link voltage controller |
References
- Lasseter, R.H. Microgrids. In Proceedings of the IEEE Power Engineering Society Winter Meeting. Conference, New York, NY, USA, 27–31 January 2002; Volume 1, pp. 305–308. [Google Scholar]
- Lasseter, R.H.; Piagi, P. Microgrid: A conceptual solution. In Proceedings of the IEEE Power Electronics Specialists Conference, Aachen, Germany, 20–25 June 2004; Volume 6, pp. 4285–4291. [Google Scholar]
- Lasseter, R.H. Smart Distribution: Coupled Microgrids. Proc. IEEE 2011, 99, 1074–1082. [Google Scholar] [CrossRef]
- Yoldaş, Y.; Önen, A.; Muyeen, S.; Vasilakos, A.V.; Alan, İ. Enhancing smart grid with microgrids: Challenges and opportunities. Renew. Sustain. Energy Rev. 2017, 72, 205–214. [Google Scholar] [CrossRef]
- De Matos, J.G.; e Silva, F.S.; Ribeiro, L.A.D.S. Power control in ac isolated microgrids with renewable energy sources and energy storage systems. IEEE Trans. Ind. Electron. 2015, 62, 3490–3498. [Google Scholar]
- Che, L.; Shahidehpour, M.; AlAbdulwahab, A.; Al-Turki, Y. Hierarchical Coordination of a Community Microgrid With AC and DC Microgrids. IEEE Trans. Smart Grid 2015, 6, 3042–3051. [Google Scholar] [CrossRef]
- Liu, G.; Ollis, T.B.; Xiao, B.; Zhang, X.; Tomsovic, K. Networked Microgrids for Improving Economics and Resiliency. In Proceedings of the 2018 IEEE Power & Energy Society General Meeting (PESGM), Portland, OR, USA, 5–10 August 2018; pp. 1–5. [Google Scholar] [CrossRef] [Green Version]
- Abu-Elzait, S.; Parkin, R. Economic and Environmental Advantages of Renewable-based Microgrids over Conventional Microgrids. In Proceedings of the 2019 IEEE Green Technologies Conference(GreenTech), Lafayette, LA, USA, 3–6 April 2019; pp. 1–4. [Google Scholar]
- Arefifar, S.A.; Mohamed, Y.A.R.I. DG mix, reactive sources and energy storage units for optimizing microgrid reliability and supply security. IEEE Trans. Smart Grid 2014, 5, 1835–1844. [Google Scholar]
- Che, L.; Zhang, X.; Shahidehpour, M.; AlAbdulwahab, A.; Abusorrah, A. Optimal Interconnection Planning of Community Microgrids With Renewable Energy Sources. IEEE Trans. Smart Grid 2017, 8, 1054–1063. [Google Scholar] [CrossRef]
- Zia, M.F.; Elbouchikhi, E.; Benbouzid, M. Microgrids energy management systems: A critical review on methods, solutions, and prospects. Appl. Energy 2018, 222, 1033–1055. [Google Scholar] [CrossRef]
- Dagdougui, H.; Ouammi, A.; Sacile, R. Optimal Control of a Network of Power Microgrids Using the Pontryagin’s Minimum Principle. IEEE Trans. Control. Syst. Technol. 2014, 22, 1942–1948. [Google Scholar] [CrossRef]
- Nutkani, I.U.; Loh, P.C.; Wang, P.; Jet, T.K.; Blaabjerg, F. Intertied ac–ac microgrids with autonomous power import and export. Int. J. Electr. Power Energy Syst. 2015, 65, 385–393. [Google Scholar] [CrossRef]
- Goyal, M.; Ghosh, A. Microgrids interconnection to support mutually during any contingency. Sustain. Energy Grids Netw. 2016, 6, 100–108. [Google Scholar] [CrossRef]
- John, B.; Ghosh, A.; Goyal, M.; Zare, F. A DC Power Exchange Highway Based Power Flow Management for Interconnected Microgrid Clusters. IEEE Syst. J. 2019, 13, 3347–3357. [Google Scholar] [CrossRef]
- Bullich-Massague, E.; Díaz-González, F.; Aragüés-Peñalba, M.; Girbau-Llistuella, F.; Olivella-Rosell, P.; Sumper, A. Microgrid clustering architectures. Appl. Energy 2018, 212, 340–361. [Google Scholar]
- Zou, H.; Mao, S.; Wang, Y.; Zhang, F.; Chen, X.; Cheng, L. A Survey of Energy Management in Interconnected Multi-Microgrids. IEEE Access 2019, 7, 72158–72169. [Google Scholar] [CrossRef]
- Minciardi, R.; Sacile, R. Optimal Control in a Cooperative Network of Smart Power Grids. IEEE Syst. J. 2011, 6, 126–133. [Google Scholar] [CrossRef]
- Zhang, Y.; Xie, L.; Ding, Q. Interactive Control of Coupled Microgrids for Guaranteed System-Wide Small Signal Stability. IEEE Trans. Smart Grid 2015, 7, 1088–1096. [Google Scholar] [CrossRef]
- Pashajavid, E.; Shahnia, F.; Ghosh, A. Provisional internal and external power exchange to support remote sustainable microgrids in the course of power deficiency. IET Gener. Transm. Distrib. 2017, 11, 246–260. [Google Scholar] [CrossRef]
- Ferdous, S.M.; Shahnia, F.; Shafiullah, G. Provisional Energy Transaction Management amongst Neighboring Microgrids through a DC Power Exchange Link. In Proceedings of the 2019 9th International Conference on Power and Energy Systems (ICPES), Perth, WA, Australia, 10–12 December 2019; pp. 1–6. [Google Scholar]
- Ferdous, S.; Shahnia, F.; Shafiullah, G. Provisional energy transaction management amongst neighbouring microgrids through a DC power exchange link. IET Power Electron. 2020, 13, 4129–4139. [Google Scholar] [CrossRef]
- Ferdous, S.; Shahnia, F.; Shafiullah, G. Realizing a System of Coupled Microgrids using a Single-phase AC Power Exchange Link. In Proceedings of the 2019 9th International Conference on Power and Energy Systems (ICPES), Perth, WA, Australia, 10–12 December 2019; pp. 1–6. [Google Scholar]
- Ferdous, S.M.; Shahnia, F.; Shafiullah, G. Realizing a system of coupled microgrid networks using single-phase interconnection lines. IET Smart Grid 2021. [Google Scholar] [CrossRef]
- Ferdous, S.M.; Shahnia, F.; Shafiullah, G. Power Sharing and Control Strategy for Microgrid Clusters. In Proceedings of the 2019 9th International Conference on Power and Energy Systems (ICPES), Perth, WA, Australia, 10–12 December 2019; pp. 1–5. [Google Scholar]
- Loh, P.C.; Li, D.; Chai, Y.K.; Blaabjerg, F. Autonomous Operation of Hybrid Microgrid With AC and DC Subgrids. IEEE Trans. Power Electron. 2013, 28, 2214–2223. [Google Scholar] [CrossRef]
- Nutkani, I.U.; Loh, P.C.; Blaabjerg, F. Distributed Operation of Interlinked AC Microgrids with Dynamic Active and Reactive Power Tuning. IEEE Trans. Ind. Appl. 2013, 49, 2188–2196. [Google Scholar] [CrossRef]
- Nikolakakos, I.P.; Zeineldin, H.H.; El Moursi, M.; Hatziargyriou, N.D. Stability Evaluation of Interconnected Multi-Inverter Microgrids Through Critical Clusters. IEEE Trans. Power Syst. 2016, 31, 3060–3072. [Google Scholar] [CrossRef]
- Ferdous, S.M.; Shafiullah, G.M.; Shahnia, F.; Elavarasan, R.M.; Subramaniam, U. Dynamic Frequency and Overload Management in Autonomous Coupled Microgrids for Self-Healing and Resiliency Improvement. IEEE Access 2020, 8, 116796–116811. [Google Scholar] [CrossRef]
- Li, Y.; Gao, D.W.; Gao, W.; Zhang, H.; Zhou, J. A Distributed Double-Newton Descent Algorithm for Cooperative Energy Management of Multiple Energy Bodies in Energy Internet. IEEE Trans. Ind. Inform. 2021, 17, 5993–6003. [Google Scholar] [CrossRef]
- Zhang, N.; Sun, Q.; Wang, J.; Yang, L. Distributed adaptive dual control via consensus algorithm in the energy internet. IEEE Trans. Ind. Inform. 2021, 17, 4848–4860. [Google Scholar]
- Li, Y.; Gao, W.; Yan, W.; Huang, S.; Wang, R.; Gevorgian, V.; Gao, D. Data-driven Optimal Control Strategy for Virtual Synchronous Generator via Deep Reinforcement Learning Approach. J. Mod. Power Syst. Clean Energy 2021, 9, 919–929. [Google Scholar] [CrossRef]
- Majumder, R. Aggregation of microgrids with DC system. Electr. Power Syst. Res. 2014, 108, 134–143. [Google Scholar] [CrossRef]
- Ferdous, S.; Shahnia, F.; Shafiullah, G. Various Structures and Control Strategies for Provisional Energy Transaction Management in Coupled Microgrid Clusters. In Proceedings of the 2020 Intermountain Engineering, Technology and Computing (IETC), Orem, UT, USA, 2–3 October 2020; pp. 1–6. [Google Scholar]
- Planas, E.; Andreu, J.; Garate, J.I.; de Alegría, I.M.; Ibarra, E. AC and DC technology in microgrids: A review. Renew. Sustain. Energy Rev. 2015, 43, 726–749. [Google Scholar] [CrossRef]
- Justo, J.J.; Mwasilu, F.; Lee, J.; Jung, J.-W. AC-microgrids versus DC-microgrids with distributed energy resources: A review. Renew. Sustain. Energy Rev. 2013, 24, 387–405. [Google Scholar] [CrossRef]
- Beheshtaein, S.; Cuzner, R.; Savaghebi, M.; Guerrero, J. Review on microgrids protection. IET Gener. Transm. Distrib. 2019, 13, 743–759. [Google Scholar] [CrossRef]
- Kim, J.-W.; Choi, H.-S.; Cho, B.H. A novel droop method for converter parallel operation. IEEE Trans. Power Electron. 2002, 17, 25–32. [Google Scholar] [CrossRef]
- Augustine, S.; Mishra, M.K.; Lakshminarasamma, N. Adaptive Droop Control Strategy for Load Sharing and Circulating Current Minimization in Low-Voltage Standalone DC Microgrid. IEEE Trans. Sustain. Energy 2015, 6, 132–141. [Google Scholar] [CrossRef]
- Shahnia, F.; Chandrasena, R.P.; Rajakaruna, S.; Ghosh, A. Primary control level of parallel distributed energy resources converters in system of multiple interconnected autonomous microgrids within self-healing networks. IET Gener. Transm. Distrib. 2014, 8, 203–222. [Google Scholar] [CrossRef]
- Yazdani, A.; Iravani, R. Voltage-Sourced Converters in Power Systems: Modeling, Control, and Applications; Wiley-Blackwell: Hoboken, NJ, USA, 2010. [Google Scholar]
- Yazdani, A.; Iravani, R. An accurate model for the dc-side voltage control of the neutral point diode clamped converter. IEEE Trans. Power Deliv. 2005, 21, 185–193. [Google Scholar]
- Ferdous, S.M.; Shafiullah, G.M.; Oninda, M.A.M.; Shoeb, A.; Jamal, T. Close loop compensation technique for high performance MPPT using ripple correlation control. In Proceedings of the 2017 Australasian Universities Power Engineering Conference (AUPEC), Melbourne, VIC, Australia, 19–22 November 2017; pp. 1–6. [Google Scholar]
- Hosseinimehr, T.; Ghosh, A.; Shahnia, F. Cooperative control of battery energy storage systems in microgrids. Int. J. Electr. Power Energy Syst. 2017, 87, 109–120. [Google Scholar] [CrossRef]
- Hosseinimehr, T.; Shahnia, F.; Ghosh, A. Power sharing control of batteries within autonomous microgrids based on their state of charge. In Proceedings of the 2015 Australasian Universities Power Engineering Conference (AUPEC), Wollongong, NSW, Australia, 27–30 September 2015; pp. 1–6. [Google Scholar]
- Shahnia, F.; Arefi, A. Eigenanalysis-based small signal stability of the system of coupled sustainable microgrids. Int. J. Electr. Power Energy Syst. 2017, 91, 42–60. [Google Scholar] [CrossRef]
- Kunwar, A.; Shahnia, F.; Bansal, R.C. Eigenvalue-Oriented Dynamic Stability Examination to Enhance Designing a Microgrid Hosting Clusters of Inertial and Non-Inertial Distributed Generators. IEEE Trans. Smart Grid 2020, 11, 1942–1955. [Google Scholar] [CrossRef]


| Time Instant | MG Status | Action Taken | ||
|---|---|---|---|---|
| MG-1 | MG-2 | MG-3 | ||
| OL | HMG | HMG | Normal operation for MG-2 and MG-3 while MG-1 is overloaded. | |
| PMG | HMG | HMG | MG-1 is overloaded, while MG-2 and MG-3 are supporting it by supplying the overload power. | |
| HMG | HMG | HMG | Over-generation of MG-1 is complete, and all MGs become HMG. | |
| HMG | HMG | OG | Normal operation for MG-1 and MG-2 while MG-3 is over-generating. | |
| HMG | HMG | PMG | MG-3 is over-generating, while MG-1 and MG-2 are supporting it by absorbing the excess power. | |
| HMG | HMG | HMG | Over-generation of MG-3 is over, and all MGs become HMG. | |
| Time Instant | MG Status | Action Taken | ||
|---|---|---|---|---|
| MG-1 | MG-2 | MG-3 | ||
| OL | HMG | HMG | Normal operation for MG-2 and MG-3 while MG-1 is overloaded. | |
| PMG | HMG | HMG | MG-1 becomes overloaded, so MG-2 and 3 support it. | |
| PMG | HMG | OG | MG-3 is over-generating. | |
| PMG | HMG | FMG | MG-3 changes its operation mode from droop to PQ but shares zero power. MG-2 is supporting MG-1. | |
| PMG | HMG | PMG | Both MG-1 and 3 are supported by MG-2. | |
| FMG | HMG | PMG | MG-1 overload condition is removed while MG-2 is supporting MG-3. | |
| HMG | HMG | HMG | All the MGs become HMG and all MGs switch to droop mode. | |
Publisher’s Note: MDPI stays neutral with regard to jurisdictional claims in published maps and institutional affiliations. |
© 2021 by the authors. Licensee MDPI, Basel, Switzerland. This article is an open access article distributed under the terms and conditions of the Creative Commons Attribution (CC BY) license (https://creativecommons.org/licenses/by/4.0/).
Share and Cite
Ferdous, S.M.; Shahnia, F.; Shafiullah, G. Power Sharing and Control Strategy for Provisionally Coupled Microgrid Clusters through an Isolated Power Exchange Network. Energies 2021, 14, 7514. https://doi.org/10.3390/en14227514
Ferdous SM, Shahnia F, Shafiullah G. Power Sharing and Control Strategy for Provisionally Coupled Microgrid Clusters through an Isolated Power Exchange Network. Energies. 2021; 14(22):7514. https://doi.org/10.3390/en14227514
Chicago/Turabian StyleFerdous, S.M., Farhad Shahnia, and GM Shafiullah. 2021. "Power Sharing and Control Strategy for Provisionally Coupled Microgrid Clusters through an Isolated Power Exchange Network" Energies 14, no. 22: 7514. https://doi.org/10.3390/en14227514