Abstract
Discussions regarding the definition of Positive Energy Districts and the concept of a boundary are still being actively held. Even though there are certain initiatives working on the boundary limitations for PEDs, there is no methodology or tool developed for selecting peculiar spaces for future PED implementations. The paper focuses on a flexible GIS-based Multicriteria assessment method that identifies the most suitable areas to reach an annual positive non-renewable energy balance. For that purpose, a GIS-based tool is developed to indicate the boundary from an energy perspective harmonized with urban design and land-use planning. The method emphasizes evaluation through economic, social, political, legal, environmental, and technical criteria, and the results present the suitability of areas at macro and micro scales. The current study outlines macro-scale analyses in six European cities that represent Follower Cities under the MAKING-CITY H2020 project. Further research will be conducted for micro-scale analyses and the outcomes will pursue a technology selection process.
1. Introduction
The potential for high energy savings in building stock has long been recognized, and different policies have been established for achieving savings at the European Level. The original Energy Performance of Buildings Directive (EPBD) in 2002 introduced more strict building regulations and energy certification, while the policies have evolved towards the requirement of “nearly zero energy building”, in the EPBD 2010 update [1], where it is defined as “a building that has a very high energy performance. The nearly zero or very low amount of energy required should be covered to a very significant extent by energy from renewable sources, including energy from renewable sources produced on-site or nearby”. This directive already required that the calculation of energy performance in buildings should consider district heating or cooling solutions, as these solutions can have potential benefits for the performance of buildings. The amendment of the EPBD Directive in 2018 included no additional requirements to evaluate the district-level energy performance, although it does state that the Commission should review the EPBD before January 2026, to “examine in what manner Member States could apply integrated district or neighborhood approaches in Union building and energy efficiency policy”.
In the meantime, there are different EU initiatives promoting strategies and technologies for improving energy efficiency and increasing renewable energy at the district level. For example, the Strategic Energy Technology (SET) Plan Action 3.2 [2], “Energy Districts and Neighborhoods for Sustainable Urban Development” aims to support the planning, deployment, and replication of 100 Positive Energy Neighborhoods by 2025. In order to reach this target, the concepts of Positive Energy Blocks (PEBs) and Positive Energy Districts (PEDs) have initially emerged from the EU Horizon 2020 Smart Cities and Communities project calls [3], and a number of research projects such as MAKING-CITY [4], POcityF [5], ATELIER [6], CityxChange [7], SPARCs [8], and RESPONSE [9] are being funded to test and realize Positive Energy Districts (PEDs) in “Lighthouse” cities, and support “follower cities” to replicate the experience. This paper addresses a methodology that has been developed within the MAKING-CITY project, in order to provide knowledge and experience to the participant cities to identify and select PEDs. The selection of suitable areas is the first step towards planning and realization of successful PEDs, which aims to help cities in their efforts to integrate energy planning within urban design and planning. It is expected that the proposed method could serve as an example and could be replicable in different EU city contexts. While the above-mentioned projects work on PED design and development, PED districts are generally individually selected taking into account different parameters, but no structured process for the identification and selection of areas within the cities with the potential to become energy positive has been defined. The proposed method in this paper relates to the various approaches that are mentioned in the literature for identifying suitable areas for energy planning, benefitting from GIS-based methodologies [10,11,12,13,14,15]. The selection of the areas has to be adapted to the city’s characteristics, considering both spatial/physical and technical characteristics of the cities, together with socio-economic, environmental, legal, and regulatory issues. Following this approach, a flexible GIS-based Multicriteria assessment method is developed that identifies the most suitable areas to reach an annual positive non-renewable energy balance. For that purpose, a GIS-based tool is generated to indicate the boundary from an energy perspective harmonized with urban design and land-use planning. The method emphasizes evaluation through economic, social, political, legal, environmental, and technical criteria and results present the suitability of areas at macro and micro scales.
Moreover, the definition of the PED concept boundary is still at the research stage and scenarios regarding the energy delivered, energy use and demand, and RES on-site still vary from project to project. Gabaldon et al. state that the key concept of PED is that of a district that produces more energy from RES than what is needed to fulfil the district’s demand, being able to export this energy surplus to another part of the city [16]. According to the MAKING-CITY project, a Positive Energy District (PED) is “an urban area with clear boundaries, consisting of buildings of different typologies that actively manage the energy flow between them and the larger energy system to reach an annual positive non-renewable energy balance” [4]. Aligned with this definition, a methodology for PED design [17] is developed, and parameters concerning resources, energy planning, and energy infrastructure, so-called PED Analytical Components, are collected within city boundaries, evaluated through a multi-criteria analysis, and GIS-based analyses at macro and micro scales are conducted to identify peculiar PED boundaries in cities. In this publication, macro scale analysis has been examined, detailing the type of data and characteristics that need to be gathered at the city level to allow for the selection of areas most suitable for PED development. A further step in the methodology should deal with a more detailed micro-scale analysis, where more detailed data with more resolution for each specific building or group of buildings (e.g., energy use and energy systems, socioeconomic characteristics) would be gathered and processed. This additional micro-scale analysis would support preliminary PED design and viability studies, but will not be covered in this paper, which will focus only on the macro-scale analysis for identification of PED boundaries.
2. Methodology for Identifying PED Concept Boundary in Cities
If a wide range of stakeholders are active in making a decision (when it comes to PED arguments), utilizing a Multi Criteria Decision Analysis has multiple benefits as it allows for considering a diverse set of values, targets, and interests from the various actors involved in planning, designing, and implementing PEDs. Integrating spatial analysis with MCDA is impactful in terms of evaluating multiple criteria for defining different scenarios on geographic data models [18]. Several GIS-MCDA applications refer to site selection, scenario evaluation, land suitability, impact assessment, and location allocation to a variety of sectors [19,20,21].
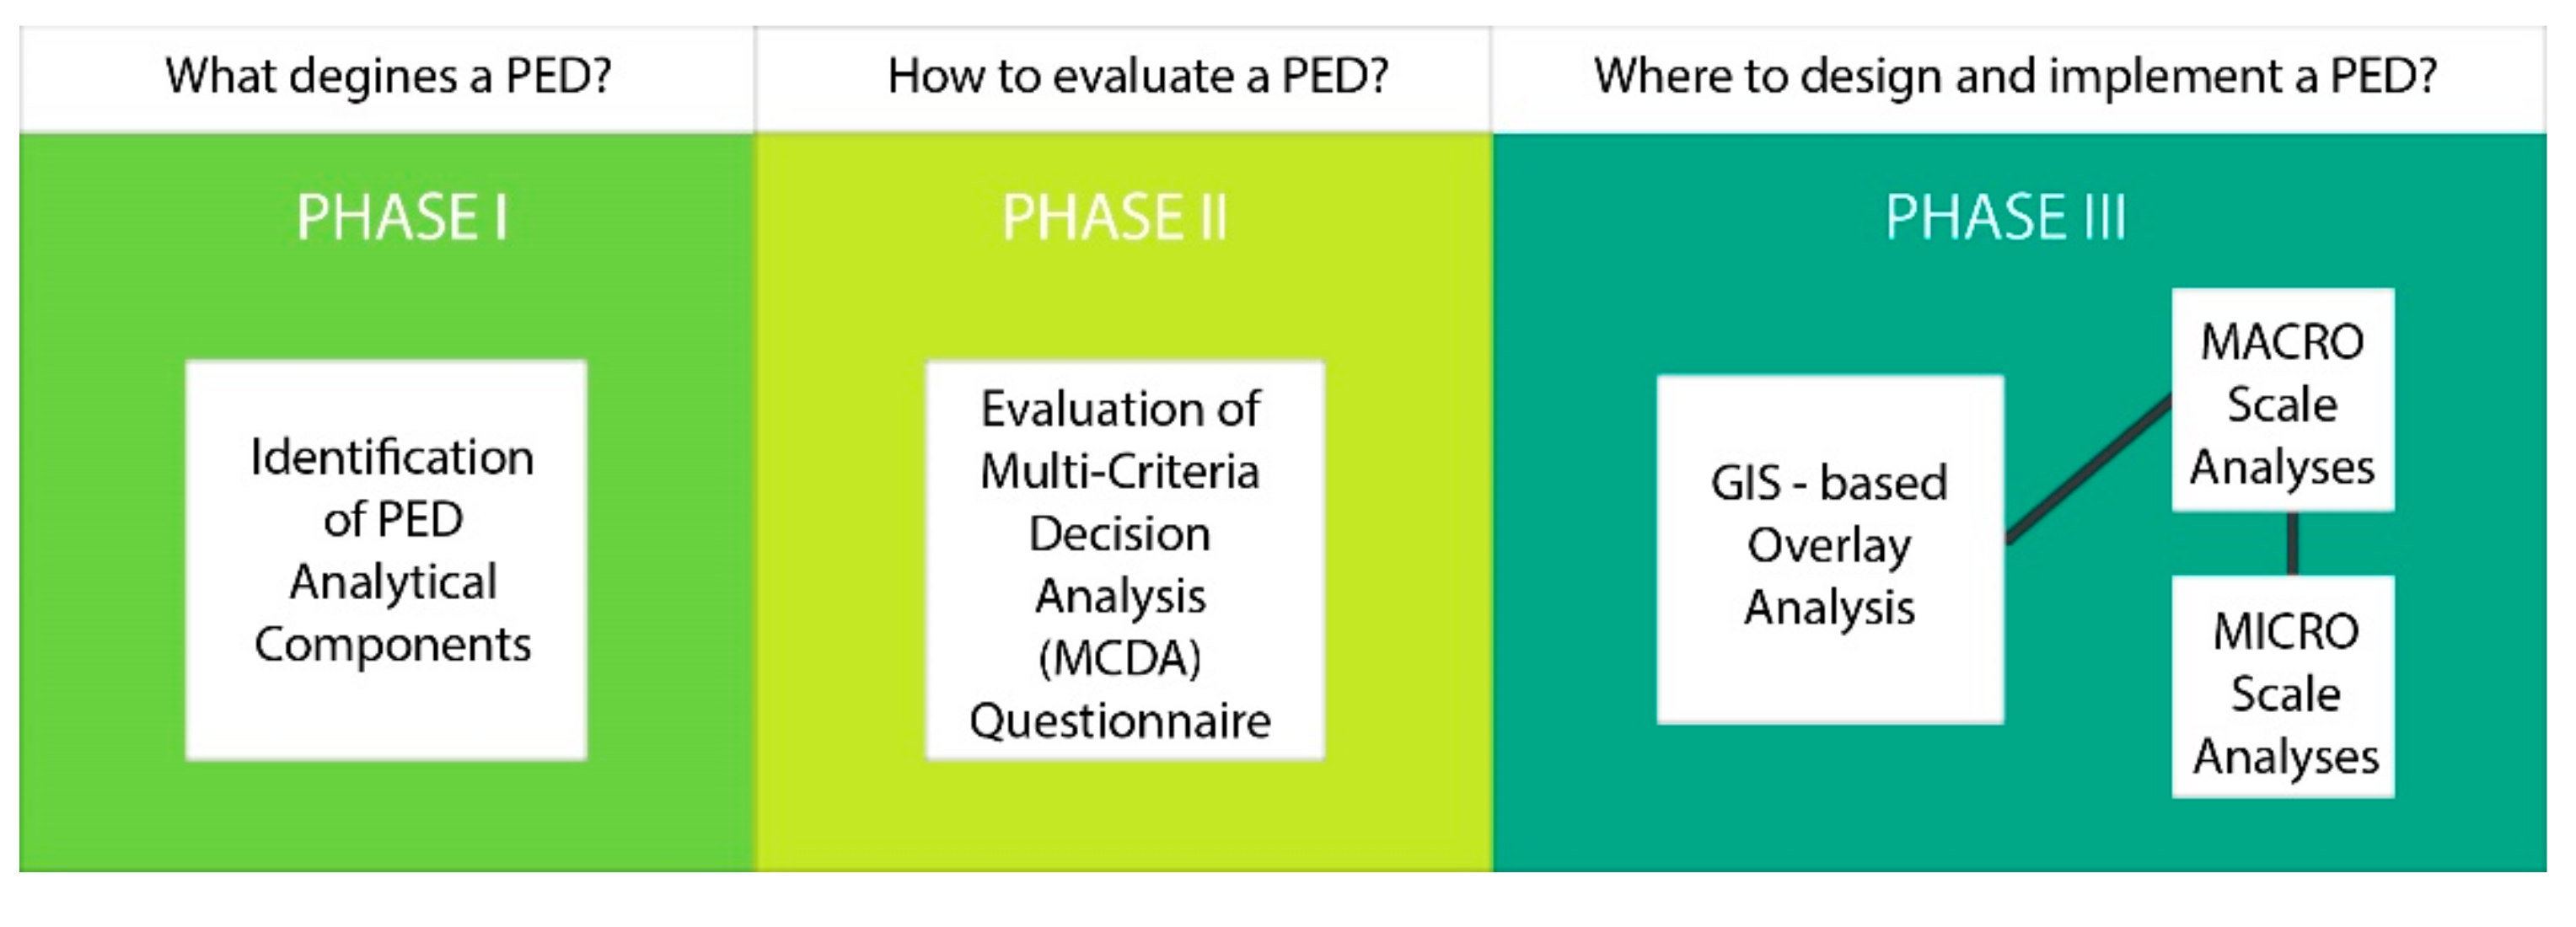
The methodology proposed in this paper for defining PED concept boundaries consists of three phases that synthesize the spatial information system of the cities together with technical, economic, social, environmental, political, and legal frameworks within their context. The phases of the methodology are summarized in Figure 1.

Figure 1.
Phases of methodology for identifying PED concept boundary in cities.
2.1. Phase I: Identification of PED Analytical Components (Critical Elements)
The First Phase is the identification of PED Analytical components that play a key role in the selection of peculiar and efficient PED concept boundary in cities. The challenge is that local energy production and distribution, connected with digitalization, have not previously been a part of the integrated urban planning and design approaches, while they have included many other environmental and social topics [22]. The proposed methodology for identifying PED concept boundaries in cities underlines energy sustainability in urban planning, land-use planning, and urban design, and therefore requires deep analysis at the city level, down to the neighborhood, district, and building levels. Harmonization of these diverse modes of spatial planning with energy planning is the main aspect of this methodology. Likewise, this methodology indicates that inclusiveness, co-creation, and participatory planning shall rule the energy transition. Inclusive cities are powerful by avoiding marginalization, which compromises the richness of interaction upon which cities depend [23].
The proposed methodology therefore demands extensive analyses on resources, urban planning, land-use planning, energy planning in physical and virtual infrastructure, and socio-economic and socio-cultural aspects. All the abovementioned aspects have been classified in the following six categories [22]:
- Resource analysis.
- Urban macro-form analysis.
- Land-use context.
- Energy infrastructure analysis.
- Energy services.
- Social structure.
Data regarding these six categories need to be collected in GIS-based spatial data, since the analyses that are going to be conducted will utilize overlay analyses within GIS-based software.
The first category is the resource availability in cities, consisting of solar, wind, earth, geothermal water, surface water, biomass, and waste heat potential. The resources, their spatial references, and detailed descriptions are displayed in Table 1.

Table 1.
Category 1: Resource availability.
The second category is related to the urban planning and strategies of the city, so-called “urban macroform”. This category gives detailed information derived from city plans and strategies. New development, retrofitting, infill, and re-use/transformation areas are sub-categories to be identified under this category and are described in Table 2.
Table 2.
Category 2: Urban macroform.
The third category is again related to the urban context of the city by the land-use coverings. Sub-categories are categorized as residential/mixed-use, commercial/industrial/office, active green/open parking lots, public administration, and social/cultural/educational/sport areas that are displayed in Table 3.
Table 3.
Category 3: Land-usage context.
The fourth category is the technical/physical infrastructure that analyzes the energy and e-mobility structure of the cities. Off-grid systems may also play an interesting role for selecting PED areas for their potential in energy flexibility and trading opportunities. For this reason, under this category, district heating, the power-heat network, and the e-mobility structure of the cities are considered (Table 4).
Table 4.
Category 4: Physical infrastructure.
The fifth category is the potential virtual infrastructure that the cities may test in terms of smart-grid applications. A few cities in Europe have already started testing virtual power plants and their effect on grids. The impact areas of micro-grid applications may have a key role for selecting PED areas (Table 5).
Table 5.
Category 5: Virtual infrastructure.
The last category is the social structure of the city represented by spatial information. The socio-economic, socio-cultural context of the city is targeted under this category. Human behavior in energy consumption and energy investment is analyzed and their spatial references are identified. More details on the description of the sub-categories may be found in Table 6.
Table 6.
Category 6: Social structure.
2.2. Phase II: Relevant Criteria to Be Considered for Components Evaluation by MCDA Quesitonnaire: City Characteristics and Priorities
The second phase is the generation of a Multi-Criteria Decision Analyses Questionnaire (MCDA) for supporting cities to evaluate the PED Components from political, economic, social, technical, environmental, and legal points of view.
A detailed MCDA questionnaire was prepared to gather information from the six categories that have been selected in the previous phase. The questionnaire had specific evaluation criteria for each of the sub-categories shown in Table 1, Table 2, Table 3, Table 4, Table 5 and Table 6, each covering economic, social, technical, environmental, and legal aspects. The MCDA questionnaire aims to guide cities in understanding the relevant spatial references that could define the suitability of an area to become positive and be able to provide an evaluation for each sub-category. The MCDA questionnaire plays an important role in the assessment in five different ways:
- It standardizes the application of the geoprocessing analysis. All the cities are studied with the same criteria. Different scores are given to each PED Analytical Component depending on the status of the city in each criterion. These characteristics of the questionnaire allow one to both standardize the method and adapt it to the city’s needs.
- It helps to select the PED Analytical Components to be considered in the assessment.
- It allows for obtaining reclassification scores for each Analytical Component through the consideration of all the criteria that are relevant. This also helps to consolidate the analysis and adapt it accordingly to the city’s state of play.
- It provides information for prioritization. Therefore, the weighting phase of the methodology is supported by the information provided by the MCDA questionnaire results.
- Going beyond the spatial analysis, it helps cities in identifying the strengths and weaknesses of the city in terms of suitability to become positive in the economic, social, technical, environmental, and legal framework. As it is shown in the results, the MCDA questionnaire is relevant for identifying, in a consensual way, issues that are of interest for the city, but the city has not identified yet and/or, in the opposite case, issues not suitable. For example, the legal framework could facilitate or obstruct the implementation of specific solutions that have potential depending on the city’s context.
To ensure that cities understand the various concepts and terminology used in the questionnaires, one-to-one discussion sessions were organized with city public officers and technicians. In each session, a specific category was analyzed following the process explained below for the second to seventh steps.
- First: Identify PED analytical components to be considered in the assessment and describe how each of them is going to be analyzed (Section 2.1).
- Second: Identify the criteria relevant for the PED analytical component in the evaluation, in terms of economic, social, technical, environmental, legal, and spatial, in order to assess the PED analytical components in a robust way.
- ○
- For example, in the case of existing solar energy investment zones, economic, technical, and spatial criteria were selected.
- Third: Establish the information that will allow for analyzing each of the selected criteria.
- ○
- Following the example, the size and solar potential of the solar energy investment zone were considered relevant for analyzing the spatial criteria.
- Fourth: Each of the criteria considered were divided in different possibilities and, according to the suitability of these possibilities, scores were given.
- ○
- Following the example, zones with high solar potential, higher than 20,000 m2, were considered the most suitable and, thus, maximum scores were given to this situation. Zones with high solar potential with a size between 10,000 and 20,000 m2 were also considered suitable but with lower scores than the previous situation.
- Fifth: The considered criteria were prioritized. GIS analysis established that the sum of the best possibilities of each criterion was 9. According to this, scores were di-vided between considered criteria.
- ○
- Following the example, the economic maximum criteria scored 3, technical scored 2, and spatial criteria scored 4a.
- Sixth: The restrictive criteria were identified. This means that if these possibilities are selected, the final score of the raster is determined only with this value.
- ○
- For example, for the spatial criteria of the * Existing solar energy investment zones, if the possibility “There are no zones that fulfil the previous criteria” is selected, meaning that there are no zones owned by the community or the public administration with higher than 10,000 m2 medium-high solar potential, this PED component no longer needs to be considered in the assessment.
- Seventh: Give extra points and/or minus points to some PED components in order to include criteria that were not considered in the previous options.
- ○
- For example, extra points will be given in the case that this possibility exists: “Surrounding the city there are zones owned by the community or the public administration with potential to become solar parks.” and minus points will be given in the case that this possibility exists: “ The most suitable zones for implementing solar energy are green areas”.
- ○
- Note that the extra point can nullify the restrictive criteria. For example, if the extra points possibility exists: “Surrounding the city there are zones owned by the community or the public administration with potential to become solar parks”, the restrictive criteria “ There are no zones that fulfil the previous criteria” related to the spatial availability of zones with medium-high solar potential, is nullified.
All of the PED Analytical Components (categorized under resource availability (RA), Urban Macroform (UM), Land use Context (LU), Technical–Physical infrastructure (TPI), Virtual Infrastructure (VI), and Social Structure (SS) are reviewed by technical experts in the consortium and their advice is taken into consideration while assessing the layers.
A summary of the criteria (economic, EC, social, SO, technical, TC, environmental, EN, legal, LE, spatial, SP) considered for each PED component is given below (Table 7, Table 8, Table 9, Table 10, Table 11 and Table 12).
Table 7.
Criteria considered for resource availability PED analytical components analysis.
Table 8.
Criteria considered for Urban Macroform PED analytical components analysis.
Table 9.
Criteria considered for Land Usage PED analytical components analysis.
Table 10.
Criteria considered for Technical–physical infrastructure PED analytical components analysis.
Table 11.
Criteria considered for Virtual infrastructure PED analytical components analysis.
Table 12.
Criteria considered for Social PED analytical components analysis.
This multi-criteria, multi-actor evaluation process is conducted as a parallel analysis to the collection and evaluation of GIS-based data. As it was mentioned before, the results from the questionnaire were used for GIS layers’ identification, reclassification, and prioritization purposes.
2.3. Phase III: GIS-Based Overlay Analysis
Formerly, an overlay analysis (consisting of geoprocessing steps for ARCGIS and QGIS software) is conducted with the help of the results of the MCDA Questionnaire, and the results are displayed at the macro and, in a more detailed approach, micro scales. In the macro-scale analysis, all data are gathered at the zoning/island scale. No building-scale data are integrated in the analysis. A geoprocessing analysis will be conducted in order to realize the spatial weighted overlay and prioritize potential areas to be PEDs. At the end of this phase, two to three potential zones will be further selected to go on with micro-scale analysis in order to define the PED boundary.
Throughout the whole process, the harmonization of urban planning and energy planning is targeted.
Overlay analysis is a group of methodologies applied in optimal site selection or suitability modelling. It is a technique for applying a common scale of values to diverse and dissimilar inputs to create an integrated analysis. Spatial-based overlay analysis often requires the analysis of many different factors [24].
- Geoprocessing Analysis: Collected city data, at the macro scale, need to be organized. Values in each layer are adjusted according to PED Analytical Components criteria. If the layers are in vector format, the layers need to be converted into raster format since overlay analysis and all of its steps work with raster layers that have integer values (Step 1). Afterwards, reclassification of all input layers will be conducted to manage layers in the accepted format (integer values) (Step 2). Finally, all raster layers will be ready to utilize weighted overlay analysis tool in order to conduct a Suitability analysis in the GIS-based process to determine the appropriateness of a PED boundary. Detailed information regarding the steps of geoprocessing analysis may be found in the Advanced GIS Spatial Analysis and Modeling Tools ArcGIS Spatial Analyst [25]. The process is detailed in five steps.
- Step 1. Conversion to rastersWeighted Overlay analyses only allow integer rasters as input, such as a raster of land usage or soil types for the geomorphological structure.Generally, the values of continuous rasters are grouped into ranges that must be allocated with a single value before Step 2.
- Step 2. Raster ReclassificationFollowing the conversion to rasters, the Reclassify tool must be utilized for reclassifying the generated rasters. The reclassification tools reclassify or change cell values to alternative values using a variety of methods. Values or a group of values inside a layer are reclassified according to importance, interest, or similarities as in specified intervals.
As an example, the values inside a layer (regarding one PED analytical component) e.g., Land-usage, could be residential/mixed use/commercial. The importance of land-usage regarding PED implementations depends heavily on the political and economic context. If the city has incentives or legislations for retrofitting the existing residential use in the city, then residential group values would receive the highest value.
According to the Methodology for PED Concept Boundary Identification, the reclassification step is guided by technical expertise from MAKING-CITY partners on specific knowledge and experiences from LHCs’ PED designs and implementations. All of the PED Analytical Components (categorized under resource availability (RA), Urban Macroform (UM), Land use Context (LU), Technical and Physical Infrastructure (TPI), Virtual Infrastructure (VI), and Social Structure (SS) are reviewed by technical experts in the consortium and their advice is taken into consideration while assessing the layers.
Regarding technical comments, for each PED analytical component, a buffer zone for the impact area (if the layer is gathered as “point feature” in GIS format) is generated depending on the existing regulations, conducted studies on economic feasibility, promoted subsidies, or incentives available in each city context. The relation between spatial information and technical, political, economic, and social points of view is targeted to achieve more suitable results.
Since the GIS background and infrastructure of cities vary highly from each other (especially on the clarity of data and values indicated inside each layer (matching the PED analytical components), the reclassification methodology aims to be validated in a comprehensive and holistic approach.
- Step 3. Select an evaluation scaleThe evaluation scale (Table 13) represents the range of suitability; the highest values show one extreme of suitability whereas the lowest values represent the lowest suitability. The input rasters are reclassified as a common measurement scale utilizing the Reclassification tool. An evaluation scale from 1 to 9 is chosen for the current research.
Table 13. Evaluation scale variations.
- Step 4. Set scale valuesThe cell values for each input raster in the analysis are assigned values from the evaluation scale. According to the potential of suitability, the default values allocated to each cell may be changed.
- Step 5. Assign weights to input rastersAs the last step, after setting scale values, a percentage influence is assigned to each input raster, based on its importance and effect on suitability. The total influence for all rasters must equal 100%. The criteria considered more important than other criteria are weighted, and some criteria may have equal importance in terms of creation potential for PED implementation.Weights of each macro/micro-scale inputs (PED analytical components water resources, geomorphological structure, land use, buildings, etc.) are determined by considering local/regional/national contexts such as laws and regulations, technical and technological aspects, etc., derived from MCDA.Overlapping all Layers: Overlapping all layers refers to Step 3, Step 4, and Step 5 of the geoprocessing process. Regarding the methodology for PED concept boundary identification, the overlay analysis is conducted via setting score values (remap values) for each PED Analytical component with the help of the MCDA Questionnaire completed by the city. As explained in Section 2.2, the MCDA Questionnaire provides the opportunity for cities to understand and evaluate the PED Analytical components from economic, social, environmental, legal, and political points of view. The scores assigned to each layer are transferred to the remap table in the weighted overlay analysis. The influence tables that provides the rasters (all PED Components) can be evaluated and compared with each other by assigning the importance of shares in terms of %, according to the total sum of remapped values and calculated ratios of each layer.
- Step 6. Run the Overlay ToolAs a result, the layers are combined and the overlay layer is obtained. Modifying the suitability values or the influence percentages will produce different results for the output suitability raster.
3. Case Studies
3.1. Case Studies Presentation
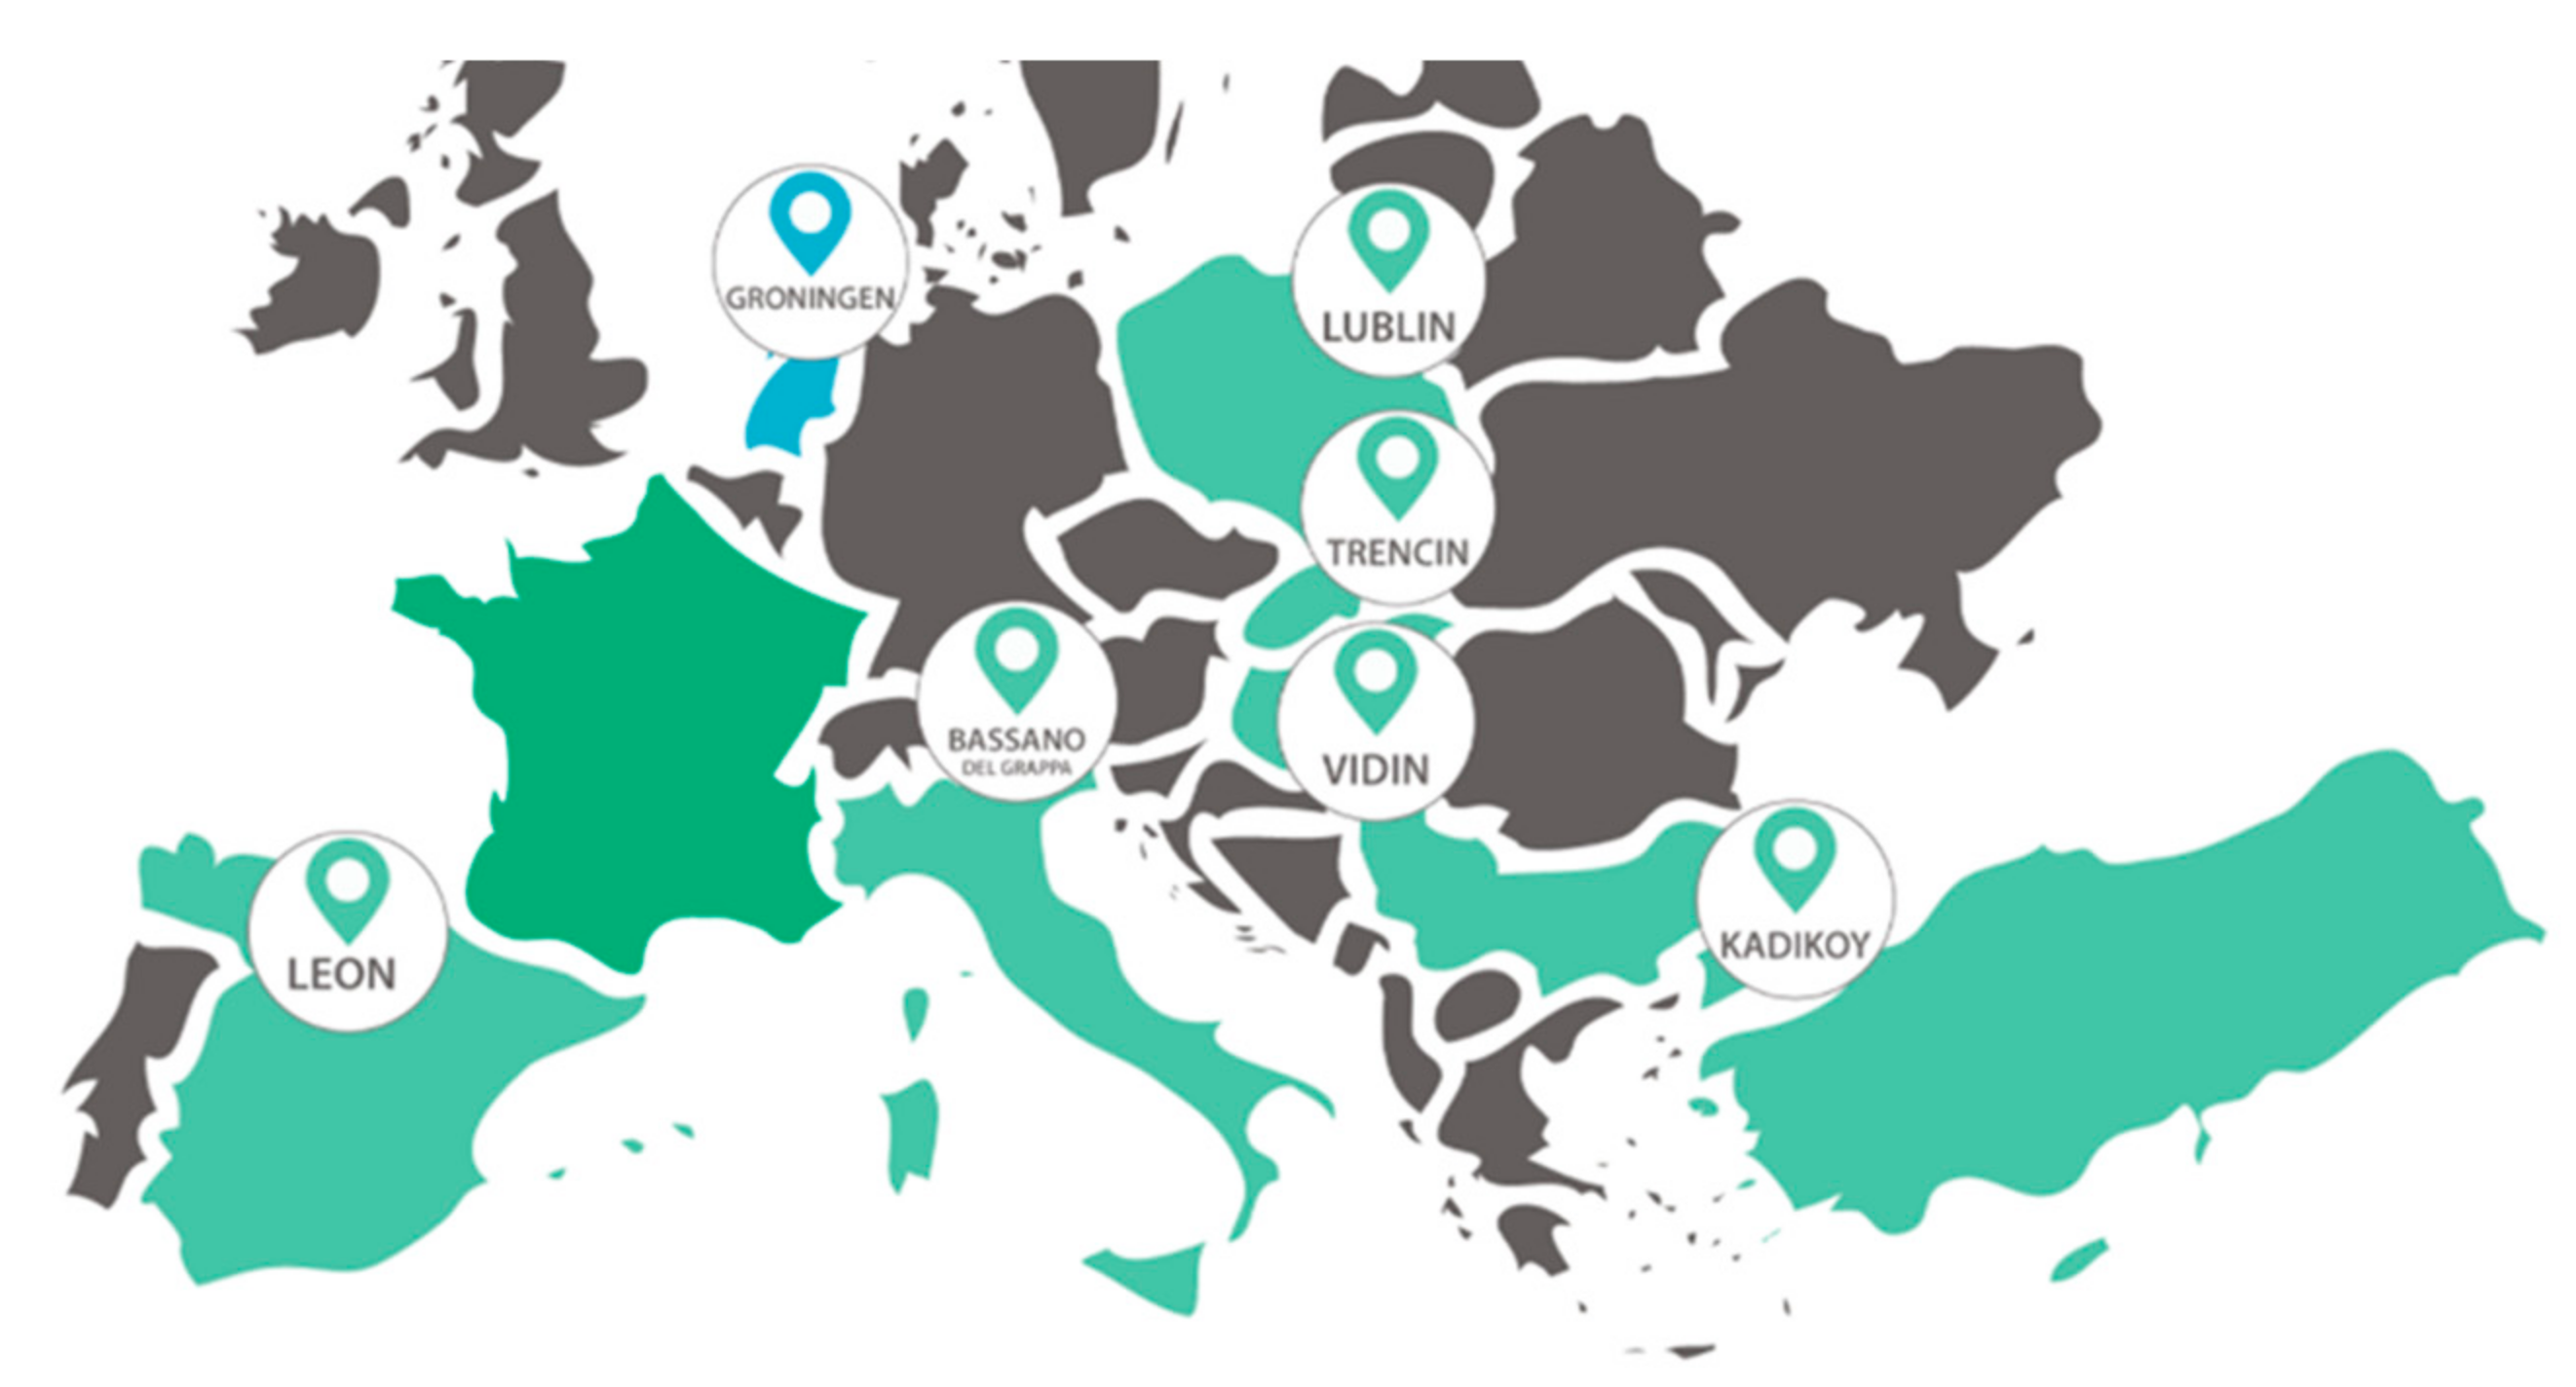
The methodology defined to select the areas to reach an annual positive non-renewable energy balance has been tested in six European cities: Bassano del Grappa (Italy), Kadiköy (Turkey), León (Spain), Lublin (Poland), Trenčín (Slovakia), and Vidin (Bulgaria) (Figure 2) [26].
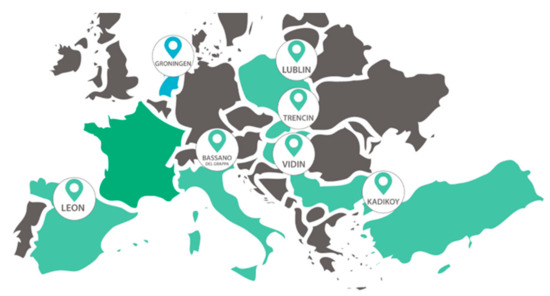
Figure 2.
MAKING-CITY Project—follower cities.
Cities’ main characteristics, primary energy sources currently used, and renewable resources are summarized in Table 14, Table 15 and Table 16, respectively. The information reflects the European representativeness of the cities selected for the assessment.
Table 14.
Main characteristics of the cities.
Table 15.
Primary energy sources of the cities.
Table 16.
Main characteristics of the renewable sources of the cities.
3.2. MCDA Questionnaire Results: GIS Layers Selection and Prioritization
Macro-scale analysis was conducted, which requires GIS-based city context data on resource availability, urban macroform, land usage, energy and e-mobility structure, energy service availability, and social structure of the city.
The results from the MCDA questionnaire were used for GIS layer identification, reclassification, and prioritization purposes. Results are shown in Table 17.
Table 17.
Selected GIS layers and prioritization values considered in the analysis of each city.
3.3. Weighted Overlay Result: Cities Candidate Areas to Become Positive
The last step in the identification of the candidate areas to become positive, consisted of an overlay analysis of the GIS layers included in Table 17 and supported in GIS software. The influence values that are presented in Table 17 are also supported by the reclassification and remap values that are obtained from the outcome of the MCDA Questionnaire. The collaborative work that is conducted with the municipality provided integration of qualitative and quantitative approaches for identifying PED Boundaries in six EU cities. The results of the most to least suitable areas are presented in Figure 3.
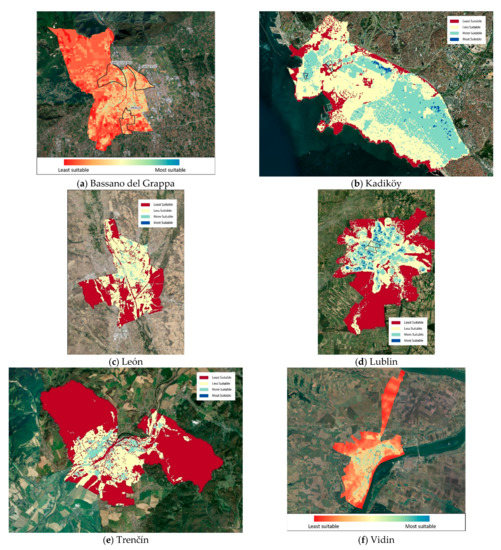
Figure 3.
Weighted overlay result for cities displaying suitable areas for PED implementations. (a) Bassano del Grappa most to least suitable areas; (b) Kadikoy most to least suitable areas; (c) León most to least suitable areas; (d) Lublin most to least suitable areas; (e) Trenčín most to least suitable areas; (f) Vidin most to least suitable areas.
The exact size of the areas to be selected to become energy positive does not necessarily coincide with the official limits of the existing district.
Before the analysis, municipality representatives of each city preselected districts of interest to become positive. The criteria followed to make this selection was variable from city to city since the PED concept was not defined properly at that time. For example, Vidin selected two districts, Bononia and Himik, that have a concentration of both public buildings (mainly schools and kindergartens) and residential buildings, while Leon selected a degraded area that needs strong investment. Figure 4 provides details of Vidin’s preselected districts by municipality overlayed with the results of candidate areas according to the Multicriteria and GIS analysis.
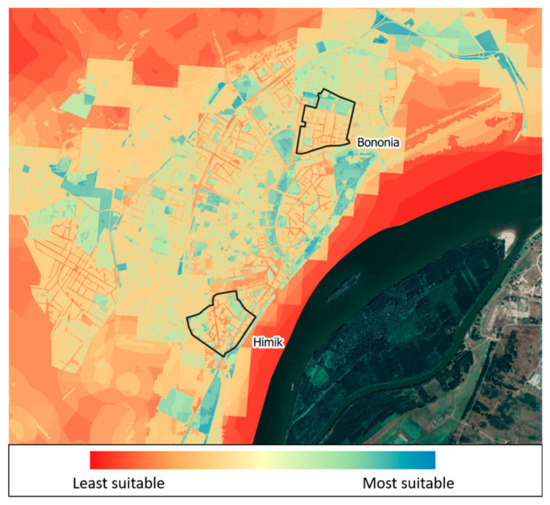
Figure 4.
Vidin preselected and candidate areas to become positive.
All other results of weighted overlay analyses presented with the preselected PED areas are detailed in Appendix A.
4. Discussion and Future Developments
Based on the experience with the cities that participated in this research, the multicriteria questionnaire ensures consideration of all the relevant criteria that can affect the correct implementation of a PED. Therefore, it allows the consideration of not only the renewable resource potential of a specific location, but also the economic opportunities, the legal framework in terms of enablers and barriers, the social context, and, of course, the existing and future modifications of the urban spatial form and planning, and the existence of or interest in creating infrastructure that can support the conversion to positive energy. Environmental issues are also considered, providing a deep overview of the whole city context. However, the criteria considered must be continuously updated in order to include the latest technological developments.
The proposed methodology develops a process for PED selection, which is also flexible enough to be adapted to each city’s context in the sense that different choices can be made regarding each criterion. In the process of fulfilling the questionnaire in meetings with experts from the cities, it was well understood what was considered the “most suitable” situation and the status of the city in each of the criteria. Therefore, follower cities that participated in the process see themselves well-reflected in the results. On the other hand, it is recommended to fulfill the questionnaire with experts from different knowledge and experience backgrounds.
Regarding the overlay results, it must be noted that the maximum value obtained as a result of the overlay depends on the number of layers considered. In other words, introducing more spatial components makes it more difficult to reach the most suitable circumstances. This does not necessarily mean that the city has less areas with potential to become PED, but a more detailed analysis of the results will be needed to properly understand which criteria and/or combination of criteria affect the results and whether they are relevant for the assessment. For example, it could be more interesting to focus on several technologies and the renewable resources that support them than in trying to find a place with high potential in all resources.
It must be noted that in some cases, the connection between the multicriteria questionnaire and the GIS was challenging, and some criteria could not be included in the overlay analysis, resulting in the analysis being incomplete. The best example is the social criteria. In this sense, cities were not able to provide information about population projections per zone or even about the existing and/or potential energy communities. Therefore, including this information will enrich the assessment and the results will be more accurate.
With respect to the potentiality of GIS software, this research may also be further developed by the utilization of innovative tools regarding a diverse set of calculation optimization. Identified boundaries may also be enriched through the generation of digital twins by integrating BIM-based building models into the GIS-identified area.
5. Conclusions
The methodology developed for macro-scale analysis in cities to identify zones with the potential to become energy positive combines both the potential of multi-criteria analysis and the overlay analysis of GIS software. This combination provides a robust assessment and very visual results that can be easily understood at a quick glance. The process is conducted by active participation of the city representatives, both at data collection and evaluation phases, thus it is very participative and co-creative.
Results presented in this article provide a prioritization of the areas from the six European representative cities with the highest potential to become energy positive. The MCDA questionnaire helped the municipalities to identify critical criteria that affects both the cities (set city background) and the areas with potential to become positive (drivers and barriers to the implementation). The involvement of municipality representatives in several iterations of the process was indispensable to ensure correct implementation and for understanding of the results. This was considered critical considering that the municipalities made a preselection of districts before the assessment. The visualization of the results in GIS format was very positively received and allowed for accurate comprehension of the obtained results.
Results given in this article will guide the definition of PED boundaries in which micro-analysis will be the focus. Thanks to the PED Analytical components analysis, the first approach to understand the solutions suitable for the conversion of selected areas into a PED is also examined. Following this paper, further research will be conducted for micro-scale analyses and the outcomes will pursue a technology selection process.
Author Contributions
Conceptualization, B.A. and A.L.R.; methodology, B.A., A.L.R., P.H. and O.T.; software, O.T. and N.H.M.; validation, B.A.; formal analysis B.A., A.L.R. and P.H.; investigation, B.A. and A.L.R.; resources, B.A., A.L.R., and the cities Bassano del Grappa (Italy), Kadikoy (Turkey), León (Spain), Lublin (Poland), Trenčín (Slovakia), and Vidin (Bulgaria); data curation, O.T. and N.H.M.; writing—original draft preparation, B.A. and A.L.R.; writing—review and editing, B.A. and A.L.R.; visualization, O.T. and N.H.M.; supervision, B.A.; project administration, B.A.; funding acquisition, P.H. All authors have read and agreed to the published version of the manuscript.
Funding
This research was funded by the EU H2020 Programme under grant agreement n°824418.
Institutional Review Board Statement
Not applicable.
Informed Consent Statement
Not applicable.
Data Availability Statement
Not applicable.
Acknowledgments
Authors acknowledge the support provided by the city representatives of Bassano del Grappa (Italy), Kadikoy (Turkey), León (Spain), Lublin (Poland), Trenčín (Slovakia), and Vidin (Bulgaria) for sharing city GIS data for the analyses. The authors also acknowledge the funding received from the European Union’s Horizon 2020 research and innovation programme under the MAKING-CITY project agreement No 824418.
Conflicts of Interest
The authors declare no conflict of interest.
Appendix A. Candidate Areas to become Positive
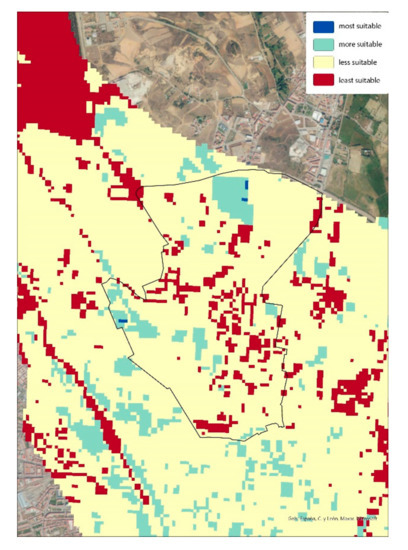
Figure A1.
Leon’s preselected and candidate areas to become positive.
Figure A1.
Leon’s preselected and candidate areas to become positive.
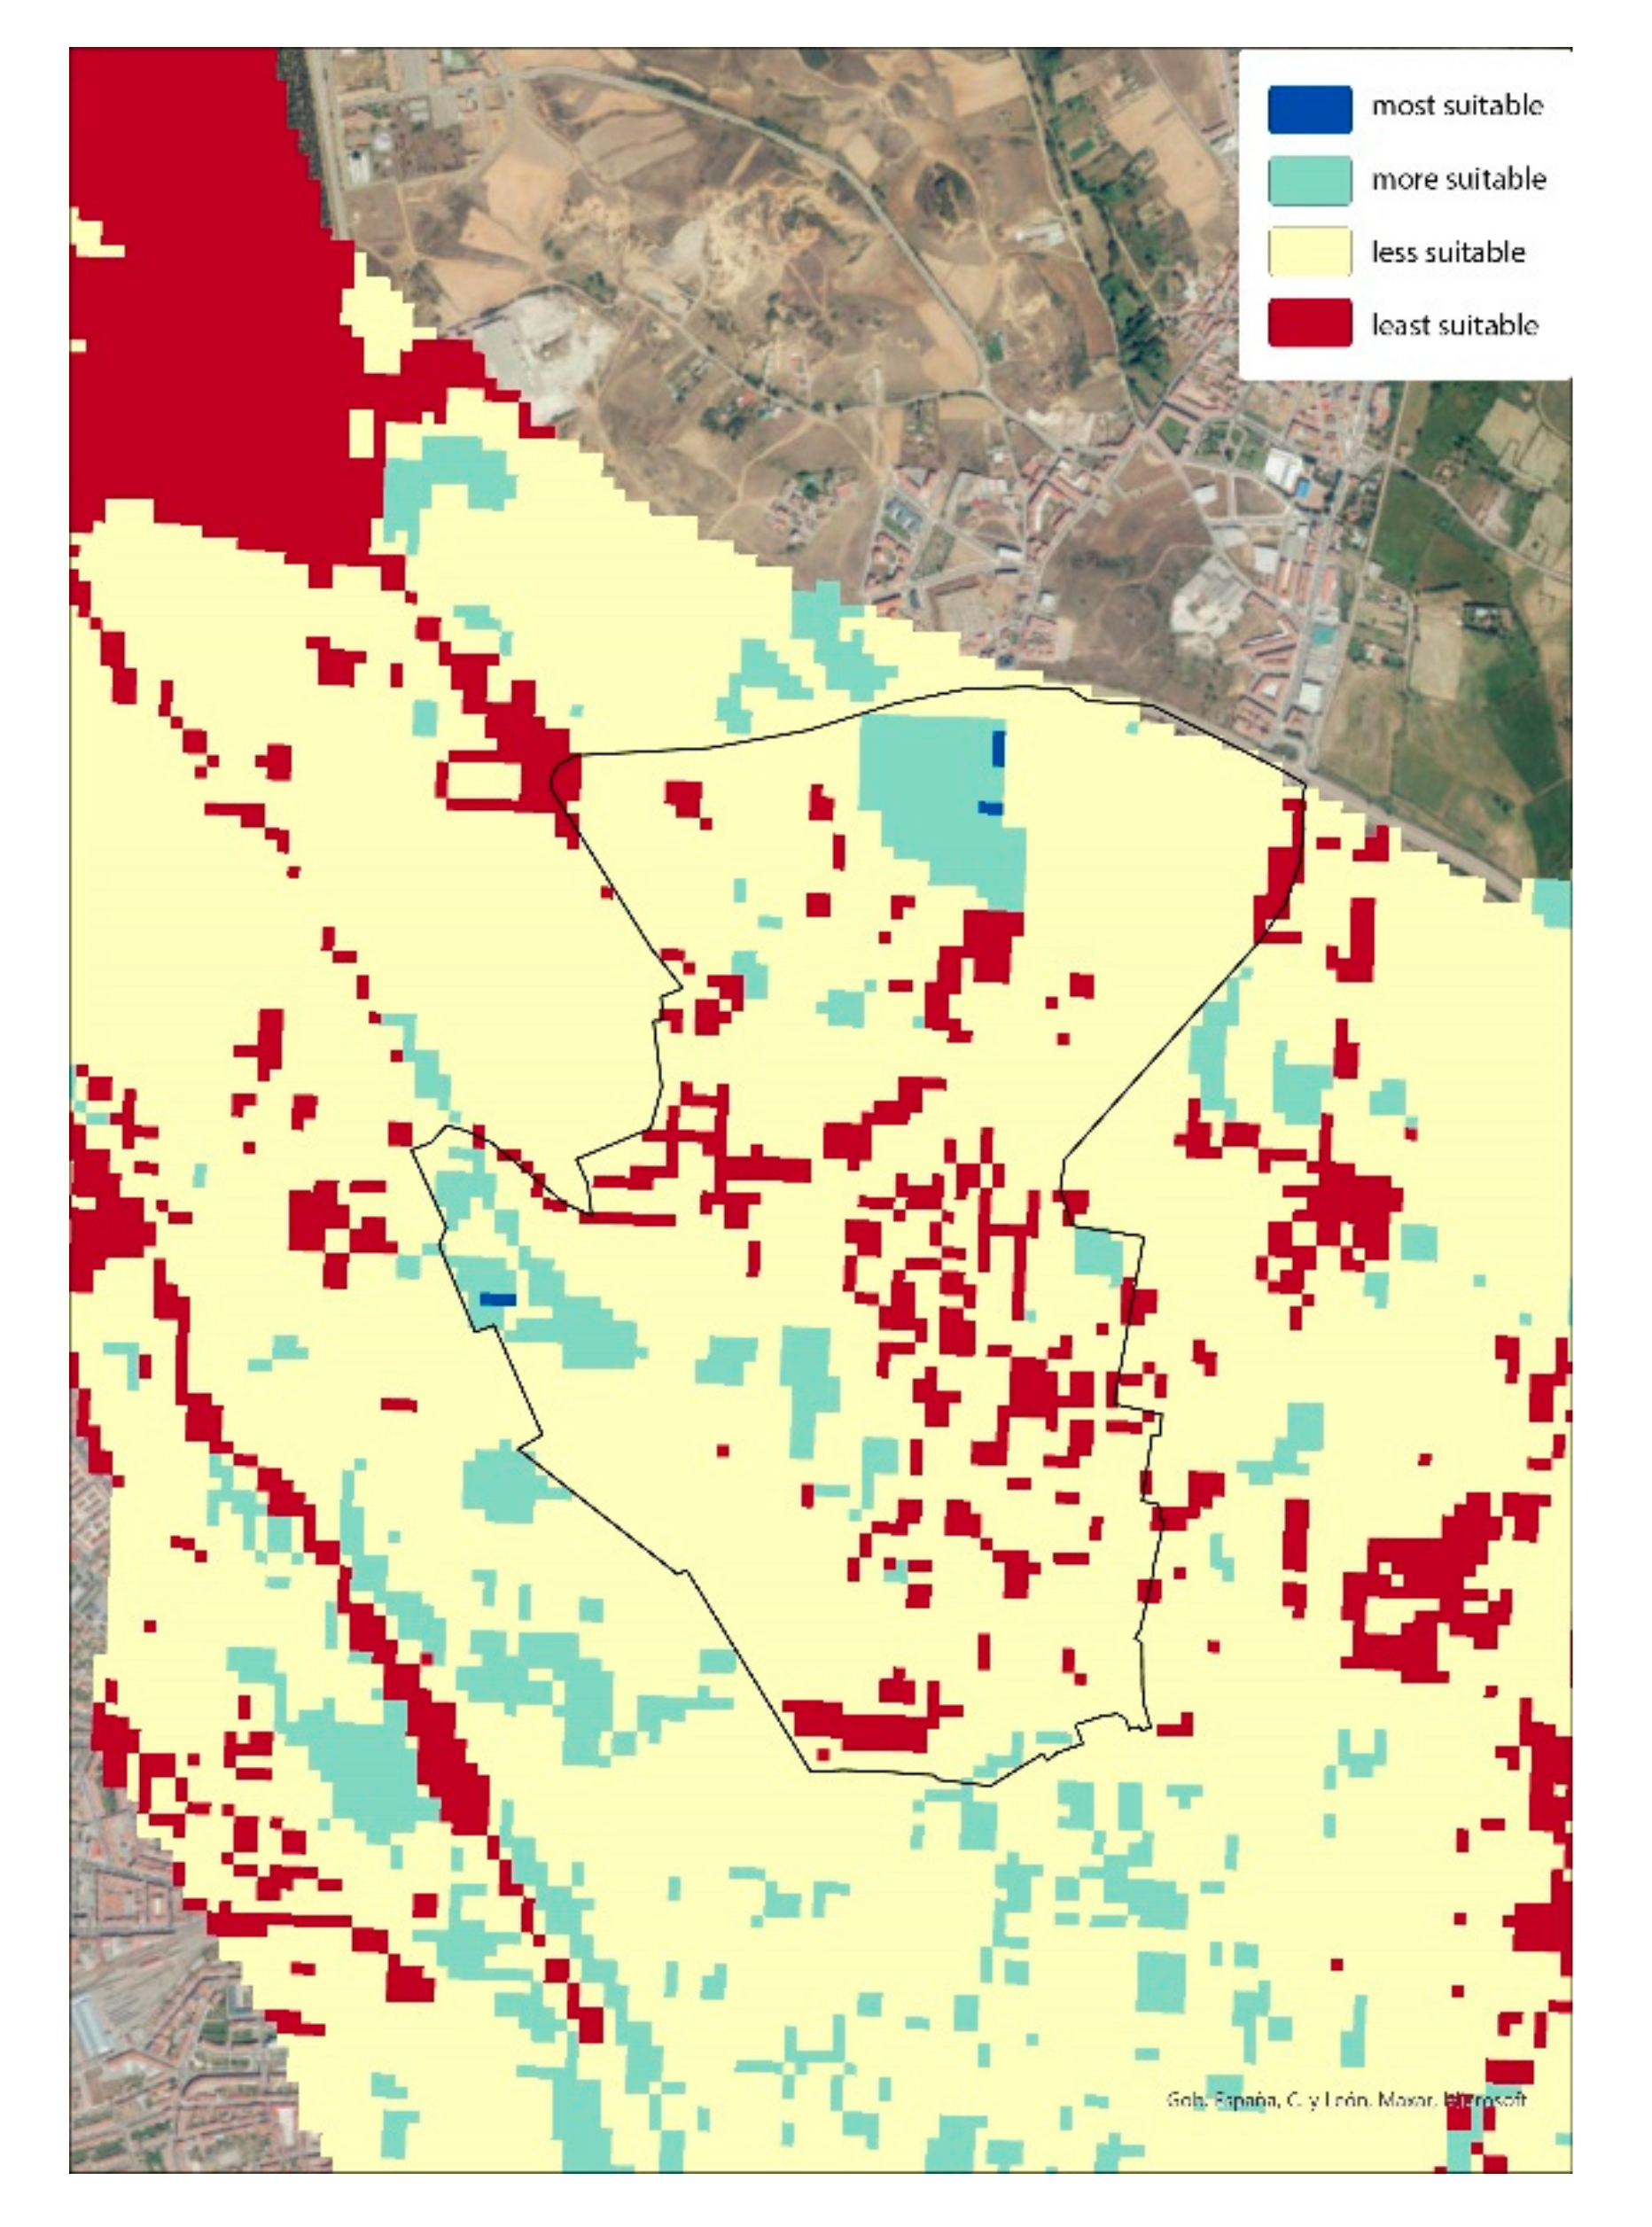

Figure A2.
Kadikoy’s preselected and candidate areas to become positive.
Figure A2.
Kadikoy’s preselected and candidate areas to become positive.
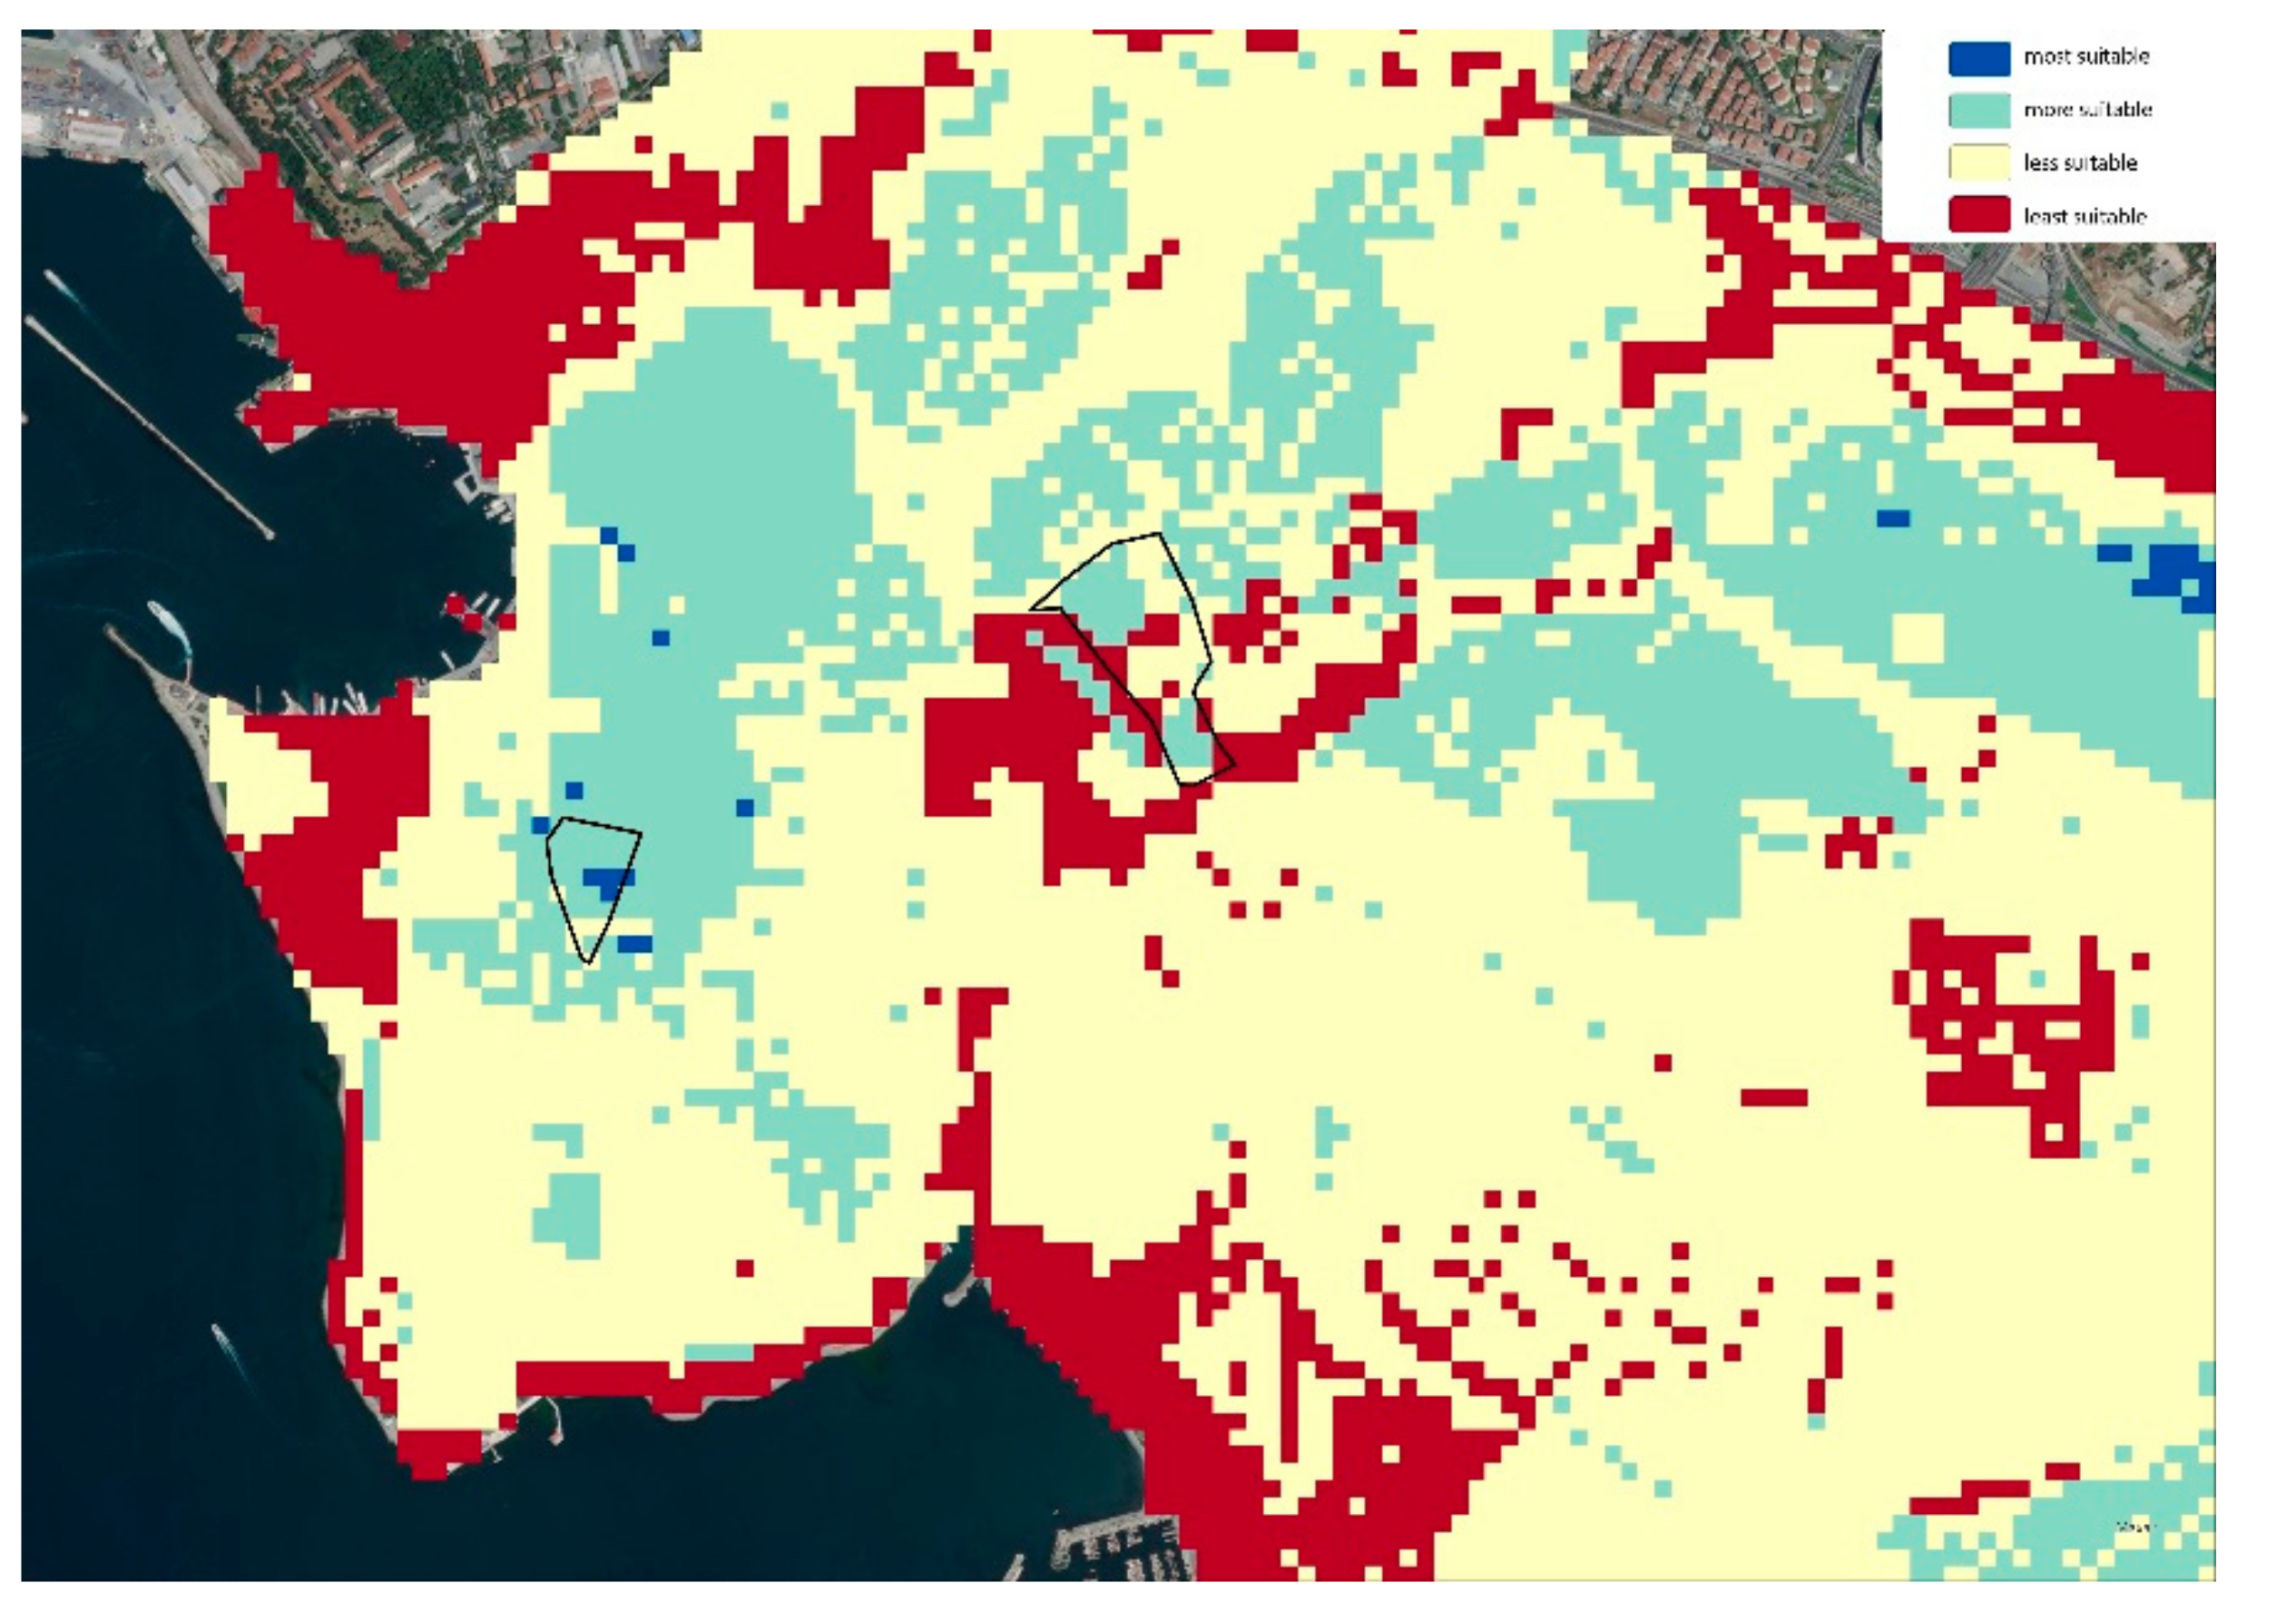
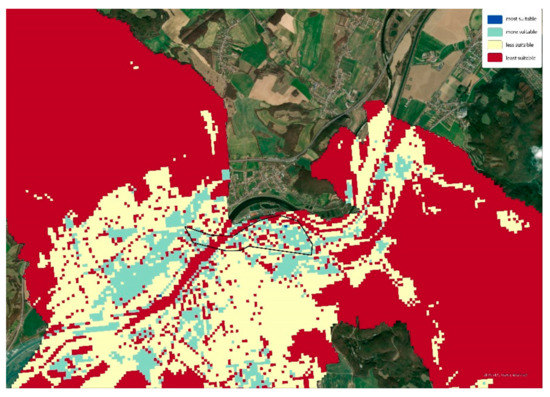
Figure A3.
Trencin’s preselected and candidate areas to become positive.
Figure A3.
Trencin’s preselected and candidate areas to become positive.

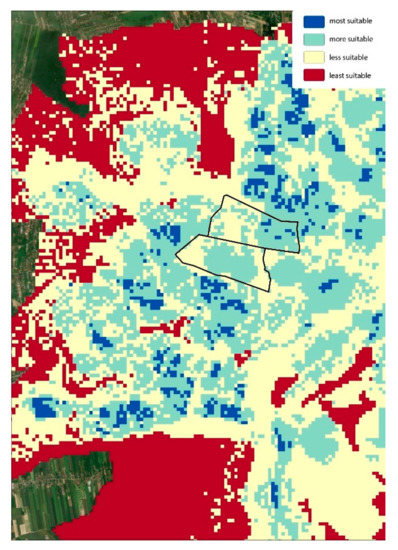
Figure A4.
Lublin’s preselected and candidate areas to become positive.
Figure A4.
Lublin’s preselected and candidate areas to become positive.

References
- Directive 2010/31/EU of the European Parliament and of the Council of 19 May 2010 on the Energy Performance of Buildings. Available online: https://eur-lex.europa.eu/legal-content/EN/TXT/HTML/?uri=CELEX:32010L0031&from=EN (accessed on 28 June 2021).
- SET-Plan Temporary Working Group 3.2. SET-Plan ACTION No.3.2 Implementation Plan: Europe to Become a Global Role Model in Integrated, Innovative Solutions for the Planning, Deployment, and Replication of Positive Energy Districts (June 2018). Available online: https://setis.ec.europa.eu/system/files/setplan_smartcities_implementationplan.pdf (accessed on 28 June 2021).
- Vandevyvere, H.; Ahlers, D.; Alpagut, B.; Cerna, V.; Cimini, V.; Haxhija, S.; Struiving, E. Positive Energy Districts Solution Booklet; European Union: Maastricht, The Netherlands, 2020. [Google Scholar]
- MAKING-CITY (The MAKING-CITY Project Received Funding from the H2020 Programme under Grant Agreement No 824418). Available online: https://makingcity.eu/ (accessed on 31 July 2021).
- POCITYF (This Project has Received Funding from the European Union’s Horizon 2020 Research and Innovation Programme under Grant Agreement No 864400). Available online: https://pocityf.eu/ (accessed on 31 July 2021).
- ATELIER (This Project has Received Funding from the European Union’s Horizon 2020 Research and Innovation Programme under Grant Agreement No 864374). Available online: https://smartcity-atelier.eu/ (accessed on 31 July 2021).
- +CityxChange (This Project has Received Funding from the European Union’s Horizon 2020 Research and Innovation Programme under Grant Agreement No 824260). Available online: https://cityxchange.eu/ (accessed on 31 July 2021).
- SPARCs (This Project has Received Funding from the European Union’s Horizon 2020 Research and Innovation Programme under Grant Agreement No 864242). Available online: https://www.sparcs.info/ (accessed on 31 July 2021).
- RESPONSE (This Project has Received Funding from the European Union’s Horizon 2020 Research and Innovation Programme under Grant Agreement No 957751). Available online: https://h2020response.eu/ (accessed on 31 July 2021).
- Girardin, L. A GIS-Based Methodology for the Evaluation of Integrated Energy Systems in Urban Area; EPFL: Lausanme, Switzerland, 2012; p. 218. [Google Scholar] [CrossRef]
- Höhn, J.; Lehtonen, E.; Rasi, S.; Rintala, J. A Geographical Information System (GIS) based methodology for determination of potential biomasses and sites for biogas plants in southern Finland. Appl. Energy 2014, 113, 1–10. [Google Scholar] [CrossRef]
- Díaz-Cuevas, P. GIS-based methodology for evaluating the wind-energy potential of territories: A case study from Andalusia (Spain). Energies 2018, 11, 2789. [Google Scholar] [CrossRef] [Green Version]
- Mentis, D.; Welsch, M.; Nerini, F.F.; Broad, O.; Howells, M.; Bazilian, M.; Rogner, H. A GIS-based approach for electrification planning—A case study on Nigeria. Energy Sustain. Dev. 2015, 29, 142–150. [Google Scholar] [CrossRef]
- Gaspari, J.; De Giglio, M.; Antonini, E.; Vodola, V. A GIS-Based Methodology for Speedy Energy Efficiency Mapping: A Case Study in Bologna. Energies 2020, 13, 2230. [Google Scholar] [CrossRef]
- Lucchi, E.; D’Alonzo, V.; Exner, D.; Zambelli, P.; Garegnani, G. A density-based spatial cluster analysis supporting the Building Stock Analysis in Historical Towns. In Proceedings of the Building Simulation, Rome, Italy, 2–4 September 2019. [Google Scholar]
- Gabaldón Moreno, A.; Vélez, F.; Alpagut, B.; Hernández, P.; Sanz Montalvillo, C. How to Achieve Positive Energy Districts for Sustainable Cities: A Proposed Calculation Methodology. Sustainability 2021, 13, 710. [Google Scholar] [CrossRef]
- Alpagut, B.; Akyürek, Ö.; Mitre, E.M. Positive energy districts methodology and its replication potential. Multidiscip. Digit. Publ. Inst. Proc. 2019, 20, 8. [Google Scholar] [CrossRef] [Green Version]
- Ryan, S.; Nimick, E. Multi-Criteria Decision Analysis and GIS. 2019. Available online: https://storymaps.arcgis.com/stories/b60b7399f6944bca86d1be6616c178cf (accessed on 15 June 2021).
- Akbari, V.; Rajabi, M.A.; Chavoshi, S.H.; Shams, R. Landfill site selection by combining GIS and fuzzy multi criteria decision analysis, case study: Bandar Abbas, Iran. World Appl. Sci. J. 2008, 3, 39–47. [Google Scholar]
- Kritikos, T.R.; Davies, T.R. GIS-based multi-criteria decision analysis for landslide susceptibility mapping at northern Evia, Greece. Z. der Dtsch. Ges. für Geowiss. 2011, 4, 421–434. [Google Scholar] [CrossRef]
- Çetinkaya, C.; Kabak, M.; Erbaş, M.; Özceylan, E. Evaluation of ecotourism sites: A GIS-based multi-criteria decision analysis. Kybernetes 2018, 47, 1664–1686. [Google Scholar] [CrossRef]
- Alpagut, B.; Montalvillo, C.; Vélez Jaramillo, F.; Hernandez Iñarra, P.; Brouwer, J.; Hirvonen-Kantola, S.; Kosunen, H.; Hermoso Martinez, N.; Ahokangas, P.; Rinne, S.; et al. MAKING-CITY D4.1—Methodology and Guidelines for PED Design; MAKING-CITY Project Report, Grant Agreement No 824418, Submitted to the European Commission; 2019. Available online: https://makingcity.eu/results/#1551708358627-aefa76ef-66b2 (accessed on 17 September 2021).
- What Is An Inclusive City? Available online: http://www.inclusiveurbanism.org/ (accessed on 28 January 2021).
- Understanding Overlay Analyses. Available online: https://pro.arcgis.com/en/pro-app/latest/tool-reference/spatial-analyst/understanding-overlay-analysis.htm#:~:text=Overlay%20analysis%20is%20a%20group,locations%20for%20a%20specific%20phenomenon (accessed on 28 January 2021).
- Kahraman, S.; Unsal, O. ArcGIS Spatial Analyst Handbook; Esri: Redlands, CA, USA, 2014. [Google Scholar]
- Hermoso, N.; Hernández, P.; Fernández, N.; López, A.; Alpagut, B.; Tabanoğlu, O.; Akgul, G. Making-City D4.3—Analysis of FWC Candidate Areas to Become a PED; Making City Project Report, Grant Agreement No. 824418. European Commission Submitted to the European Commission. , 2020. under review. Available online: https://makingcity.eu/results/#1551708358627-aefa76ef-66b2 (accessed on 17 September 2021).


Publisher’s Note: MDPI stays neutral with regard to jurisdictional claims in published maps and institutional affiliations. |
© 2021 by the authors. Licensee MDPI, Basel, Switzerland. This article is an open access article distributed under the terms and conditions of the Creative Commons Attribution (CC BY) license (https://creativecommons.org/licenses/by/4.0/).