
The Way of Usage and Location in a Big City Agglomeration as Impact Factors of the Nurseries Indoor Air Quality

 ,
,  ,
,  ,
,
Abstract
:1. Introduction
1.1. Outdoor Air Quality
1.2. Indoor Air Quality (IAQ) vs. Outdoor Air Quality (OAQ)
1.3. Research Goal
- Can proper indoor air quality be ensured by airing the rooms?
- Is there a correlation between indoor and outdoor PM concentration and is it seasonal?
- Is there a correlation between seasonal traffic and indoor air quality?
2. Materials and Methods
2.1. Characteristics of the Analyzed Research Objects
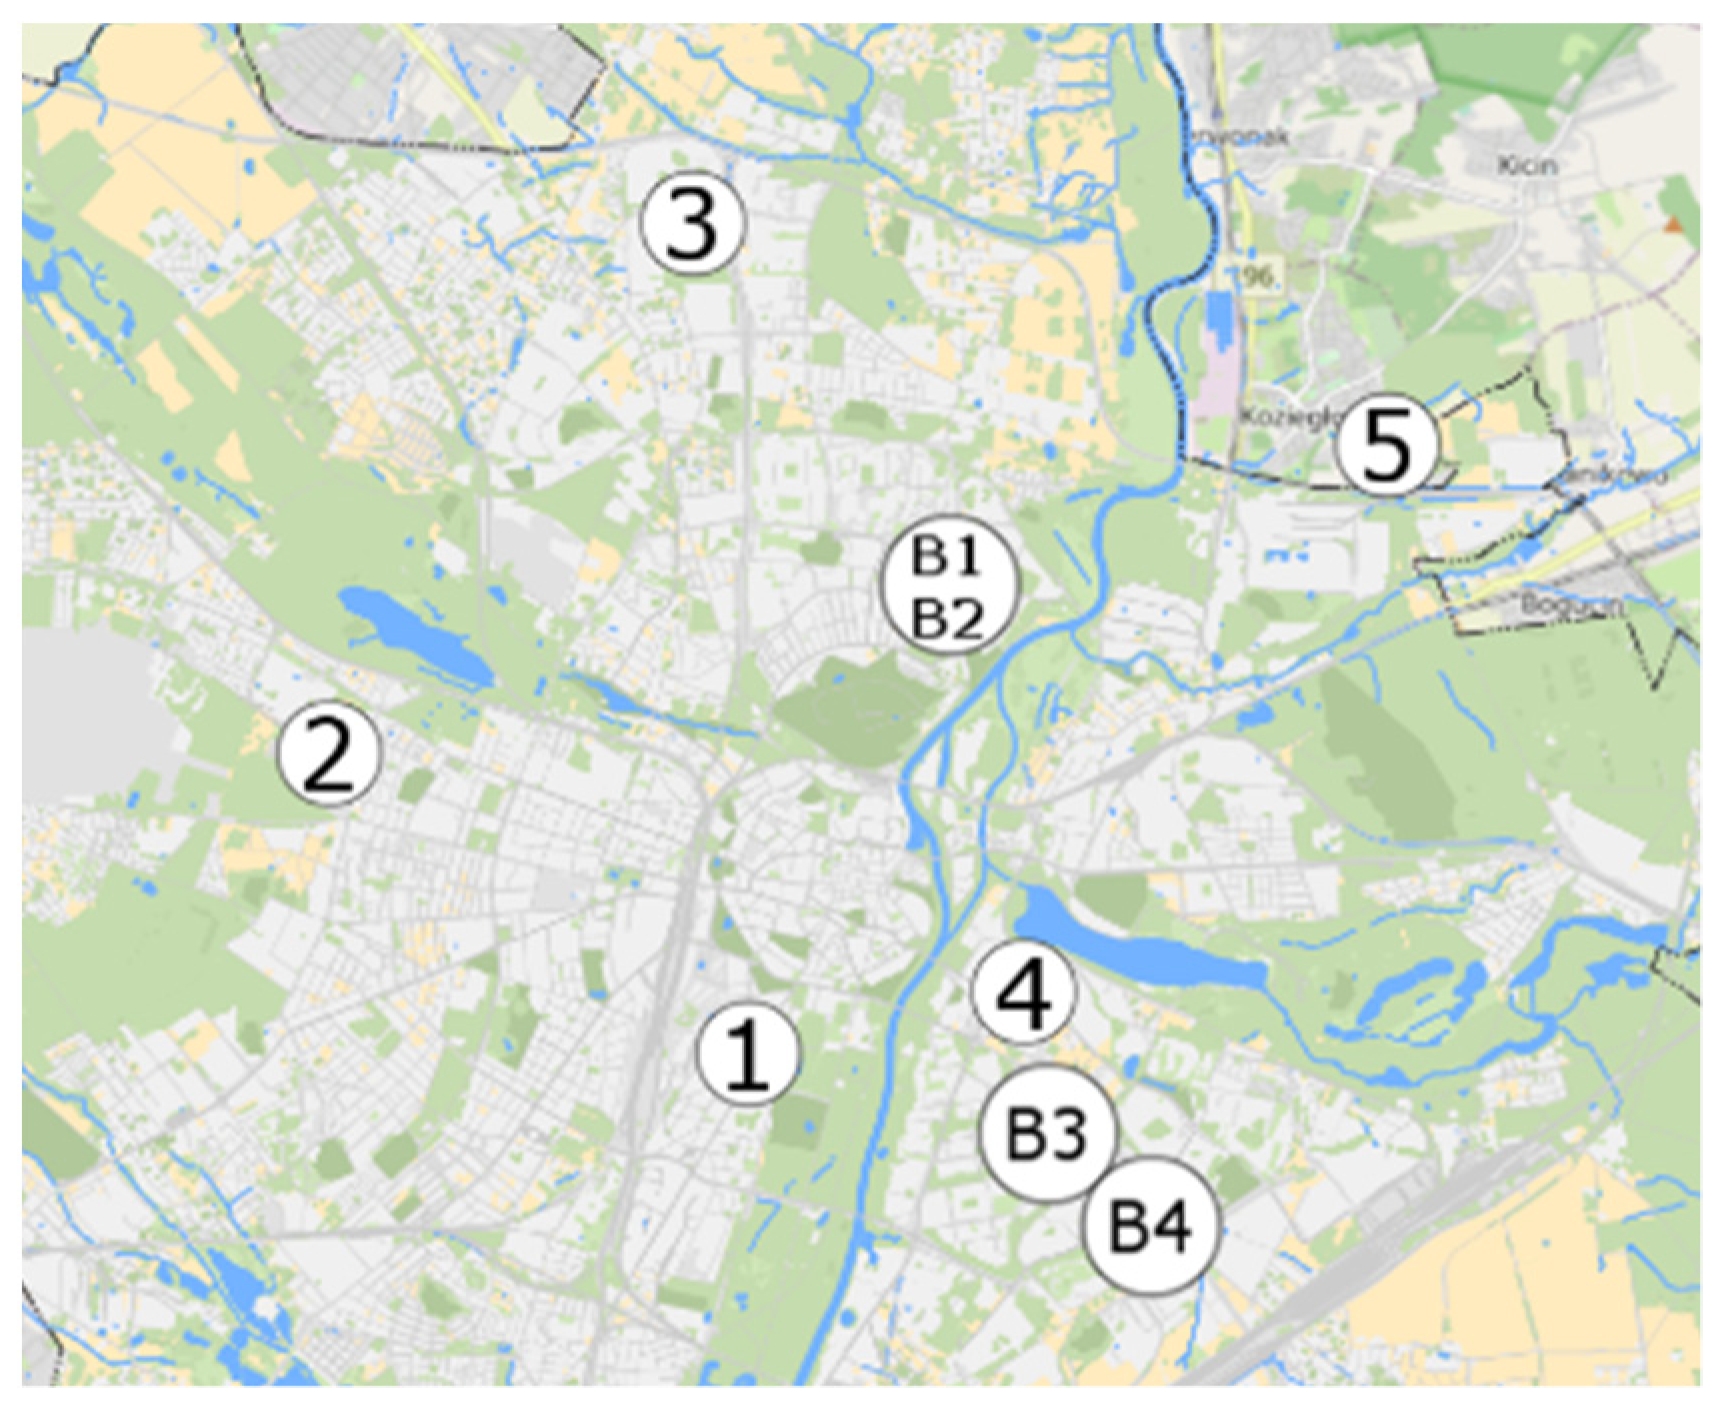
2.2. Characteristics of the Analyzed Building Surroundings
2.3. Measurement Period
- Morning time (MT), playtime in the playroom;
- Nap time (NT) in a dedicated sleeping room;
- Afternoon time (AT), playtime in the playroom.
2.4. Indoor and Outdoor Air Quality Assessments
2.4.1. Measuring Devices
2.4.2. Methodology
- The average concentration of CO2 below1200 ppm, and the maximum concentration below 1500 ppm;
- The maximum concentration of PM10 below 50 μg/m3;
- The maximum concentration of PM2.5 below 25 μg/m3.
2.5. Traffic Assessment
2.5.1. Measuring Devices
- Speed of the passing vehicle;
- The direction of vehicle movement;
- Length and number of axles of passing vehicles;
- Belonging to one of the 10 vehicle groups.
2.5.2. Methodology
3. Results
3.1. Assessment of the Outdoor Air Quality
3.2. Assessment of the Indoor Air Quality
3.2.1. Indoor Air Quality—Average over Time of Use
- For the winter period (W)
- The requirement (below 1500 ppm) for the average level of CO2 concentration when children stayed at the facility was met in building B4. In nurseries B2 and B3, the situation in terms of CO2 concentration was bad, the average concentration exceeded 1500 ppm. It was even worse in nursery B1 where the average concentration exceeded 2000 ppm.
- CO2 concentrations above 1500 ppm for rooms in nurseries B1 and B3 occurred 70% of the time spent by children in the nursery.
- PM10 concentrations remained below 50 µg/m3 in all of the nursery rooms. The lowest mean concentration of PM10 was recorded in nursery B1 (17 ± 6 µg/m3), and the highest in nursery B4 (22 ± 9 µg/m3).
- There were occurrences of excess PM2.5 concentration levels (>25 µg/m3). The highest concentration was recorded on 14 December 2020 and the range was from 28–35 µg/m3. The fewest days with excessive PM2.5 concentrations during children’s stay in the nursery occurred in nursery B1 (just two days), with an average concentration of PM2.5 18 ± 7 µg/m3. The highest number of excesses and highest average value in winter occurred in nurseries B2 and B4—three days with an average concentration of 20 ± 9 µg/m3 and four days with an average concentration of 20 ± 8 µg/m3.
- In each of the nurseries, the best air quality in terms of PM concentration was recorded on 7 December 2020, and the worst on 14 December 2020, which were the days with the lowest and the highest PM concentration, respectively, in the outdoor air.
- For the late spring period (LS)
- 6.
- In nurseries B1&B2, much better air quality parameters were registered relative to winter.
- 7.
- As in winter, the air quality was better in nursery B2 because rooms intended for children have a larger room space, so carbon dioxide emitted from breathing is diluted in a larger volume of internal air.
3.2.2. Indoor Air Quality—The Impact of the Way of Use in Terms of Ventilation
- In nursery B1, with the worst indoor air quality, the concentration of CO2 increases throughout the day. This is related to the lack of room ventilation. At the same time, the concentration of particulate matter remains constant throughout the day.
- In nursery B2, the CO2 concentration in the middle of the day is slightly lower than in the morning and increases again after nap time. A constant, lower value of CO2 during nap time was due to the lack of occupants and decreased respiration. The PM concentration remained constant throughout the day, which indicated a lack of airing.
- In nursery B3, which uses the same room for sleeping and playing, the concentration of CO2 increases from morning until the end of nap time. The room is not ventilated. Airing takes place after the nap ends, indicated by a decrease in CO2 concentration and an increase in particulate matter concentration.
- In nursery B4, with the lowest average CO2 concentration, there was an influence from intensive room ventilation when the children were in another room. The concentration of CO2 dropped significantly, while the concentration of PM increased. Thanks to airing, the average concentration of CO2 throughout the day remained low, but this resulted in high levels of particulate matter.
3.3. Concentration of Particulate Matter in Indoor and Outdoor Air
3.4. Indoor Air Quality and Traffic
3.4.1. Measurements near the Building B1&B2
3.4.2. Measurements near the Building B3
3.4.3. Measurements near Building B4
4. Discussion
4.1. CO2 Concentration
4.2. Particulate Matter Concentration
4.3. Airing of Rooms and Its Impact on Indoor Air Quality
4.4. Traffic
4.5. Possibilities to Improve Indoor Air Quality
4.6. Limitations
- The research was conducted in a limited time and space due to the prevailing COVID-19 pandemic.
- Quantitatively analyzed concentrations of PM2.5 and PM10, without chemically analyzing the dust, so the conclusions are general and it is not possible to unequivocally assess the source of the dust.
- Traffic was assessed on one day near each nursery and should be assessed more frequently (more days, taking into account different seasons of the year).
5. Conclusions
- Can proper indoor air quality be ensured by airing the rooms?
- 2.
- Is there a correlation between indoor and outdoor PM concentrations and is it seasonal?
- 3.
- Is there a correlation between seasonal traffic and indoor air quality?
- The absence of a ventilation system, or any other air supplier system, results in CO2 concentration increases in the room.
- Ventilation by airing effectively ensures the proper indoor air quality, but only when outdoor air is not polluted.
- When ventilating rooms by airing, monitoring the PM10 and PM2.5 concentrations in the external air is extremely important. When the PM2.5 concentration in the outdoor air is high (above 150 µg/m3), outdoor air should not be supplied to rooms.
- When the concentration of particulate matter in the outdoor air was high, it was also high in the indoor air, which confirmed the influence of infiltration.
- Infiltration had the greatest impact on the PM concentration in indoor air regardless of the intensity of airing the rooms. The tends to change PM concentration levels in indoor air and was the same in each nursery.
- The seasonality of particulate matter concentration in the outside air was shown.
- No relationship was found between traffic and indoor PM10 and CO2 concentrations.
- Repeat the tests at additional facilities (including the ones in this study) and different times to confirm the seasonality of pollutants and the impact of the location of the facilities.
- In order to analyze the influence of infiltration, it is necessary to assess the airtightness indicators of the buildings and check whether the air that infiltrates the building through leaks can be cleaned using mechanical ventilation equipped with filters.
- The feasibility of using solutions for the improvement of indoor air quality suggested in the literature should be assessed.
- A campaign to educate employees of educational institutions about the need to improve air quality in terms of CO2 concentration should be conducted.
Author Contributions
Funding
Institutional Review Board Statement
Informed Consent Statement
Data Availability Statement
Acknowledgments
Conflicts of Interest
References
- Yocom, J.E. Indoor–outdoor air quality relationships: A critical review. J. Air Pollut. Control Assoc. 1982, 32, 500–520. [Google Scholar] [CrossRef] [Green Version]
- Lee, S.C.; Chan, L.Y.; Chiu, M.Y. Indoor and outdoor air quality investigation at 14 public places in Hong Kong. Environ. Int. 1999, 25, 443–450. [Google Scholar] [CrossRef]
- Meier, R.; Schindler, C.; Eeftens, M.; Aguilera, I.; Ducret-Stich, R.E.; Ineichen, A.; Davey, M.; Phuleria, H.C.; Probst-Hensch, N.; Tsai, M.-Y.; et al. Modeling indoor air pollution of outdoor origin in homes of SAPALDIA subjects in Switzerland. Environ. Int. 2015, 82, 85–91. [Google Scholar] [CrossRef]
- Snider, G.; Carter, E.; Clark, S.; Tseng, J.; Yang, X.; Ezzati, M.; Schauer, J.J.; Wiedinmyer, C.; Baumgartner, J. Impacts of stove use patterns and outdoor air quality on household air pollution and cardiovascular mortality in southwestern China. Environ. Int. 2018, 117, 116–124. [Google Scholar] [CrossRef] [PubMed]
- Directive 2008/50/EC of the European Parliament and of the Council of 21 May 2008 on Ambient Air Quality and Cleaner Air for Europe. Available online: https://op.europa.eu/en/publication-detail/-/publication/1ac2582f-048a-4afe-91ad-72e7cc066ec9 (accessed on 10 August 2021).
- World Health Organization. WHO Air Quality Guidelines for Particulate Matter, Ozone, Nitrogendioxide and Sulfur Dioxide. Global Update 2005. Summary of Risk Assessment. 2005. Available online: http://apps.who.int/iris/bitstream/handle/10665/69477/WHO_SDE_PHE_OEH_06.02_eng.pdf?sequence=1 (accessed on 12 August 2021).
- Parrish, D.D.; Xu, J.; Croes, B.; Shao, M. Air quality improvement in Los Angeles—Perspectives for developing cities. Front. Environ. Sci. Eng. 2016, 10, 11. [Google Scholar] [CrossRef]
- Pugh, T.A.M.; MacKenzie, A.R.; Whyatt, J.D.; Hewitt, C.N. Effectiveness of Green Infrastructure for Improvement of Air Quality in Urban Street Canyons. Environ. Sci. Technol. 2012, 46, 7692–7699. [Google Scholar] [CrossRef] [PubMed] [Green Version]
- Ji, W.; Wang, Y.; Zhuang, D. Spatial distribution differences in PM2.5 concentration between heating and non-heating seasons in Beijing, China. Environ. Pollut. 2019, 248, 574–583. [Google Scholar] [CrossRef]
- Siedlecki, M.; Galant, M.; Rymaniak, Ł.; Ziółkowski, A. Emission investigation from passenger car equipped with gasoline direct injection engine in real traffic conditions. Autobusy 2017, 12, 404–409. [Google Scholar]
- Basińska, M.; Michałkiewicz, M.; Ratajczak, K. Impact of physical and microbiological parameters on proper indoor air quality in nursery. Environ. Int. 2019, 132, 105098. [Google Scholar] [CrossRef]
- Asanati, K.; Voden, L.; Majeed, A. Healthier schools during the COVID-19 pandemic: Ventilation, testing and vaccination. J. R. Soc. Med. 2021, 114, 160–163. [Google Scholar] [CrossRef]
- Burridge, H.C.; Bhagat, R.K.; Stettler, M.E.J.; Kumar, P.; De Mel, I.; Demis, P.; Hart, A.; Johnson-Llambias, Y.; King, M.-F.; Klymenko, O.; et al. The ventilation of buildings and other mitigating measures for COVID-19: A focus on wintertime. Proc. R. Soc. A Math. Phys. Eng. Sci. 2021, 477, 20200855. [Google Scholar] [CrossRef]
- Wojtkowiak, J.; Amanowicz, Ł. Effect of surface corrugation on cooling capacity of ceiling panel. Therm. Sci. Eng. Prog. 2020, 19, 100572. [Google Scholar] [CrossRef]
- Wojtkowiak, J.; Amanowicz, Ł.; Mróz, T. A new type of cooling ceiling panel with corrugated surface—Experimental investigation. Int. J. Energy Res. 2019, 43, 7275–7286. [Google Scholar] [CrossRef]
- The Regional Inspectorate of Environmental Protection. WIOS. Available online: https://powietrze.gios.gov.pl/pjp/station/search (accessed on 10 August 2021).
- Siedlecki, M.; Szymlet, N.; Sokolnicka, B. Influence of the Particulate Filter Use in the Spark Ignition Engine Vehicle on the Exhaust Emission in Real Driving Emission Test. J. Ecol. Eng. 2020, 21, 120–127. [Google Scholar] [CrossRef]
- Merkisz, J.; Gallas, D.; Siedlecki, M.; Szymlet, N.; Sokolnicka, B. Exhaust emissions of an LPG powered vehicle in real operating conditions. In Proceedings of the E3S Web of Conferences, EDP Sciences, Polanica-Zdrój, Poland, 8–10 April 2019; Volume 100, p. 00053. [Google Scholar] [CrossRef] [Green Version]
- Szymlet, N.; Lijewski, P.; Sokolnicka, B.; Siedlecki, M.; Domowicz, A. Analysis of Research Method, Results and Regulations Regarding the Exhaust Emissions from Two-Wheeled Vehicles under Actual Operating Conditions. J. Ecol. Eng. 2020, 21, 128–139. [Google Scholar] [CrossRef]
- Lijewski, P.; Kozak, M.; Fuć, P.; Rymaniak, Ł.; Ziółkowski, A. Exhaust emissions generated under actual operating conditions from a hybrid vehicle and an electric one fitted with a range extender. Transp. Res. Part D Transp. Environ. 2020, 78, 102183. [Google Scholar] [CrossRef]
- Fuć, P.; Lijewski, P.; Siedlecki, M.; Sokolnicka, B.; Szymlet, N. Analysis of particle mass and number emission from an SI engine with direct fuel injection and a particulate filter. IOP Conf. Ser. Mater. Sci. Eng. 2018, 421, 042019. [Google Scholar] [CrossRef]
- Rymaniak, L. Comparison of the combustion engine operating parameters and the ecological indicators of an urban bus in dynamic type approval tests and in actual operating conditions. In Proceedings of the MATEC Web of Conferences, EDP Sciences, Poznan, Poland, 27–29 June 2017; Volume 118, p. 00009. [Google Scholar]
- Rajšić, S.F.; Tasić, M.D.; Novakovic, V.T.; Tomašević, M.N. First assessment of the PM10 and PM2.5 particulate level in the ambient air of Belgrade city. Environ. Sci. Pollut. Res. 2004, 11, 158–164. [Google Scholar] [CrossRef]
- Pajek, L.; Košir, M.; Kristl, Ž.; Kacjan Žgajnar, K.; Dovjak, M. Indoor Environmental quality (IEQ) in Slovenian children daycare centres. Part I: Results of in-situ measurements. Int. J. Sanit. Eng. Res. 2017, 11, 4–18. [Google Scholar]
- Mendes, A.; Aelenei, D.; Papoila, A.L.; Carreiro-Martins, P.; Aguiar, L.; Pereira, C.; Neves, P.; Azevedo, S.; Cano, M.; Proença, C.; et al. Environmental and Ventilation Assessment in Child Day Care Centers in Porto: The Envirh Project. J. Toxicol. Environ. Health Part A 2014, 77, 931–943. [Google Scholar] [CrossRef]
- Canha, N.; Mandin, C.; Ramalho, O.; Wyart, G.; Ribéron, J.; Dassonville, C.; Hänninen, O.; Almeida, S.M.; Derbez, M. Assessment of ventilation and indoor air pollutants in nursery and elementary schools in France. Indoor Air 2016, 26, 350–365. [Google Scholar] [CrossRef]
- Stankevica, G.; Lesinskis, A. Indoor Air Quality and Thermal Comfort Evaluation in Latvian Daycare Centers with Carbon Dioxide, Temperature and Humidity as Indicators. J. Civ. Eng. Arch. 2012, 6, 633–638. [Google Scholar] [CrossRef] [Green Version]
- Jacobs, P. Improved Ventilation and Temperature Control in a Nursery. Proc. Indoor Air 2011, 1, 507–512. [Google Scholar]
- Kozielska, B.; Mainka, A.; Żak, M.; Kaleta, D.; Mucha, W. Indoor air quality in residential buildings in Upper Silesia, Poland. Build. Environ. 2020, 177, 106914. [Google Scholar] [CrossRef]
- Błaszczyk, E.; Rogula-Kozłowska, W.; Klejnowski, K.; Kubiesa, P.; Fulara, I.; Mielżyńska-Švach, D. Indoor air quality in urban and rural kindergartens: Short-term studies in Silesia, Poland. Air Qual. Atmos. Health 2017, 10, 1207–1220. [Google Scholar] [CrossRef] [PubMed] [Green Version]
- Chang, J.; Shen, J.; Tao, J.; Li, N.; Xu, C.; Li, Y.; Liu, Z.; Wang, Q. The impact of heating season factors on eight PM2.5-bound polycyclic aromatic hydrocarbon (PAH) concentrations and cancer risk in Beijing. Sci. Total Environ. 2019, 688, 1413–1421. [Google Scholar] [CrossRef] [PubMed]
- Ścibor, M.; Balcerzak, B.; Galbarczyk, A.; Targosz, N.; Jasienska, G. Are we safe inside? Indoor air quality in relation to outdoor concentration of PM10 and PM2.5 and to characteristics of homes. Sustain. Cities Soc. 2019, 48, 101537. [Google Scholar] [CrossRef]
- Blocken, B.; van Druenen, T.; Ricci, A.; Kang, L.; van Hooff, T.; Qin, P.; Xia, L.; Ruiz, C.A.; Arts, J.; Diepens, J.; et al. Ventilation and air cleaning to limit aerosol particle concentrations in a gym during the COVID-19 pandemic. Build. Environ. 2021, 193, 107659. [Google Scholar] [CrossRef]
- Hayashi, M.; Yanagi, U.; Azuma, K.; Kagi, N.; Ogata, M.; Morimoto, S.; Hayama, H.; Mori, T.; Kikuta, K.; Tanabe, S.; et al. Measures against COVID-19 concerning Summer Indoor Environment in Japan. Jpn. Arch. Rev. 2020, 3, 423–434. [Google Scholar] [CrossRef]
- Branco, P.; Alvim-Ferraz, M.D.C.; Martins, F.; Sousa, S. Children’s exposure to indoor air in urban nurseries-part I: CO2 and comfort assessment. Environ. Res. 2015, 140, 1–9. [Google Scholar] [CrossRef] [Green Version]
- Theodosiou, T.; Ordoumpozanis, K. Energy, comfort and indoor air quality in nursery and elementary school buildings in the cold climatic zone of Greece. Energy Build. 2008, 40, 2207–2214. [Google Scholar] [CrossRef]
- Leung, D.Y.C. Outdoor-indoor air pollution in urban environment: Challenges and opportunity. Front. Environ. Sci. 2015, 2, 69. [Google Scholar] [CrossRef]
- Tang, D.; Wang, C.; Nie, J.; Chen, R.; Niu, Q.; Kan, H.; Chen, B.; Perera, F. Health benefits of improving air quality in Taiyuan, China. Environ. Int. 2014, 73, 235–242. [Google Scholar] [CrossRef] [PubMed] [Green Version]
- Li, S.; Williams, G.; Guo, Y. Health benefits from improved outdoor air quality and intervention in China. Environ. Pollut. 2016, 214, 17–25. [Google Scholar] [CrossRef]
- Merema, B.; Delwati, M.; Sourbron, M.; Breesch, H. Demand controlled ventilation (DCV) in school and office buildings: Lessons learnt from case studies. Energy Build. 2018, 172, 349–360. [Google Scholar] [CrossRef]
- Ratajczak, K.; Amanowicz, Ł.; Szczechowiak, E. Assessment of the air streams mixing in wall-type heat recovery units for ventilation of existing and refurbishing buildings toward low energy buildings. Energy Build. 2020, 227, 110427. [Google Scholar] [CrossRef]
- Zender–Świercz, E. Assessment of Indoor Air Parameters in Building Equipped with Decentralised Façade Ventilation Device. Energies 2021, 14, 1176. [Google Scholar] [CrossRef]
- Chan, W.R.; Li, X.; Singer, B.C.; Pistochini, T.; Vernon, D.; Outcault, S.; Sanguinetti, A.; Modera, M. Ventilation rates in California classrooms: Why many recent HVAC retrofits are not delivering sufficient ventilation. Build. Environ. 2020, 167, 106426. [Google Scholar] [CrossRef]
- Gładyszewska-Fiedoruk, K. Correlations of air humidity and carbon dioxide concentration in the kindergarten. Energy Build. 2013, 62, 45–50. [Google Scholar] [CrossRef]
- Mijakowski, M.; Sowa, J. An attempt to improve indoor environment by installing humidity-sensitive air inlets in a naturally ventilated kindergarten building. Build. Environ. 2017, 111, 180–191. [Google Scholar] [CrossRef]
- Gładyszewska-Fiedoruk, K. Analysis of stack ventilation system effectiveness in an average kindergarten in north-eastern Poland. Energy Build. 2011, 43, 2488–2493. [Google Scholar] [CrossRef]
- Zender–Świercz, E. A Review of Heat Recovery in Ventilation. Energies 2021, 14, 1759. [Google Scholar] [CrossRef]
- Ratajczak, K.; Basińska, M. The Well-Being of Children in Nurseries Does Not Have to Be Expensive: The Real Costs of Maintaining Low Carbon Dioxide Concentrations in Nurseries. Energies 2021, 14, 2035. [Google Scholar] [CrossRef]


| Symbol | Buildings B1 & B2 | Building B3 | Building B4 | ||
|---|---|---|---|---|---|
| Nursery Symbol | B1 | B2 | B3 | B4 | |
| Building | Type of building | adaptation of a semi-detached building | adaptation of selected rooms in a shopping area | building designed as a nursery | |
| Location | district of single-family houses | multi-family buildings | |||
| Distance from a heavy traffic street | 100 m from a busy street, numerous separate buildings, 9 m from the residential road | 100 m from the main road | 132 m from the main road, by a residential road | ||
| Windows location | garden | parking lot | park | ||
| Architectural details | Number of rooms dedicated for each group | 2 | 2 | 1 | 2 |
| Playroom: area (m2) volume (m3) | B1.1 41.0 90.3 | B2.1 62.1 176.8 | One room B3 38.9 51.7 | B4.1 60.9 199.8 | |
| Sleeping room: area (m2) volume (m3) | B1.2 21.2 55.0 | B2.2 15.6 49.1 | B4.2 62.6 205.3 | ||
| Group of children | Number of children | 13 | 20 | 16 | 32 |
| Number of sitters | 2 | 2 | 3 | 3 | |
| Age | 1–1.5 | 1.5–2.5 | 2 | 1.5–2 | |
| Average attendance | 66% | 68% | 90% | 76% | |
| Nursery (Research Group) | B1 | B2 | B3 | B4 |
|---|---|---|---|---|
| Indoor and outdoor air quality assessment | ||||
| Winter time (W) | 02–16 December 2020 | |||
| Spring time (S) | 19–23 April 2021 | − | − | |
| Late spring time (LS) | 07–11 June 2021 | − | − | |
| Morning time (MT) | 8:00–11:00 | 8:00–11:00 | 8:00–16:00 | 8:00–11:30 |
| Nap time (NT) | 11:00–13:00 | 11:00–13:00 | 11:30–13:30 | |
| Afternoon time (AT) | 13:00–15:00 | 13:00–15:00 | Nap time in the same room (11:30–14:00) | 13:30–16:00 |
| Traffic assessment | ||||
| Winter time (W) | 1 December 2020 | 4 December 2020 | 8 December 2020 | |
| Late spring time (LS) | 7 June 2021 | − | − | |
| Parameter | NEMo XT Mini NEMo Outdoor | |
|---|---|---|
| Carbon dioxide | Detection method | Non-dispersive infrared spectrometry |
| Measuring range | 0–5000 ppm | |
| Resolution | 1 ppm | |
| Accuracy | ±50 ppm | |
| Temperature | Detection method | CMOS (Complementary Metal-Oxide-Semiconductor) |
| Measuring range | (−55)–(+125) °C | |
| Resolution | 0.08 °C | |
| Accuracy | ±0.5 °C | |
| Relative humidity | Detection method | Capacitive |
| Measuring range | 0–95% | |
| Resolution | 0.08% | |
| Accuracy | ±3% | |
| PM2.5/PM10 | Detection method | Laser-based light scattering |
| Measuring range | 0–1000 µg/m3 | |
| Resolution | 1 µg/m3 | |
| Accuracy | ±5% | |
| Dimensions | 41 × 35 × 18 cm |
| Signal frequency | 24 to 24.25 GHz |
| Working temperature | −30 °C to 50 °C |
| Battery life | Up to 7 days |
| Measurement memory | Up to 500,000 vehicles |
| Type of communication | Bluetooth, GPRS with FTP |
| Vehicle Group/Assumed Emission Intensity | Passenger Vehicles | Motorcycle | Delivery Vehicles | Buses and Trucks | Heavy Vehicle Assemblies | Unclassified Vehicles |
|---|---|---|---|---|---|---|
| CO2 (mg/s) | 2296 | 988 | 2684 | 5824 | 6930 | – |
| PM (ng/s) | 3.4 | 1.1 | 4.8 | 24.7 | 31.3 | – |
| Period | Average | Maximum | Minimum | |||||||||
|---|---|---|---|---|---|---|---|---|---|---|---|---|
| T | RH | PM2.5 | PM10 | T | RH | PM2.5 | PM10 | T | RH | PM2.5 | PM10 | |
| (°C) | (%) | (µg/m3) | (°C) | (%) | (µg/m3) | (°C) | (%) | (µg/m3) | ||||
| Winter (W) | 3.2 ± 2.7 | 82 ± 5 | 74 ± 29 | 122 ± 62 | 13.5 | 93 | 171 | 446 | −1.8 | 64 | 25 | 25 |
| Spring (S) | 13.4 ± 5.6 | 54 ± 16 | 13 ± 9 | 18 ± 11 | 28.0 | 85 | 65 | 80 | 4.3 | 17 | 3 | 4 |
| Late spring (LS) | 22.7± | 50 ± 13 | 4± | 7 ± 3 | 35.0 | 75 | 14 | 19 | 15.8 | 21 | 1 | 2 |
| Date/Period of Time | PM10 | PM2.5 | Wind Speed | Date/Period of Time | PM10 | PM2.5 | Wind Speed | ||||||
|---|---|---|---|---|---|---|---|---|---|---|---|---|---|
| Max | Ave. | Max | Ave. | Max | Ave. | Max | Ave. | ||||||
| (µg/m3) | (km/h) | (µg/m3) | (km/h) | ||||||||||
| Winter (W) | 2 December | 186 | 166 | 186 | 154 | 16.0 | Spring (S) | 19 April | 21 | 15 | 15 | 11 | 11.8 |
| 3 December | 189 | 153 | 189 | 154 | 18.8 | 20 April | 38 | 17 | 27 | 13 | 10.8 | ||
| 4 December | 92 | 79 | 92 | 79 | 23.3 | 21 April | 53 | 22 | 33 | 16 | 18.8 | ||
| 7 December | 45 | 37 | 45 | 40 | 29.8 | 22 April | 44 | 18 | 36 | 10 | 24.3 | ||
| 8 December | 89 | 75 | 89 | 72 | 22.5 | 23 April | 35 | 18 | 27 | 10 | 21.3 | ||
| 9 December | 108 | 91 | 108 | 89 | 20.5 | Late Spring (LS) | 7 June | 23 | 8 | 8 | 6 | 7.0 | |
| 10 December | 124 | 96 | 124 | 100 | 14.3 | 8 June | 22 | 9 | 8 | 4 | 10.5 | ||
| 11 December | 288 | 191 | 288 | 237 | 13.5 | 9 June | 19 | 7 | 4 | 2 | 15.8 | ||
| 14 December | 343 | 260 | 343 | 235 | 12.3 | 10 June | 30 | 10 | 14 | 5 | 8.5 | ||
| 15 December | 225 | 140 | 225 | 182 | 13.0 | 11 June | 17 | 8 | 9 | 4 | 8.8 | ||
| Data | B1 | B2 | B3 | B4 | ||||||||
|---|---|---|---|---|---|---|---|---|---|---|---|---|
| CO2 | PM2.5 | PM10 | CO2 | PM2.5 | PM10 | CO2 | PM2.5 | PM10 | CO2 | PM2.5 | PM10 | |
| (ppm) | (µg/m3) | (ppm) | (µg/m3) | (ppm) | (µg/m3) | (ppm) | (µg/m3) | |||||
| Winter Time (W) | ||||||||||||
| 2 December | 1904 | 23 | 24 | 1414 | 31 | 33 | 1887 | 24 | 26 | 1039 | 30 | 31 |
| 3 December | 1955 | 20 | 21 | 1578 | 23 | 25 | 1850 | 21 | 24 | 1136 | 24 | 26 |
| 4 December | 2055 | 14 | 15 | – | – | – | 1671 | 19 | 21 | 867 | 23 | 24 |
| 7 December | 2394 | 7 | 8 | 1633 | 8 | 9 | – | – | – | 1220 | 8 | 9 |
| 8 December | 1950 | 11 | 12 | 1660 | 13 | 14 | – | – | – | 1352 | 13 | 14 |
| 9 December | 1838 | 12 | 13 | – | – | – | – | – | – | 1317 | 15 | 16 |
| 10 December | 1866 | 15 | 17 | 1645 | 17 | 19 | – | – | – | 1364 | 15 | 16 |
| 11 December | 2030 | 27 | 30 | 1513 | 31 | 34 | 1809 | 30 | 35 | 1162 | 27 | 30 |
| 14 December | 2299 | 28 | 31 | 1810 | 34 | 38 | 2021 | 35 | 38 | 1084 | 35 | 39 |
| 15 December | 2186 | 22 | 23 | 1622 | 21 | 23 | 1710 | 23 | 25 | 1062 | 26 | 28 |
| 16 December | 1719 | 14 | 14 | 1864 | 13 | 14 | 1922 | 13 | 14 | 1105 | 15 | 16 |
| Late spring (LS) | ||||||||||||
| 7 June | 1177 | 10 | 11 | 952 | 8 | 8 | – | – | – | – | – | – |
| 8 June | 1116 | 6 | 7 | 845 | 5 | 5 | – | – | – | – | – | – |
| 9 June | 1075 | 4 | 4 | 818 | 3 | 4 | – | – | – | – | – | – |
| 10 June | 1186 | 6 | 7 | 945 | 6 | 6 | – | – | – | – | – | – |
| 11 June | 1233 | 7 | 7 | 991 | 6 | 6 | – | – | – | – | – | – |
Publisher’s Note: MDPI stays neutral with regard to jurisdictional claims in published maps and institutional affiliations. |
© 2021 by the authors. Licensee MDPI, Basel, Switzerland. This article is an open access article distributed under the terms and conditions of the Creative Commons Attribution (CC BY) license (https://creativecommons.org/licenses/by/4.0/).
Share and Cite
Basińska, M.; Ratajczak, K.; Michałkiewicz, M.; Fuć, P.; Siedlecki, M. The Way of Usage and Location in a Big City Agglomeration as Impact Factors of the Nurseries Indoor Air Quality. Energies 2021, 14, 7534. https://doi.org/10.3390/en14227534
Basińska M, Ratajczak K, Michałkiewicz M, Fuć P, Siedlecki M. The Way of Usage and Location in a Big City Agglomeration as Impact Factors of the Nurseries Indoor Air Quality. Energies. 2021; 14(22):7534. https://doi.org/10.3390/en14227534
Chicago/Turabian StyleBasińska, Małgorzata, Katarzyna Ratajczak, Michał Michałkiewicz, Paweł Fuć, and Maciej Siedlecki. 2021. "The Way of Usage and Location in a Big City Agglomeration as Impact Factors of the Nurseries Indoor Air Quality" Energies 14, no. 22: 7534. https://doi.org/10.3390/en14227534