Article

Low-Emissivity Window Films as an Energy Retrofit Option for a Historical Stone Building in Cold Climate

1
Department of Mechanical Engineering, ADAI, University of Coimbra, Rua Luís Reis Santos, Pólo II, 3030-788 Coimbra, Portugal
2
Faculty of Engineering and Sustainable Development, University of Gävle, 801 76 Gävle, Sweden
3
Department of Civil Engineering, University of Coimbra, Rua Luís Reis Santos, Pólo II, 3030-788 Coimbra, Portugal
*
Author to whom correspondence should be addressed.
Energies 2021, 14(22), 7584; https://doi.org/10.3390/en14227584
Submission received: 13 October 2021 / Revised: 4 November 2021 / Accepted: 8 November 2021 / Published: 12 November 2021
(This article belongs to the Special Issue Sustainable Renovation and Energy Retrofit in Buildings)

Abstract

:
Low-emissivity (low-E) window films are designed to improve the thermal comfort and energy performance of buildings. These films can be applied to different glazing systems without having to change the whole window. This makes it possible to apply films to windows in old and historical buildings for which preservation regulations often require that windows should remain unchanged. This research aims to investigate the impacts of low-E window films on the energy performance and thermal comfort of a three-story historical stone building in the cold climate of Sweden using the simulation software “IDA ICE”. On-site measurements were taken to acquire thermal and optical properties of the windows. This research shows that the application of the low-emissivity window film on the outward-facing surface of the inner pane of the double-glazed windows helped to reduce heat loss through the windows in winter and unwanted heat gains in summer by almost 36% and 35%, respectively. This resulted in a 6% reduction in the building’s annual energy consumption for heating purposes and a reduction in the percentage of total occupant hours with thermal dissatisfaction from 14% (without the film) to 11% (with the film). However, the relatively high price of the films and low price of district heating results in a rather long payback period of around 30 years. Thus, the films seem scarcely attractive from a purely economic viewpoint, but may be warranted for energy/environmental and thermal comfort reasons.

1. Introduction

Around 25% of the existing buildings in Europe were built prior to the middle of the last century and are a living symbol of Europe’s rich cultural heritage and diversity. Based on their age, integrity and significance, some of these buildings are recognized as historic and have been registered at the local, state or national level [1]. Old and historic buildings are mostly energy-inefficient [2,3], and generate more emissions than new buildings [4]. Most of these buildings also suffer from thermal discomfort because when they were built, the main focus was on architecture, durability, mechanical performance, function, and to a much lesser extent, the occupants’ comfort and health [5]. Although old and historic buildings are exempt from strict energy-related requirements, retrofitting them has huge potential to provide improved indoor thermal comfort [5] and a reduction in their energy consumption and CO2 emissions [3,6], which ensures the continued use of these buildings over time and, consequently, their conservation [7].
In the case of historical buildings, preservation orders may be so strict that they hamper normal energy-efficient interventions on the building envelope [8,9]. Herrera et al. [7] categorized the challenges associated with retrofitting historic buildings in three groups, namely, social, economic and technical viability. Retrofitting these buildings is a trade-off between these criteria, which must secure the buildings’ efficiency, aesthetic conservation and long-term use [1,7].
Common retrofits of historical buildings may include improving wall and roof insulation, upgrading windows, air-sealing, use of energy-efficient lights, modernizing HVAC equipment and changing operational schedules. Of these, the upgrade of windows has become a focal point, because it not only reduces heat loss through the building’s envelope, but it also reduces condensation risk, noise, and thermal discomfort [1,10,11].

1.1. Windows in Buildings

Windows can have a positive psychological impact on occupants by giving them a connection to the outside. They also provide buildings with the natural light, fresh air and solar gain that leads to decreased energy use [12,13,14,15]. Yin et al. [14] emphasized that sometimes the benefits from windows can be undermined by some negative impacts, including heat losses in winter and overheating caused by excessive solar gain in summer. Many researchers have blamed windows for their weak energy performance and introduced various figures for their share of energy loss in buildings—ranging between 20% and 60%, depending on factors such as climate and the age, type and size of buildings [12,13,14,15,16,17,18,19,20,21]. Energy losses through windows can significantly affect the total energy consumption of countries; for example, Curcija et al. [22] mentioned that, in the US, windows in commercial buildings were responsible for about 1.5% of the total energy consumption in 2011. This is equivalent to the amount of energy consumed by more than 8 million US households. This huge amount of energy loss is primarily due to the high U-value of windows, normally much higher than for other elements such as walls and doors. In addition, window glazing usually has a high solar heat gain coefficient (SHGC or g-value), which allows for a high portion of solar radiation to enter the building, leading to thermal discomfort and to an increase in cooling demands [12,13,18,23]. Sarihi et al. [24] stated that window performance can be enhanced by improving either its thermal or solar control properties. In cold climates, energy consumption of buildings with a large window-to-wall ratio (WWR) can be decreased by reducing the windows’ U-value. In hot climates, lowering the SHGC helps to prevent indoor overheating caused by solar radiation. Reducing heat loss through windows is not as easy as reducing heat loss through walls. To improve windows’ performance, a wide range of methods have been introduced, such as increasing the number of panes per window, optimizing the air layer thickness of double-glazed windows, evacuating the cavity, coating the surface of panes with low-emissivity materials or solar selective coatings, filling the cavity between panes with an inert gas or by adopting some of these methods simultaneously [25]. Pal et al. [17] also mention some attractive advanced glazing systems, including electrochromic (EC) glazing, photovoltaic (PV) integrated glazing, self-cleaning glazing and vacuum glazing.
Many of the above-mentioned methods seem complex and costly, since the majority of them cannot be applied to existing windows or old windows and they often require windows to be replaced, which is seldom possible in historical buildings with strict retrofitting regulations [17]. Ascione et al. [26], in a study about the energy retrofit of a historical building, revealed that even if the regulations allow for it, the replacement of old windows with doubled-glazed ones treated with low-E coatings is not only difficult, but also costly, compared to the other energy-restoring actions. For instance, the cost of a single saved kWh of energy by replacing the windows was almost nine times more than that of improving the walls’ thermal insulation. Ariosto et al. [12] stated that there are some low-cost and viable retrofit solutions that help to improve the performance of existing windows, including the use of curtains, drapes, blinds, screens and shutters, which are available in different styles and configurations. In addition to these methods, the application of window films is also seen as a simple method to improve windows’ energy performance, and one which is usually cheaper, less intrusive and less complicated than replacing the entire window [19].

1.2. Window Films

One of the typical groups of window films mostly used in hot climates is solar control window films, which are available in surface-applied and liquid-applied forms. Solar control window films lessen the unwanted solar heat gain through windows and this results in a cooling load drop and better indoor thermal comfort [13,22,27]. Winckler et al. [27] stated that, as a result of a reduction in cooling demand, the cooling equipment operating hours would decline, which in most cases leads to electricity savings. In a study on the effects of a solar control film on a double-glazed window in hot climates, Xamán et al. [28] showed that, with the help of the solar window film added to the outward-facing surface of the inner pane, the heat gain through the window dropped by 55% compared with the glazing without the film. The results of another field test carried out to investigate the impacts of solar films on the energy performance of windows in an air-conditioned office building in Hong Kong’s climate showed that the solar heat rejection of the film-treated window was 30% for diffused radiation and 50% for beam radiation. These reductions proved the AC-energy-saving potential of solar films [29]. The effectiveness of solar control window films depends on several factors, including the location of the installed window film, the type and configuration of the original glazing system and the climate [14,22,27]. Yin et al. [14] mention that the shading coefficient and SHGC of films applied to the outer surface of the window is different from when it is applied to the inner surface. An energy simulation conducted by Curcija et al. [22] also shows that the improvement in energy performance due to the use of solar control films was more noticeable in a single-glazed window than a double-glazed window, proving that the type of glazing affects the window film’s influence. Winckler et al. [27] stated that, although solar control window films reduce cooling loads in the summertime, they usually decrease the solar gain in the wintertime when such a gain is desired. In hot climates, the small loss of free solar heat in winter is less than the savings in cooling loads associated with the use of solar control window films. However, this drawback indicates that the use of solar control films is not a good option for cold climates with long heating seasons. A study by Bahadori-Jahromi et al. [30] concluded that savings in cooling energy due to the application of sun control films in a hotel building in the UK was lessened by the increase in heating loads caused by free solar heat loss.
Another type of window film widely used in both cold and hot climates is the low-E (low-emissivity) film, which is known as a self-applicable film. Unlike the usual methods of applying low-E coatings to glazing, which should be done by glass manufacturers before the window glazing is installed, self-applicable low-E films are added to existing windows. This characteristic makes the use of low-E films a practical window retrofit option since it does not involve replacing windows [19]. Low-E window films are spectrally selective and this provides the reduction of undesirable solar heat gain by preventing the near-infrared radiation of the sun from entering the building, thereby providing better thermal comfort with lower cooling loads in summer. These can also help to keep the indoor environment warm by reflecting the longwave infrared radiation losses in the winter [13,19]. Most common in Swedish historical buildings are double-glazed windows (Figure 1). The recommended position of the window films in the glazing systems can vary based on the climate. For example, for a cold climate, putting the low-E film in the cavity between the panes, i.e., on surface 2 or 3 in Figure 1 [31], is suggested. However, in many cases, this positioning may not be feasible for an existing window and the only option is to add the film to the inward-facing surface of the inner pane (surface 4 in Figure 1), which could decrease the effectiveness of the film [13].
Amirkhani et al. [13] simulated the impact of a commercially available low-E window film on the energy consumption of a hotel in UK. The results of the study showed that the low-E window film could reduce the heating and cooling consumption by 3% and 20%, respectively, leading to a 2.7% total saving in energy consumption. It was also discovered that the window film contributed to a relevant reduction of energy consumption during the peak heating- and cooling-dominant times of the year. The authors finally concluded that the low-E window film showed better results in terms of energy savings than the solar control film, which was previously investigated by Bahadori-Jahromi et al. [30] for the same hotel. Winckler et al. [27] investigated the impacts of four commercial window films, including a reflective film, a neutral film, a conventional low-E film and an optimized low-E window film, on the performance of a typical large office building in a variety of climates in the US. The study showed that the optimized low-E window film produced more than seven times the heating-season savings of the reflective film. It was also noted that, although the SHGC of the optimized low-E film is higher than that of the reflective film, the optimized low-E film contributed to a 7% cooling load reduction, compared with the 5.2% cooling saving of the reflective film. This was because, in addition to blocking solar heat gain, the optimized low-E window films prevented the radiated heat from the warmer outdoor objects from entering the building. The authors finally concluded that the optimized low-E window film improves the window insulating performance sufficiently, giving single-pane windows dual-glazed performance.
Like other window retrofitting measures, low-E films may have some drawbacks that can affect their positive impacts. Jelle et.al [19] highlighted some of the disadvantages of self-applicable low-E films, including giving windows a slight tint, impairing visibility and transmitted light and allowing bubbles to form between the film and the glass due to improper installation. Amirkhani et al. [13] also mentioned the relatively high production cost of low-E films as an obstacle to a wider application of these coatings. The authors recommended considering the cost of purchase and installation of the window films alongside their benefits before making a decision. Saadatian et al. [32] stated that low-E window films can also increase the embodied impacts of window solutions, which can be damaging to the environment. However, this drawback can be offset by a wise selection of frames and glazing.
Overall, windows are essential aesthetic parts of a building that provide natural light and can allow for a flow of fresh air as ventilation. However, old and inefficient windows can cause energy loss and indoor thermal discomfort. As a simple non-intrusive window retrofitting method, the application of low-E window films has attracted researchers’ attention because they can be applied to existing windows without having to replace the entire window, thus dispensing with the need for extra work, and possibly, the evacuation of the building’s occupants.
The effects of some of the commercially available low-E window films on the energy performance of commercial, residential and hotel buildings have been investigated. Some studies also investigated them from an economic viewpoint. However, in real projects, before the application of these films, it is important to extend the domain of the assessment of low-E window film applications so that it covers the main aspects that are important to the investors and occupants. Based on the literature review, there is still a need for such a comprehensive assessment. Furthermore, the use of these films as a non-intrusive window retrofitting option for historical buildings that have to comply with strict retrofit regulations has not received much attention. These points indicate a knowledge gap. The current study aims to fill this gap by investigating the impacts of the application of a commercially available low-E window film—Thinsulate Climate Control 75 (CC75, 3M Company)—on a historical building through a more inclusive assessment which is based on three main pillars: energy performance, thermal comfort and cost analysis (payback and LCC). Figure 2 shows the comprehensiveness of the study.

2. Case Study

In this research, a three-story historical stone building named Rådhuset (City Hall) in the cold climate of the town Gävle in Sweden is investigated. Rådhuset was built between 1784 and 1790, but has been converted to an office building for municipal staff with a floor area of 1480 m2, including 37 offices, a basement and an attic. This historical building has strict retrofit regulations that forbid any modifications being made that affect the aesthetic of the envelope externally. The building has heavy construction with the average floor to ceiling height of 4 m. Figure 3 shows the plan of the building’s first floor and the south-east-facing façade of the building. There are 76 double-glazed windows with wooden frames on the façades of the building; 52 of them are on the façades facing north-west and south-east (26 windows on each), and 24 are on the façades facing north-east and south-west (12 windows on each). Table 1 and Table 2, based on the previous studies conducted by Mattsson et al. [33], Bakhtiari et al. [34] and Björk et al. [35], show the building’s construction data and the linear heat loss coefficient for thermal bridges of different types of joints, respectively. Table 3 indicates the technical data for a typical entire window. The building is also connected to the local district heating network that provides heat for radiators placed below windows and for domestic hot water and heating coils in the air handling units.

3. Methodology

This research aims to investigate the effects of the selected low-emissivity window film on the thermal comfort and energy performance of the historical stone building “Rådhuset”. The simulation software used in this research is IDA Indoor Climate and Energy (ICE), version 4.8, licensed by EQUA Simulation AB, Sweden [36]. IDA ICE is a commonly used dynamic simulation tool validated by several studies [37,38]. This simulation tool calculates energy balances while dynamically considering climatic variations and varying time steps. In IDA ICE, heat balance equations are solved according to the user-defined building geometry, construction, HVAC conditions and internal heat loads [38]. The simulations also offer the possibility to create a 3D model of the building, import a measured climate and weather file of the building location and predict energy loads, thermal comfort and the indoor air quality of the building for different periods of time [37,38]. As shown in Figure 4, the research process has been divided into four main stages. The first stage involves the data collection, creating the base model of the building (case A) in IDA ICE, running a one-year simulation and the validation of the base model. In the second stage, the low-E window film is incorporated into case A and a new one-year simulation for the developed model (case B) is conducted. In the third stage, the simulation results of case A and case B are compared with each other. Finally, based on the result of the third stage, a cost analysis is conducted to estimate the payback and a life cycle cost analysis is carried out on the method used for the window retrofit.
The 3D model of the building shown in Figure 5 is created using the building’s plans as well as the data set out in Table 1, Table 2 and Table 3. The air handling unit of the building modeled in IDA ICE is a constant air volume system (CAV) for which the supply air and return air is 1.3 L/(s∙m2). The building also has a heat pump for cooling supply air, with a SCOP of 3. The indoor temperature is adjusted to stay within 21 °C (heating zone set point) and 25 °C (cooling zone set point). Regarding the air infiltration rate, the wind-driven flow method in IDA ICE is chosen and the results of the blower-door test indicate an air permeability equal to 0.84 L/(s∙m2) at the pressure difference of 50 Pa. For the building, a total of 59 occupants with 59 units of equipment (each unit with the power of 125 W) are considered. The considered activity level for each person is 1.2 met, equivalent to tasks in an office environment, and the operation schedule is adjusted between 6:00 and 18:00 on weekdays.
To validate the IDA ICE model, a one-year simulation using the climate data of Gävle city is run to estimate the energy consumption of the building. In this study, the simulation was run for the period “01.01.2018 to 31.12.2018” to be consistent with the field test that was conducted in 2018 by Mattsson et al. [33], who measured the thermal and optical properties of the windows (see Table 3 and Table 4. In this building, most of the energy is consumed for heating purposes, which is supplied by the local district heating network. Therefore, for the validation of the model, the district heating-related energy consumption simulated by IDA ICE is compared with the building’s district heating energy bills. Acceptable discrepancies are for a Normalized Mean Bias Error ±10% (ASHRAE Guideline 14) and, for example, Molin et al. [39] considered a deviation of 7% between the annual simulated energy use and the energy bills as good agreement; i.e., an uncertainty of that magnitude could also be expected in our case.
After the validation of the IDA ICE model of the building, the low-E window film is incorporated into the base model (case A). An essential quality of the tested film is its low emissivity—about 0.15 according to the manufacturer—which would be expected to considerably reduce heat transfer by radiation in the window. The window film specification applied to a double-clear glazed window presented by the manufacturer is shown in Table 5. In this study, the low-E window film is applied to the outward-facing surface of the internal pane of the window (surface 3), as shown in Figure 6. Table 4 represents the technical data for the entire window in the presence of the low-E film. Figure 7 also illustrates the installation of the low-E film on surface 3 of the window. The next step is to run a new one-year simulation for the developed model (case B) for the same period and climate data used in the base model.
The third step is to compare the simulation results of the base model (case A) and the developed model (case B). The main areas for comparison include the building’s energy consumption as well as the thermal comfort status based on Fanger’s comfort indices and the EN 16798-1 standard. Table 6 represents the four categories of buildings in standard EN 16798-1 according to the occupants’ level of expectations. In this research, a normal level of thermal comfort expectations (category II) is chosen for the building’s thermal comfort assessment.
As shown in Table 7, according to EN 16798-1, for buildings belonging to category II, the PPD values (%) should be in the interval between 6% and 10%, and therefore PPD values greater than 10% correspond to comfort dissatisfaction. To have a good overall view of the building regarding thermal comfort, four indoor zones distributed over all four façades of the building are selected, as shown in Figure 8. In the selection process, priority is given to the zones that have more windows, occupants and equipment elements. Table 8 shows the number of occupants and equipment for the selected zones. Then, the results regarding thermal comfort in the chosen zones for case A and case B are compared.
Finally, based on the comparison of the two cases, a cost analysis using two methods is performed. These two are the simple payback period method, excluding the interest rate, and a life cycle cost (LCC) analysis.
The simple payback method is straightforward and uses a minimum input. The method works well for short term investment calculations, but does not capture the time-value of money nor the cash flow after the payback period; however, it can be used as a first screening device [41]. The general calculation method of the payback period is shown in the following Equation (1):
P a y b a c k   p e r i o d = I C Δ E · P e n e r g y
IC depicts initial investment costs (€), ∆E the amount of energy saved in a year (kWh/year) and Penergy the price of energy supplied by the district heating network (€/kWh).
Life cycle cost analysis is commonly used in building renovation projects [42] since the method considers long term investments and the time-value of costs and savings. Though difficult to predict, more inputs are needed for investigating the feasibility of energy investments. Important and influencing variables have to be assessed in every project [41], and the life cycle cost (LCC with unit €) can generally be formulated as:
L C C = I C + R e p l R e s + E C + O M & R
Here, IC is the initial investment cost, Repl is the present value of capital replacement costs, Res is the present value of residual costs, EC is the present value of energy costs and OM&R is the present value of non-fuel operating, maintenance and repair costs. In this context, initial investments and energy costs are in focus since the other costs will be independent regardless of whether the low-E film is applied. Moreover, replacement costs depend on the service life of the building or component. The low-E film has a warranty of 15 years once applied to the window [33]. Therefore, the service life is assumed to be 15 years (the emissivity will deteriorate over time), after which the film should be replaced.
The initial investment cost is based on a tender from a low-E film installer. Based on 2018 costs (10 SEK~1 €), material and work costs (including VAT) are 130 €/m2 + 15 €/window (giving 137 €/m2) [33]. For the solution without the low-E film, this cost is null.
To calculate the present value of energy costs, the discount rate and inflation rate have to be assessed. The real discount rate d is derived from the nominal discount rate D given the inflation rate I, as expressed in Equation (3):
d = 1 + D 1 + I 1
Another important variable is the anticipated price escalation P of the energy price. The real price escalation p can be estimated, given the inflation rate I according to Equation (4) below:
p = 1 + P 1 + I 1
These rates are used to calculate the net present value using the Modified Uniform Present Value factor (UPV*) [43] (Equation (5)), considering recurring annual costs at a constant price escalation rate p over n years:
U P V * = 1 + p d p · 1 1 + p 1 + d n
The present value energy cost EC (€) of Equation (2) is estimated with Equation (5), the annual energy cost of each energy type E (kWh/year) and the energy type price Penergy (€/kWh), giving a value as expressed in Equation (6):
E C = U P V * · E · P p r i c e
Since there is uncertainty in estimating future rates, the values are varied to ascertain their impact on results. The values used in this study are the same as those motivated and used in [44] (that study was performed at the same time and in approximately same geographic location). In this study, the chosen nominal discount rate is 5% and investigates rates at 4% and 6%, too. The chosen nominal price escalations are 2%, 3% and 4%. Inflation rate is set at 2% (the goal of the Central Bank in Sweden).
The cost of district heating in Gävle, for this building (recalculating considering capacity costs in 2018), is 0.078 €/kWh [33].

4. Results

4.1. Simulation Results and Validation of the Base Model of the Building (Case A)

As mentioned earlier, to validate the base model of the building, a one-year simulation is run prior to the application of the low-E window film. The results of the simulation for the base model (case A), presented in Figure 9, show that the highest and lowest share of the building’s annual energy consumption are 215,500 kWh and 6300 kWh for heating purposes and domestic hot water, respectively, which are both supplied by the district heating network. As mentioned before for the validation of the base model, the annual district heating-related energy consumption of the building (221,800 kWh, including heating and domestic hot water) estimated by the simulation should be compared with the annual district heating energy bills of the building, which are presented in Figure 10. As Figure 10 shows, the total amount of energy supplied by the local district heating network was 228,800 kWh in 2018. The comparison between the simulation results of the base model and the energy bills revealed a 3% difference between them (less than the 7% mentioned in the methodology section), indicating a reasonable validity of the IDA ICE base model.
Figure 11 and Figure 12 show the simulated monthly and annual heat transmission (only sensible heat) through the envelope, respectively, without considering the effect of solar radiation on the windows’ energy balance. As illustrated in Figure 11, January is the month when the highest amount of heat is lost through the envelope; the least heat is lost in July. Figure 12 also shows that walls, windows, and thermal bridges are responsible for 47.7%, 29.3% and 19.8% of the annual heat losses through the envelope, respectively.
The impact of solar radiation on the energy balance of windows is depicted in Figure 13. It is shown that in the heating season, the amount of heat lost through the windows is 52,600 kWh, excluding solar radiation, but this value drops to 42,700 kWh when solar radiation is taken into consideration. This means that solar radiation has offset about 19% of heat losses through the windows. In the cooling season, without considering solar radiation, the amount of heat lost through the windows is 17,400 kWh, while with solar radiation taken into account, 20,100 kWh of heat is gained through the windows. This indicates that the solar heat gain in the summer can make the indoor environment too warm, even in the cold climate of Sweden.
Figure 14 shows the number of annual discomfort hours during occupancy time in the selected thermal zones (see Table 8), based on EN 16798-1. It is shown that with its 1310 discomfort hours during occupancy time, zone 44, facing south-east, is the zone with the worst situation in terms of thermal comfort.
According to Figure 15, which shows the monthly predicted percentage of dissatisfied (PPD) and operative temperatures for the selected zones, building thermal comfort is an issue in the summer, whereas the rest of the time it is in line with the standard. Figure 15 illustrates that the average PPD values for zone 44 in June, July and August are 15%, 26.5% and 20.5%, respectively, which all exceed the limit of 10% stated in EN 16798-1. The average operative temperatures in these months are also above 27 °C, apparently causing discomfort for the occupants. As shown in Figure 15, the average PPD values for zone 4, zone 14 and zone 56 in July are 11.5%, 11.1% and 15.9%, respectively, indicating that, like zone 44, the thermal comfort for these zones in July does not meet the standard recommendations. The average operative temperatures in these zones in July are almost equal to or higher than 27 °C, showing indoor thermal discomfort. However, because of a lack of a consistent pattern of vacation, it was assumed in this research that the number of the occupants in the summer is the same as in the other months.
According to Table 9, which shows the status of thermal comfort for the entire building, thermal dissatisfaction constitutes 14% of the total occupancy hours. In the worst zone of the building (in terms of thermal comfort), the operative temperature for 42% of the total occupancy hours was above 27 °C and in the average zone the operative temperature for 18% of the total occupancy hours was above 27 °C.

4.2. Simulation Results with Low-Emissivity Window Films in Place (Case B)

Figure 16 shows the simulation results after the application of the low-E window film to the windows of the building. It illustrates that the annual energy consumption for heating purposes is 202,500 kWh, which constitutes the largest share (73.9%) of the total energy consumption of the building. Figure 17 and Figure 18, respectively show the monthly and annual heat transmission (only sensible heat) through the envelope without considering the effect of solar radiation on the windows’ energy balance. As illustrated in Figure 17, just as with case A, the highest amount of heat loss through the envelope occurs in January and the lowest loss occurs in July. According to Figure 18, the major sources of heat loss in the envelope are walls, thermal bridges and windows, which are responsible for 52.8% (119,600 kWh), 22% (49,800 kWh) and 21.7% (49,200 kWh) of the annual heat losses, respectively.
The effect of solar radiation on the energy balance of the windows equipped with the low-E film is depicted in Figure 19. We can see that 35,200 kWh of heat is lost through windows in the heating season, excluding solar radiation, while this amount drops to 27,400 kWh if the impact of solar radiation is considered. This means that the solar heat gain has offset 22% of the heat lost through the windows.
In the cooling season, the heat that is lost through the windows is 10,500 kWh excluding the solar radiation; if it is taken into consideration, the windows energy balance corresponds to a heat gain of 13,000 kWh.
Figure 20 shows that, like case A, zone 44 has more discomfort hours during occupancy time (1046 h) than the other selected zones. Based on the monthly PPD values and operative temperatures shown in Figure 21, for zone 4, the monthly PPD values and the operative temperatures for all the months except July are lower than 5% and 25 °C, respectively, showing that thermal comfort is nicely provided. In July, the average PPD is 8.6% and the average operative temperature is about 26.5 °C. Since the average PPD in this month is close to the limit of 10%, having some occupancy hours with thermal dissatisfaction is expected. For zone 14 and zone 56, the situation is almost the same as for zone 4; however, their average PPD values in July are 10% (equal to the limit) and 11.6% (higher than the limit), respectively. As depicted in Figure 21, zone 44 has the worst situation in terms of thermal comfort compared to the other selected zones. The PPD (and average operative temperatures) in this zone in June, July and August are 10.5% (26.9 °C), 21.3% (28.9 °C) and 16.3% (27.8 °C), respectively, showing some thermal discomfort. However, the PPDs and operative temperatures of this zone for the other months lie in the normal range, thus indicating that indoor thermal comfort is in line with the standard requirements.
As presented in Table 10, thermal dissatisfaction constitutes 11% of the building’s total occupancy hours. It is also represented that in the worst zone of the building (in terms of thermal comfort), the operative temperature for 35% of the total occupancy hours was above 27 °C and in the average zone, the operative temperature for 14% of the total occupancy hours was above 27 °C.

4.3. Comparison of Results

In the previous sections, it was discussed that the annual energy consumption of the building for heating purposes for case A (without the low-E window film) is 215,500 kWh, while for case B (with the low-E window film) this amount has dropped by 13,000 kWh (6%) and reached 202,500 kWh. The insignificant reduction in the electricity consumption of the building is due to the fact that the cooling capacity is the same in both cases, and so it is excluded from the comparison. Figure 22 shows that in the heating season, the application of the window film has helped to reduce the amount of heat lost through all the windows (including solar radiation) by about 36%, and in the cooling season, with the help of window films, the amount of heat gain through the windows (including solar gain) has dropped by 35%.
Figure 23 shows that the low-E window film helped to reduce the average PPD values of zones 4, 14 and 56 in July in which thermal comfort was an issue. According to Figure 24, for zone 44, with the help of the film, the average PPD values in June, July and August decreased from 15%, 26.5% and 20.5% to 10.5%, 21.3% and 16.3%, respectively; however, the figures indicate that the PPD is often beyond the limit of 10% in this zone. Figure 25 illustrates the reduction in annual discomfort hours during occupancy time in all the selected zones. Since they had an almost 39% and 10.6% reduction in the number of discomfort hours, zone 56 and zone 14 experienced the largest and smallest reduction, respectively, of all the selected zones.
According to Table 11, the application of the low-E film reduced the percentage of total occupancy hours with thermal dissatisfaction from 14% to 11%, including all occupied rooms in the building. It is also shown that with the help of the low-E film, the percentage of hours during which the operative temperature was above 27 °C for the worst and average zones dropped from 42% and 18% to 35% and 14%, respectively.

4.4. Cost Analysis

As previously mentioned, the use of the low-E window film resulted in a 13,000 kWh reduction in the building’s district heating-related energy consumption. Equation (1) in Section 3 gives a payback period of about 30 years with the low-E window film application. This is twice the length of the warranty time.
The LCC results are illustrated in Figure 26, where these are clustered for the nominal discount rate (D) and price escalation (P), keeping in mind that the inflation rate is 2%. For all these cases, application of the low-E film turns out to be costlier. The initial investment cost for the low-E film is 21.3 k€, but the energy savings will not cover this cost over time. However, increased price escalation obviously decreases the difference. Lower discount rates also indicate lower differences in comparison to higher rates. The incentive to install the low-E film increases with decreased discount rate.
If the life span of the low-E film is doubled to 30 years, the trend of the results changes (see Figure 27). By a small margin, the low-E film is more economical for the cases of low discount rates and when price escalations are high.

5. Discussion

In this section, the improvements associated with the use of the low-E window film are summarized from three different perspectives, which are “energy saving”, “thermal comfort” and “cost analysis”.
Energy saving
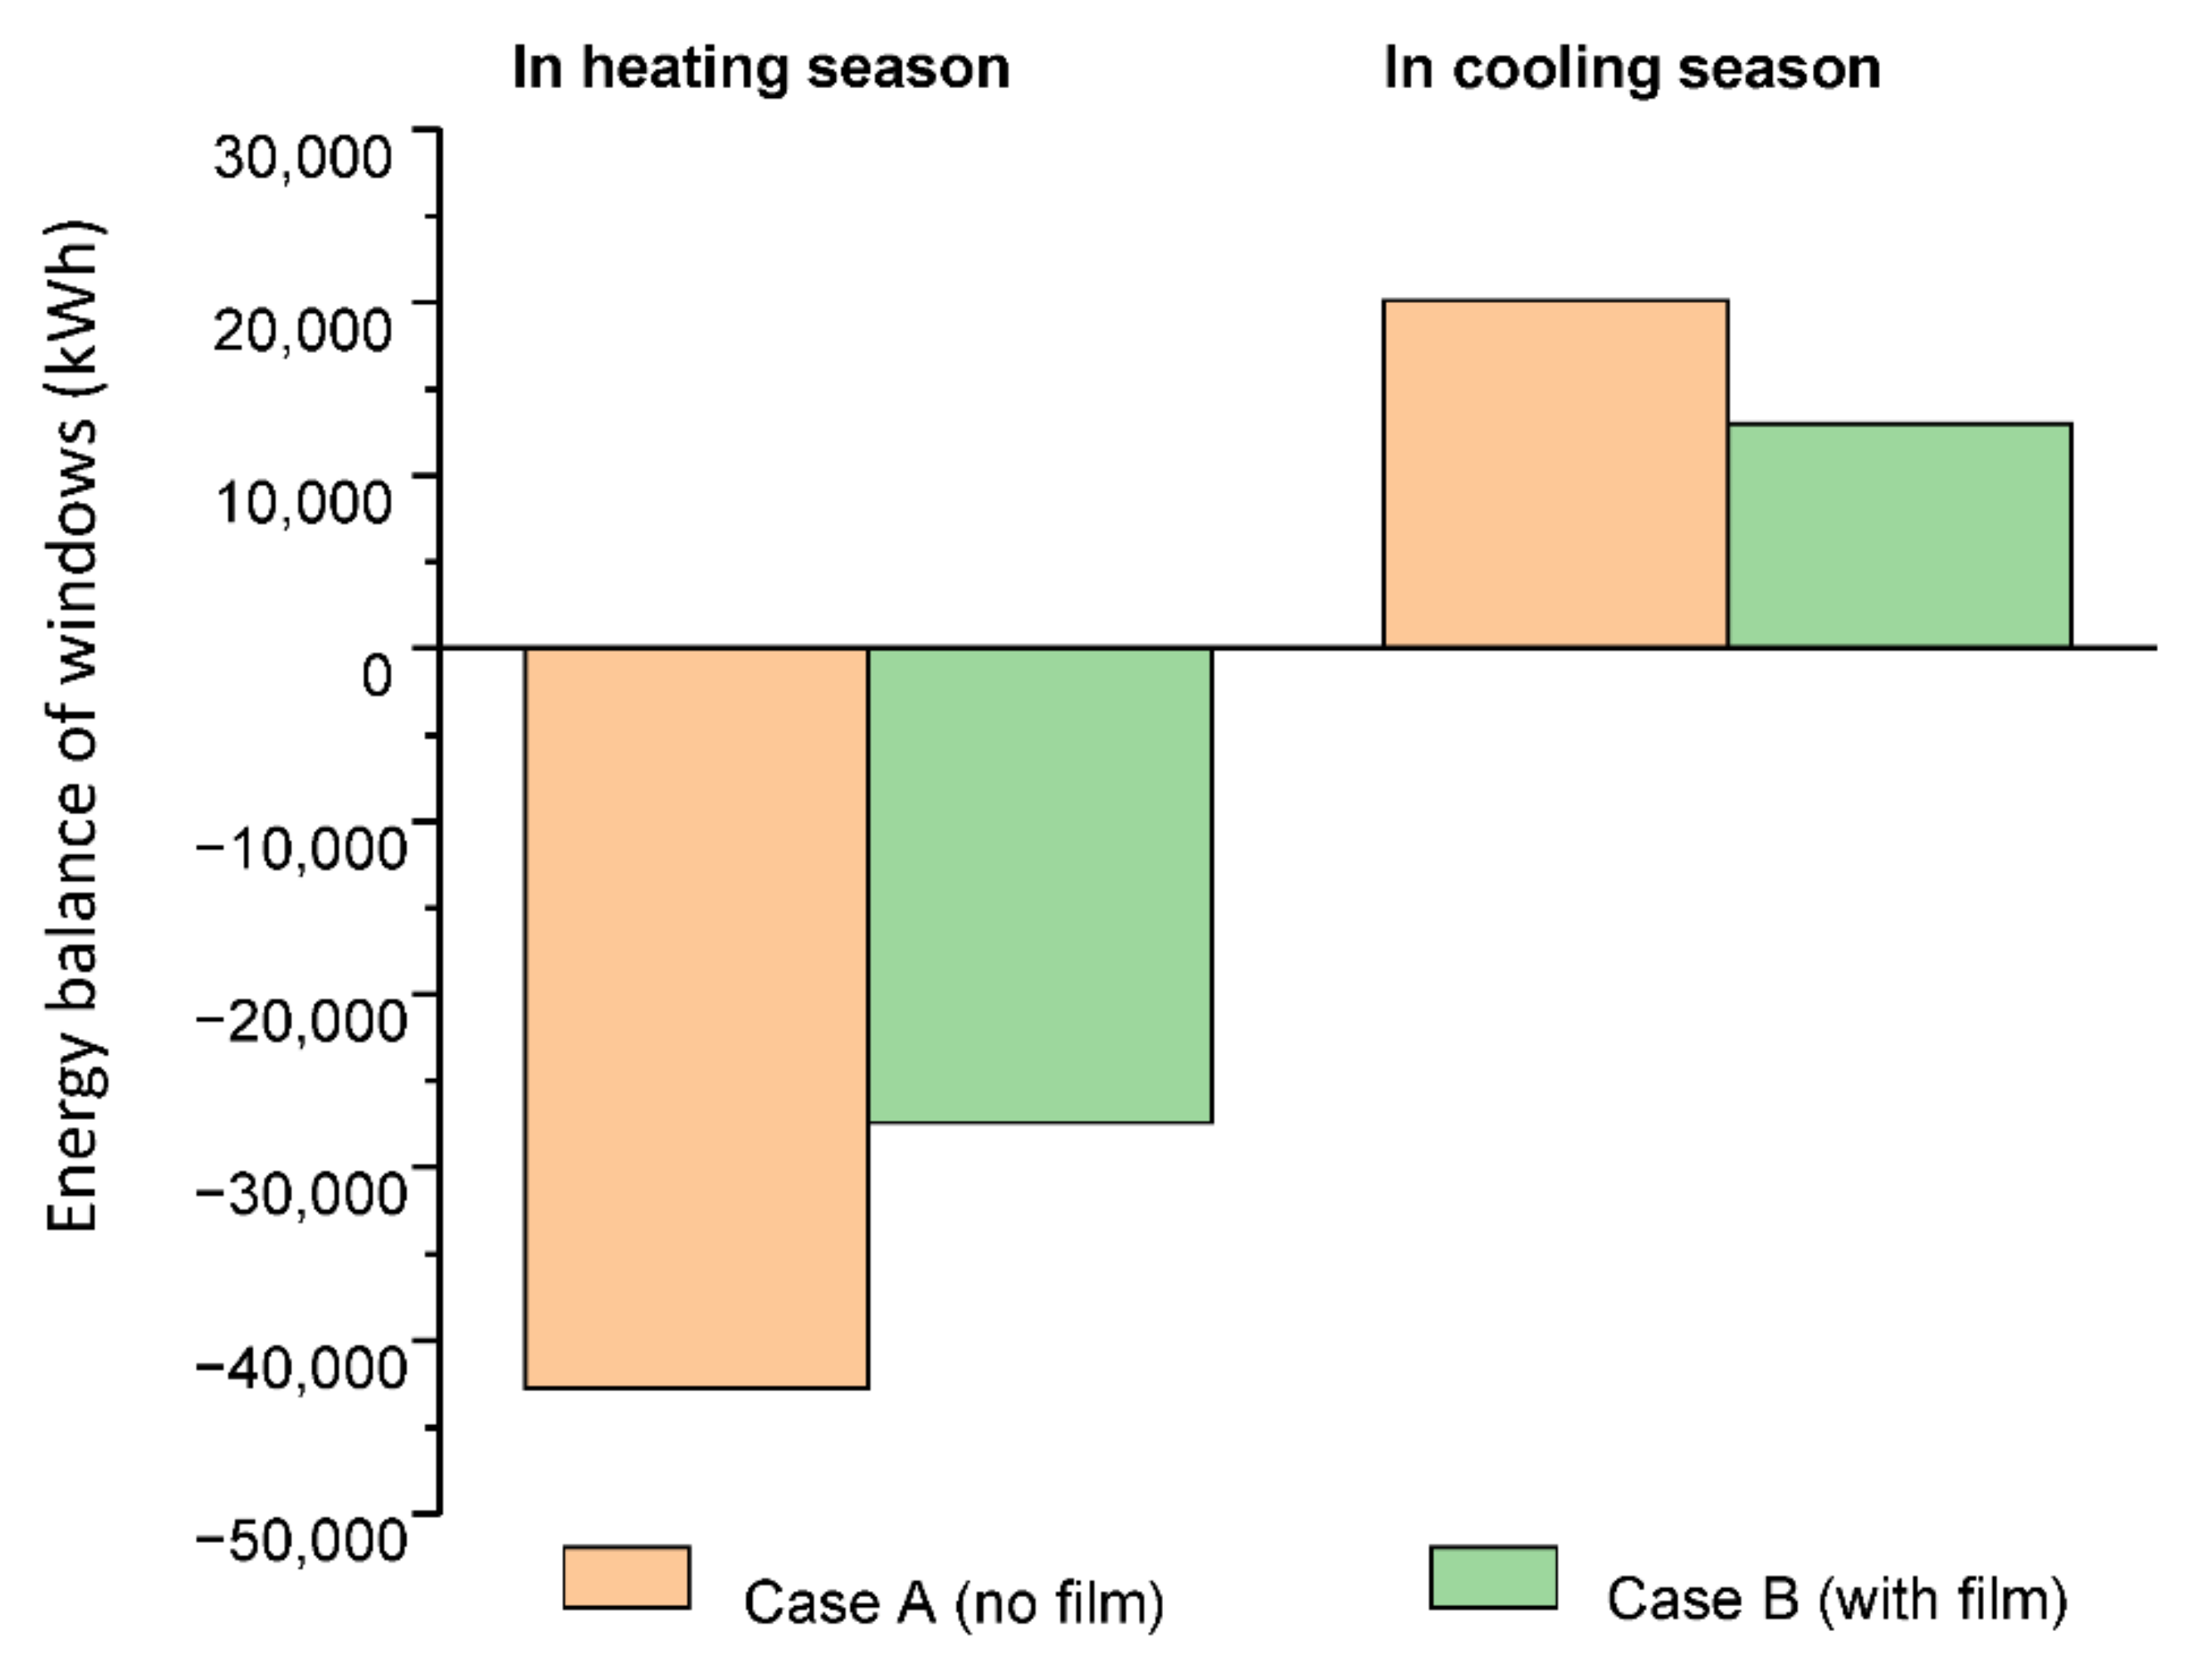
Figure 22 showed that with the use of the low-E window film, a 36% reduction in heat loss through the windows (including solar radiation) during the heating season and a 35% reduction in the amount of heat gain through windows (including solar radiation) during the cooling season have been achieved. The application of the low-E window film helped to reduce the building’s annual energy consumption for heating purposes by about 6%, despite some solar radiation that would contribute to heating being impeded. To confirm the accuracy of the 6% reduction, a sensitivity analysis consisting of 5 scenarios was conducted. Scenarios were made by changing the U-value of the original windows, the minimum and maximum temperature setpoint for heating controller and the U-value of the external walls in a way that each scenario represented a new deviation from the energy bills. The magnitude of scenarios’ deviations from the energy bills ranged between +0.7% and −16.7% (see Table A1 in Appendix A). The results of the analysis showed that the annual heating energy reductions due to the application of the low-E window film in all the scenarios remained in the range of 5.7% to 6.3%, thus warranting rounding the value to 6%.
From the energy viewpoint, the results of this research are consistent with the literature review, in which it was stated that low-E window films can be effective in reducing unwanted heat losses in the winter, and by controlling the solar radiation in the summer, they can reduce excessive heat gains.
At the same time, the sensitivity analysis insinuates that the low-E film would have a larger relative impact if the U-value of the walls were lower. In this case study, the transmission losses are larger through walls than the windows without film. This is partially due to the relatively low U-value for the windows, owing to large sizes (and therefore thick/massive wood frames) and a larger share of the frame in relation to glazed parts of the window. Smaller windows with smaller frames usually have higher U-values. This implies that for buildings where thermal losses through windows are larger than walls, low E-films will have a more significant impact on the relative energy saving. In Sweden, double-glazed windows in single-family buildings account for the largest share of over-all thermal losses. Low E-film application in single-family buildings in cold climate is thus a field for further investigation.
Thermal comfort
According to the monthly PPD values and operative temperatures shown in Figure 15, in the four selected zones, thermal comfort during the heating season is not an issue in the studied building because the heating capacity is adequate, but during the summer, mostly because of solar radiation and the limited and constant cooling capacity, it often gets warmer than the recommendation in EN 16798-1. Figure 14 and Figure 15 showed that zone 44, facing south-east, has the worst situation in terms of thermal comfort. This could be due to it having more internal heat gains (more occupants and equipment) and receiving more solar radiation (because of its orientation) than the other selected zones. As illustrated in Figure 23, Figure 24 and Figure 25, the application of the low-E window film helped to reduce the monthly PPD values and annual discomfort hours during occupancy time for all the selected zones. However, thermal comfort for zone 56 (facing south-east and north-east) in July and for zone 44 (facing south-east) in June, July and August still did not fully comply with EN 16798-1.
According to Table 11, in the presence of the low-E window film, the percentage of total occupancy hours with thermal dissatisfaction in the building dropped from 14% to 11%, thereby indicating the entire building’s thermal comfort improvement. However, for the building to fully comply with the thermal comfort requirements of EN 16798-1, other supplementary control strategies must be adopted.
Cost analysis
The cost analysis of the low-E window film retrofit showed a payback period of almost 30 years. An LCC analysis is, in this case, consistent with the payback period, provided that the film’s service life is also 30 years (the warranty for commercial buildings is 15 years). This rather long payback period is due to two main factors, first, the relatively low cost of district heating and second, the high price of the applied low-E window film. When setting the service life of the film equal to the warranty time, the film was not economical. When the service life was assumed to be 30 years, the film is economical when price escalations are relatively high and the discount rate low—with small margins.
The economic results would be different if the building was heated with electricity. The price of electricity is almost twice of that used in this study. Though most commercial buildings in Sweden use district heating (77%), there are historic buildings in district heating areas and elsewhere that use electric heating to avoid intrusive systems such as hydronic pipes, for example, in churches. The economic benefits of low-E films in such buildings would be different from this study.
According to the literature review, the cost of applying low-E window films is usually cheaper than replacing an entire window. Another point that should be taken into consideration is that, in this research, the case study building is a historical building, which limits the retrofit options; therefore, the positive impacts of the low-E window film on the windows’ performance and its compliance with the building’s strict retrofit regulations may somewhat counter its relatively long payback period.

6. Conclusions

This research aimed to investigate the impacts of a non-intrusive and commercially available low-emissivity window film (3M Thinsulate Climate Control 75) on the energy performance and thermal comfort of a historical stone building in the cold climate of Gävle, using the simulation software IDA ICE. It was found that the application of the tested low-emissivity window film helped to reduce heat losses through the glazed parts in winter by about 36%, resulting in a 6% reduction in the annual district heating-related energy consumption of the building. Based on the thermal comfort analysis, it was discovered that, thanks to the adequate heating capacity, thermal comfort during the heating season was not an issue, but during the summer, a 35% reduction in the unwanted heat gains due to the application of the low-E window film improved the thermal comfort, so that the percentage of total occupant hours with thermal dissatisfaction fell from 14% (without films) to 11% (with films). However, the relatively high price of the films and low price of district heating combine to result in a rather long payback period of around 30 years. Thus, the films seem scarcely attractive from a pure economical viewpoint, but their use may be warranted for energy/environmental and thermal comfort reasons. The domain of this study could be further extended by investigating other commercially available low-E films followed by in situ measurements for all the windows of the building and simultaneously adopting other solar control strategies in line with the historical retrofit regulations. Additionally, the effect of the thermal mass of the building would be relevant for investigation. In the studied historical stone building, the thermal mass was very high, resulting in, e.g., damped temperature rises in the event of sudden solar radiation through the windows. In a building of lighter construction, the solar-reflecting effects of the film would probably be even more valuable.

Author Contributions

S.A.M.: Writing—Original Draft, Software, Conceptualization, Methodology, Visualization; M.M.: Supervision, Validation, Review and Editing, Resources, Field investigation; A.A.: Supervision, Software, Validation, Visualization, Review & Editing,; J.A.: Writing—Review & Editing, Methodology, Formal analysis, Resources, Field investigation, Publication process correspondence; M.G.D.S.: Conceptualization, Review and Editing, Methodology, Resources; N.S.: Conceptualization, Review and Editing, Methodology, Resources. All authors have read and agreed to the published version of the manuscript.

Funding

University of Gävle: The project was co-funded by the Swedish Energy Agency (Energimyndigheten) within the program “Spara och Bevara” (Proj nr. 43985-1/HiG Forsk 2016/165) and the University of Gävle. University of Coimbra: Part of this work was supported by Compete 2020, under the project RETROSIM—Multi-objective building retrofit, simulation and monitoring on-line optimization tool for improving energy efficiency in buildings with the reference PTDC/EME-SIS/32503/2017 and POCI-01-0145-FEDER-032503.

Institutional Review Board Statement

Not applicable.

Informed Consent Statement

Not applicable.

Data Availability Statement

Not applicable.

Conflicts of Interest

The authors declare no conflict of interest.

Appendix A

Table A1. Summary of sensitivity analysis regarding impact of total heating variation on energy savings attained by film installation.
ScenarioChanged Parameters Annual District Heating-Related Energy Use
ParameterBase Model 4After Change (Change %)without Low-E Window Film (kWh)Deviation from Energy Bills (%)with Low-E
Window Film (kWh)
Savings by the Low-E Film (%)
1TmH 1 (°C)2119
(−9.5%)
190,500−16.7179,0006
2TmH (°C)2121.5
(+2.5%)
230,500+0.7217,0005.9
3Uwin2
( W / m 2 · K )
2.302.41
(+5%)
224,700−1.8210,6006.3
4Uwin
( W / m 2 · K )
2.302.18
(−5%)
212,700−7200,7505.7
5Uwall3
( W / m 2 · K )
0.810.845
(+4.5%)
226,800−0.8213,6005.8
1TmH = Minimum or maximum temperature setpoint for heating controller. 2 Uwin = U-value of the entire window. 3 Uwall = U-value of the external walls. 4 Complete input data regarding the base model without the low-E film can be found in Table 1 and Table 3. Annual energy bills for district heating = 228,800 kWh (see Figure 10). Annual district heating-related energy for the base simulation model: 221,800 kWh (see Figure 9).

References

  1. Webb, A.L. Energy retrofits in historic and traditional buildings: A review of problems and methods. Renew. Sustain. Energy Rev. 2017, 77, 748–759. [Google Scholar] [CrossRef]
  2. Bakhtiari, H.; Akander, J.; Cehlin, M. Advances in Building Energy Research Evaluation of thermal comfort in a historic building refurbished to an office building with modernized HVAC systems. Adv. Build. Energy Res. 2020, 14, 218–237. [Google Scholar] [CrossRef]
  3. Troi, A.; SpiekMan, M.; Bastian, Z. Energy retrofit of cultural heritage buildings. REHVA J. 2014, 51, 24–27. [Google Scholar]
  4. González, C.M.M.; Rodríguez, A.L.L.; Medina, R.S.; Jaramillo, J.R. Effects of future climate change on the preservation of artworks, thermal comfort and energy consumption in historic buildings. Appl. Energy 2020, 276, 115483. [Google Scholar] [CrossRef]
  5. Piasecki, M.; Radziszewska-Zielina, E.; Czerski, P.; Fedorczak-Cisak, M.; Zielina, M.; Krzyściak, P.; Kwaśniewska-Sip, P.; Grześkowiak, W. Implementation of the indoor environmental quality (Ieq) model for the assessment of a retrofitted historical masonry building. Energies 2020, 13, 6051. [Google Scholar] [CrossRef]
  6. El-darwish, I.; Gomaa, M. Retrofitting strategy for building envelopes to achieve energy efficiency. Alex. Eng. J. 2020, 56, 579–589. [Google Scholar] [CrossRef] [Green Version]
  7. Herrera-Avellanosa, D.; Haas, F.; Leijonhufvud, G.; Brostrom, T.; Buda, A.; Pracchi, V.; Webb, A.L.; Hüttler, W.; Troi, A. Deep renovation of historic buildings: The IEA-SHC Task 59 path towards the lowest possible energy demand and CO2 emissions. Int. J. Build. Pathol. Adapt. 2020, 38, 539–553. [Google Scholar] [CrossRef]
  8. Cabeza, L.F.; Chàfer, M. Technological options and strategies towards zero energy buildings contributing to climate change mitigation: A systematic review. Energy Build. 2020, 219, 110009. [Google Scholar] [CrossRef]
  9. Schibuola, L.; Scarpa, M.; Tambani, C. Innovative technologies for energy retrofit of historic buildings: An experimental validation. J. Cult. Herit. 2018, 30, 147–154. [Google Scholar] [CrossRef]
  10. Scorpio, M.; Ciampi, G.; Rosato, A.; Maffei, L.; Masullo, M.; Almeida, M.; Sibilio, S. Electric-driven windows for historical buildings retrofit: Energy and visual sensitivity analysis for different control logics. J. Build. Eng. 2020, 31, 101398. [Google Scholar] [CrossRef]
  11. Ginks, N.; Painter, B. Energy retrofit interventions in historic buildings: Exploring guidance and attitudes of conservation professionals to slim double glazing in the UK. Energy Build. 2017, 149, 391–399. [Google Scholar] [CrossRef]
  12. Ariosto, T.; Memari, A.M.; Solnosky, R.L. Development of designer aids for energy efficient residential window retrofit solutions. Sustain. Energy Technol. Assess. 2019, 33, 1–13. [Google Scholar] [CrossRef]
  13. Amirkhani, S.; Bahadori-Jahromi, A.; Mylona, A.; Godfrey, P.; Cook, D. Impact of Low-E window films on energy consumption and CO2 emissions of an existing UK hotel building. Sustainability 2019, 11, 4265. [Google Scholar] [CrossRef] [Green Version]
  14. Yin, R.; Xu, P.; Shen, P. Case study: Energy savings from solar window film in two commercial buildings in Shanghai. Energy Build. 2012, 45, 132–140. [Google Scholar] [CrossRef]
  15. Park, J.J.; Kim, Y.I.; Chung, K.S. Infiltration and heating load analysis of an apartment with respect to window type, window location, and lock operation. ASHRAE Conf. 2017, 123, 201–214. [Google Scholar]
  16. Yoon, S.H.; Yoon, Y.B.; Lee, K.H. Inside air and surface temperature characteristics of window systems depending on low-E coating and blind location during cooling period. Mater. Res. Innov. 2014, 18, S2457–S2461. [Google Scholar] [CrossRef]
  17. Pal, S.K.; Alanne, K.; Jokisalo, J.; Siren, K. Energy performance and economic viability of advanced window technologies for a new Finnish townhouse concept. Appl. Energy 2016, 162, 11–20. [Google Scholar] [CrossRef]
  18. Cuce, E. Role of airtightness in energy loss from windows: Experimental results from in-situ tests. Energy Build. 2017, 139, 449–455. [Google Scholar] [CrossRef]
  19. Jelle, B.P.; Kalnæs, S.E.; Gao, T. Low-emissivity materials for building applications: A state-of-the-art review and future research perspectives. Energy Build. 2015, 96, 329–356. [Google Scholar] [CrossRef] [Green Version]
  20. Karlsson, J.; Roos, A. Annual energy window performance vs. glazing thermal emittance-The relevance of very low emittance values. Thin Solid Films 2001, 392, 345–348. [Google Scholar] [CrossRef]
  21. Cuce, E.; Riffat, S.B. A state-of-the-art review on innovative glazing technologies. Renew. Sustain. Energy Rev. 2015, 41, 695–714. [Google Scholar] [CrossRef]
  22. Curcija, C.; Goudey, H.; Mitchell, R.; Manes, L.; Selkowitz, S. Liquid-Applied Absorbing Solar Control Window Film Retrofit; Lawrence Berkeley National Laboratory: Berkeley, CA, USA, 2014.
  23. Lee, J.W.; Jung, H.J.; Park, J.Y.; Lee, J.B.; Yoon, Y. Optimization of building window system in Asian regions by analyzing solar heat gain and daylighting elements. Renew. Energy 2013, 50, 522–531. [Google Scholar] [CrossRef]
  24. Sarihi, S.; Saradj, F.M.; Faizi, M. A Critical Review of Façade Retrofit Measures for Minimizing Heating and Cooling Demand in Existing Buildings. Sustain. Cities Soc. 2021, 64, 102525. [Google Scholar] [CrossRef]
  25. Arici, M.; Karabay, H.; Kan, M. Flow and heat transfer in double, triple and quadruple pane windows. Energy Build. 2015, 86, 394–402. [Google Scholar] [CrossRef]
  26. Ascione, F.; de Rossi, F.; Vanoli, G.P. Energy retrofit of historical buildings: Theoretical and experimental investigations for the modelling of reliable performance scenarios. Energy Build. 2011, 43, 1925–1936. [Google Scholar] [CrossRef]
  27. Winckler, L.; Debusk, S. Low-Emissivity, Energy-Control, Retrofit Window Film: Final Report; Work Performed Under Agreement July, 2012 Project; Cpfilms Incorporated: Fieldale, VA, USA, 2012. [Google Scholar]
  28. Xamán, J.; Álvarez, G.; Chávez, Y.; Arce, J. Thermal analysis for a double glazing unit with and without a solar control film (SnS–Cu x S) for using in hot climates. Energy Build. 2011, 43, 704–712. [Google Scholar] [CrossRef]
  29. Li, C.; Tan, J.; Chow, T.T.; Qiu, Z. Experimental and theoretical study on the effect of window films on building energy consumption. Energy Build. 2015, 102, 129–138. [Google Scholar] [CrossRef]
  30. Bahadori-jahromi, A.; Rotimi, A.; Mylona, A.; Bohdanowicz, P. Impact of Window Films on the Overall Energy Consumption of Existing UK Hotel Buildings. Sustainability 2017, 9, 731. [Google Scholar] [CrossRef] [Green Version]
  31. A Basic Guide to Low e Windows. 2021. Available online: www.worldsgreatestwindow.com; https://www.slideshare.net/worldsgreatestwindow/a-basic-guide-to-low-e-windows (accessed on 2 March 2021).
  32. Saadatian, S.; Freire, F.; Simões, N. Embodied impacts of window systems: A comparative assessment of framing and glazing alternatives. J. Build. Eng. 2021, 35, 102042. [Google Scholar] [CrossRef]
  33. Mattsson, M.; Akander, J.; Ameen, A.; Karlsson, B. Fältstudie av Två Metoder för Energieffektivisering av Äldre Fönster—Fönsterfilmer Testade Med Hotbox-Teknik; Högskolan i Gävle: Gävle, Sweden, 2020. [Google Scholar]
  34. Bakhtiari, H.; Akander, J.; Cehlin, M.; Hayati, A. On the Performance of Night Ventilation in a Historic Office Building in Nordic Climate. Energies 2020, 13, 4159. [Google Scholar] [CrossRef]
  35. Björk, C.; Kallstenius, P.; Reppen, L. Så Byggdes Husen 1880–1980: Arkitektur, Konstruktion Och Material I Våra Flerbostadshus under 120 År, 5th ed.; Stockholms Stadsbyggnadskontor: Stockholm, Sweden, 1983. [Google Scholar]
  36. EQUA Simulation AB. IDA Indoor Climate and Energy 4.8. 2018. Available online: https://www.equa.se/en/ (accessed on 1 April 2019).
  37. Hesaraki, A.; Holmberg, S. Energy performance of low temperature heating systems in fi ve new- built Swedish dwellings: A case study using simulations and on-site measurements. Build. Environ. 2013, 64, 85–93. [Google Scholar] [CrossRef] [Green Version]
  38. Hilliaho, K.; Lahdensivu, J.; Vinha, J. Glazed space thermal simulation with IDA-ICE 4. 61 software—Suitability analysis with case study. Energy Build. 2015, 89, 132–141. [Google Scholar] [CrossRef]
  39. Molin, A.; Rohdin, P.; Moshfegh, B. Investigation of energy performance of newly built low-energy buildings in Sweden. Energy Build. 2011, 43, 2822–2831. [Google Scholar] [CrossRef]
  40. EU. European Standard, EN 16798-1; EU: Brussels, Belgium, 2019. [Google Scholar] [CrossRef]
  41. Yard, S. Developments of the payback method. Int. J. Prod. Econ. 2000, 67, 155–167. [Google Scholar] [CrossRef]
  42. Pombo, O.; Rivela, B.; Neila, J. The challenge of sustainable building renovation: Assessment of current criteria and future outlook. J. Clean. Prod. 2016, 123, 88–100. [Google Scholar] [CrossRef]
  43. Fuller, S.K.; Petersen, S.R. Life-Cycle Costing Manual of the US Federal Energy Management Program; National Institute of Standards and Technology, U.S. Department of Commerce: Washington, DC, USA, 1995.
  44. Khadra, A.; Hugosson, M.; Akander, J.; Myhren, J.A. Economic performance assessment of three renovated multi-family buildings with different HVAC systems. Energy Build. 2020, 224, 110275. [Google Scholar] [CrossRef]
Figure 1. Surface numbering definitions at a double-glazed window.
Energies 14 07584 g001
Figure 2. Flow chart of the current study.
Energies 14 07584 g002
Figure 3. Rådhuset building: (a) plan of the first floor; (b) photo of south-east-facing façade [2].
Energies 14 07584 g003
Figure 4. Overview of the research process.
Energies 14 07584 g004
Figure 5. The 3D model of the building in IDA ICE.
Energies 14 07584 g005
Figure 6. Position of the applied low-E film in the window.
Energies 14 07584 g006
Figure 7. Installation of the low-E window film on surface 3 [33].
Energies 14 07584 g007
Figure 8. Position of the selected indoor zones for thermal comfort investigation: (a) zone 4 facing north-west and southwest; (b) zone 14 facing southwest and southeast; (c) zone 44 facing southeast; (d) zone 56 facing northeast and southeast.
Energies 14 07584 g008
Figure 9. Breakdown of the building’s annual energy consumption (kWh) for the base model simulation (case A).
Energies 14 07584 g009
Figure 10. The building energy bills for district heating in 2018, collected from Gavlefastigheter AB.
Energies 14 07584 g010
Figure 11. Monthly heat transmission (only sensible heat) through the envelope in case A (no low-E film).
Energies 14 07584 g011
Figure 12. Annual sensible heat transmission through the envelope (kWh) in case A (no low-E film).
Energies 14 07584 g012
Figure 13. Energy balance of windows with and without considering solar radiation in case A (no low-E film).
Energies 14 07584 g013
Figure 14. Number of annual discomfort hours during occupancy time based on EN 16798-1 in case A (no low-E film).
Energies 14 07584 g014
Figure 15. Monthly predicted percentage of dissatisfied (PPD (%)) and operative temperatures for zone 4, zone 14, zone 44 and zone 56 in case A (no low-E film).
Energies 14 07584 g015
Figure 16. Breakdown of the building’s annual energy consumption in kWh for case B (with low-E film).
Energies 14 07584 g016
Figure 17. Monthly heat transmission (only sensible heat) through the envelope for case B (with low-E film).
Energies 14 07584 g017
Figure 18. Annual sensible heat transmission through the envelope (kWh) for case B (with low-E film).
Energies 14 07584 g018
Figure 19. Energy balance of windows with and without solar radiation for case B (with low-E film).
Energies 14 07584 g019
Figure 20. Number of annual discomfort hours during occupancy time based on EN 16798-1 comfort categories in case B (with low-E film).
Energies 14 07584 g020
Figure 21. Monthly predicted percentage of dissatisfied (PPD (%)) and operative temperatures for zone 4, zone 14, zone 44 and zone 56 in case B (with low-E film).
Energies 14 07584 g021
Figure 22. Comparison of the energy balance of windows (including solar radiation) in case A (no low-E film) and case B (with low-E film).
Energies 14 07584 g022
Figure 23. Comparison of the average PPD in July for zones 4, 14 and 56 in case A (no low-E film) and case B (with low-E film).
Energies 14 07584 g023
Figure 24. Comparison of the average PPD in June, July and August for zone 44 in case A (no low-E film) and case B (with low-E film).
Energies 14 07584 g024
Figure 25. Comparison of number of annual discomfort hours during occupancy time in case A (no low-E film) and case B (with low-E film) based on EN 16798-1.
Energies 14 07584 g025
Figure 26. Life cycle cost for a calculation period of 15 years. Nominal discount rate (D) and price escalation (P) with inflation rate of 2%.
Energies 14 07584 g026
Figure 27. Life cycle cost for a calculation period of 30 years. Nominal discount rate (D) and price escalation (P) with inflation rate of 2%.
Energies 14 07584 g027
Table 1. Thermal transmittance of the building’s construction elements [33,34,35].
Construction Part U - Value   ( W / m 2 · K )
External walls0.81
Internal walls1.16
Internal floors0.37
External floors2.90
Roof0.23
Basement wall towards ground3.30
Envelope area: 1910 m2
Window-to-wall ratio: 11.7%
Table 2. The linear heat loss coefficient of thermal bridges (W/(K · m)) for different types of joints in the building [34].
Type of JointExternal
Wall/Internal
Slab
External
Wall/Internal
Wall
External
Wall/External
Wall
External
Window
Perimeter
Thermal bridges
(W/(K · m))
0.580.230.250.05
Table 3. The entire window without low-E film; technical data measured in a field test in 2018 by Mattsson et al. [33].
U-Value
(W/(m2∙K))
g-ValueTransmitted Visible Light
The entire window2.300.760.81
Glazing specification: two 3 mm clear panes
Cavity between the panes: 30 mm of air
Frame: Wood
Table 4. The entire window with low E-film; technical data measured in a field t est in 2018 by Mattsson et al. [33].
U-Value
(W/(m2∙K))
g-ValueTransmitted
Visible Light
The entire window with the film on surface 31.590.5166%
Table 5. Window film specification applied to a double-clear glazed window, published by the manufacturer.
Film TypeTransmitted
Visible Light
Total Solar Energy
Rejected
g-Value
CC75 Low-E (3M)66%49%0.51
Table 6. Four categories of buildings according to the occupants’ level of thermal comfort expectations recommended by EN 16798-1 [40].
CategoryLevel of Expectation
IEQ IHigh
IEQ IIMedium
IEQ IIIModerate
IEQ IVLow
Table 7. Thermal comfort categories for design of mechanically heated and cooled buildings [40].
CategoryThermal State of the Body as Whole
Predicted Percentage
of Dissatisfied
PPD (%)
Predicted Mean Vote
PMV
I<6−0.2 < PMV < +0.2
II<10−0.5 < PMV < +0.5
III<15−0.7 < PMV < +0.7
IV<25−1.0 < PMV < +1.0
Table 8. Number of occupants and units of equipment in each zone.
ZoneNumber of OccupantsNumber of Equipment Items
433
1422
4488
5622
Table 9. Overall thermal comfort status in case A.
Percentage of occupancy hours when operative temperature
is above 27 °C in the worst zone
42
Percentage of occupancy hours when operative temperature
is above 27 °C in average zone
18
Percentage of total occupancy hours with thermal dissatisfaction14
Table 10. Overall thermal comfort status in case B (with low-E film).
Percentage of occupancy hours when operative temperature
is above 27 °C in the worst zone
35
Percentage of occupancy hours when operative temperature
is above 27 °C in average zone
14
Percentage of total occupancy hours with thermal dissatisfaction11
Table 11. Comparison of the overall thermal comfort data in case A (no low-E film) and case B (with low-E film) including all occupied rooms.
Case ACase B
Percentage of hours when operative temperature
is above 27 °C in the worst zone
4235
Percentage of hours when operative temperature
is above 27 °C in average zone
1814
Percentage of total occupancy hours with thermal dissatisfaction1411
Publisher’s Note: MDPI stays neutral with regard to jurisdictional claims in published maps and institutional affiliations.

