1. Introduction
The latest assessment report (AR6) of the Intergovernmental Panel on Climate Change (IPCC) [
1] supports numerous earlier findings [
2,
3,
4,
5] stating that global climate changes are primarily occurring due to human activities through increasing greenhouse gas emissions to the atmosphere. Concentrations of key greenhouse gases—carbon dioxide (CO
2), methane (CH
4), and nitrous oxide (N
2O)—exceed the levels of pre-industrial atmospheric concentrations by 40%, 150%, and 20%, respectively [
6]. In 2019, their emissions reached the annual averages of 410 ppm for CO
2, 1866 ppb for CH
4, and 332 ppb for N
2O [
1]. This poses a growing threat and contributes to the increasing intensity of environmental challenges that can dramatically affect current and future living conditions and lead to both economic and social losses worldwide. The target of the 2015 Paris Agreement [
7] to limit global warming to 1.5 °C seems to be a growingly complicated goal to achieve, as the atmosphere-warming process is gaining momentum and without rapid transformational change [
8], the climate change could spin out of control [
9].
Agriculture has a substantial impact on the issue as it is one of the key emitters of greenhouse gases in the global perspective [
10,
11,
12,
13,
14,
15]. At the level of the European Union (EU-27), emissions of this sector account for over 10.7%, while Poland emits ca. 8.7% of the total greenhouse gases (2019 data, excluding the LULUCF [
16]). The farm sector in Poland is the second largest contributor to the country’s greenhouse gas (GHG) emissions [
17] and is in the top fifth [
16] among farm sectors in the EU-27 countries. At the same time, it is agriculture that is one of the sectors most sensitive to climate change [
18,
19], which is why the policies undertaken at the EU and member-states’ national level are being implemented to support it both in terms of adaptation to the occurring climate change [
19,
20,
21,
22,
23,
24] and to direct it towards active measures to reduce greenhouse gas emissions from production processes [
12,
25,
26,
27,
28]. Yet, the European policies are not only about counteracting negative climate change [
29]. They make way to ensure improved protection of the environment, support biodiversity, and preserve the landscape, all of which combined aim to create a better future for future generations [
30].
The agriculture of Poland has evolved over the past three decades and has become more efficient [
31]. Technologies implemented, although growingly intensive in terms of production, were more technically advanced compared to the preceding socialist era, which allowed to substantially decrease the greenhouse gas emissions from this sector by the mid-2000s [
32]. However, currently utilised technologies and practices have reached a certain “cap”, limiting further reductions in greenhouse gas emissions. In order to intensify the reduction of emissions, it is necessary to implement new approaches to agricultural production that will take into account not only economic efficiency but also the environmental effects. To this end, specific measures are needed through incentive or taxation systems that would motivate farmers and other actors in the agricultural sector to invest in technologies and implement production practices that are more efficient in terms of environmental protection and reducing greenhouse gas emissions.
Despite measures aimed at climate and environmental protection in recent years (e.g., the greening policy under the CAP 2014-2020), the data on greenhouse gas emissions from Polish agriculture show their increase, starting from 2015, and stabilisation at the annual level of ca. 32 Mt CO
2eq [
32]. This results from the intensification of agricultural activity, as well as the increasing volumes of individual types of agricultural production characterised by higher emission factors.
Thus, there is a need to intensify efforts to ensure the reduction in greenhouse gas emissions from farming, but there are conflicts of interest standing in the way. According to the statements of the climate policy, an absolute reduction in emissions is necessary, but from the position of the domestic economy and society, the need to balance the possible effects of emission reduction and ensure the competitiveness of Polish agri-food production, including farm income, is also obvious. The complications also lay at the organisational level because, unlike other sectors of the economy, agriculture is highly diversified and shaped by over 1.4 million farms, of which more than half (53.6% according to (GUS data [
33]) are the smallest farms, with a cultivated arable area of up to 5 ha. This creates a significant obstacle in the introduction of regulations aimed at reducing greenhouse gas emissions, although it is understood that such regulations will be increasingly implemented. In turn, implementation of policy measures needs requires prior verification of potential effects, which is achievable through the application of modelling tools.
Therefore, the aim of the article is to assess the implications of the climate neutrality achievement path in Poland by 2050 for the domestic farm sector, including the potential impact on its structure, output, prices, and farm income. It is an illustration of changes along the ongoing transformation path aiming to achieve the climate-neutrality goals defined in the European Green Deal [
34] compared to less rigorous reduction scenarios.
The article contains six sections. Following the Introduction,
Section 2 focuses on a literature review of transformation issues towards sustainability and climate neutrality in agriculture at global, EU, and Poland levels.
Section 3 provides a detailed explanation of the applied modelling method with a description of assumed scenarios and outlined policy options.
Section 4 provides the results of the analysis divided by the three applied policy options.
Section 5 aims to verify obtained results with other studies and understand its advantages and shortcomings, as well as to compare key conclusions in terms of existing and future policies. The final section,
Section 6, concludes the article and provides a brief outline of the performed modelling and results.
2. Transformation towards Sustainability and Climate Neutrality in Agriculture
Global agriculture will undergo two interconnected processes in the coming decades: transformation to mitigate its negative impact upon the climate and adaptation to the ongoing climate change. The “sustainability in agriculture” aim intensifying since the 1990s [
35] goes much in line with the latest climate-neutrality goal. Moreover, farming practices allowing to reach both of these goals are often the same and are shared with another major transformation pathway—the adoption of ecological approaches in agriculture. Thus, various practices used within agroecological, organic, low-input, integrated, conservation [
36,
37], and other non-conventional approaches to farming could serve to a particular extent to reduce greenhouse gas emissions.
Yet, to maintain an adequate supply of agricultural products for the growing global population, it is crucial to compensate for lower output levels of extensive farming. The concept of sustainable intensification assumes a complex evaluation of input consumption, output of agricultural goods, and associated environmental pressures [
38], which could result in understanding and substantiation of the climate-smart agriculture measures and practices [
39]. The authors of [
40] support this idea, further stating that the “prior modelling work has largely neglected the vast majority of potential economic impacts of climate change on agriculture and a broader view must extend the impacts analysis to inputs beyond land, including the consequences of climate change for labour productivity, as well as for purchased intermediate inputs”.
The COVID-19 pandemic was an additional stress on the path to sustainability and climate neutrality, as it deteriorated, to some extent [
41], the focus on these targets. Yet, in terms of the development of agricultural markets in the short run, it could potentially lead to a modest reduction in direct greenhouse gases [
42] due to a downward demand for high-value-added products (e.g., meat or dairy products). The article stresses, though, that “
food consumption is generally quite inelastic and takes several years for production to adjust fully to a price change”.
For the European Union, the Green Deal is more than just climate neutrality [
29], as it manifests the need to reduce regional and social inequalities by strengthening European cohesion. It is not an issue of transformation of particular sectors in selected EU countries, but a complex approach adjusting and balancing supply and demand, including those for agri-food commodities.
While the upcoming Common Agricultural Policy 2023-2027 is the most climate-ambitious programme so far [
43], some sources [
44,
45,
46] point out that it still does not support the achievement of the European Green Deal targets in terms of emission reduction and does not set a clear link between the proposed policy measures and reduction targets. As the need to transform EU agriculture and possibly drastically reduce livestock production is expected [
47], the need for the deployment of the Just Transition approach to achieve it is not yet established [
48]. The level of such a reduction and its implications need to be further researched, both in terms of the impact upon global agricultural production and farm income.
Current studies show [
49] that the “
regional budget-neutrality condition introduces inefficiencies in the incentive system, and the full potential of the EU farming sector for GHG emissions reduction is not reached, leaving ample room for the design of more efficient agricultural policies for climate action”. The European Green Deal is a great opportunity, but in order to turn it into a success, it must be set in concepts pertaining to the constitutional framework of the EU legal order, in particular, “
the concepts of solidarity, sustainable development and high level of environmental protection” [
50].
In terms of formal implementation of legislation frameworks, as of October 2021, out of the 137 countries pledging carbon neutrality, only 61 have put those pledges into written form via a concrete law or policy document [
51]. While countries such as Finland are expecting to become climate-neutral as soon as 2035, Iceland and Austria set the 2040 target year, while Germany and Sweden expect the same by 2045. Poland still has not introduced corresponding legislation setting a plan to reach the climate-neutrality target at least by 2050, while according to state officials [
52], it might not even be able to achieve it before this year.
According to one of the latest studies of the Ministry of Agriculture and Rural Development of Poland [
53], some positive changes are already taking place in Polish agriculture in terms of emission mitigation, among which are the optimisation and adaptation of nitrogen fertiliser doses to local conditions, low-emission livestock-keeping systems, and low-emission natural-fertiliser-application systems. Yet, there is an evident problem with the systematisation of such activities and broader uptake among the farm sector. A catalyst for such changes may be the policies implemented in the near future, which may both support farms implementing pro-environmental practices and imposing on greenhouse-gas-emitters the obligation to compensate for environmental pollution resulting from their economic activity. In addition, the achievement of the EU’s climate neutrality by 2050 will require member-state economies to bear particular costs, and regarding the agricultural sector, they will differ depending on the particular country’s sectoral structure and applied farming practices which extrapolate on the intensity of greenhouse gas emissions.
The transformation of Polish agriculture to sustainable and climate-neutral fundamentals is still being discussed. The Strategy for Sustainable Rural Development, Agriculture and Fisheries [
54] adopted by the Council of Ministers of Poland in October 2019 pays relatively more attention to issues of adaptation to changing climate conditions rather than decreasing the negative impact of domestic agriculture upon the global climate. In terms of climate mitigation, it keeps the measures quite declarative and seems to place most expectations in this regard on the EU’s CAP and Climate Action measures.
Opinions of Polish scholars on the issue are also divided. Prandecki et al. [
55] point out that meeting the EU’s commitments to reduce greenhouse gas emissions will require an enormous effort, as it would be necessary to reverse the current agricultural development trends in Poland, which are associated with increasing emissions of these gases. The change, they stress, is much more profound than the EU’s policy suggests. At the same time, according to Gołas et al. [
56], these findings support the sustainable intensification concept and suggest that the implementation of sustainable and climate-neutral practices do not necessarily need to lead to lower productivity in Polish agriculture. Other domestic studies [
57] show that perception of environmental benefits resulting from sustainable agriculture practices vary depending on the farm type, with the feasibility of their implementation depending highly on the available knowledge and training intensity.
Due to international and national policies being implemented, there is a growing understanding of the necessity to mitigate GHG emissions to achieve climate neutrality, including the implementation of transformations in agriculture. At the same time, the achievement of this goal and measures aimed to pursue it need to take into account the necessity to maintain the key functions delivered by the agricultural sector. Measures introduced through systems of incentives or taxation motivating farmers and businesses in the farm sector to invest in technologies and implement production practices are needed, which, in turn, would lead to increased environmental protection and a reduction in GHG emissions.
3. Materials and Methods
The following assessment is based on modelling approach developed within the LIFE Climate CAKE PL project [
58] employing a complex computable general equilibrium (CGE) model (d-PLACE [
59]) with three interacting satellite models covering the energy (MEESA [
60]), transport (TR
3E [
61]), and agricultural (EPICA [
62]) sectors. The approach considers account interrelations between the sectors and traces the impact of changes in one sector on the rest of the economic system, including changes in household consumption and GDP value. The global CGE model, along with the energy and sectoral transport models covering all of the member countries of the European Union, is interconnected with the agricultural model solely analysing the farm sector of Poland.
The EPICA (Evaluation of Policy Impacts—Climate and Agriculture) model utilises several approaches to modelling. It combines linear farm activity optimisation programming with partial equilibrium, which allows achieving an adequate supply–demand balance while making it possible to highly disaggregate analysed farm production activities [
62]. The model goes in-depth and represents 23 agricultural activity aggregates, including 17 for crop production and 6 for animal farming, each of which is considered within extensive and intensive types of production. In addition, all the activities are split into 19 types of farms, according to two criteria: size and specialisation.
The agricultural model consists of three modules: farm, structural and market. The farm module is an optimisation model aimed to reflect the policy impact through the maximisation of farm income within each type of farm. The supply part is introduced by a linear programming model calibrated using PMP (Positive Mathematical Programming [
63]) approach. The farm types, therefore, optimise their income based on technological and resource constraints. The structural module aims to maximise income on the sectoral level through the change of shares of particular types of farms. The market module is aimed to define how agricultural supply changes induced by climate policy impact the market prices of agricultural products. The market module is also a partial equilibrium model, as the set of prices of agricultural products is derived from equilibrium conditions that equate demand and supply for every such product. The market module maximises consumer usefulness through adjustment of food consumption structure, as well as allows defining agri-food prices on the market. Detailed approach of the EPICA model is described in the official documentation [
62].
The dataset for the EPICA model baseline reflects year 2015. The database used within the EPICA model covers primary production factors, inputs, and outputs. Data are set in physical units and converted in the model to monetary values using estimated price level. This allows maintaining consistency between all utilised quantities, values, and prices. Datasets of Statistics Poland (GUS) and Polish FADN (Farm Accountancy Data Network) were used for the baseline generation, verified against other publicly available data, including the data of regional Polish Agricultural Advisory Centres [
62].
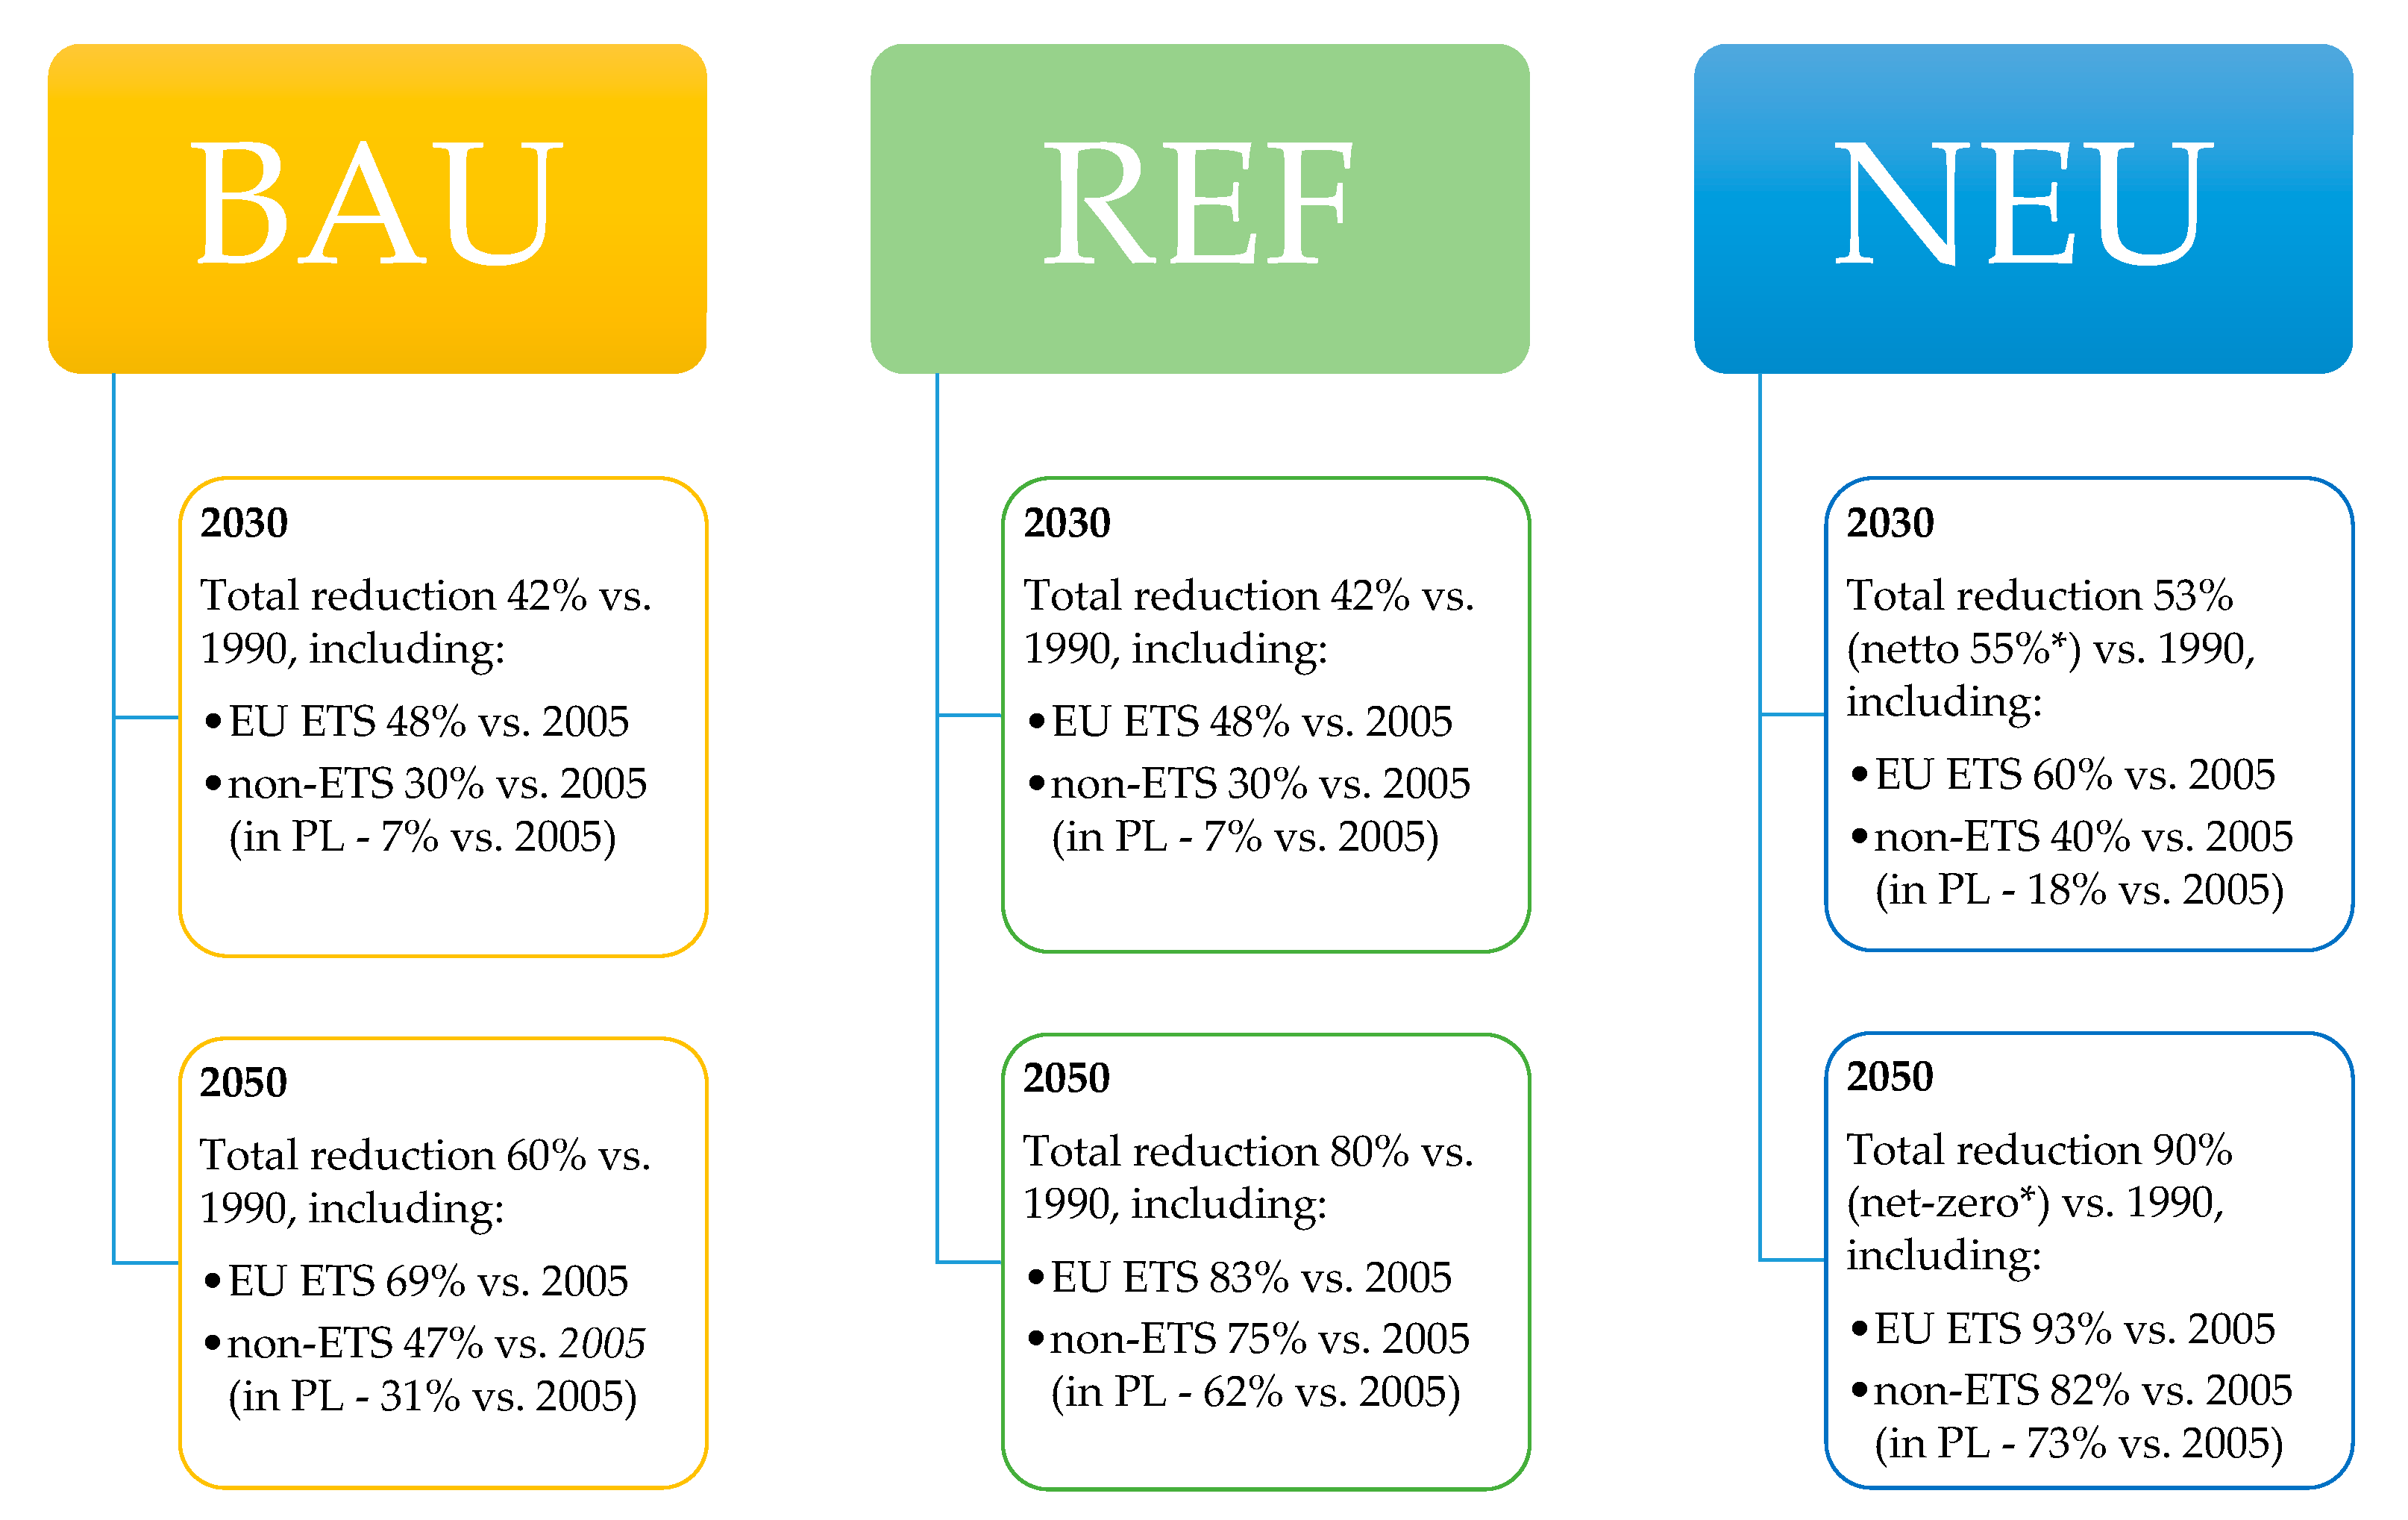
Three key scenarios were considered within the utilised modelling approach, which differ according to the level of greenhouse gas reduction levels in the EU-27 (
Figure 1).
Implications of the assumed BAU, REF, and NEU scenarios in terms of greenhouse gas emissions from the farm sector are presented in
Figure 2.
Achievement of each scenario target for the farm sector has been additionally modelled within three potential policy approaches, indicated thereafter as policy options. This allows us to understand the difference in impacts upon the farm sector within the defined scenarios depending on implemented policy approaches. Taking this into account, the results in
Section 4 are presented separately for each of the analysed policy options. These three options are:
“Carbon pricing”;
“Emission limit”;
“Carbon subsidies”.
The “Carbon pricing” policy option assumes implementation of GHG emission payments equal to those in other non-ETS sectors, payable by farms. Carbon pricing is an instrument that sets the price of greenhouse gas emissions by penalising the sources of their emissions in proportion to the carbon content. It can be implemented through either of two approaches: emissions trading or carbon taxation. This additional financial burden is taken into account by farms while optimising their production structure. Since this burden on production within particular farming activities is proportional to their emission intensity, introduction of carbon pricing is an incentive to replace more-emitting activities with less-emitting ones. As a consequence, farms are reducing their total emissions. The final reduction depends not only on the reaction of farms but also on the reaction of consumers: if consumers are not willing to significantly change the contents of their “basket”, lesser availability of products from high emission activities will lead to an increase in their price on the market. In this case, farms may be willing to limit further efforts to reduce emissions. Additionally, an increase in prices will lead to an increase in imports and hence an increase in emissions in other regions. Ultimately, however, the introduction of carbon pricing will always lead to their reduction, at least in the given country (region) where such pricing system is being introduced.
The assumption is that the carbon pricing is levied on the emissions of all key greenhouse gases produced within agricultural activities: carbon dioxide, methane, and nitrous oxide. The fee is determined per tonne of CO
2 equivalent, taking into account the Global Warming Potential defined by the IPCC Fourth Assessment Report (AR4) [
65] of individual GHG emitted by agriculture.
The emission allowance payment unit is defined per tonne of CO
2eq and is derived from the d-PLACE model. Additionally, during each modelling iteration, the EPICA model uses macroeconomic projections of the d-PLACE model in terms of changes in labour costs (salaries of hired workers in the farm sector), fuel prices, and chemical products. More precise information about the used data is available in [
64].
The “Emission limit” policy option imposes an emission limit for the farm sector. Farms are not charged any additional payments for emission allowance but need to adapt their production structure to meet the imposed GHG-emission-reduction targets. As in the “Carbon pricing” policy option assuming that the emission is charged with a cost (according to the price from the d-PLACE model), the final decisions of farms here depend on changes in the market prices of agricultural products, which will depend on the flexibility of consumers in adjusting their basket. The amount of emission reductions imposed on farms is determined on the basis of its projections in the d-PLACE model. The projections of changes in labour costs, fuel prices, and prices of agricultural products, which are used in the EPICA model, are derived from the same model, similarly to the option assuming the carbon pricing. Primary objective of this policy option’s testing is to estimate the costs associated with a given amount of emission reduction without deteriorating the result by emission payments. These costs materialise in the form of changes in the market prices of agricultural products and the loss of farm income.
The “Carbon subsidies” policy option assumes that reduction of GHG emissions will be achieved through implementation of a system compensating reduction efforts at farm level. This compensation would be granted conditionally depending on emission-reduction level. The model in this policy option allows estimating what compensation per tonne of GHG would be required to achieve a given reduction target and what would be the total cost of financing such a subsidy system in the 2050 horizon.
4. Results
Applied modelling tools provide a wide range of outputs presenting expected changes in different aspects of the agricultural sector’s development. This section provides insight into the main indicators of agriculture’s performance within the prism of three policy options described previously. The modelling results for each policy option are presented in the following order: overall production volume as an index of base-year (2015) production (output) volume, the production (output) volume of primary commodities (index), stocking density (LU/ha) of farm livestock, prices of main agricultural commodities (index) together with the volume of import (index), and farm income and changes in the farm structure (%).
4.1. Analysis of the “Carbon Pricing” Policy Option
Imposing carbon pricing on farm-production impacts the volume of agricultural output (
Figure 3) within all of the three analysed scenarios. The farms aiming to optimise their income strive to limit those activities that are more emission-intensive. Therefore, in the BAU scenario, the decrease in the total production volume by 2050 is estimated at ca. 10%, while in more ambitious emission-reduction scenarios, the decrease in the volume of agricultural output would reach from 29% in the REF scenario to over 54% in the NEU scenario.
Such significant reductions in output are not applicable to all agricultural products. Due to the different levels of GHG emissions accompanying specific agricultural production, as well as due dependencies between the production of particular agricultural products (e.g., relations between the production of livestock and animal feed), changes in the output levels within the adopted scenarios will be manifested to a different degree in the case of particular agricultural products (
Figure 4).
The largest reduction in the production volume concerns animal products, in particular, those obtained from bovine animals, which is connected with their intense methane emissions. Even in the BAU scenario, the bovine livestock and milk output are reduced by ca. 31% and 23%, respectively. Compared to these levels, in the NEU scenario, the decline in production is more drastic and amounts to as much as 81% for milk output. Among animal-related products, poultry (both in terms of livestock numbers and eggs produced) will manifest slightly smaller drops due to their lower impact on GHG emissions. In the case of crop production, the decline in cereal output is mainly due to the reduction in the demand for fodder as a result of the decline in livestock production. The emission limitations resulting from the introduced emission fee also force a slight decrease in the production of oilseeds. On the other hand, as a result of adjustments in the level of consumption in all the scenarios considered, it can be expected that an increase in the production of potatoes and fruits and vegetables by up to 45% compared to 2015 will occur.
Reducing the volume of animal products results in a significant reduction in the number of herds, which in turn leads to a reduction in the stocking density of livestock (
Figure 5). The reduction in the number of animals in relation to the Utilised Agricultural Area (UAA) will be observed from 2030 onward. In the NEU scenario, a decrease to the level of ca. 0.2 LU (Livestock Unit) per ha of agricultural land can be expected.
Changes in production volume have an impact on the prices of agricultural commodities. Simulations of the NEU scenario shows the highest increase in the prices of animal products, particularly beef. By 2030, beef prices will increase by 48% compared to 2015; in 2040, this increase will already amount to 287% (prices will be almost four times higher), and in 2050, they will reach 427% growth relative to 2015 (
Figure 6). Such an increase in prices results from the high emissivity of current agricultural production. Due to high payments for each tonne of generated greenhouse gas emissions, for a given price of beef, farms decide to limit its production. This leads to a shortage of beef on the market and gradually raises prices. Under usual circumstances, increasing prices would cause production volumes to increase and assure a balance between supply and demand. However, in the NEU scenario, the costs of the emission payments (resulting from a strong tightening of the reduction target) are so high that despite the rising price of beef, farms do not increase its production. Ultimately, the equilibrium will be restored by a decline in consumer demand for beef, which, however, requires a significant increase in prices. An additional factor that will help meet domestic demand for beef is the increase in imports, which could double between 2015 and 2050 (
Figure 7).
For the other animal products, the price increases are also significant, although lower compared to beef. Their emissions of greenhouse gases (especially methane) are also significant, although lower compared to beef. The price of dairy products within 2015–2030 increases by 24%, and between 2015 and 2050—by 291%. The increase in the price of pork products for 2030 and 2050 equal 18% and 208%, respectively. Eggs and poultry will increase the least: by 2030, egg prices will increase by 4%, and poultry prices will remain at the same level. By 2050, egg prices will increase by 105% and poultry prices by 63%.
The price increase will also occur for crop products (
Figure 8), although it will be relatively lower compared to animal products. On the one hand, this increase is due to the carbon pricing related to the production of these goods and the market mechanisms described before for animal products; on the other hand, it is a consequence of changes in demand resulting from changes in meat prices. Consumers, observing the rising prices of animal products, will decide to consume more plant products. This generates additional demand for them and leads to an increase in their prices. For some products, however, this increase will be mitigated by two additional effects. The first is a decline in demand for products such as cereals and corn, associated with a lower demand for animal feed. The second is an increase in imports. The latter effect is particularly important in the case of fruits and vegetables.
The greatest increase in prices will be recorded for potatoes and beets—their prices will increase by 9% till 2030 and by 49% until 2050. The prices of other crop products will remain unchanged until 2030 but will increase slightly in the next analysed period: for oil products by 16% by 2050, and for cereals and corn—by 5%. Prices for fruits and vegetables will not rise under the influence of climate policy. In the latter case, domestic demand will mainly be satisfied by growing imports (
Figure 9).
The qualitative simulation results for the BAU and REF scenarios are similar to the results of the NEU scenario, although the scale of changes is much smaller. For example, the price of beef products in the period 2015–2050 in the BAU scenario will increase by 48% and in the REF scenario—by 202% (
Figure 10). For comparison, this increase in the NEU scenario was 428%.
One of the major objectives of the EU’s Common Agricultural Policy (CAP) is to provide farmers with an adequate level of income. Adoption of the “Carbon pricing” policy option in the EPICA model, assuming the imposition of carbon pricing on all their emissions (at the level equal to pricing imposed on other non-ETS sectors), will result in a significant reduction of farmers’ income (
Figure 11). It is important to emphasise that these reductions already take into account the farmer financial support provided within the CAP (calculated at the level of 2015). Such a significant reduction in farm income results from two components: (1) loss of income from most emission-intensive products, production of which is halted by farmers; and (2) imposition of carbon pricing on the remaining farm output. Results indicate that implementation of such policy measures already in the BAU scenario leads to a decrease in farm income by over two-thirds. Adoption of more ambitious emission-reduction targets in REF and NEU scenarios results in overall losses by farms beginning in the year 2030. In the most extreme case (NEU scenario in 2050), it will reach PLN 20 billion annually in farm losses. This points to the need to consider other ways of motivating farmers to reduce GHG emissions, which have been tested in subsequent policy options within the EPICA model.
The necessity to reduce GHG emissions and following adjustments of the production outputs and income will exert pressure on changes in the structure of farms (
Figure 12). Effects within the BAU scenario are a continuation of the trends already observed in the farm sector. Medium-sized and the largest farms are developing at the expense of the smallest commercial farms; there are also increasingly more semi-subsistence farms, which are mainly the place of residence of the farmer’s family and carry out agricultural production for their own household consumption needs. In the case of the REF scenario, the pace of increasing the number of medium and large farms slows down, yet deepens in the NEU scenario. The adoption of the most ambitious emission-reduction targets causes the least-efficient commercial farms to fall out of the market and favours the increase in the number of semi-subsistence farms, the number of which grows by over 50%. This is due to the low production volume (and thus low emissions) and low fixed costs in such farms. It should be emphasised that the changes indicated by the results of the NEU scenario are unfavourable from the point of view of structural changes in the farm sector in Poland.
4.2. Analysis of the “Emission limit” Policy Option
This option imposes a reduction target on the agricultural sector, thus limiting greenhouse gas emissions, but without adding a financial burden on farmers. Adoption of the modelling assumptions within this policy option in the EPICA model leads to a slightly greater (up to 5 percentage points in the NEU scenario in 2050) reduction in the agricultural output (
Figure 13). This is due to the forced reduction of emissions at the level of specific types of farms. This assumption, however effective in terms of reducing emissions, results in a less-efficient allocation of production. Even less efficient, in terms of product emissivity, types of farms with a GHG emission limit can continue their production.
“Emission limit” assumptions will result in changes close to the “Carbon pricing” policy option concerning specific agricultural products (
Figure 14). However, there are some differences. The reduction in overall agricultural output within the most ambitious NEU scenario is the result of all products falling below 2015 levels regarding their production volumes. This is due to the emission limits imposed on all farms, including horticulture, which will lead to a reduction in the production of fruits and vegetables, which, due to the specific nature and required competences, cannot be carried out on other farms.
Same as with the previous policy option, the volume of livestock production leads to a reduction in livestock density in relation to the utilised agricultural area, with the scale and direction of changes being highly similar.
In the NEU scenario within the “Emission limit” policy option, the price increase will be similar to the previously analysed policy option (
Figure 15). The highest increase in prices will take place in the case of beef products: during 2015–2050, their price will increase almost five-fold. Among other animal products, poultry prices will rise the least—prices double by 2050. Among crop products, potatoes and beets will experience the highest increase in prices, which will also nearly double by 2050.
As in the “Carbon pricing” policy option, the results of an “Emission limit” regarding price levels in the BAU and REF scenarios are qualitatively similar to the NEU scenario, but the scale of changes is much smaller (
Figure 16).
Changes in farm income generated under the “Emission limit” policy option follow a different development course compared to the “Carbon pricing” option (
Figure 17). As no payments are imposed to limit the emissions, farm income decreases solely due to the decline in production volumes caused by emission reductions. This loss is largely compensated by the increase in the prices of agricultural products. As a result, within the analysed “Emission limit” policy option, the reduction in nominal income of the farm sector will stay in the range of 10–15%. However, taking into account the results of the d-PLACE CGE model showing the progressive GDP growth, even a slight decrease in the nominal value of income would mean a real deterioration in the income situation of farmers.
Structural changes within the “Emission limit” option will also differ from the previous policy option. In less-ambitious scenarios (BAU and REF), the currently observed farm concentration changes continue (
Figure 18). To a slightly greater extent, it increases the share of medium-sized farms, which have better emission adjustment potential due to a lower initial level of production intensity. As the largest farms, to some extent, used this potential earlier in the analysed timeframe, they have more limited possibilities to adjust in later years, which is reflected in the most ambitious NEU-reduction scenario.
4.3. Analysis of the “Carbon Subsidies” Policy Option
The final policy option being analysed is “Carbon subsidies”, which assumes achieving the same level of GHG emission reduction, but through a different instrument—implementation of a compensation system for farms, the granting of which would be conditional on reducing greenhouse gas emissions.
The approach of the “Carbon subsidies” policy option aims to offer farms in Poland economic incentives in the form of subsidies to reduce emissions compared to 2015 levels. Unlike the “Carbon pricing” option, this solution has budgetary implications. The support value that would be sufficient to achieve the set reduction targets under the adopted assumptions is presented in
Figure 19. In the BAU scenario in 2050, this would be an amount of ca. PLN 6 billion nationwide. For comparison, the current support for the Polish farmers under direct payments amounts to approximately PLN 15 billion annually. In more ambitious reduction scenarios (REF and NEU), the funds necessary to encourage farmers to reduce GHG emissions at the levels expected in 2050 would significantly exceed the level of current support for farmers under both pillars of the CAP. It should be assumed that although the assumptions of the “Carbon pricing” policy option could lead to a financial collapse of the farm sector, the use of subsidies alone as an incentive to reduce GHG emissions seems to be too expensive as well.
The reduction in GHG emissions from the farm sector by the introduction of subsidies will lead, in terms of the scale and directions of changes, to similar effects on the side of agricultural production, as in the case of the “Carbon pricing” policy option (
Figure 20).
As a result of the market mechanisms, the least-efficient farms in terms of GHG emissions will be the first to give up production in return for the subsidies or adjust the level of production intensity to maximise the benefits of production and subsidies. As in the “Carbon pricing” policy option, this causes a significant decrease in the amount of milk and beef produced in the NEU scenario and an increase in the production of root crops, fruits, and vegetables (
Figure 21).
In the NEU scenario in the “Carbon subsidies” option, the price increases will be lower compared to the “Carbon pricing” policy option (
Figure 22). In the case of beef, the price increase in the period 2015–2050 will reach 354%. For pork and dairy products, the increase will be ca. 200%, and for eggs and poultry, nearly 100%. Among crop products, the highest price increase will be for potatoes and beets, accounting for almost 51%. In the case of other products, the increase will not exceed 15%.
In the REF and BAU scenarios within the “Carbon subsidies” policy option, the paths of price increase will be similar to the NEU scenario, however—as in the case of policy options “Carbon pricing” and “Emission limit”, the scale of changes will be smaller (
Figure 23).
The introduction of economic incentives in the form of subsidies improves the income situation in the farm sector (
Figure 24). Small reductions in emissions in the BAU scenario increase agricultural income by ca. PLN 2 billion annually. In the case of more ambitious scenarios, farmers gain more, in the most extreme case reaching a financial result six times higher compared to 2015 (in the NEU scenario in 2050). It should be noted that this increase would be resulting from subsidies paid for discontinued agricultural production. Due to the expected increase in prices caused by the emission-reduction measures, farmers, similarly to the “Emission limit” policy option, do not suffer high losses due to the reduction in production.
Such significant changes in the profitability of farms could not take place without the following structural changes (
Figure 25). While the BAU scenario development is not affected to a great extent, the implementation of more ambitious reduction scenarios leads to an increase in the number of large- (REF) and medium-sized farms (NEU). Farms with large-scale production benefit from the support to a greater extent. Similarly to “Emission limit”, the “Carbon subsidies” policy option to reach the NEU scenario targets shows a greater reduction potential of medium-sized farms, which are relatively more able to reduce emissions and thus benefit from additional financial support. From the point of view of the CAP assumptions, such changes in the structure can be considered favourable; however, taking into account the additional financial burden, it is difficult to recommend building policy based solely on assumptions of the “Carbon subsidies” policy option.
5. Discussion
Achievement of deep reductions in greenhouse gas emissions in agriculture is a difficult task, regardless of the country and conditions. While there are numerous technologies that allow reducing the emissions, their implementation is costly and thus often unviable economically with the given market equilibrium. Agricultural production structures on the supply side, consumer habits on the demand side, as well as global trade in between are deeply rooted in current patterns, which altogether are a systemic obstacle to large-scale changes and the consistent global shift to low-emission agriculture. On the other hand, the issues of food insecurity and hunger [
66] emphasise the need to produce sufficient volumes of food-stuffs at affordable prices. Therefore, these issues are interconnected, as global warming leads to the deterioration of locally traditional conditions for farming, thus leading to losses in crops and livestock and increasing turbulence and uncertainty in the farming sector. Additionally, there are risks of increased food insecurity under stringent global climate change mitigation policies [
10,
67], which need to be taken into account.
The contribution of the farm sector to Poland’s climate neutrality will require deep emission reductions, as the results of the analysis show. While the European Green Deal sets ambitious targets, their achievement will need to be implemented by such instruments as the EU’s Common Agricultural Policy, which in the next programming period (2023–2027) dedicates three of its nine key objectives to the issues of climate and environmental protection. The question stands as to whether the measures aiming to mitigate climate change will be sufficient for such drastic and yet positive transformations in the EU’s agriculture.
Evaluations of the past measures implemented within the 2014–2020 CAP are not positive, among others, stating “half of the European funds spent to fight climate change went into ineffective measures” [
68]. A more detailed analysis [
69] performed in 2017 targeted the “greening” measures within the CAP, the result of which stated that there were not enough data to make conclusions about the efficiency of farming practices before and after the applied measures. Additionally, the Institute for European Environmental Policy performed an evaluation [
70] of the previous CAP and stated that “
having a specified level of the CAP budget allocated for environmental and climate purposes has been useful, but the lack of a link to more specific environmental objectives has been a weakness which has made it easier for Member States to dilute their efforts”. In its latest evaluation [
18], the European Commission states that there are gains in economic efficiency and environmental footprint per unit of output produced within the EU’s agriculture, but similar gains in total emissions are still needed, as the emission-reduction progress has stagnated since 2010. It is mentioned that the net impact of coupled support on GHG emissions within the EU is still difficult to judge. Thus, a clear understanding of the causality and potential impact of measures within the next CAP programming periods are crucial to the achievement of emission-reduction targets defined by the European Green Deal.
Paula Harrison et al. [
71] state that climate change impact modelling needs to include cross-sectoral interactions, as assessments often apply models of individual sectors such as agriculture, forestry, and water use without considering interactions between these sectors, which is likely to lead to misrepresentation of impacts, and consequently to poor decisions about climate adaptation. The approach implemented within the LIFE Climate CAKE PL project and its set of models aims to solve this particular limitation by utilising complex interrelations between sectors and achieve this in the global perspective thanks to the utilisation of the d-PLACE CGE model as the core element of the modelling approach.
Nelson et al. [
72] modelled the impact of climate change on agriculture, which is an important element of the complex picture of future changes. Their results show that all models responded with higher prices, while the producer behaviour differs by the model, with some emphasising an area response and others yield response. The results obtained within the current research presented in this article are in line with these findings, even though the utilised approach does not take into account the consequences of climate change upon farming activities, change of yields, and needed technologies/costs to minimise the negative climate impacts upon the economic efficiency of particular agricultural activities.
The adjustment of consumer habits and its impact on agricultural production is supported by many researchers [
28,
73,
74], and has been highlighted in the European Commission’s evaluation of the impact of the CAP on climate change and greenhouse gas emissions [
18]. In this context, the authors agree with Fellmann et al. [
12] that GHG emissions need to be tackled from the consumption side, as the current demand is driving the production of emission-intensive food-stuffs, especially within the livestock sector. As the production of 1 kg of beef is associated with emissions at the level of 99.5 kg CO₂eq [
75], the consumption habits within the EU follow the established climate-negative patterns and thus influence the production structure, whether in the EU or globally. Fellmann et al. conclude their modelling results that despite the price growth for emission-intensive products, the established consumer habits force their compensation by imported goods. Thus, “
it might be necessary to take net imported emissions into account when setting national mitigation targets, which would generally introduce new opportunities for emission reduction strategies on a large scale” [
12].
Another issue that needs to be taken into account is the food waste and food loss [
76], the minimisation of which could help optimise agricultural production and decrease the gap between overproduction and underconsumption. While the guidelines of the European Union on the common methodology and quality requirements for the uniform system of measuring the food waste levels in the EU Member States were adopted in 2019 [
77], the path to the efficiently performing system of waste minimisation is at its beginning. Key issues still to tackle include accounting for the quantity and quality losses and balancing efficiency, food security, and environmental objectives [
76].
Modelling results obtained within this research find support in terms of the urgent need to tackle the greenhouse gas emissions generated by the livestock sector, primarily methane from cattle [
78,
79]. It is necessary for swift climate change mitigation, yet letting go of such a traditional sector would not be easy for either farmers or consumers. To tackle this and other climate change issues, a long-term strategy for sustainable development of agriculture for Poland [
80] is needed, especially in terms of the EU’s climate action targets by such a far horizon as 2050. Without a clear understanding of the future farm and production structure, consumer habits, and expectations, it is difficult to define the most beneficial development pathways to reach the expected state. Moreover, the multitude of factors and interrelations are still not grasped in a complex and multi-optional way, which limits each of the modelling approaches, narrowing the development estimations to assumed, but not all possible, pathways.
6. Conclusions
Conducted assessment allows drawing conclusions on the impact of greenhouse gas emission reductions in the farm sector of Poland along the European Green Deal climate neutrality achievement path by 2050. Assessed impacts include the response of the farm sector in terms of output of agricultural production, prices of agricultural products and their imports, farm income, and farm structure. Three analysed emission-reduction scenarios (BAU, REF, and NEU) differ by the target mitigation levels and are based on different policy expectations and assumptions. The analysis of these scenarios for agriculture in Poland additionally implements three policy options within each of them, thus allowing to understand implications of different motivational approaches to the farm sector. Depending on particular analysed policy options, this also permits estimating the potential financial burden on: (1) farms in the case of the introduction of obligatory emission payments due to carbon pricing, and (2) budgetary burden in the case of the provision of subsidies to farms for their emission reduction.
While the current greenhouse gas emissions from the farm sector in Poland equal 32 Mt CO2eq, within the BAU scenario by 2050, they are projected to decline to 20 Mt CO2eq, and the implementation of more demanding REF scenario goals could allow reaching 10 Mt CO2eq, while the most rigoristic climate-neutral (NEU) approach could result in annual emissions at the level of 8 Mt CO2eq. Yet, such changes cannot happen without deep transformation of the sector, both in terms of its structure, utilised technologies, and practices. Results of their achievement implications also differ within the tested policy options.
While the implementation of the BAU scenario does not radically affect the situation of farms or the functioning of the food market (apart from a noticeable increase in the prices of beef, milk, and pork), the implementation of more ambitious climate goals using currently known technologies causes significant changes in the functioning of the farm sector and a significant increase in prices of many agricultural products. The way in which climate goals are achieved has a large impact on the scale and direction of these changes. The “Carbon pricing” policy option, assuming that the introduction of a price for emission allowances for farms would be equal to those for other non-ETS sector entities, could lead to (especially in the REF and NEU scenarios) high financial losses at the farm level and thus jeopardise the country’s food security. The “Emission limit” policy option reduces emissions with a less negative impact upon the farm income and economic state. Yet, this could cause a less optimal allocation of production if the emission efficiency is taken into account. Finally, the “Carbon subsidies” policy option, assuming more ambitious climate policy scenarios, turns out to be a costly solution. The potential subsidies designated to farmers for the voluntary abandonment of selected production processes (leading to a reduction in emissions to the level expected by the NEU scenario) by several times exceeds the level of farm subsidisation under the current CAP. It is therefore impossible to confirm its feasibility at this point.
In the NEU climate-neutrality scenario (net-zero GHG emissions), an assumed reduction in GHG emissions from the Polish farm sector in 2050 by 74% (compared to 2015) with the use of currently available technologies may lead to a reduction in agricultural output by 54% and an increase in food prices by an average of 119%. In particular, the reduction in output applies to bovine livestock and milk (dropping to 37% and 19% of initial values, respectively), thus increasing prices by 3.91 times for milk and by 5.28 times for beef. At the same time, it should be emphasised that the possible introduction of emission payments for farming activities in the non-ETS scheme leads to a significant reduction in farm income, even to the extent that may threaten their further existence.
Key changes within all scenarios and policy options point out the necessity of a significant reduction in emissions from the livestock sector. This might not be achievable solely by a reduction in emission intensity but possibly will need to be supported by reducing the agricultural outputs. Other possible solutions which could have a substantial impact upon the reduction in GHG emissions by farms could be cropland afforestation, restoration of peatlands to a natural state, and increased sequestration of organic carbon in the soil. Such activities, however, would need to be adapted to particular local conditions. Further reduction of GHG emissions in the farm sector could also be supported by a change in the consumption structure towards limiting the volumes of consumed animal products, as well as limiting food waste and food loss.
Policy-wise, based on the obtained modelling results and impacts of policy options on the farm sector, it is possible to assume that a hybrid emission-reduction policy would be most beneficial and feasible. It could involve the application of GHG emission limits combined with selected support instruments (e.g., aimed at farm income). This could assure farm sector transformation towards the climate-neutrality goal while maintaining farms’ economic viability.


 ,
, 
