1. Introduction
In the wake of the COVID-19 pandemic, policymakers and environmentalists are keen to improve air quality and implement green energy sources [
1,
2,
3]. A clean atmosphere is a key part of the global healthcare sustainability agenda [
4,
5]. The world must use renewable energy sources to achieve carbon neutrality [
6,
7,
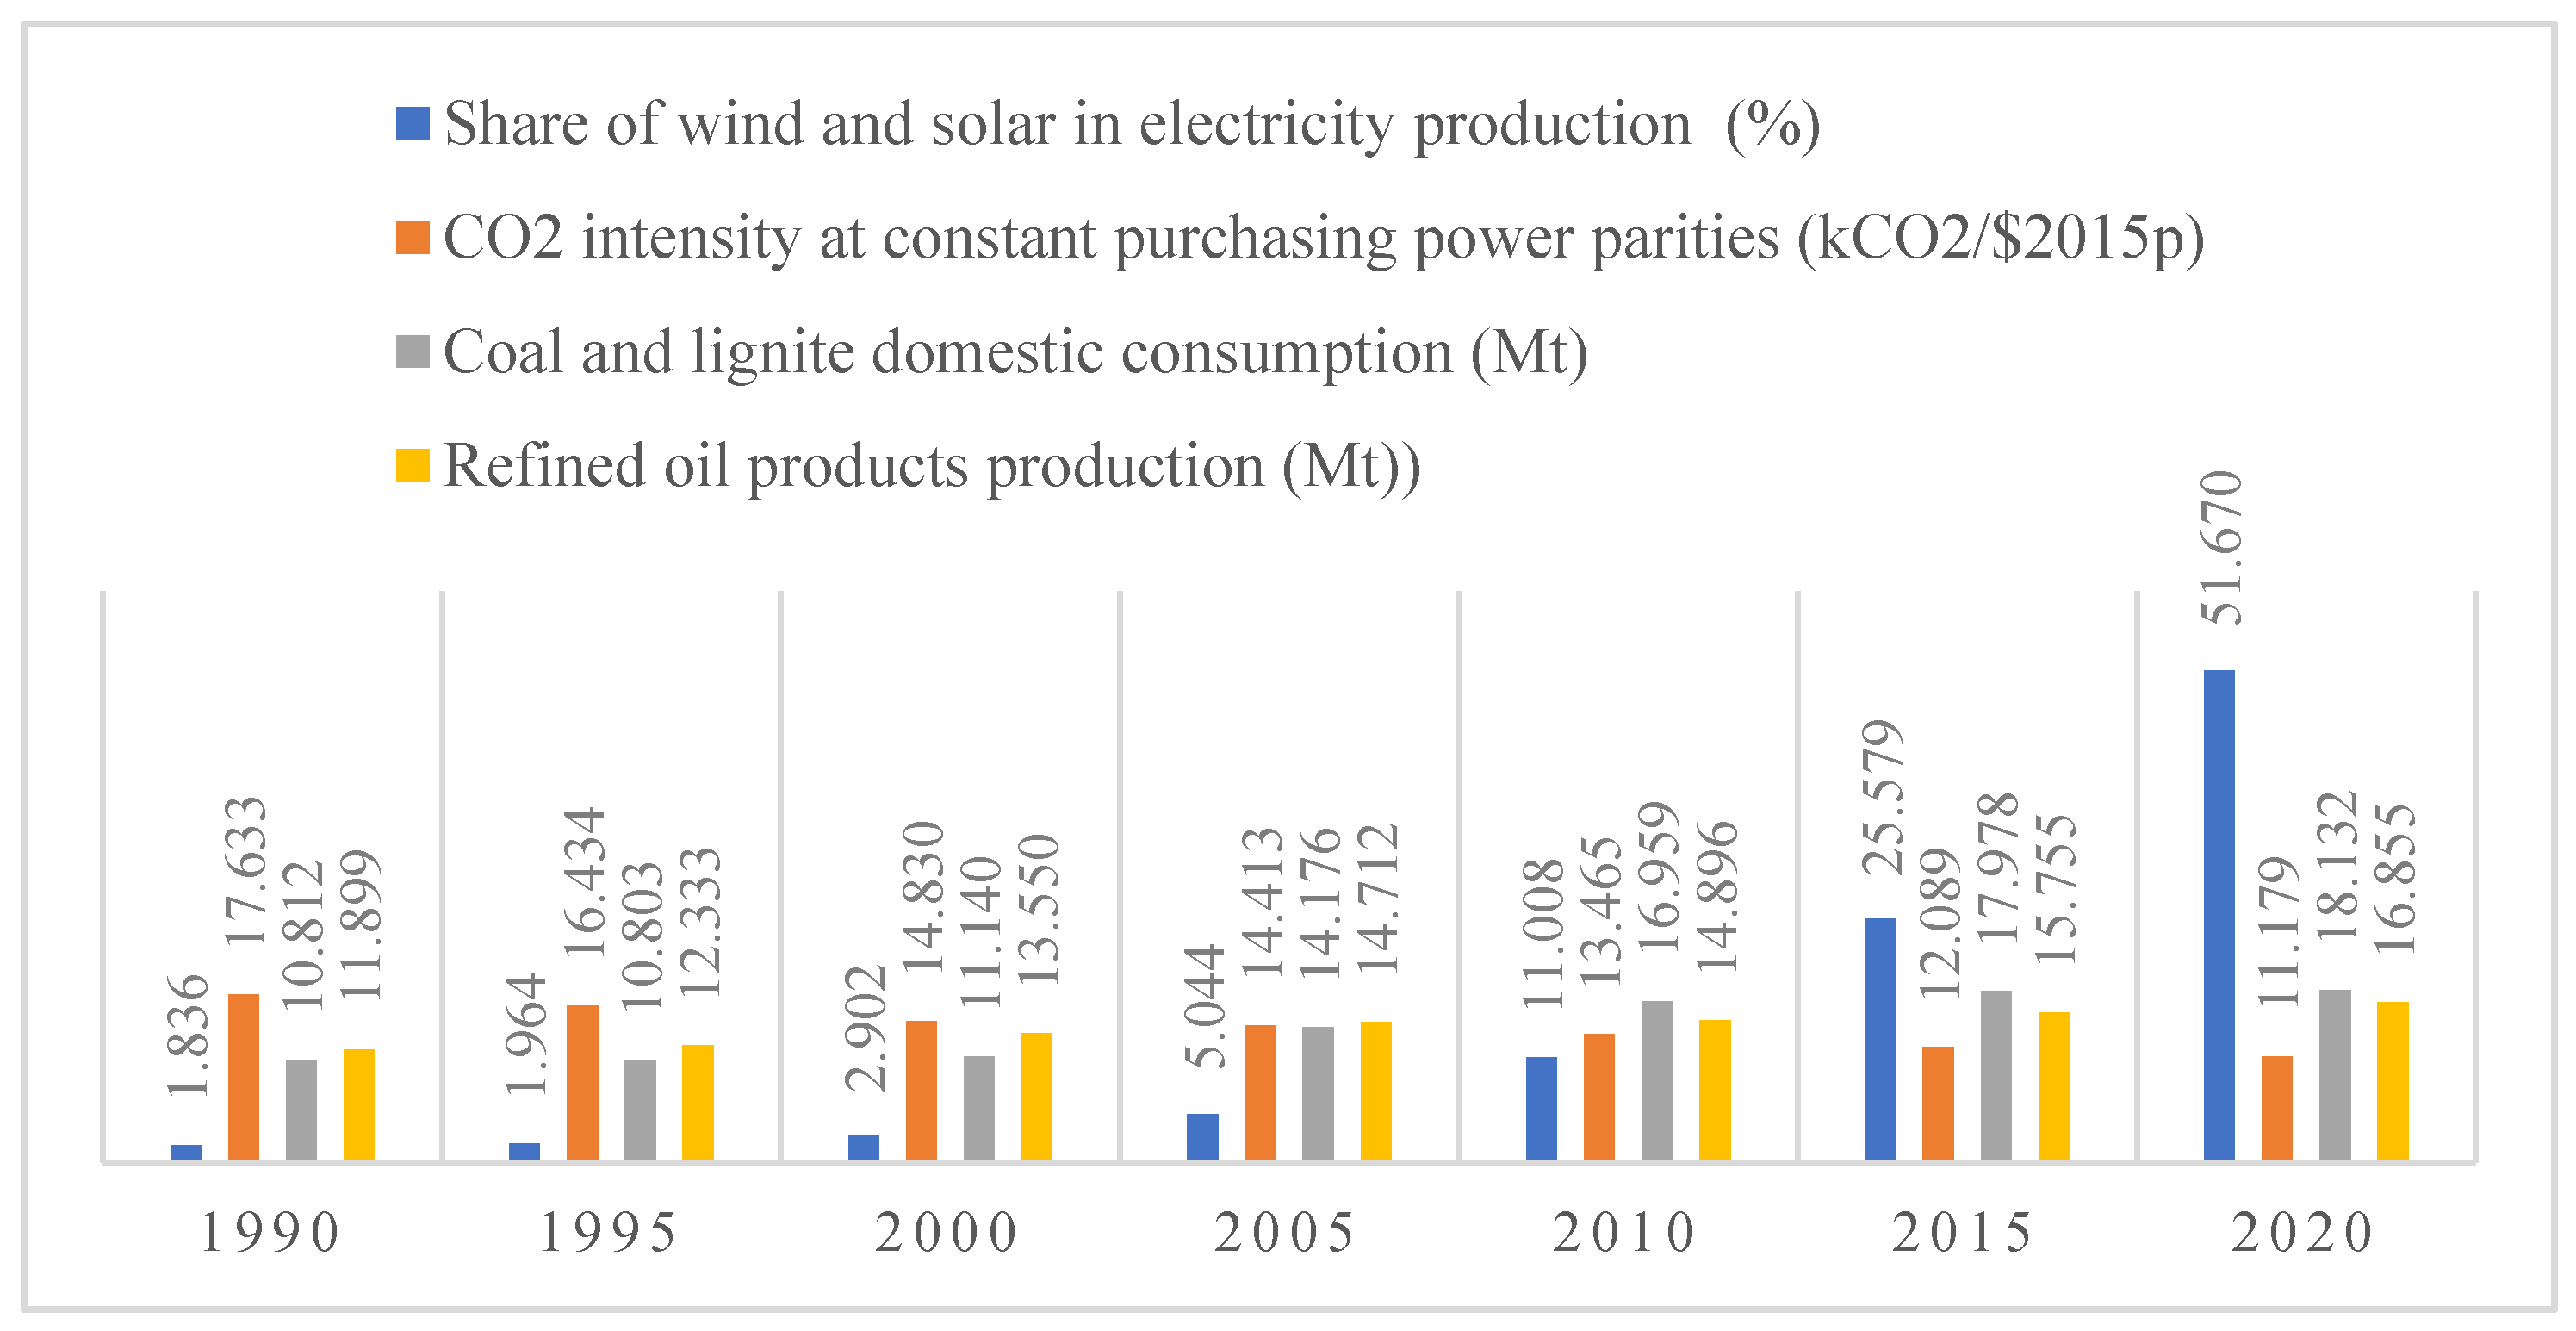
8]. The share of global wind and solar electricity production increased from 0.35% in 1990 to 9.90% in 2020. However, the production of refined oil products increased from 3158 Mt in 1990 to 4473 Mt in 2020, i.e., with 11.899% to 16.855% growth over the same years. Carbon intensity at constant purchasing power parities has decreased substantially, i.e., from 0.404 kCO
2/
$2015p in 1990 to 0.256 kCO
2/
$2015p in 2020, with a percentage change of 17.633% to 11.179% over the same years. During the same period, coal and lignite domestic consumption increased from 4657 Mt in 1990 to 7809 Mt in 2020; the percentage change was 10.812% to 18.132% [
9]. Increasing coal and domestic lignite consumption is harmful to the environment and brings about more widespread health-damaging effects. The use of sustainable energy sources is vital to improving the environment.
Figure 1 shows the relevant facts for reference.
Earlier studies have confirmed the viability of different renewable energy sources in terms of mitigating carbon emissions. For instance, Magazzino et al. [
10] investigated causal inferences by using a machine learning approach in a supervised prediction model, which consisted of wind and solar energy, coal combustion, economic growth and carbon emissions in the US, India and China. The results confirmed the potential of the stated green energy sources in terms of reducing carbon intensity in the US and China. On the other hand, the Indian economy needs cleaner production instruments, i.e., it is necessary to reduce coal combustion and move toward low carbon sources for its power supply. Hosseini [
11] discussed the potential challenges and opportunities of green energy production in the wake of the COVID-19 pandemic. The pandemic has hit almost every part of the economic development infrastructure and has further slowed initiatives and efforts to provide green energy sources to the globalized world. Economies are striving to return to normal situations and offer different sustainable stimuli to the private sector. Liu et al. [
12] surveyed China’s economy regarding the variability of renewable energy sources that would help cap carbon emissions to a large extent. It was found that wind-solar combinations could contribute to carbon neutrality, with regional cooperation being essential to achieving the lowest operational setup costs for wind and solar grids. Sun et al. [
13] analyzed the potential role of wind energy in Ghana. Although the results confirmed the feasibility of installing wind energy sources to materialize pipeline projects, this required a sustainable policy mix and stringent regulatory measures for long-term sustained growth. Sayed et al. [
14] extensively surveyed the potential of different renewable energy sources to improve environmental quality at a large scale. The study evaluated other power systems, from planning to construction and then installation, in order to assess the environmental impact. Sovacool et al. [
15] compared the efficiency of nuclear and renewable energy in a large panel of 123 countries spanning time-series data from the past 25 years. The results generally favored utilizing renewable energy resources that more effectively reduce carbon emissions. The study found a crowding effect between the two energy sources worldwide. This point should be noted in endeavors to achieve carbon neutrality agenda. Sayigh [
16] emphasized the need to curb fossil fuel dependency in the energy mix and to expand renewable energy sources in order to cap carbon emissions. The combination of solar and wind energy is pivotal to reaching a sustainable energy growth path that is predicted to supply half of the world’s energy needs.
Theoretical arguments for the effects of the consumption of renewable and nonrenewable resources on economic growth have not yet been fully examined. We hypothesize in this study that renewable energy has both an monetary and a technological effect on domestic growth. Renewables, like nonrenewables, require extraction and investments in technology. In conjunction with the literature review that follows, the analysis presented above identified the following research gaps.
Few empirical studies have examined the effect of wind and solar energy production on the carbon reduction agenda in the world aggregate data. Prior research has yielded contradictory results regarding the linear relationship between domestic coal consumption/refined oil production and carbon intensity. In line with the stated research questions, this study has the following objectives:
- i.
To examine the impact of wind and solar energy production on the carbon reduction agenda in a world aggregated data set.
- ii.
To analyze the effects of domestic coal consumption and refined oil production on carbon intensity.
- iii.
To assess the relationship between candidate variables over a given time horizon.
This study applied a time-varying cointegration technique, including the ARDL Bounds testing approach and variance decomposition analysis (VDA), which gives short- and long-term parameter estimates and forecasting estimates.
2. Literature Review
Industrial decarbonization is a buzzword describing the phasing out of carbon emissions from industrial processes and production [
17]. It is considered a key strategy to limit carbon emissions, e.g., by using solar panels and wind turbines [
18]. The Paris agreement for environmental protection and the average temperature increases as defined in the Kyoto protocol depends heavily on the adoption of renewable energy sources [
19]. The chemical, transportation, cement, and iron and steel industries are mainly responsible for increasing global industrial carbon emissions and will need to be decarbonized through the application of cleaner production technologies [
20,
21]. The widespread use of fossil fuels in the industry has led to higher operational risks for industrial manufacturers, who need to find a way to minimize their use of nonrenewable fuels in value chain processes and maximize green power in their industrial processes [
22,
23]. The transportation sector should adopt renewable fuels. This would further improve sustainable freight operations and urban transportation infrastructure [
24,
25]. Hybrid energy systems and technological spillover would likely support green developmental agenda, in line with the ambitions of decarbonization initiatives worldwide [
26,
27].
China is ambitious to reduce carbon emissions through the extensive application of a solar and wind energy mix in national energy grids. Hence, the future is bright regarding the use of renewable energy sources in the national energy grid and the move toward green development. Gebreslassie [
28] argued that the Ethiopian economy faced numerous challenges that limit its ability to produce solar and wind energy locally, such as inadequate capital investment, a meagre green supply chain and human capital deficiency. The dire need for investment in green energy grids is pivotal to generating domestic solar-wind combinations. Sadorsky [
29] discussed the share of wind energy in the total renewable energy mix and found a more significant portion in a panel of 17 major countries. The wind energy share can increase by promoting renewable fuels compared to fossil fuels. Hrnčić et al. [
30] evaluated the European Green Deal, which seeks to achieve 100% renewable energy by 2050 for all member states. Industrial decarbonization includes well-designed carbon pricing mechanisms, funding for research and development, industrial energy efficiency, emissions standards for industrial processes, and green government procurement programs. A case study of Montenegro, in general, favoured the adoption of hydropower. At the same time, it observed the need for a balance of viable green energy sources in energy production to fulfil the supply-demand gap. Chang and Wei [
31] argued that low carbon building infrastructure remains a policymaker’s dream. The study concluded that state-of-the-art green energy technologies could be used in the building life cycle phase, which would help to achieve energy efficiency and mitigate GHG emissions. Khan and Al-Ghamdi [
32] noted that the residential building sector represents more than 35% of global GHG emissions. Different combinations of solar, geothermal, wind, and biomass energy could likely be used for onsite energy production, bringing it in line with national energy policy standards.
Based on the cited literature, the present study formulated the following research hypotheses:
Hypotheses 1 (H1). A combination of wind and solar electricity is likely to cap carbon intensity worldwide.
Hypotheses 2 (H2). The enormous increase of coal and brown coal consumption likely increases carbon intensity.
Hypotheses 3 (H3). The production of refined oil will likely reduce carbon intensity if it follows a cleaner production path.
The stated hypotheses identified different renewable and nonrenewable fuels that adversely affect the global environment. Optimizing wind-solar energy combinations helps reduce carbon intensity and achieve energy efficiency by utilizing green energy sources in national energy grids. Furthermore, the high dependency on coal and brown coal in domestic settings in many countries presents difficulties in terms of adopting green energy sources, i.e., increasing operational costs and financial requirements. Oil refineries should apply cleaner production technologies in order to achieve carbon neutrality.
The contribution of this study is to assess the role of solar-wind energy sources in reducing carbon intensity by controlling coal and lignite domestic consumption and refined oil production worldwide. The study evaluated mixtures of non-renewable and renewable fuels in terms of their degrees of pollution damage; this has generally not been explored in the past. The earlier literature is mainly limited to the use of nuclear energy [
33,
34,
35], biomass fuel [
36,
37], solar energy [
38,
39], wind energy [
40,
41], hydropower [
42,
43], and geothermal energy [
44,
45] sources in different economic settings. In comparison, the literature has largely overlooked the use of coal and brown coal and refined oil in the global data set, which is essential for formulating a sustainable policy agenda. Based on its importance, the following key research questions emerged that need to be answered carefully. First, can an increasing share of wind and solar electricity reduce carbon intensity worldwide? This question is fundamental, as the share of wind and solar is less than 10% in terms of electricity production globally. Second, to what extent is refined oil helpful in reducing harmful pollutants and improving cleaner fuel combustion? The question indicates that refined oil positively affects the natural environment, mitigating harmful pollutants. However, this depends on the sustainable efficiency of the processing plants. Finally, does the increasing share of coal and brown coal domestic consumption negatively affect green energy production? It is evident that the amount of coal and brown coal used for domestic consumption is increasing, which adversely affected the healthcare sustainability agenda. The need to shift from coal to renewable fuels is desirable for moving toward more sustainable energy production.
3. Materials and Methods
The study used the combination of wind and solar electricity production (denoted by
WSEP, %), coal and domestic lignite consumption (denoted by
CLDC, Mt), and refined oil (denoted by
ROPP, Mt) as regressors. The CO
2 intensity at constant purchasing power parities (denoted by CO
2, kCO
2/
$2015p) was used as an outcome variable. The world aggregated data set analysis covered a period from 1990 to 2020. The data are available from the World Bank [
9] database from 1990 to 2017. The study filled the remaining data observations up to 2020 through trend adjustments to make a consistent variable series over time. Shocks experiences by individual countries were absorbed in the aggregated world data; hence, no cross-sectional dependency arose in the model estimates. The decision to use world data rather than segregated countries data for policy formulation was justified by the fact that is equally applicable to the entire globe. Several earlier studies have used world aggregated data to generalize policy implications [
46,
47,
48].
The life cycle assessment of carbon emissions arising from solar panels and wind turbine generating systems was undertaken according to the ‘process method’. Total carbon emissions were assessed according to manufacturing materials, transport emissions, and emissions during assembly.
Figure 2 shows the relevant ordering of carbon emissions.
Figure 1 shows that the different systems tend to generate increased carbon emissions, whereas solar energy and wind turbines help reduce carbon emissions.
Table 1 shows the change in carbon emissions accompanied by the solar and wind energy share in energy consumption. Wind-solar electricity production, on average, provides facility energy of up to 2.4%, with a standard deviation of 2.7%, while carbon emissions reach a maximum of 0.403 kCO
2/
$2015p, with a standard deviation of 0.043 kCO
2/
$2015p. Coal and lignite consumption increases by 6129 Mt with a standard deviation of 1392 Mt, assuming average carbon emissions of up to 0.326 kCO
2/
$2015p. Finally, refined oil release energy up to 3781 Mt with a standard deviation of 396 Mt, but emit a minimum of up to 0.256 kCO
2/
$2015p.
The theoretical underpinning of the earlier literature described the need to recommend ‘green energy theory’, which is helpful in achieving carbon neutrality. The study extended the green energy theory by adding combinations of wind and solar energy in carbon cost modelling to reduce the adverse effect of environmental pollutants. Further, the widespread domestic use of coal negatively affects healthcare sustainability agenda; coal must be refined and processed to minimize its sulfur content. The processing of crude oil under stringent government regulations facilitates reductions in carbon content through a storage process. A proposed green energy theory is presented in the equation below; this equation is applied throughout the study.
where
CO2_
INT is carbon intensity,
WSEP is wind-solar electricity production,
CLDC is carbon and lignite domestic consumption, and
ROPP is refined oil production.
Equation (1) shows that renewable energy sources are likely to reduce carbon intensity, while the increased use of coal is likely to increase it globally. The production of refined oil may decrease carbon intensity if stringent government regulations to protect the natural environment are implemented.
The study used the ARDL Bounds testing approach, proposed by Pesaran et al. [
50], for parameter estimates in the short and long term. The given estimator works better with different integrated variables, i.e., I(1) and I(0) with finite sample data. Excessive data is not always required for the given technique. As such, it is superior to time-varying cointegration techniques, such as Johansen’s cointegration and Engel-Granger cointegration. The data are nonetheless essential to perform cointegration. The given methodology applies different lag operators of both the predictors and outcome variables. Equation (2) shows the ARDL extended specification for estimations, i.e.:
where ∆ is the difference operator, ln is the natural logarithm, and ε is the white noise error term.
The error correction term (
ECT) is evaluated during the short-term process. A negative
ECT value would likely confirm the convergence of the models toward equilibrium with an adjustment coefficient value ‘
p’. Based on its importance, Equation (3) added
ECT in the short-term function to confirm the model convergence toward symmetry, i.e.:
where
ECT is the error correction term.
The long-term cointegration process was verified by imposing restrictions on the long-term parameters through Wald F-statistics from the following hypothesis:
Null Hypotheses (H1). Alternative Hypotheses (H2). The rejection of the null hypothesis proved the long-term cointegration among the variables. Narayan critical values were used to validate the stated hypothesis. The value of Wald F-statistics should be greater than the 5% level of significance, and should fall into the upper I(1) bound value. Hence, long-term associations between the candidate variables were used in subsequent VAR modelling. The VDA approach works under the VAR modelling framework. The error shocks of the regressors on the outcome variable specify values for specified forecasted years, which help in long-term policy formulations. The outcome variable also has its own innovation shock on the prescribed model associated with the given regressors. The given regressors tend to influence the outcome variable based on their innovative shocks over a time horizon.
4. Results
Table 2 shows the trend analysis of the candidate variables through a descriptive survey. The CO
2 intensity had a minimum value of 0.256 kCO
2/
$2015p and a maximum of 0.403 kCO
2, with an average 0.326 kCO
2.
The wind and solar energy share in electricity production is, at most, 9.899%, with an average of 2.369%. The use of coal increases from 4500.373 Mt to a maximum of 7973.60 Mt, with an average of 6128.941 Mt. Refined oil has an average value of 3781.436 Mt worldwide.
Table 3 shows the correlation matrix. This demonstrates that green energy sources and refined coal and oil products, are helpful to decrease carbon intensity, with correlation coefficient values of −0.844, −0.912, and −0.985, respectively. An increased use of coal increases the need for wind and solar energy worldwide. Refined oil positively correlates with wind and solar electricity production, which implies the need to make refinement processes more sustainable.
Table 4 shows the unit root estimates. Carbon intensity, coal combustion and refined oil production follow a random walk hypothesis. The stated factors exhibit a nonstationary series at this level. The first differenced operator was used to make their series stationary. Hence, the order of the integration variables is unity, i.e., I(1) variables. Consistent movement was observed in the share of wind and solar energy demand in the data covering three decades. Hence, the variable became stationary at this level. The I(0) order of integration comprised a level stationary series. The mixture of I(0) and I(1) variables in the regression apparatus made it convenient to use the ARDL cointegration technique, which simultaneously absorbs different orders of integrated series of variables. The soundness of the estimator was associated with the lag dependent and independent variables as regressors that provide different variations of the coefficient estimates in the short and long term.
Table 5 shows the ARDL estimates. The lag dependent variable was significant at its current value, with a positive sign indicating that carbon intensity has increased compared to the past. Hence, the need to reduce carbon intensity is the core policy agendum of the globalized world. The increasing share of wind and solar electricity consumption decreases carbon intensity in the short and long term. The viability of renewable energy demand in achieving environmental sustainability agenda has been widely confirmed in past studies. Doğan et al. [
51] underlined green energy sources’ ability to achieve energy efficiency and cap carbon emissions through a knowledge-based production process. Zhang et al. [
52] argued that investment in renewable energy reduces carbon intensity at the middle stage of economic development. Hence, the developmental growth stage should be sustained throughout the later stages in order to achieve the green developmental agenda. Wang et al. [
53] emphasized using sustainable technological infrastructure to meet the green energy agenda. Chen et al. [
54] argued that greenfield investment in renewable energy demand works better when a country introduces different cap-and-trade mechanisms. The imposition of carbon quotas has sustained the efforts of firms to make their actions green by using renewable energy sources. Yuping et al. [
55] found that the trade-off between green energy and globalization is beneficial for sustainable development, leading to improved air quality. On the other hand, the relationship collapses when globalization is coupled with nonrenewable energy sources. Several other studies have corroborated the correlation between wind and solar energy demand and the capping of carbon emissions [
56,
57,
58,
59].
The results further revealed that increased coal and brown coal consumption increases carbon intensity worldwide. The elasticity estimates showed that a 1% increase in coal consumption increased carbon intensity by 0.343% and 0.174% in the short and long term, respectively. On the other hand, refined oil production decreases carbon intensity by −0.510% and −0.700% in the short and long run. This result implies that excessive coal consumption gives rise to many healthcare problems, leading to neurological disorders and respiratory conditions. Further, coal combustion generates many toxic air pollutants, which undermine the global green energy agenda. The refining process of petroleum oil is also faced with sustainability issues. The sustainable use of oil through cleaner technologies would help in the shift from nonrenewable to renewable fuels. These results are in line with those of earlier studies by Anser et al. [
60], Yang et al. [
61], Huang et al. [
62], Lei et al. [
63], and Kanaboshi et al. [
64]. Coal combustion adversely impacts community health [
60], and needs to apply cleaner technologies in coal mining sites and improve refinement and operational processes [
61]. The need to operationalize and construct oil pipelines opens new avenues of energy-saving and carbon reduction targets [
62]. Further, the demand to increase refinery efficiency for heavy oil processing will likely reduce carbon emissions by up to 10% [
63], which would help in achieving the Paris agreement carbon reduction agenda [
64,
65,
66].
5. Discussion
There is a lack of research that theorizes and tests the effects of industrial decarbonization on green innovation. An increased share of wind and solar energy is vital to achieving carbon neutrality. Carbon offset policies and incentive-based regulations further facilitate the realization of these goals. The operational costs of launching green energy sources should be minimized. The abundance of renewable energy depends on replenished resources which would lower energy prices for domestic consumers. Energy pricing is another vital factor that could play a role in achieving energy efficiency. The extensive use of coal has adversely affected the healthcare sustainability agenda. Toxic emissions due to coal burning include sulfur dioxide, nitrogen oxides, particulate matter, carbon dioxide, mercury and heavy metals, and fly and bottom ash. These emissions cause acid rain, smog, haze, increased GHG emissions, neurological disorders, and respiratory illness. Carbon storage, recycling and reuse are key elements in the optimal strategy to reduce the cost of coal combustion. The production of refined oil has both positive and negative environmental externalities. Positive aspects include reducing harmful pollutants and producing cleaner-burning fuels, while negative factors include the pollution of air and water. Refining crude oil is complex, involving separation, conversion, treating, blending, and auxiliary processes. Petroleum refining industries have imposed stringent environmental policies to provide safe and healthy drinking water and a clean atmosphere. Air, water, and soil pollution need to be regulated through stringent environmental policies.
Table 6 shows the ARDL Bounds estimates.
The statistics show that the Wald F-statistics value surpassed the upper bound I(1) critical value of 1% significance level. Hence, the ARDL regression results were deemed to be reliable and statistically sound.
Table 7 shows the diagnostic residual-based estimates; it was found that the residual of the ARDL estimator was normally distributed, with no autocorrelation issue, and that it had equal variance. The model was functionally stable over time. Hence, the ARDL estimates were shown to be statistically sound and free from any error.
Table 8 shows the VDA estimates in the intertemporal setting. Carbon intensity will likely decline from 2023 onward, with an estimated decrease from 92.646% in 2023 to 62.582% in 2031. The wind and solar energy share in electricity production is likely to influence carbon intensity, with a percentage change of 0.991% in 2023 to 1.931% in 2031. Sustainable refined oil production will likely influence carbon intensity, with a variance of 4.805% in 2023 to 6.957% in 2031. Coal combustion is likely to exert a greater variance shock on carbon intensity, i.e., 1.556% to 28.528% in 2023 and 2031, respectively. These estimates help in the design of sustainable energy policies for the globalized world [
67,
68].
6. Conclusions
The world is becoming carbon-free by applying sustainable technologies and the decarbonization of the global industrial economy. The utilization of renewable energy sources is the only means to meet the carbon neutrality agenda. The Paris agreement, which sought to limit the global average temperature increase to 1.5 °C, has suffered from low investment in green energy sources during the Covid pandemic. The presence of renewable energy sources in the energy mix is essential for achieving the healthcare sustainability agenda and cleaner energy production worldwide. With these points in mind, this study examined optimal wind-solar combinations to cap carbon emissions in a world aggregated dataset comprising data from the past three decades. The results showed that a combination of wind and solar would help to achieve carbon neutrality, both in the short and long run, and would contribute to industrial decarbonization by bringing about investments in hybrid renewable energy technologies.
On the other hand, the extensive use of coal and brown coal in many parts of the world limits the viability of green energy sources and adversely affects the green energy agenda. Sustainable methods of refining oil would improve the global environment. The estimates presented herein also validate the need for renewable energy source mixing in national energy grids if we are to achieve positive environmental outcomes. However, coal and brown coal use is expected to increase until 2031, with a percentage share of 28.528%. Replacing coal with renewable fuels is the optimal solution for meeting the green energy agenda worldwide. Over 85–90% of current greenhouse gas emissions come from around a dozen industries, meaning that a small number of process and product improvements could result in significant emission reductions. Implementing the appropriate technologies and policies would make it possible to achieve zero energy industrial emissions and increase profitability through cleaner industrial processes. This study suggests that governments should support industries for low carbon products, which will help minimize emissions from manufacturing processes and facilitate the achievement of circular economy targets.
Solar-wind energy has the potential to decarbonize industry and eliminate fossil fuel combustion. Innovative, clean technologies should be used with green energy sources to achieve an energy efficiency scale. Sustainable regulatory frameworks should incite industries to use solar-wind energy combinations. Knowledge spillovers and technological innovations have already influenced the renewable energy market, leading to more rapid innovation.
The PV manufacturing and wind turbine industry still require technological innovations. Investment in greenfield energy and increased domestic market demand will likely improve export competency by decarbonizing industrial production. Our analysis provides guidelines for policymakers, most notably underlining the point that a rapid shift in investment and financing policy is needed, and investment in hybrid energy systems should be considered a form of capital expenditure. It will be necessary to increase investment and develop new financing solutions.


 ,
, 

