Article

An Assessment of Heating Load Reduction by a Solar Air Heater in a Residential Passive Ventilation System

1
Matsunaga Co., Ltd., Tokyo 178-0064, Japan
2
Faculty of Engineering, Hokkaido University, Sapporo 060-8628, Japan
3
Faculty of Engineering, Hokkaido University of Science, Sapporo 006-8585, Japan
4
Misawa Homes Institute of Research and Development Co., Ltd., Tokyo 168-0072, Japan
5
School of Systems Engineering, Kochi University of Technology, Kami 782-8502, Japan
*
Author to whom correspondence should be addressed.
Energies 2021, 14(22), 7651; https://doi.org/10.3390/en14227651
Submission received: 20 October 2021 / Revised: 10 November 2021 / Accepted: 10 November 2021 / Published: 16 November 2021
(This article belongs to the Section G: Energy and Buildings)

Abstract

:
In this paper, the authors examined the technology to maximize the use of renewable energy. Passive ventilation systems are expected to reduce the energy consumption of the fan and the maintenance burden. In addition, the wall-mounted solar air heater can supply thermal energy without using any energy at all. Therefore, this paper presents a “passive ventilation system with a solar air heater” that combines a passive ventilation system with the solar air heater to preheat the air. This system can reduce the ventilation load. To evaluate the solar air heater performance in a real environment, we developed a simulation for calculating the heat collection capacity of the solar air heater, and then the system was implemented in a real building for verification. The simulation performs hourly unsteady calculations, allowing for accurate evaluation of the annual simulation. Based on the measurement results, the effects of heating load reduction and prediction methods are presented. The solar air heater reduced the monthly ventilation load by up to 50% or more, and by at least 15%. It was also confirmed that there was a high correlation between the actual measurements and the simulation results.

1. Introduction

In October 2020, the Japanese government declared a goal of virtually zero greenhouse effect gas emissions by 2050. In order to realize this goal, energy conservation in the housing sector is considered to be important. To save energy in homes, it is necessary to reduce the heating load and use renewable energy at the same time.
In recent years, passive ventilation systems have been attracting attention in Japan, mainly for residential buildings. This is because passive ventilation systems are expected to reduce the energy consumption of fan power and reduce the burden of maintenance. A passive ventilation system mainly uses the stack effect. This has been generally recognized as a ventilation method before mechanical ventilation systems became widespread, and now, as one of the ventilation methods for buildings, it has official technical standards [1,2], just like mechanical ventilation systems. Since the driving force of a passive ventilation system is natural, it is more difficult to control the amount of ventilation compared to a mechanical ventilation system. If the ventilation volume is too high, heat loss will be high, causing discomfort. Moreover, too little ventilation results in poor indoor air quality (IAQ). Shaw et al. [3] conducted an experiment using a two-story experimental house with a heating system in the basement under four conditions, including the method of introducing outside air and the presence or absence of a vent stack. They proposed a mathematical formula to determine the ventilation frequency from the airtightness, neutral pressure level, and inside/outside temperature difference of (1) introducing outside air into the basement through openings in the exterior walls; (2) introducing outside air through the air supply pipe connected to the heating system; (3) installing a vent stack leading directly from the basement to the rooftop in accordance with (1); (4) installing a vent stack leading directly from the basement to the rooftop in accordance with (2). Fukushima et al. [4] proposed a passive ventilation system for Japanese conventional wooden houses. This system takes in fresh outside air to the underfloor space that is insulated at the basement walls and heated by radiators. Room air is exhausted through a vent stack at the top of the house. Floor openings and interior wall cavities are also used for circulating the fresh outside air heated in the underfloor space. They measured the ventilation rate and indoor temperature in a two-story experimental house equipped with the system, and showed that the ventilation rate during the heating period was generally satisfactory to the design ventilation rate, and that the increase in heat loss was 10% compared to the heat loss with a constant ventilation rate of 0.5 times/h. Southall [5] showed through simulation that demand control using temperature, humidity, and CO2 sensors can significantly reduce the energy consumption for heating a building. On the other hand, a hybrid ventilation system has been proposed to improve IAQ by using a mechanical ventilation system in combination with a passive ventilation system while taking advantage of its energy-saving properties. Turner et al. [6] showed through simulation that it is possible to meet IAQ standards with less energy by combining mechanical fans and mechanical flow dampers controlled by a residential ventilation controller to prevent over- and underventilation in passive ventilation systems. The simulation shows that it is possible to meet IAQ standards with less energy. Jreijiry et al. [7] have shown by simulation that demand control combined with CO2 and motion sensors can reduce occupants’ exposure to high CO2 concentrations while reducing fan power consumption.
However, in the above studies, there is no research to obtain thermal energy like in the heat exchange ventilation system. On the other hand, the solar air heater is a device to heat outside air by solar radiation through the transparent top cover of the case. It usually has fans to carry the heated air into room space. The heated air can reduce the heating load in the winter season. Therefore, this paper was conducted to enable simple and easy ventilation load reduction in passive ventilation systems. By incorporating solar air heater into the air inlet of the passive ventilation system, all the outdoor air supplied is heated by solar heat. This will reduce the ventilation load. Both the passive ventilation system and the solar air heater are designed to utilize renewable energy, which is an important technology to achieve the goal of zero carbon.
There are many studies to improve the solar gain efficiency of solar air heater. Potter et al. [8] proposed a new fin shape that can achieve high heat collection efficiency with low air resistance to reduce the airflow energy. Singh et al. [9] presented the tapered solar air heater integrated on the building wall that increases the thermal effectiveness of the device by 70%. Zhao et al. [10] proposed the solar air heater with built-in PV and fan operation using electricity generated by the PV system, which does not require fan power and improves the efficiency of solar air heater. Hosseini et al. [11] presented the numerical studies for the effect of fins’ shadow in SAH. There are many studies on a performance evaluation to examine the effectiveness of the solar air heater. Rodonò et al. [12] created a mathematical model of air heating and natural convection and developed a practical tool to optimize the materials and dimensions in the design of the solar air heater. Zhai et al. [13] have developed a mathematical model based on the heat balance equation, verified it by experiments and proposed the optimum tilt angle and panel size. Ho et al. [14] have presented a mathematical model that utilizes commonly and widely-used exterior steel plates for heat collection and allows prediction of their performance. Although these mathematical models are constant conditions with no variation, Dissa et al. [15] have built a computational model in unsteady to evaluate the solar air heater performance in a real environment and enable proper prediction of the collector temperature. In order to evaluate solar heat in combination with ventilation, unsteady computations that can simulate time variability are required. Therefore, a simulation using unsteady calculations was created to accurately evaluate the annual heat collection. As a measured evaluation of the solar air heater, Wang et al. [16] found that the panels that slip through the heat-absorbing layer have the highest heat collection efficiency based on the investigations of the previous studies. They reported the performance of the heat collection efficiency in different flow rates in New Zealand. Budea [17] measured the solar air heater under Romanian climatic conditions and reported that the heat collection efficiency was about 50%. A mathematical model was developed to determine the required area of the solar air heater to improve ventilation, and case studies were conducted in residential and office buildings to make recommendations.
With regard to verifying the combination of passive ventilation and a solar air heater in real buildings, Khedari et al. [18] proposed the dwelling with SAH on the roof and verified the natural ventilation rate was 0.08–0.15 m3/(s·m2). Yu et al. [19] proposed and verified a hybrid system of active and passive systems. They proved that the indoor environment in both the south and north rooms could maintain a room temperature of 17 °C in winter in a solar demonstration building. Li et al. [20] proposed an energy-saving system that can maintain CO2 concentration below 1000 ppm in an elementary school during winter. However, a simple and less burdensome system needs to be proposed for houses where the maintenance and management needs to be done by the owners themselves.
As a new approach, we implemented solar air heater, which has not been implemented in actual houses before, in an actual house using wall-mounted solar heat collection panels as the outdoor air intake part of the passive ventilation system proposed by Fukushima et al. [4], which is a stand-alone system that does not require an external power supply. Actual measurements will be conducted to verify the performance of the solar air heater and the effect of reducing the ventilation load. The accuracy of the simulation for predicting the amount of heat collection was also investigated based on actual measurements, with the aim of establishing a method for accurately evaluating the annual amount of heat collection. Since the ventilation load leads to the reduction of heating energy, we propose a passive ventilation system that can reduce the heating load outside the building envelope.

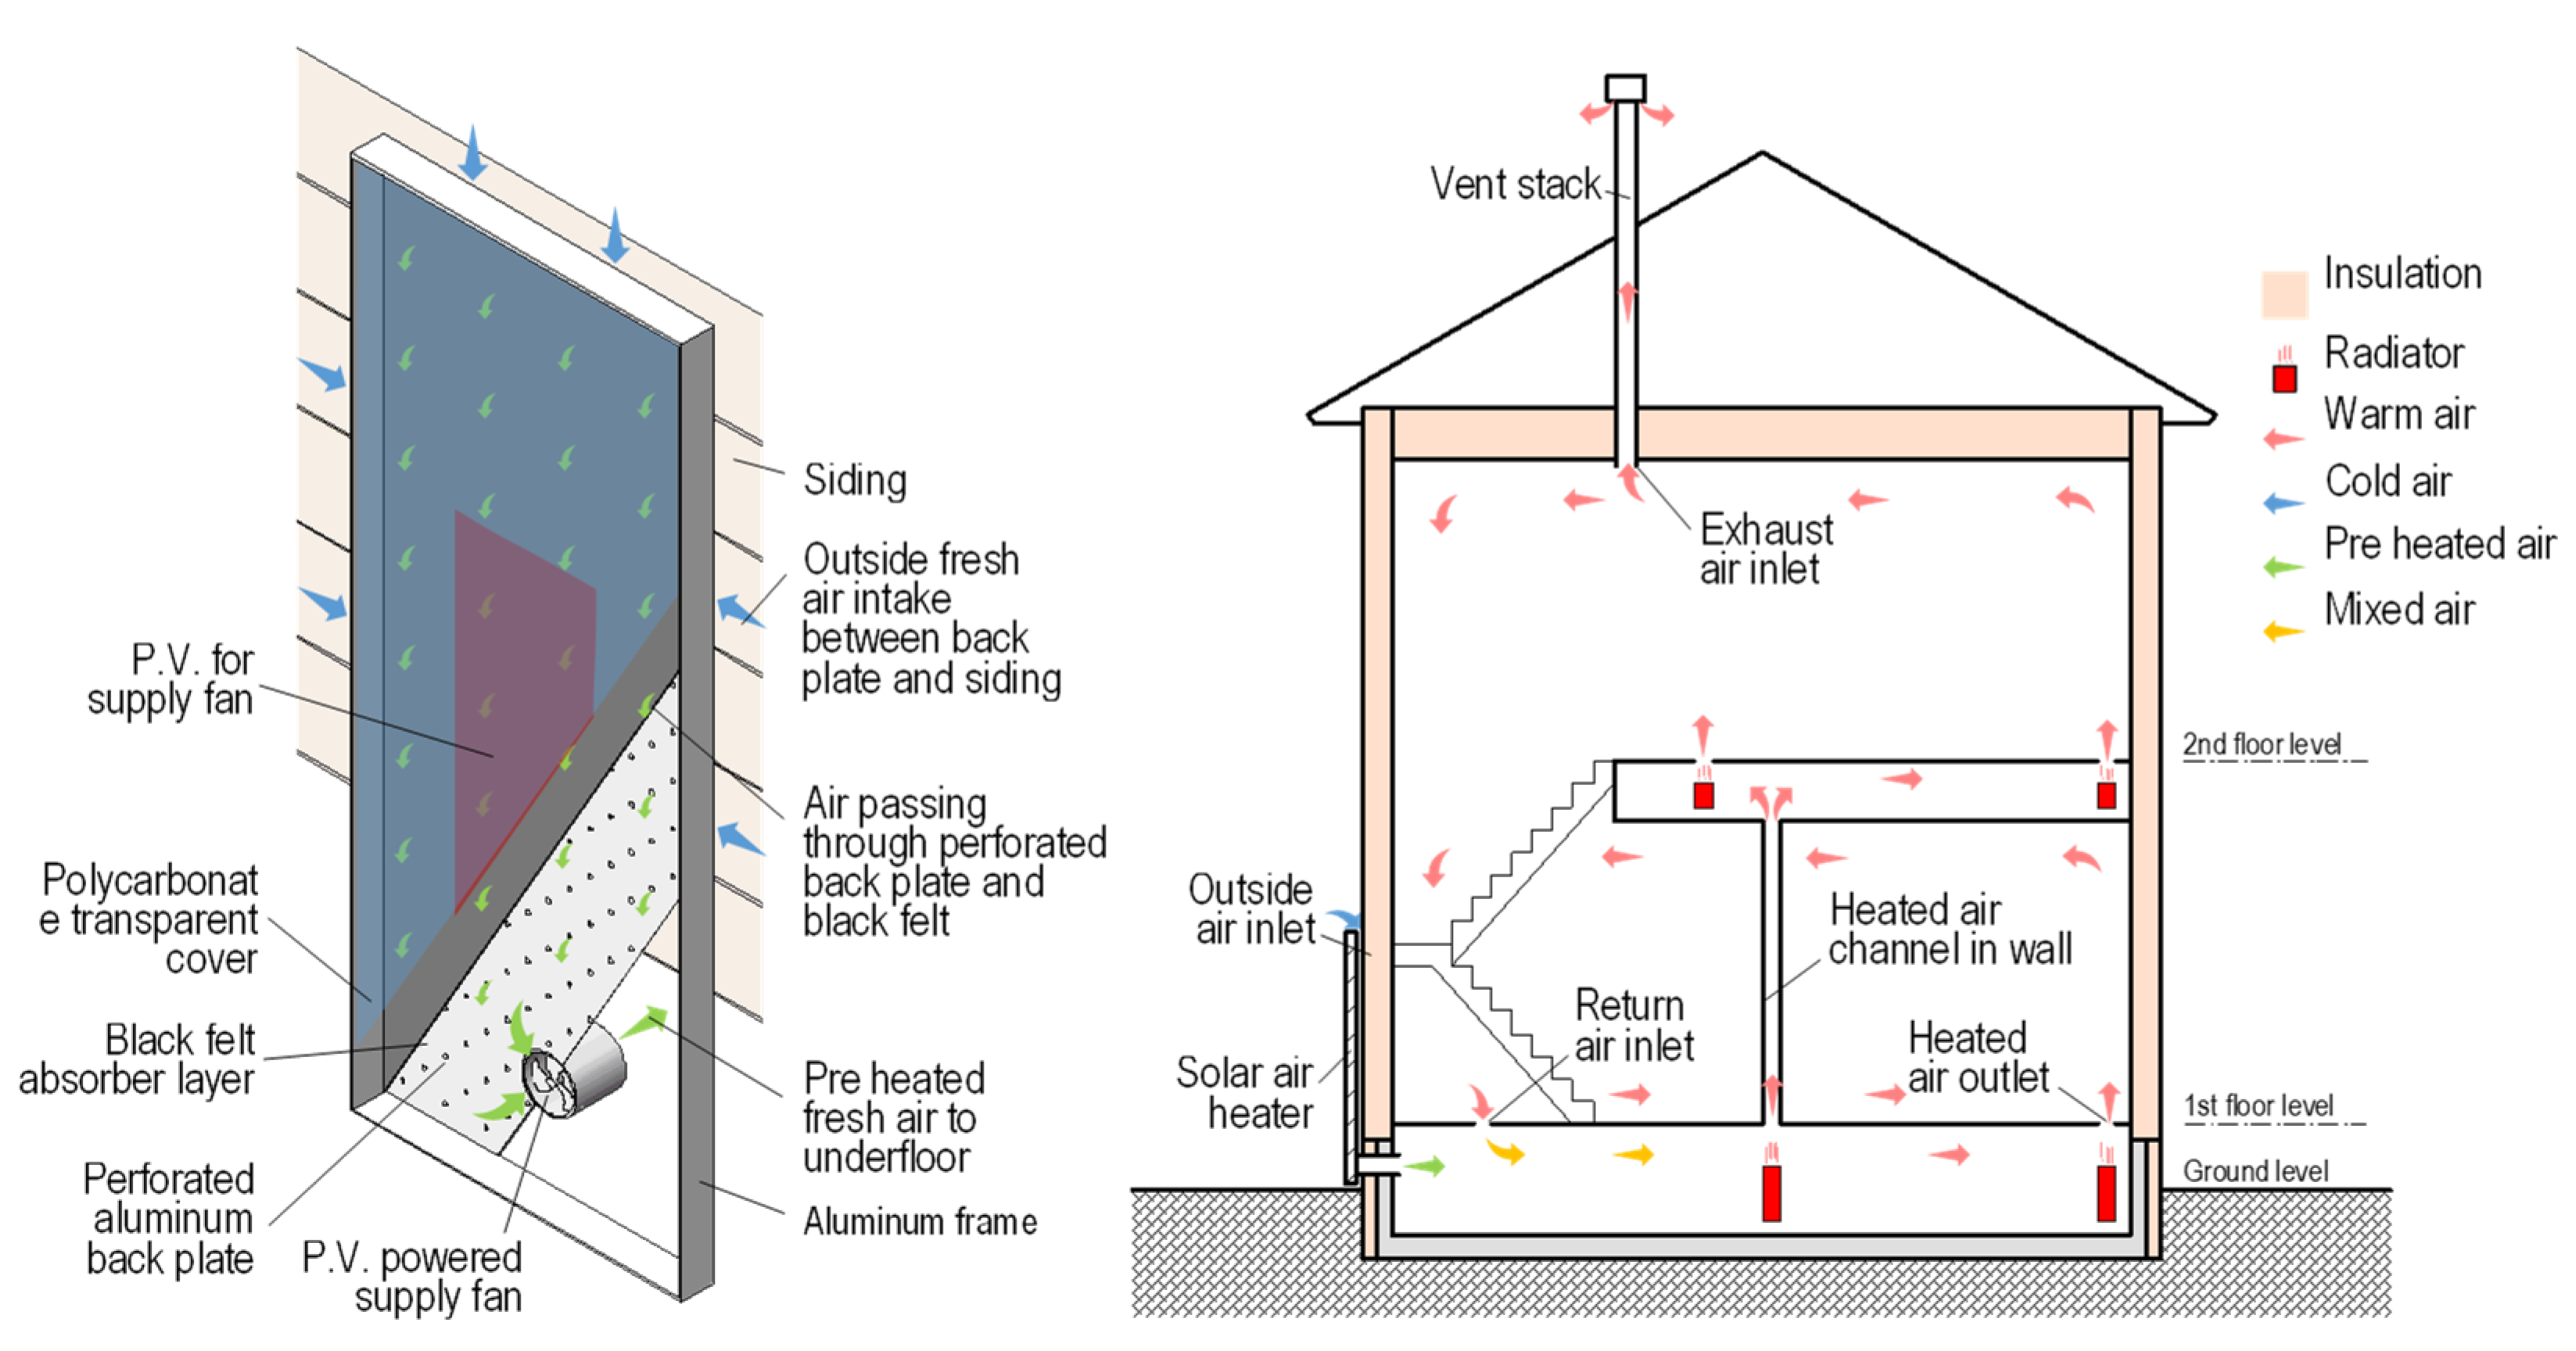
2. Passive Ventilation System with a Solar Air Heater

2.1. Overview

Figure 1 shows an overview of the system studied in this research. The outside air is supplied to the underfloor cavity through the solar air heater. The underfloor is an air supply chamber with foundation wall insulation. The solar air heater is connected to the fresh outside air intake. The outside air introduced into the underfloor is heated by the underfloor heating and rises. The rising air is supplied to the room through a rattle. It is also supplied to the second floor through the rising wall. Some of the air is exhausted out of the vent stack through an exhaust vent installed at a higher level. The vent stack should be mounted high to get the difference in height. The air, which is both ventilated and heated, returns to the subfloor as return air through a descending rattle. Therefore, the air of the entire house circulates. The downward rattle should be installed in a location where there is no heat source, and the temperature is relatively low.
Table 1 shows the performance of the solar air heater. The solar air heater consists of two layers of transparent polycarbonate with insulating properties on the solar radiation acquisition side. Outside air is drawn in through small holes punched in the back of the panel. The air then passes through a felt-like heat-absorbing layer into the panel. The air heated by the solar heat inside the panel is supplied to the room by a built-in fan. The fan is driven by electricity from the panel’s built-in power generation panel. The actual heat collection area per panel is 1.326 m2 (1950 mm × 680 mm). The maximum capacity of the solar air heater is about 100 m3/h, and they can heat outside air by about 30 °C, with a maximum capacity of about 1000 W. The fan airflow rate varies from 60 to 110 m3/h depending on the amount of solar radiation and controller adjustment.

2.2. Method for Predicting the Amount of Heat Collected by a Solar Air Heater

2.2.1. Calculation Method of Heat Collection Capacity

In order to accurately predict the heat collection capacity of the air heater actually installed in a building, it is necessary to calculate the time variation of the heat collection capacity. In general, the heat collection capacity of the solar air heater is expressed as Equation (1) in a steady state. Equations (2) and (3) show the time variation of the heat balance in the air layer inside the panel of the solar air heater. The M ¯ in Equation (2) is defined as the equivalent heat capacity, which is the combined heat capacity of the air and components in the device.
Once M ¯ is obtained, it is possible to calculate the amount of heat collected by entering numerical values into these equations. Once these values are obtained and the time variation of the temperature is known, it is possible to calculate the heat collection volume taking into account the time variation.
Q u = 0.348 Q ( T i T o )
M ¯ d T d t = Q u + U F A F ( T i T o ) + U B A B ( T i T o ) + J R A F
M ¯ = M A + M B

2.2.2. Identification of Heat Capacity for Heat Collection Calculation

Table 2 shows the summary of the experiments to identify M ¯ . The solar air heater was set up as shown in Figure 2, and the amount of vertical solar radiation on the panel, the temperature at each point, and the blow-off temperature were measured. The solar radiation measurements were instantaneous and were greatly affected by temporary clouds and shadows. To minimize measurement errors, the measurement interval was set to one second, and the results were averaged over one minute for evaluation. The M ¯ was identified from the experimental results and Equations (2) and (3).
Figure 3 shows the results of the experimental on 16 February 2011, which was taken as the representative day. M B was identified from the measured value by the least-squares method to minimize the error from the calculation, and M B is 5057 J/K.
Figure 4 shows the correlation between the measured and calculated values. The error was calculated by subtracting the calculated value from the measured value and dividing by the calculated value. The error between the calculated and measured values averaged 1.8%, which is a good correlation, and it can be concluded that the theoretical equation can predict the time variation of the heat collection rate.

3. Building Used for Verification

3.1. Building Overview

The measurements were conducted at a two-story wooden house in Sapporo, Hokkaido.
Figure 5 shows a photograph of the building and Table 3 shows an outline of the building. The dotted lines indicate the solar air heater, which also serve as air supply vents. The city of Sapporo, where the building was constructed, is located at latitude 43° N and longitude 141° E, and the average outside temperature in the coldest month is −4.6 °C. It is an area with heavy snowfall, with a maximum snow depth of 80 cm and a cumulative snowfall of more than 550 cm.
Two solar air heaters are installed on the south exterior wall, which also serves as the fresh outside air intake for passive ventilation. The floor area is about 125 m2, and the family consists of four people. The heating is done by running hot water through a radiator installed underfloor space.

3.2. Measurement Items and Measurement Period

Figure 6 shows the floor plan of this measurement and the outline of the installation of the measuring equipment. Measurements were taken for indoor and outside temperature, humidity, carbon dioxide concentration, air velocity, temperature and humidity of supply air, the solar air heater, and exhaust air, incident solar radiation, and heating usage. The measurement data used in the analysis was taken from October 2015 to May 2016. For the verification of the solar air heater performance, the days with more than 4 h of sunlight were selected as “sunshine days” according to the data from the Japan Meteorological Agency, and the heat collection time was set from 8:00 to 16:00. The performance evaluation of the solar air heaters is done with two panels.
The indoor environment during the measurement period is shown in Table 4. The temperature, humidity, and air environment in the room were maintained at a good level.

4. Verification of the Effectiveness of the Solar Air Heater

4.1. Solar Air Heater Performance

Figure 7 shows the temperature rise effect ( T i T o ) and the heat collection rate Q u of the solar air heater during the sunny days in January. Eleven sunny days were observed in January. The temperature rise effect was evaluated using one solar air heater on the left side of the room where the measurement equipment was installed.
The maximum amount of heat collected per hour by one solar air heater was about 0.85 kWh, and the average amount of heat collected at 11:00 a.m., when the highest amount of heat was collected, was 0.55 kWh. The standard deviation was as large as 6.8 °C for temperature rise and 0.23 kWh for the solar air heater, showing the difference in the effect of sunlight. In January, solar radiation acquisition was not obtained before 9:00 and after 14:00. This was due to the influence of neighboring houses in January when the solar altitude was low. When the amount of heat collected per day on sunny days was calculated, the maximum was 3.3 kWh, and the average for 11 days was 2.33 kWh.
Next, we evaluated the solar air heater for the period from October 2015 to May 2016, including nonsunny days. Figure 8 shows the monthly average daily heat collection and daily average incident solar radiation of the solar air heater as a box-and-whisker diagram. The maximum standard deviation was 2 kWh in January, indicating that it was greatly affected by the weather. Even with this influence of the weather, the lowest daily average heat collection was 2.3 kWh/day on average in December, and the highest was 3.2 kWh/day in March. The average heat collection during the heating period was 2.1 kWh/day.
In order to clarify the efficiency of the solar air heater, Figure 9 shows the relationship between the amount of incident solar radiation and the amount of heat collected by the solar air heater averaged over one day.
The variance in the actual measurement is due to the influence of external wind, shadow of the entrance frame, snow and dirt adhesion, and other reasons. Although there was some variation, the average measured heat collection efficiency was about 58%, confirming that there was a high correlation between heat collection and solar radiation.

4.2. Effect of a Solar Air Heater on Ventilation Load Reduction

Figure 10 shows the relationship between the heat collection volume and the ventilation load, and the ventilation load reduction ratio, which is the ratio of the heat collection volume to the ventilation load. The data was calculated and evaluated for a total of one day. The figure shows the median value with standard deviation.
The results show that the solar air heater can reduce the ventilation load by more than 15% in the period from November to February, including the coldest month, by less than 25% in March, and by 30% to 40% in April, May, and October. It was found that the ventilation load for ventilation could be reduced by the solar air heater.
In addition, it was confirmed that the reduction rate varied greatly depending on the difference in ventilation load, even though the solar altitude was about the same and the amount of heat collected was almost the same, as in the case of October and February; and that the ventilation load reduction rate varied depending on the solar altitude and the amount of solar radiation due to weather, even though the ventilation load was about the same, as in the case of December and March, and November and April.

4.3. Comparison of Simulated and Measured Heat Collection Capacity

Figure 11 shows the relationship between the heat collection capacity and the ventilation load based on the simulation of heat collection capacity prediction results with daily average values. The solar radiation and ventilation load are measured values. The error was calculated by subtracting the calculated value from the measured value and dividing by the calculated value. The error between the calculated and measured values averaged 9.0%, which is a good correlation. Relatively speaking, the simulation results show slightly higher values. It is considering that that the heat collection efficiency may drop due to various factors such as shadows and dirt on the panels in the actual measurement. It was confirmed that the results were highly correlated and reproducible.

5. Conclusions

In order to utilize renewable energy in an energy-efficient passive ventilation system, a study was conducted to reduce the ventilation load by combining the solar air heater in the air supply section. The following is a summary of the findings obtained through the verification of the heat collection calculation simulation, actual measurements, and evaluation.
(1)
A simulation was constructed to predict the heat collection capacity considering the time variation. To obtain a part of the heat capacity of the surrounding components, the measured and calculated values were identified by the least-squares method, and a part of the heat capacity of the surrounding components was set to be 5057 J/K. As a result of verification of the measurements and calculations, high reproducibility was obtained. As a result of verification of the measured and calculated values, high reproducibility was obtained.
(2)
Actual measurements were conducted in a real building: the maximum temperature increase effect of the solar air heater was about 30 °C, the maximum heat collection per hour for one solar air heater was 0.85 kWh, and the average heat collection at 11:00, when the most heat collection was obtained, was 0.55 kWh. The standard deviation was as large as 6.8 °C for temperature rise and 0.23 kWh for heat collection, showing the difference in the effect of sunlight. In January, when the solar altitude was low, solar radiation acquisition was not obtained before 9:00 a.m. and after 2:00 p.m. due to the influence of neighboring houses.
(3)
The maximum heat collection rate was more than 7 kWh/day in January to March. In terms of daily average heat collection, including days without sunshine, the lowest was 2.3 kWh/day in December and the highest was 3.2 kWh/day in March. An average of 2.1 kWh/day of heat collection was obtained during the heating period.
(4)
The heat collection efficiency of the solar air heater was about 58%.
(5)
The ventilation load reduction rate of the solar air heater was just over 15% from November to February, just under 25% in March, and about 30% to 40% in April, May, and October.
(6)
As a result of comparing the simulation results of the heat collection volume calculation with the actual measurement, it was confirmed that the simulation was highly reproducible.
In this report, it was found that this system is effective as one of the methods that can reduce the ventilation load. In this way, the performance of the solar air heater has been verified, and the possibility of adapting it to heating has also been clarified. Furthermore, if it becomes possible to simulate the effects of installing the solar air heaters in actual buildings and the effects of energy conservation in residential buildings, it will be possible to promote the adoption of renewable energy.

Author Contributions

Conceptualization, J.M. and K.K.; validation, all authors; writing—original draft preparation, J.M. and K.K.; writing—review and editing, all authors; funding acquisition, K.K. All authors have read and agreed to the published version of the manuscript.

Funding

This work was supported by JSPS KAKENHI Grant Number JP16K06606.

Conflicts of Interest

The authors declare no conflict of interest.

Nomenclature

Q u Heat collection capacityW
M ¯ Equivalent heat capacityJ/K
M A Heat capacity of air in panelJ/K
M B Part of the heat capacity of surrounding componentsJ/K
Q Air flowm3/h
U F U-value (front of panel)W/(m2K)
U B U-value (back of panel)W/(m2K)
A F Area (front of panel)m2
A B Area (back of panel)m2
T i Temperature (hollow layer in the device)°C
T o Temperature (outside air)°C
J R Amount of solar radiation transmitted into the panelW/m2
t Times

References

  1. NBS. The Building Regulations 2010, Approved Document F1 Means of Ventilation (2010 Edition Incorporating 2010 and 2013 Amendments); Technical Report; NBS: Norwich, UK, 2015. [Google Scholar]
  2. EU. EN 16798-7: 2017. Energy Performance of Buildings-Ventilation for Buildings-Part 7: Calculation Methods for the Determination of Air Flow Rates in Buildings including Infiltration; EU: Maastricht, The Netherlands, 2017. [Google Scholar]
  3. Shaw, C.Y.; Kim, A.K. Performance of passive ventilation systems in a two-storey house. In Proceedings of the 5th AIVC Conference, Reno, NA, USA, 1–4 October 1984; 11.1–11.27 (Paper 11). Available online: https://www.aivc.org/sites/default/files/members_area/medias/pdf/Conf/1984/Shaw.pdf (accessed on 24 September 2015).
  4. Fukushima, A.; Enai, M.; Miyaura, M.; Honma, Y. Application of passive ventilation system with crawl space heating to the practical house. J. Archit. Plan. Environ. Eng. 2000, 532, 51–56. (In Japanese) [Google Scholar] [CrossRef]
  5. Southall, R.G. An assessment of the potential of supply-side ventilation demand control to regulate natural ventilation flow patterns and reduce domestic space heating consumption. Energy Build. 2018, 168, 201–214. [Google Scholar] [CrossRef]
  6. Turner, W.J.N.; Walker, I.S. Using a ventilation controller to optimise residential passive ventilation for energy and indoor air quality. Build. Environ. 2013, 70, 20–30. [Google Scholar] [CrossRef]
  7. Jreijiry, D.; Husaunndee, A.; Inard, C. Numerical study of a hybrid ventilation system for single family houses. Sol. Energy 2007, 81, 227–239. [Google Scholar] [CrossRef]
  8. Pottler, K.; Sippel, C.M.; Beck, A.; Fricke, J. Optimized finned absorber geometries for solar air heating collectors. Sol. Energy 1999, 67, 35–52. [Google Scholar] [CrossRef]
  9. Singh, A.P.; Kumar, A.; Singh, O.P. Natural convection solar air heater: Bell-mouth integrated converging channel for high flow applications. Build. Environ. 2021, 187, 107367. [Google Scholar] [CrossRef]
  10. Zhao, Y.; Meng, T.; Jing, C.; Hu, J.; Qian, S. Experimental and numerical investigation on thermal performance of PV-driven aluminium honeycomb solar air collector. Sol. Energy 2020, 204, 294–306. [Google Scholar] [CrossRef]
  11. Hosseini, S.S.; Ramiar, A.; Ranjbar, A.A. The effect of fins shadow on natural convection solar air heater. Int. J. Therm. Sci. 2019, 142, 280–294. [Google Scholar] [CrossRef]
  12. Rodonò, G.; Volpes, R. Heat transfer calculation in a free convection air solar collector. Energy Build. 1998, 27, 21–27. [Google Scholar] [CrossRef]
  13. Zhai, X.Q.; Dai, Y.J.; Wang, R.Z. Experimental investigation on air heating and natural ventilation of a solar air collector. Energy Build. 2005, 37, 373–381. [Google Scholar] [CrossRef]
  14. Ho, K.T.K.; Loveday, D.L. Covered profiled steel cladding as an air heating solar collector: Laboratory testing, modelling and validation. Energy Build. 1997, 26, 293–301. [Google Scholar] [CrossRef]
  15. Dissa, A.O.; Ouoba, S.; Bathiebo, D.; Koulidiati, J. A study of a solar air collector with a mixed “porous” and “non-porous” composite absorber. Sol. Energy 2016, 129, 156–174. [Google Scholar] [CrossRef]
  16. Wang, Y.; Boulic, M.; Phipps, R.; Plagmann, M.; Cunningham, C. Experimental Performance of a Solar Air Collector with a Perforated Back Plate in New Zealand. Energies 2020, 13, 1415. [Google Scholar] [CrossRef] [Green Version]
  17. Budea, S. Solar Air Collectors for Space Heating and Ventilation Applications-Performance and Case Studies under Romanian Climatic Conditions. Energies 2014, 7, 3781–3792. [Google Scholar] [CrossRef]
  18. Khedari, J.; Hirunlabh, J.; Bunnag, T. Experimental study of a roof solar collector towards the natural ventilation of new houses. Energy Build. 1997, 26, 159–164. [Google Scholar] [CrossRef]
  19. Yu, Z.; Ji, J.; Sun, W.; Wang, W.; Li, G.; Cai, J.; Chen, H. Experiment and prediction of hybrid solar air heating system applied on a solar demonstration building. Energy Build. 2014, 78, 59–65. [Google Scholar] [CrossRef]
  20. Li, X.; Zheng, S.; Tian, G.; Zhang, L.; Yao, W. A new energy saving ventilation system assisted by transpired solar air collectors for primary and secondary school classrooms in winter. Build. Environ. 2020, 177, 106895. [Google Scholar] [CrossRef]
Figure 1. Outline of a passive ventilation system with a solar air heater.
Energies 14 07651 g001
Figure 2. Experimental device.
Energies 14 07651 g002
Figure 3. Measured and calculated supply air temperature.
Energies 14 07651 g003
Figure 4. Correlation between measured and calculated supply air temperature.
Energies 14 07651 g004
Figure 5. Facade of the house with the solar air heater on external wall.
Energies 14 07651 g005
Figure 6. Plan and measurement plan.
Energies 14 07651 g006
Figure 7. Temperature rise effect and heat collecting effect by time.
Energies 14 07651 g007
Figure 8. Heat collecting effect of two solar air heaters.
Energies 14 07651 g008
Figure 9. Relationship between incident solar radiation and heat collection.
Energies 14 07651 g009
Figure 10. Relationship between heat collection volume and ventilation load.
Energies 14 07651 g010
Figure 11. Relationship between heat collection and ventilation load in simulation.
Energies 14 07651 g011
Table 1. Technical data specification of the wall-mounted a solar air heater.
ParameterValueUnit
Dimension1974 × 704 × 55mm
Weight14kg
Air flow60~110m3/h
Ventilator–power consumption3.7W
Solar cell–power generation12W
Air outlet on collector125mm
Maximum heat collection capacity1000W
Rise in temperature compared to
outside temperature
30°C
Table 2. Outline of experiment.
ItemDetail
Date16 Febuary 2011
LocationNerima-ku, Tokyo
Installation azimuthDue south
Solar radiationPyrheliometer PCM-01 (Made by Prede)
TemperatureT type thermocouple
Measurement interval1 s
Table 3. Outline of a house.
ItemDetail
LocationSapporo City, Hokkaido
CompletionJune 2015
Family membersAdult: 2 people, Child: 2 people
Total floor area125.87 (m2)
1st floor: 65.42 (m2), 2nd floor: 60.45 (m2)
Building volume352.76 (m3)
Q value0.79 (W/(m2K))
* Air change rate: 0.4 (times/h)
C value0.3 (cm2/m2)
* Equivalent leakage area
U valueCeiling: 0.08 (W/(m2K))
Exterior wall: 0.12 (W/(m2K))
Window: 0.91 (W/(m2K))
Table 4. Indoor environment during the measurement period.
Measurement ItemAvgSDUnit
Outside air temperature4.17.1°C
Indoor temperature21.51.4°C
Indoor relative humidity50.34.7%
Indoor CO2 concentration743192ppm
Publisher’s Note: MDPI stays neutral with regard to jurisdictional claims in published maps and institutional affiliations.

