1. Introduction
Transport, as highlighted in the Transport in the European Union—Current Trends and Issues [
1] report, is a key sector of the European economy. It provides products and services both to citizens and economic operators of EU Member States, including the V4 countries and to their trading partners. It is an important instrument for ensuring mobility, contributing to the free movement of people in the internal market. According to EU data, covering 27 Member States, 10.1 million people were employed in the transport department in 2017, which accounted for 5.38% of the total number of employees.
In turn in passenger transport, in 2017, more than 2 million people were employed, which constituted 1.08% of the total number of employees. The structure of employment in transport in the V4 countries is similar. The largest number of people employed in transport per all employees was in Hungary—5.73%, and the lowest in Slovakia—4.50%. When it comes to people employed in passenger transport, the most people work in this sector in Hungary—1.13% of the total number of employees, and the least in Slovakia—0.62%.
It should be added that in 2017 the number of people employed in transport in the entire EU increased by 1.2 (percentage points) compared to 1995 and by about 0.2 (percentage points) compared to 2015 [
2]. According to Eurostat data, the transport department successfully increased its share in the gross domestic product (GDP) of the EU from 4% in 1995 to over 5% in 2019. Unfortunately, the COVID-19 pandemic, which hit the transport department quite hard, caused the share in 2020 to drop by 1.6% in GDP. The Czech Republic and Slovakia were the most severely affected, where the decline was at the level of −2.2% and −2.3%. On the other hand, in Poland, there was a decrease of −0.7%, while in Hungary the level of the share of transport in GDP did not change [
3].
The development of transport also translates into the dynamics of changes in passenger transport. Between 1995 and 2018, the number of passengers in the EU-27, expressed in passenger-kilometers (pkm), increased by 31.5% [
2]. Forecasts show that passenger transport in 2018–2050 will increase by approx. 32.5% [
4].
However, the successful development of transport brings with it negative effects in the form of increased air pollution. This is the transport, including passenger transport, that generates a significant part of harmful substances, including non-methane volatile organic compounds (NMVOC), nitrogen oxides (NOx), carbon monoxide (CO), particulate matter (PM) PM
2.5, and PM
10 [
5]. The report published in 2020 by the European Environment Agency (EEA) shows limit values of air quality exceeded in 2018 in most EU Member States. Therefore, PM
10 in 20 countries; PM
2.5—6; O
3—20; NOx—16; BaP—14. Unfortunately, the countries belonging to the Visegrad Group (V4) are in the lead in these statistics, as in the countries, standard levels of each harmful substance have been exceeded [
6]. Transport is also a major contributor to greenhouse gas emissions, ranking second after the energy generation sector. In 2019, around 30% of the CO
2 emitted in the EU, was generated by transport. Road transport is the most responsible for 72% of all transport emissions [
7]. Unfortunately, in this regard, the situation is constantly becoming worse. From 1995 to 2018, CO
2 emissions in transport in the EU increased by 23.6%, but in the last decade, there was a slowdown, as in 2018 transport generated 2.5% more CO
2 into the atmosphere than in 2010 (
Table 1). The situation is even worse in the V4 countries. In Poland, the increase in CO
2 emissions from transport in 2018 compared to 1995 amounted to as much as 181%. In the Czech Republic and Hungary, the emission growth dynamics in the presented period amounted to approx. 85%, and in Slovakia to 41.8%. Similar to the EU, also in the V4 countries, a decreasing dynamic of the increase in greenhouse gas emissions have been observed.
Given the systematic increase in the level of greenhouse gas emissions in this sector, which is carrying the risk of undermining the results of EU action, it is becoming increasingly important to build a model of sustainable mobility to achieve climate goals. The model aforementioned is built based on the majority are the CNG buses, numerous legal documents published both at the European level and in the individual Member States. The laws, regulations, communications, and strategies are the that affect the dynamic development of low- and zero-emission transport, as well as to other solutions helping to reduce the negative impact on the natural environment. The greatest development in this area took place in public transport, and above all in bus transport. Buses and coaches are the most popular means of passenger transport in the EU, serving cities, suburban and rural areas. They are also the most cost-effective and flexible forms of public transport, requiring minimal investment in launching new lines or routes. According to the United Nations, Economic Commission for Europe, buses, and coaches are defined as “vehicles with at least four wheels, designed and constructed for the carriage of passengers, and having more than eight seats in addition to the driver’s seat” [
8]. With one bus that can replace 30 cars on the road, buses help reduce traffic congestion. According to the Driving Mobility for Europe, 55.7% of all journeys by public transport in the EU (32.1 billion trips per year) are made by the city and suburban buses. Buses on average travel 511.4 billion kilometers in the EU (8.5% of passenger transport by land) [
9].
Consequently, many of the activities, aimed at building the model of sustainable mobility, will be directed towards the bus and coach market. We can already see successful increasing activities in this area. Carriers invest in low-emission and zero-emission vehicles. Electric buses are becoming more and more popular, and the share of those powered by hydrogen is gradually increasing in the structure of vehicles. Virtually every carrier plans further investments in rolling stock, which will have to meet more and more stringent environmental requirements. It should be noted, however, that most decisions about choosing a specific type of vehicle, and most of all the type of its fueling, are based on cost calculation. Therefore, in this article, the main goal was to assess the economic efficiency of operating buses with various drives, with particular emphasis on low-emission, and zero-emission vehicles in the V4 countries. Additionally, an assessment of the direct and indirect costs related to the purchase of these vehicles was carried out. The research allowed us to obtain an answer to the question concerning the choice of the most effective direction of investments in ecological rolling stock, taking into account the micro and macroeconomic indicators in the discussed countries.
Accordingly, in the article, the following structure is introduced. The first part deals with the theoretical aspects of the development of low- and zero-emission transport. This section presents statistical data on the development of this sector in recent years in the V4 countries compared to the EU. The second part presents the materials and methods to develop this topic. At the end of the work, the results of the research were published and a discussion was held on them. The final part of the article consists of conclusions and a summary.
2. Development of Low and Zero-Emission Transport in the Countries of the Visegrad Group
In the introduction, it was noted that transport is responsible for around 25% of total greenhouse emissions in the EU resulting from human activities. Through this source, nitrogen oxides (especially nitrogen dioxide), suspended particles of PM
10 and PM
2.5 fractions (dust particles), carbon monoxide, and hydrocarbons enter the air [
10]. All pollutants have many negative effects on human, animal, and plant health. Therefore, the aforementioned policy of the EU, but also all the Member States, began to be based on activities aimed at reducing air pollution by transport, as well as on public transport promotion. The European Commission and the European Parliament play a special role here, and these institutions pass many legal acts aimed at reducing the negative impact of transport on the environment. In 2011, the European Commission issued a White Paper on the future of transport by 2050 and set out a vision to reduce greenhouse gas emissions caused by transportation by at least 60% by 2050 compared to 1990. By 2030, it aims to reduce greenhouse gas emissions in this sector by approximately 20% compared to the 2008 level [
11]. In turn, the European Low-Emission Mobility Strategy of 2016 set the goal of improving the transport system, accelerating the introduction of low-emission fuels, and switching to low- or zero-emission vehicles [
12]. The next Commission document of 2018 entitled “A Clean Planet for All: A European long-term strategic vision for a thriving, modern, competitive and climate neutral economy” identified as an important policy objective to guide the EU transition to a clean economy, and to zero gas emissions greenhouse by 2050. The strategy also stresses the need for a systems approach and underlines the importance of the transition to low-emission and zero-emission vehicles, emphasizing the role of electrification and renewables [
13]. Another important document is the Directive 2009/33/EC, updated in 2019, on the promotion of clean energy-efficient road transport vehicles, which supplements the horizontal regulations of the European Union [EU] on public procurement. By introducing the obligation to take into account—when awarding public contracts for road transport vehicles—the energy factor and environmental impact during the vehicle’s life cycle, it is to stimulate the market for clean and energy-efficient vehicles, contribute to the reduction of CO
2 emissions and air pollutant emissions, and increase energy efficiency [
14]. In 2018, the implementation of the Green Deal for Europe began, which obliges all 27 EU Member States to transform Europe into the first climate-neutral continent by 2050. Consequently, emissions reductions of at least 55% are expected by 2030 compared to 1990 [
15]. Following the Green Deal for Europe, a Strategy for Sustainable and Smart Mobility was developed in 2020—Europe’s transport on the way to the future, to ensure a sustainable and resilient European transport system. It is thanks to the implemented changes in transport systems that it will be possible to achieve the overarching goal of a 90% reduction in transport-related emissions by 2050, thus fulfilling the commitment to climate neutrality. Gradually, until 2050 incl., all buses on the roads of Europe are to be emission neutral [
16].
Based on EU legislation, the member states also regulate the issues of striving for environmentally friendly transport development. It is also the case in the member countries of the 1991 V4. The Czech Republic, Hungary, Poland, and Slovakia, which have a shorter period of membership in the EU than most countries, are striving efficiently to implement all policies, including transport policy.
In the Czech Republic, the most important strategic document in the field of transport is the Transport Policy of the Czech Republic for the period 2021–2027 with a perspective until 2050. This strategy regulates virtually every aspect related to sustainable transport, but significant attention has been paid to public transport as well as increasing the share of low-emission vehicles in transport [
17]. In Hungary, the National Energy Strategy until 2030 is an important document that indicates the energy policy goals in the field of transport. The document emphasizes the need to meet the EU requirements concerning the reduction of pollutant emissions from transport and the introduction of the required indicators for low and zero-emission vehicles [
18]. In addition, lot of space on adjusting the necessity of changes in transport was devoted to the National Climate Change Strategy 2008-2025. In particular, it focuses on reducing transport emissions by rationalizing and reducing transport and transport needs, developing cycling and walking, improving the share of public transport users, and promoting environmentally friendly transport [
19].
In Poland, the most important document in the field of transport is the Strategy for the Sustainable Development of Transport until 2030, in which the priority of, inter alia, promoting sustainable transport, as well as reducing the negative impact of transport on the environment [
20]. In turn, particular emphasis on the electrification of transport was placed in the Energy Policy of Poland until 2040 developed in 2020 [
21].
In Slovakia, the Transport Development Strategy of the Slovak Republic is in force until 2030. The authors adopted the main goal to be the public transport development by increasing the attractiveness of its alternative forms. Additionally, it focuses on the electrification of railways and urban public transport as well as the introduction and construction of infrastructure for alternative energy sources in transportation [
22].
The above-mentioned activities of the EU and individual V4 countries lead to the building, inter alia, a low-carbon economy model. A key element in this respect will be the dissemination of zero-emission vehicles, renewable and low-emission fuels, and related infrastructure, it will also apply to the entire bus and coach market. As indicated in the introduction, buses are the basic link of public transport, responsible for more than half of all passenger transport. There were 756,000 buses on the EU roads in 2018 (
Table 2). Compared to 1995, the number of these vehicles increased by 11.5%. The most used buses and coaches are in Poland—119 thousand. Poland also recorded the highest growth dynamics in the number of buses. In 2018, there were 39.3% more of them than in 1995. A slight increase in the number of buses was recorded in the Czech Republic. In this country in 2018, there were 22,000 of these vehicles and it was 7.3% more than two decades earlier. On the other hand, in Hungary and Slovakia, the number of buses in service fell by around 7%.
The average age of the EU bus fleet in 2019 is over 11.7 years (
Figure 1). Compared to the years 2017 and 2018, the age of buses in the EU countries increased by 0.1 years [
2]. The oldest buses run in Poland, the average age of which is 15.6 years, while Slovakia has the youngest fleet of buses, where the average age of buses is 11.4 years. The advanced age of vehicles is decisively influenced by the owners of small transport companies, who often cannot use external funding to purchase new vehicles. Many small entrepreneurs buy used buses from public carriers or Western European countries. Therefore, when analysing the statistical data on the purchase of city vehicles, which are most often made by local governments, one can notice fairly high growth dynamics in the field of younger vehicles. Therefore, in the example of Poland, it can be concluded that the number of buses in public transport aged 0–3 years increased in 2017–2019 from 15.9% to 26.2%. Thus, the number of the oldest vehicles, over 10 years old, fell from 43% to 37% [
23]. Similar trends are observed in the remaining V4 countries.
The relatively advanced age of the vehicles in use translates into the fact, that most of these buses are diesel-powered and their engines do not meet the highest EURO 6 emission standards. According to the data of the Chamber of Commerce for Urban Transport, in 2019 in Poland, only 34% of city buses are vehicles with a drive meeting EURO 6 standards or emission-free. Another 32% of vehicles met the EURO 5 standard. Satisfying is the fact that there were only 0.8% of substandard vehicles [
23]. It should also be noted that bus manufacturers estimate the age of vehicle operation at 15 years. Given the above, a significant number of vehicles should no longer be driven on European roads, especially in Poland and the Czech Republic.
When analyzing the data of newly registered buses and coaches, it can be welcomed that the sales of vehicles with diesel engines are falling, unfortunately, it is happening slowly (
Table 3). In 2018, as much as 95.4% of buses powered by diesel were registered in Europe. In 2019, a slight decrease was recorded, by nearly 1%. Revolutionary changes took place in 2020, as the number of registered diesel vehicles dropped to almost 73%. On the other hand, in the V4 countries, the lowest number of diesel buses is registered in Poland. In 2018 it was less than 80%, and in 2020 it was only about 73%. Unfortunately, the worst situation is in Hungary. In this country, more than 95% of diesel buses are still being registered. Likewise, a high percentage of these vehicles are being registered in Slovakia. The situation is slightly better in the Czech Republic, as in this country the number of newly registered diesel vehicles has fallen by around 14% over the last two years.
When analyzing other types of drives in the context of new vehicle registration, there is a noticeable increase in new buses with hybrid, electric, and other alternative fuels, mainly CNG, in Europe. It is the CNG group of vehicles that is responsible for the largest increase in new buses powered by alternative fuels—from 3.3% to 11.4%. The significant growth dynamics was also noticed when purchasing hybrid buses. There was an increase of 8.8% compared to the previous year.
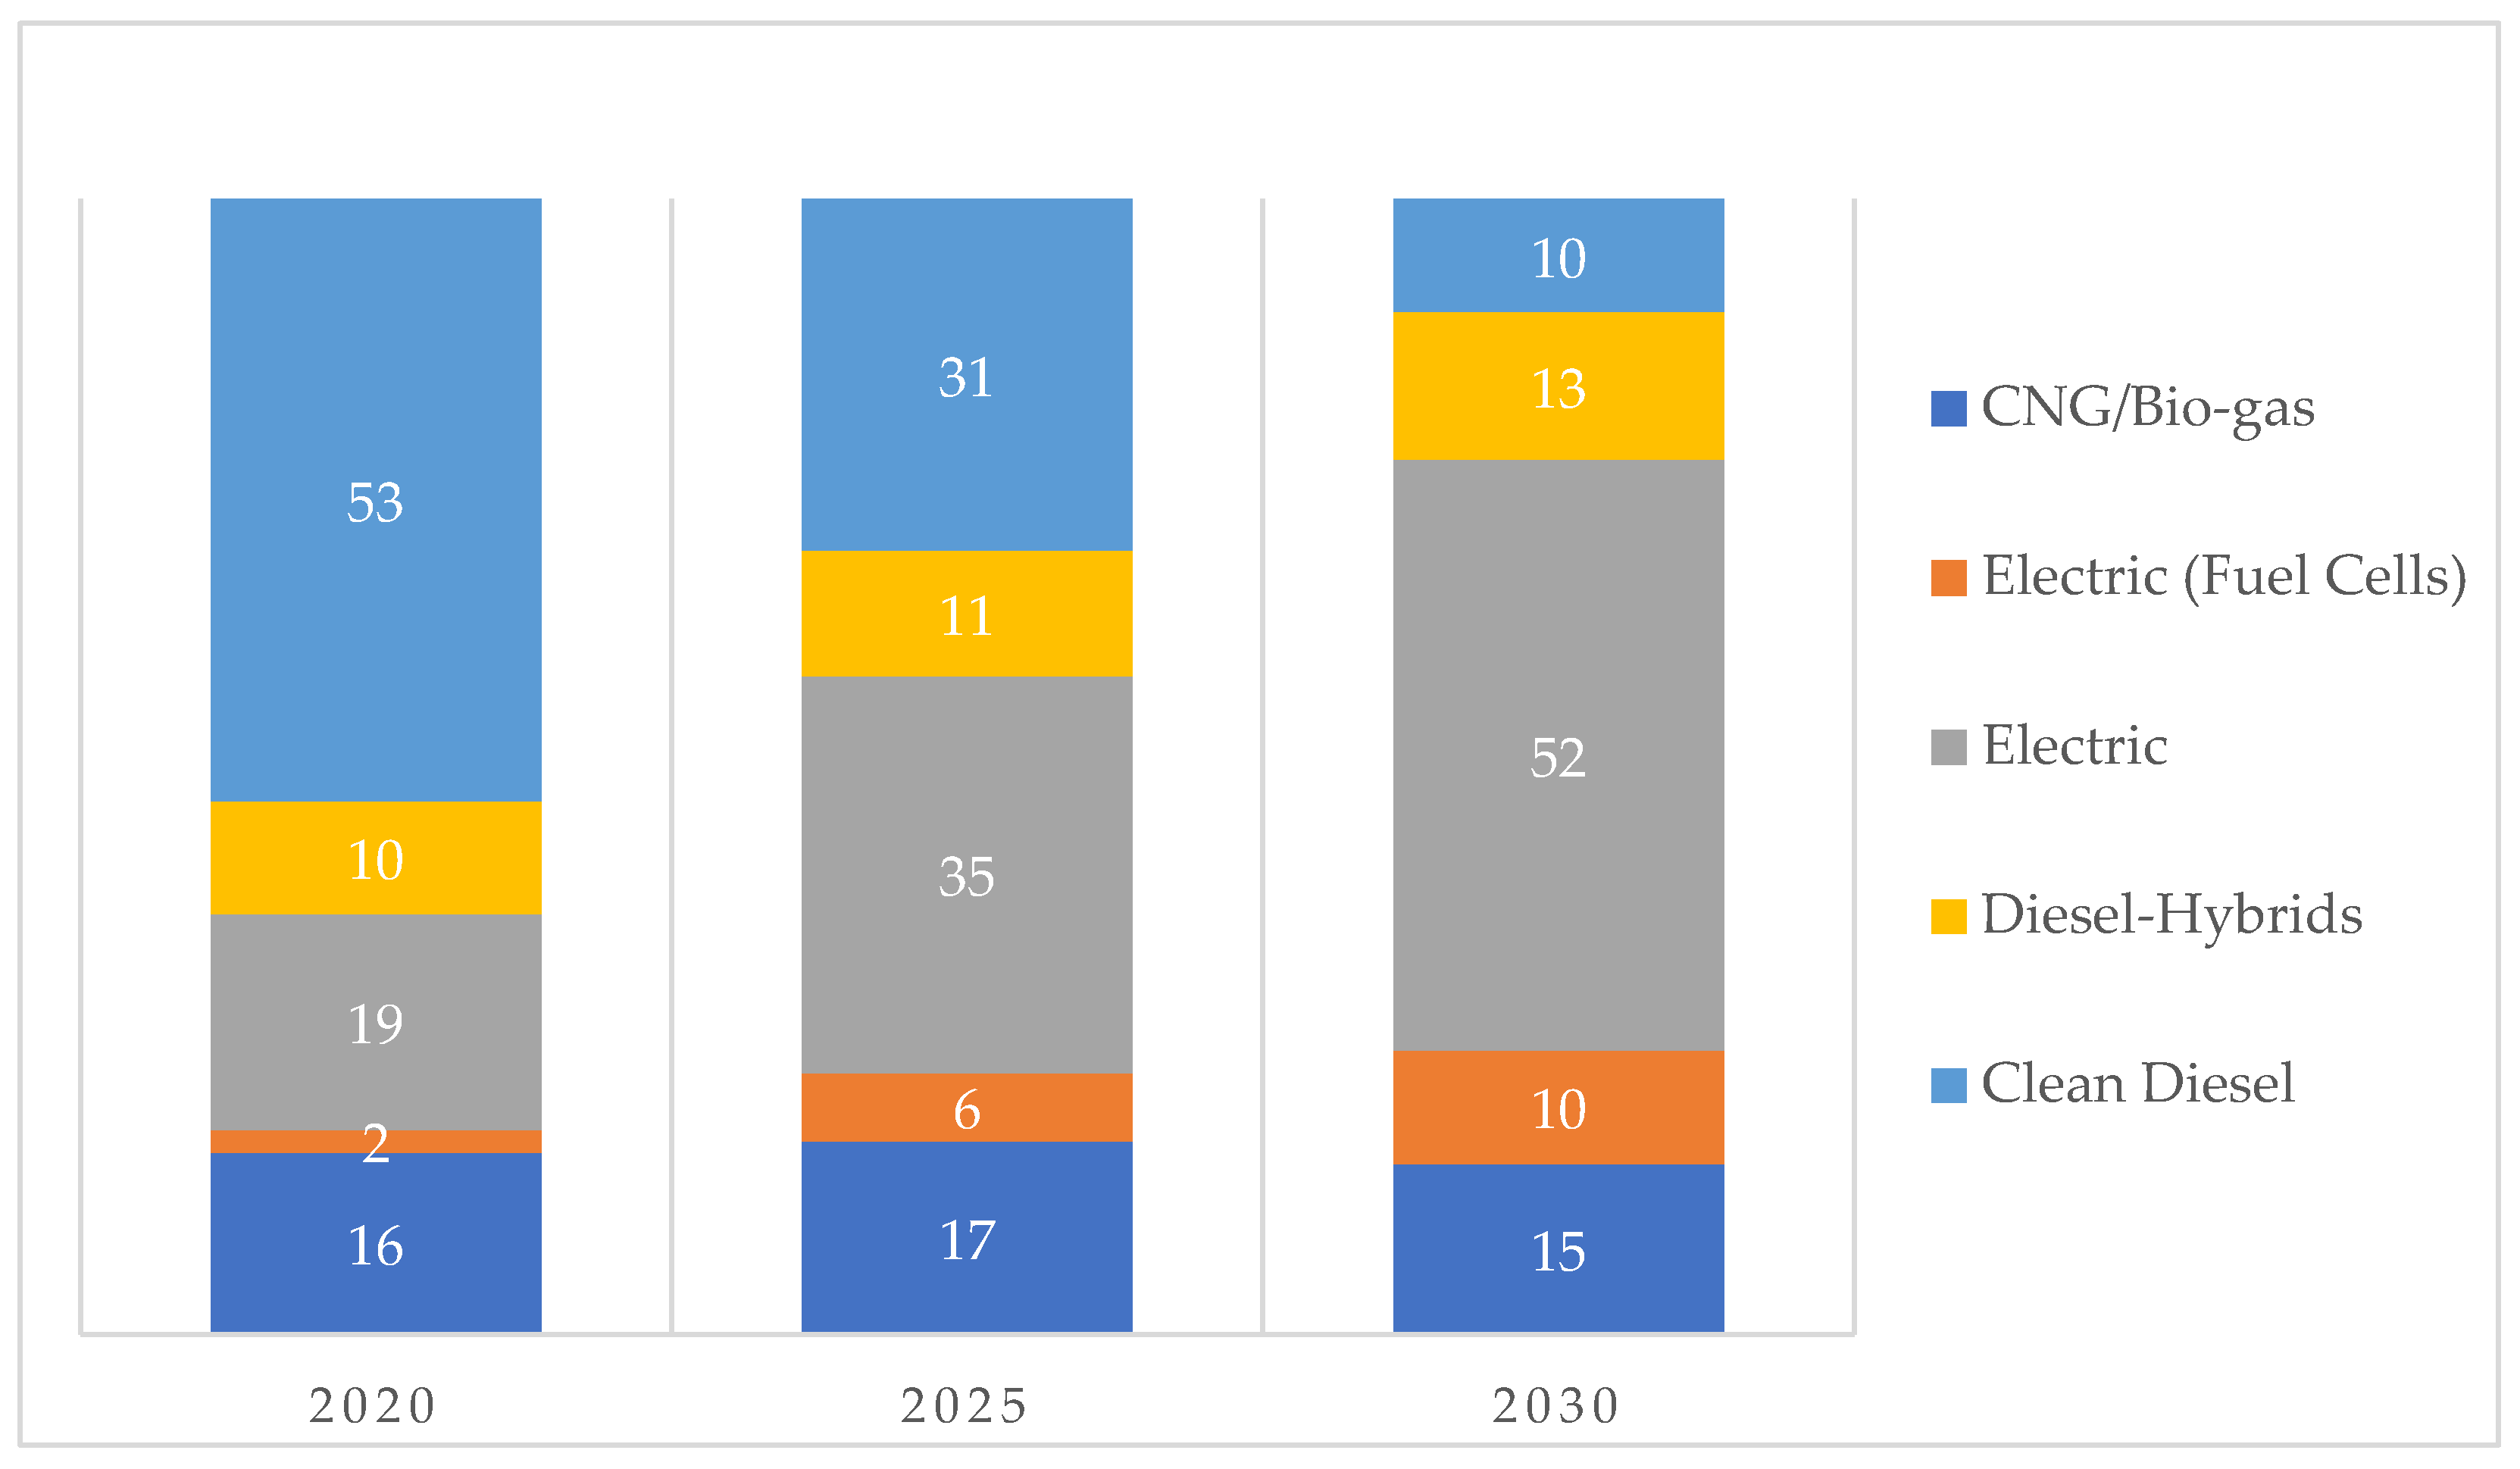
In turn, in the V4 countries, the most favourable situation is in Poland. This country is a leader in the implementation of new electric vehicles. In 2020, electric vehicles accounted for as much as 13.7% of all new vehicles in this segment. It was an increase compared to the previous year, by as much as 13.4%. This increase in electric vehicles translated into a decline in purchases of vehicles with other alternative drives by around 4%, but it remained at the European average level anyway. In the Czech Republic and Slovakia, there is a noticeable increase in registrations of new low-emission buses. Electric buses, on the other hand, are still less popular. On the other hand, in Hungary, there was a slight increase in the electric buses purchase. In 2020, they accounted for 3.5% of new vehicles. As you can see, still nearly three-quarters of all new buses sold in the EU run on diesel. This is mainly due to the high purchase costs of new vehicles, as well as the need to invest in additional infrastructure. The implementation of CNG-powered buses or electric buses is associated with the construction of additional infrastructure that will enable the refuelling and charging of these vehicles. An even greater challenge, the implementation of hydrogen-powered vehicles is. Hydrogen is the most abundant chemical element on Earth. It is used in the refining and petrochemical industries. However, for several years, efforts have been made to popularize its use in commercial vehicle drives. In the case of a hydrogen vehicle, the vehicle is driven by electric motors as it is the hydrogen cells that generate the electricity that powers the vehicle’s propulsion system. The drive does not affect driving the vehicle. A hydrogen vehicle has the advantage over an electric bus in that it can cover a much longer distance on one refueling. For example, the new Solaris Urbino 12 hydrogen bus needs only a few minutes of filling to cover more than 350 km. However, a hydrogen drive requires a greater financial contribution than an electric vehicle. Refueling with hydrogen, as mentioned, takes only a few minutes, and an electric vehicle requires up to several hours of charging. For now, electro-mobility is more popular, even though hydrogen is the most abundant element on the Earth and belongs to the group of the cleanest biofuels [
26]. However, this type of power supply will be gradually implemented in Europe. The forecasts made by the UITP Vehicle Equipment Industry Committee in 2017 as part of the ZeEUS project regarding the expected share of buses with various drive’s types on the market in 2020–2030 suggests a clear decline in the use of diesel, mainly in favour of battery technology, as the dominant electric bus technology. It is also believed that there will be a stable demand for CNG and plug-in hybrids as a technology transition between diesel and zero-emission technologies, as well as a gradual increase in the use of hydrogen in fuel cells (
Figure 2).
3. Materials and Methods
The main direction of the research was to evaluate the economic efficiency of operating buses with various drive types, with particular emphasis on low-emission and zero-emission vehicles. Buses with a hybrid drive and CNG-powered buses were selected among low-emission vehicles. On the other hand, vehicles include buses with electric drive and buses running with electric motors powered by electricity generated by hydrogen cells. For the sake of simplicity, the article uses the concept of hydrogen buses. Since in the studied countries and the entire EU there is still a significant number of vehicles powered by internal combustion engines, for comparison, vehicles with diesel engines have been selected too. Maxi buses with a length of 12 m and mega-articulated buses with a length of 18 m were selected for the analysis. Additionally, an assessment of the direct and indirect costs related to the purchase of these vehicles was carried out. Before starting detailed research, analyses of the development of the low-emission and zero-emission buses market in the V4 and EU countries were carried out based on the literature on the subject, as well as mass statistics data provided by European and national research and statistical institutions. In order to obtain an answer to the formulated research problem, methods of processing and interpretation of the collected knowledge were used in the form of a descriptive method, a tabular-descriptive analysis method, and a graphical presentation.
In turn, the Total Cost of Ownership method was used to assess the efficiency of bus operation in individual V4 countries (TCO). It is a method that sums up all the costs of the vehicle, from its purchase, through use, to disposal. TCO analysis allows evaluating the direct and indirect costs associated with the purchase. It gives an opportunity to illustrate the total amount of costs related to the use and possession of the purchased means of transport. To estimate the total cost of maintenance, in addition to the purchase cost, maintenance costs are also included, which include fuel and/or energy costs, insurance, service, and repair costs [
28].
Total Cost of Ownership can be written as the following equality:
where
CTCO is the total cost of the vehicle (€),
CV—vehicle purchase cost (€),
NV—service life of the vehicle,
CP—costs directly related to the implementation of transport tasks (€/year) (costs of wear of spare parts and consumables, costs of wear of tires, costs of fuel consumption, driver’s salary),
CS—costs directly related to the implementation of servicing tasks (€/year) (costs of ongoing repairs, periodic inspections, battery costs),
CO—other operating costs (€/year) (vehicle insurance, taxes, and fees).
The total cost of ownership was calculated for the operation period of vehicles of 20 years for diesel buses and 15 years for other drives. The length of the bus operation period was adopted based on the experience of carriers and manufacturers’ recommendations.
3.1. Assumptions Adopted for the Financial and Economic Analysis
Investment costs in the form of the cost of purchasing rolling stock have been adopted on the basis of the analysis of the results of tenders for selected carriers from individual V4 countries in 2021. To obtain reliable data, the average purchase cost of a given type of vehicle was calculated based on 8 completed bus deliveries, taking into account the type of drive and capacity. Thus, a total of 80 deliveries were analyzed. It should be noted that the suppliers of individual buses were primarily the largest suppliers and manufacturers of buses in the V4 countries (MAN, VOLVO, Mercedes-Benz, SOR, Solaris Bus and Coach, Autosan, BYD). Similarly, the cost of estimating battery replacement in electric buses and the cost of plug-in and pantograph chargers have been adopted based on the analysis of the results of tenders for selected carriers from individual V4 countries in 2021. Since the prices of the offered vehicles, batteries, and chargers were quite similar, the same costs were assumed for all analysed countries. It should be added that the cost of replacing the battery in an electric bus is 30% of the value of the new vehicle. In turn, the cost of purchasing a plug-in charger for free overnight charging is 33,000 € and it is the necessary cost of purchasing one charger for one bus. On the other hand, pantograph chargers cost approximately 121,000 € [
29]. Only the costs of the first charger will be included in the analysis. Pantograph chargers service several vehicles a day, therefore the unit investment cost will not significantly increase the operating costs of one vehicle. These costs are presented in
Table 4.
3.1.1. Forecasted Operating Costs
The basic assumptions adopted in the development of the operating cost analysis:
The base year is 2021. In the case of diesel-powered buses, the analyses were performed until 2040. In turn, for the remaining vehicles, the analyses cover the years 2021–2035.
Wholesale fuel prices were adopted as of 1 July 2021, for individual countries based on the available reports (
Table 5).
Wholesale diesel prices in the following years are based on Konoema’s long-term forecasts [
30], which assume a steady increase of 10% per annum until 2026, and from 2027, diesel prices are accepted at a constant level.
Wholesale prices of CNG gas, according to forecasts, will be indexed in reference to diesel prices, therefore a similar price increase of 10% until 2026 is assumed and CNG prices from 2027 are assumed constant [
29].
Electricity prices in the following years were adopted based on the forecasts of the Institute for Renewable Energy, where a constant increase in prices by 4.0% until 2025 was assumed; and from 2026 by 3.2% [
31].
Hydrogen prices in subsequent years were adopted based on analyses by Bloomberg New Energy Finance, which assumed a drop in prices by 4.0% by 2030 and then by 2.1% [
32].
The amount of operational work was assumed at the level of 70,000 km per one bus per year. This consists of the daily length of the bus route 225 km. Most carriers operate the vehicle 6 days a week.
The average consumption of fuels and energy was adopted based on the experiences of communication operators from Poland (
Table 6).
The average tire wear for one bus was calculated based on the experience of Polish communication operators.
The number of drivers—it was assumed that there are two drivers per one bus. Average drivers’ salaries are based on industry reports available in each country.
In the case of service costs, tire replacement, driver salary costs, vehicle insurance and taxes, the inflation rate was taken into account according to the assumptions of the national banks:
- -
Czech Republic (2022—2.3%; 2023—2.0%; from 2024, inflation is assumed to be 2.0%) [
33]
- -
Hungary (2022—3.0%; from 2023, inflation is assumed to be 3.0%) [
34]
- -
Poland (2022—3.3%; 2023—3.4%; from 2024, inflation was assumed to be 3.4%), [
35]
- -
Slovakia (2022%—1.8%; 2023—2.5%; from 2024, inflation was assumed to be 2.1%) [
36]
3.1.2. Costs Directly Related to the Implementation of Transport Tasks
The costs directly related to the implementation of transport tasks, including the cost of wear of spare parts and consumables, were developed based on the experience of carriers from the V4 countries (
Table 7). As in the case of bus purchases, the amount of these items is convergent, therefore the same costs for all countries have been assumed. The calculations have been based on information on the costs of materials per 1 km. The cost of tire wear is based on 10,000 km, assuming a tire replacement cost of 660 €. The tire life was assumed to be 150,000 km.
3.1.3. Costs Directly Related to the Implementation of Maintenance Tasks
The costs directly related to the implementation of maintenance tasks were calculated similarly. They were based on the experience of carriers. Insurance costs, on the other hand, were adopted based on the experience of communication operators from individual V4 countries. In addition, the costs of taxes and fees have been adopted based on the regulations of the country in the V4 group.
4. Results and Discussion
In the first stage of the research, the total cost of vehicle ownership was calculated. As mentioned in the previous chapter, these costs include, apart from operating costs, also the costs of purchasing vehicles, and in the case of electric buses, also the costs of battery replacement after 8 years of use and the costs of purchasing a plug-in charger. In addition, in the case of hybrid buses, the cost of purchasing batteries after 8 years of operation was also taken into account. In the case of electric buses, the cost of the battery is 30% of the bus purchase price, and in the case of hybrid buses—10%. In line with the assumptions, inflation was taken into account for service costs, drivers’ salaries, tire purchases, insurance, and taxes. Forecasts of changes in fuel and energy prices have been considered too. Thanks to this, it will be possible to determine the influence of these factors on the economic efficiency of particular types of drives during the entire period of operation. A summary of the total cost of ownership is presented in
Table 8. The lower operating costs of hybrid, electric, and CNG buses (by approx. 30%) compared to diesel buses are mainly due to their operating period. The experience of carriers, as well as the recommendations of manufacturers, shows that diesel-powered buses are used for 20 years, while the remaining vehicles will be used for about 15 years.
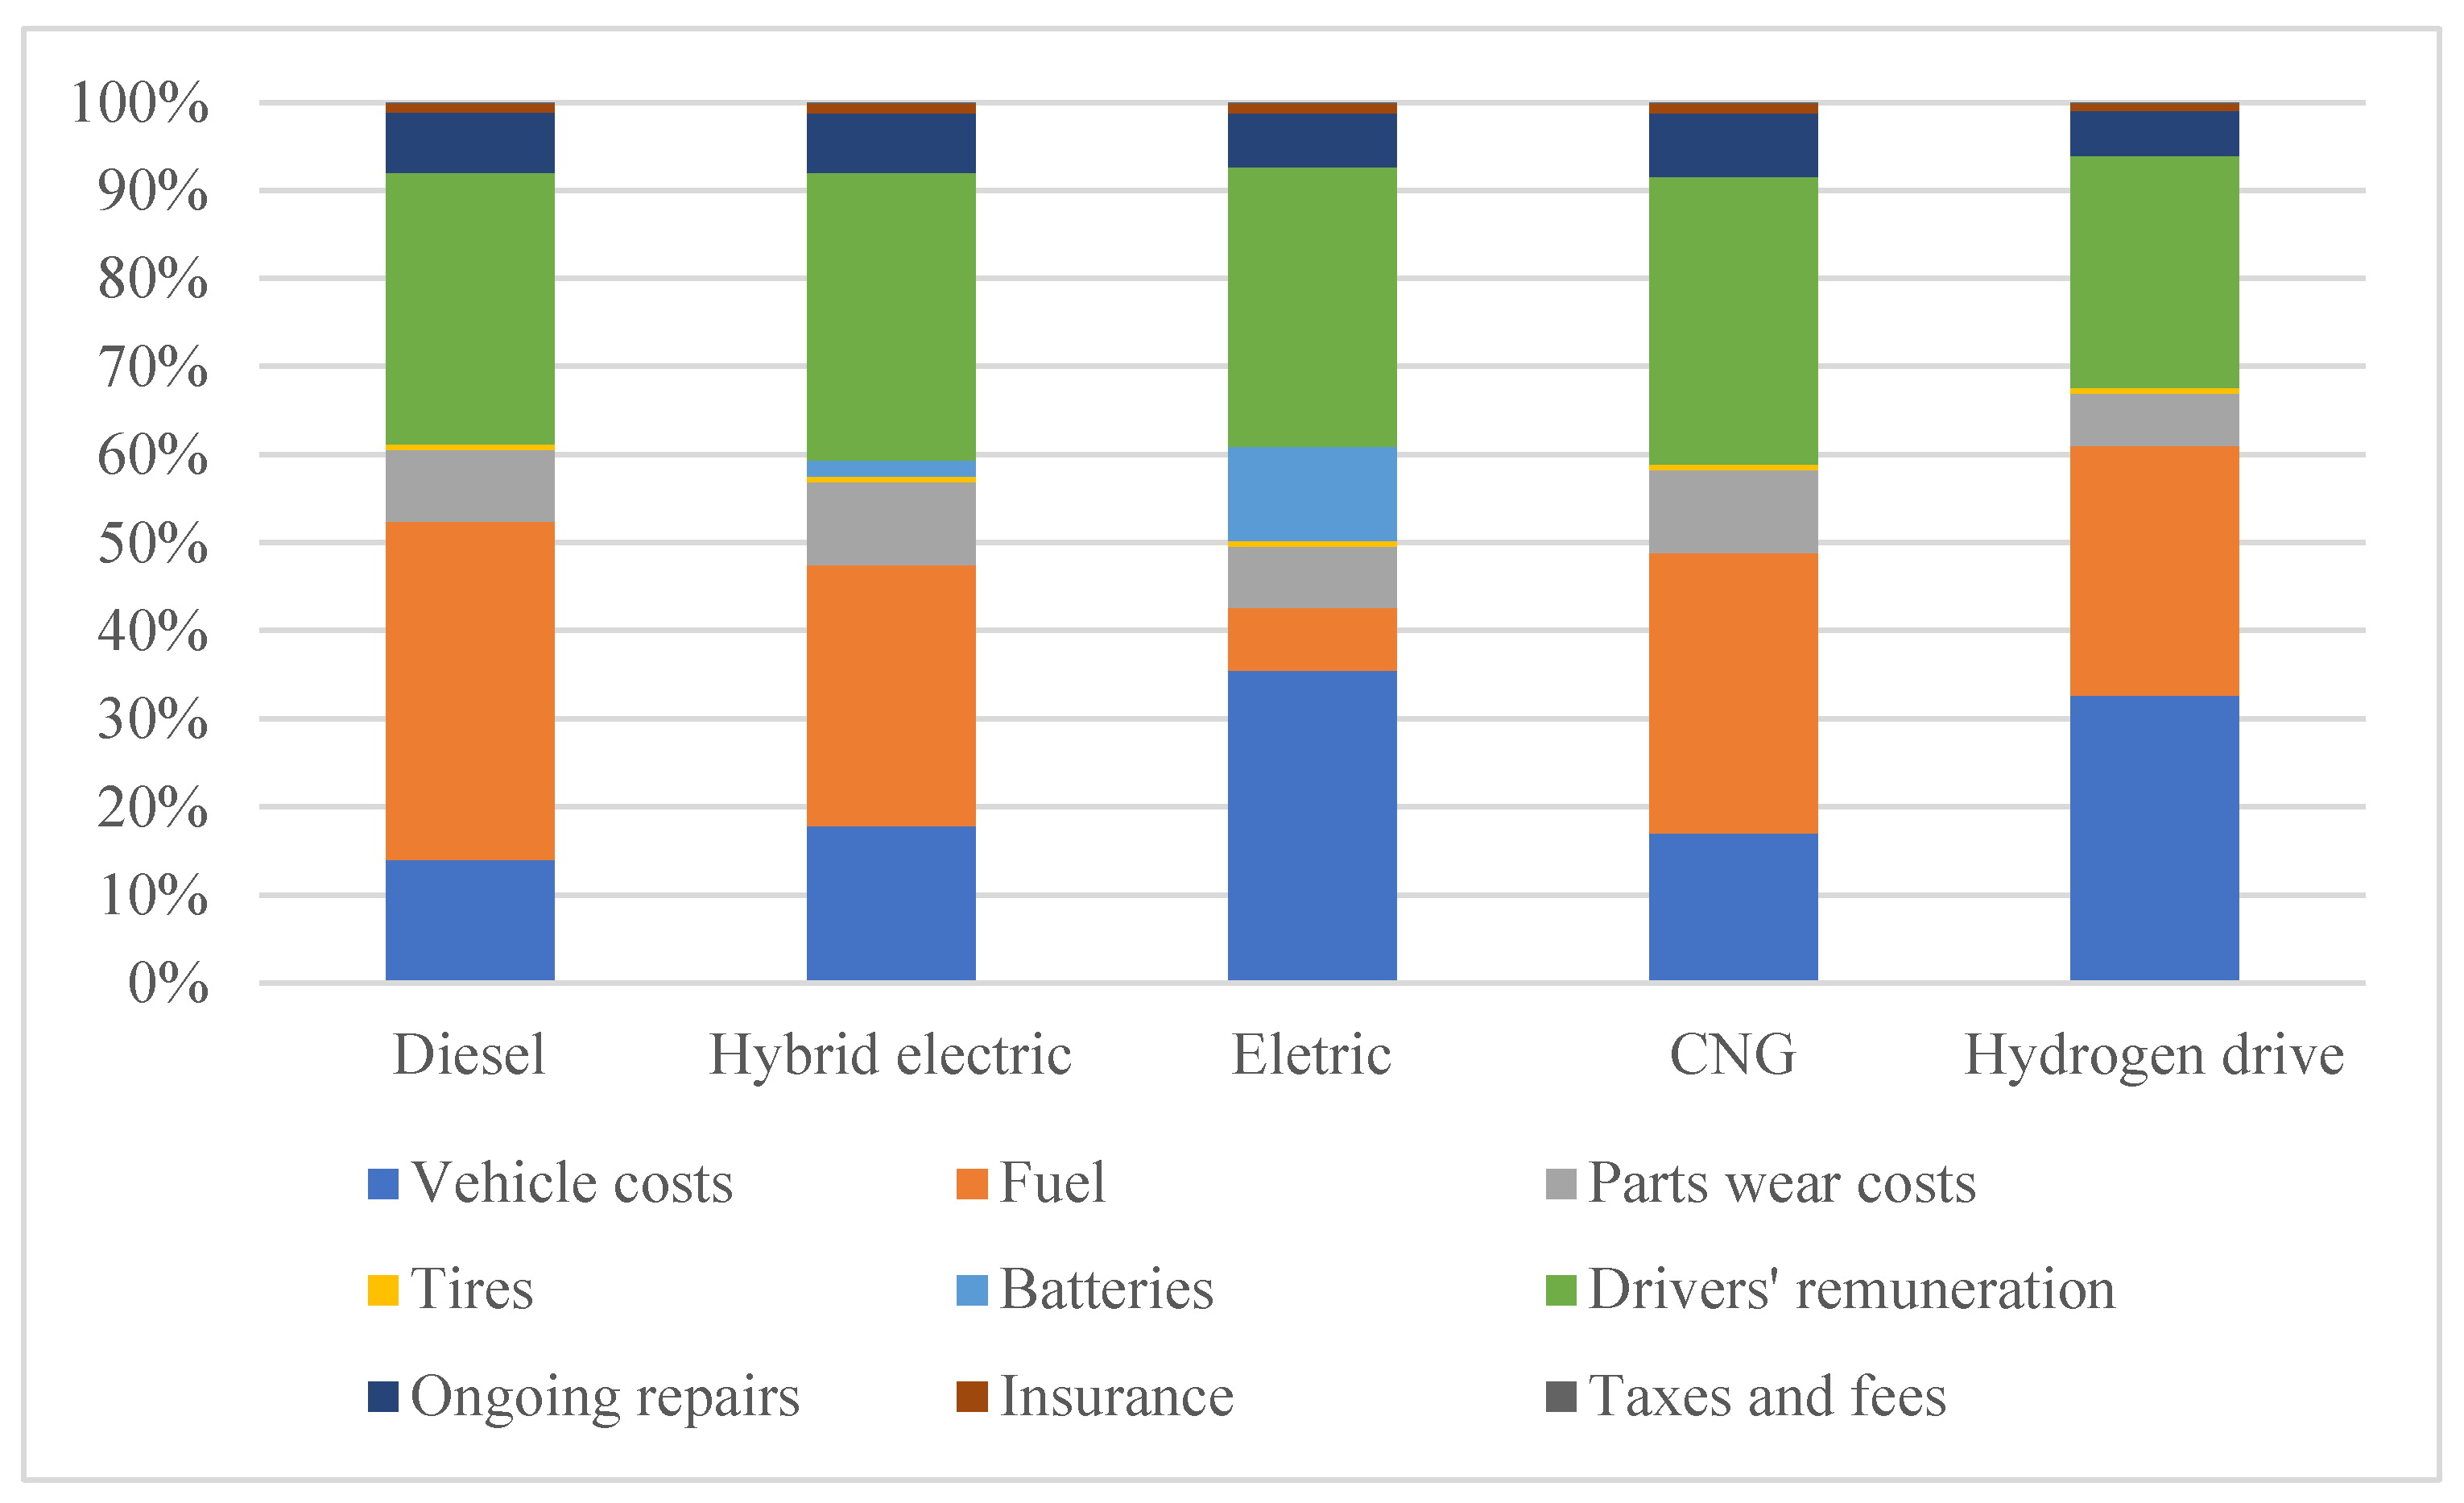
When conducting research, it is worth pointing out the structure of individual costs (
Figure 3). The largest group of costs are operating costs, including fuel costs and remuneration for vehicle maintenance. Then there are costs of, taxes and insurance. However, as can be seen, the salary costs for each type of drive are around 30%. However, in the case of fuel and energy costs, the lowest share is in the case of electric buses (approx. 7%). On the other hand, the largest share of fuel costs in the TCO structure is fuel for diesel buses—38%. For other drives, fuel costs account for around 30% of total costs. Then there are the costs of taxes and insurance. The third significant group of costs is the group of investment costs. The highest costs in the entire structure are related to the purchase of electric vehicles (35%) and hydrogen-powered vehicles (33%). The lowest share of investment costs in the total cost of ownership of maxi (18 m) buses with different drive types in the V4 countries (€) occurs in the case of diesel buses.
The vehicle-kilometer costs presented in
Table 9 clearly show that the use of hydrogen-powered buses is much more expensive than in the case of other drives. In addition, such a situation applies to all analysed countries. On the other hand, the cheapest vehicles to use in the Czech Republic are hybrid buses and CNG-powered buses. In turn, in Hungary, Hybrid vehicles will be the cheapest to use, followed by electric vehicles. In Poland, CNG-powered vehicles will be the cheapest to operate, and then hybrid vehicles. On the other hand, in Slovakia, hybrid vehicles will be the cheapest to operate, and CNG the most expensive. In addition, this is what distinguishes this country from the others, because, in the case of the Czech Republic, Hungary, and Poland, buses powered by traditional diesel fuel are the most expensive after hybrid vehicles.
As with maxi buses, the total cost of ownership of articulated buses is highest for diesel (
Table 10). CNG buses and hybrid buses are the cheapest in operation. The high operating cost of diesel vehicles is also due to their 5-year longer operation. Electric buses will be the cheapest of the zero-emission vehicles.
In the above analysis, the different operation period of the vehicles makes the comparison a bit difficult. Therefore, vehicle-kilometer costs for articulated buses are presented. In addition, the vehicle-kilometer costs for large-capacity buses indicate significant differences and relatively high operating costs of zero-emission vehicles (
Table 11). When comparing the vehicle-kilometer costs of large buses to those of standard buses, it is noted in some cases that the operating costs of diesel-powered articulated buses are lower than those of hybrid, electric, or CNG buses. This is mainly due to the purchase price of the vehicles themselves. At this point, it can be added that in the case of electric buses, the cost of pantograph chargers has not yet been taken into account, and in the case of hydrogen-powered buses, the costs of the charging infrastructure have not been included (refuelling station and electrolyser). Similarly, in the case of other types of vehicles, the cost of CNG charging infrastructure or traditional fuel stations was not included in the calculation. The pantograph charger basket costs approx. 100,000 €. An investment in a hydrogen refueling station for 50 buses costs approximately 5,100,000 €. Additionally, there is a need to buy an electrolyser worth approx. 7 million €. On the other hand, a CNG refueling station with a capacity of 1200 m
3/h costs almost 1 million € [
38].
In the initial part of the article, it was emphasized that most carriers, when deciding to invest in new rolling stock, pay attention primarily to the purchase costs and operating costs. Taking into account the costs of investment in a vehicle power infrastructure, it can be concluded that most carriers may take into account economic bills and will choose diesel vehicles. In addition, it was so until recently, because the statistical data presented in
Section 2 on the dynamics of changes in the bus structure in individual V4 and EU countries, taking into account different types of drives, clearly indicate that diesel buses are still the most frequently purchased vehicles. However, the issued communications, directives, and strategies by the EU and the governments of the V4 countries, clearly indicate the timing and guidelines for changes in the implementation of low- and zero-emission mobility. This is mainly due to high investment costs. In the costs of purchasing buses presented in
Table 5, vehicles with zero-emission drives are much more expensive than others. In the case of electric buses, this is twice the cost of diesel vehicles, and in the case of a hybrid bus, it is even three times higher. In addition, the infrastructure for powering and refueling these vehicles should be built from scratch. However, to enable carriers to adapt to the requirements of implementing low- and zero-emission vehicles, the EU offers the possibility of co-financing the purchase of vehicles as well as refueling and powering infrastructure for buses. At the time of writing this article, consultations and work on the construction of aid programs in the 2021–2027 financial perspective are still ongoing in the EU. Therefore, there are no specific and certain assumptions regarding the amount of funding for the purchase of the vehicles in question. However, in order to illustrate the impact of co-financing for the purchase of buses on the total cost of ownership, and above all on the cost of vehicle-kilometer, co-financing levels were adopted based on media information from consultations conducted in individual V4 countries. On this basis, it was concluded that the highest funding is planned in most countries for the purchase of hydrogen buses. It is planned that the carrier will be able to obtain funding for the purchase of these types of buses even at the level of 90%. In the case of electric buses, the level of funding may vary between 70–90%. Experts who believe that hydrogen technology should be developed are lobbying for each year lower funding for the purchase of electric vehicles. Therefore, for this calculation, it was assumed that the co-financing rate will be 80%. There are more and more opinions that CNG buses should not be considered low-emission buses. Thus, it is suggested to gradually reduce the funding for these vehicles. Therefore, for this calculation, the level of funding was assumed at 50%. In the case of diesel-powered buses and hybrid buses, on the other hand, there is a clear message that it will no longer be possible to obtain any funding for their purchase. Thus, the subsidies for the purchase of these vehicles were not included in the calculations below.
Taking the above-mentioned subsidies to the purchase of low- and zero-emission buses resulted in a clear change in the bus-kilometer cost calculated based on the total cost of ownership. As shown in
Table 12, the cost of implementing and operating electric vehicles has decreased. However, CNG vehicles still generate the lowest costs among green and hybrid vehicles. After obtaining funding, electric vehicles will be the cheapest to operate, followed by hybrid vehicles. Moreover, the publicly available information shows that it will also be possible to obtain high funding for the construction of the infrastructure supplying the above-mentioned vehicles.
A similar situation occurred in the case of articulated buses (
Table 13). It is worth noting that the cost of implementing and operating hybrid buses has decreased significantly and is even lower than CNG buses. In the case of subsidization, the cost of one vehicle-kilometer of a hydrogen bus is approximately 15% lower than that of a diesel bus. Without funding, this cost is approximately 15% higher. The subsidy for the purchase of electric vehicles is also beneficial. Thanks to this, they are the cheapest in operation. Despite the lower funding for the purchase of CNG buses, it still makes them attractive compared to diesel and hybrid buses.
The above analyses show that co-financing for the purchase of ecological vehicles will have a beneficial effect on the increase in the economic efficiency of the operation of low-emission and zero-emission buses. In the event of obtaining a high subsidy for the purchase of hydrogen-powered vehicles, as well as the decreasing prices of hydrogen alone, the operation of this type of bus will be more economical than that of CNG-powered buses.
The next stage of the research was to analyze the impact of the forecast changes in fuel and energy prices, as well as the forecast inflation in individual V4 countries. In the part discussing the research methodology, the assumptions of the forecast changes in the prices aforementioned as well as inflation were indicated, based on which the annual operating costs of particular types of buses were calculated in the base year (2021) and the final year of operation (2035). For the correctness of the results, in the case of diesel buses, the operation of which is expected to be 5 years longer than that of other vehicles, the fifteenth year of operation was also assumed. The comparison was made based on a vehicle kilometer. It should be noted that the cost of purchasing vehicles was not included in the calculation.
In the base year, the lowest vehicle-kilometer cost was found for the operation of electric vehicles (
Table 14). On the other hand, hydrogen-powered vans are the most expensive to operate. The single vehicle-kilometer cost is twice as high as for electric buses. On the other hand, the operating costs of hybrid buses are comparable to the costs of using CNG buses.
In the last year of operation, which took into account the forecast changes in fuel and energy prices as well as inflation, quite significant changes can be observed (
Table 15). Well, the anticipated reduction in the price of hydrogen will make this type of vehicle the most economical in all V4 countries. The calculations are also favorable for electric buses, but their operating costs will increase by 90 to 100%. This is due to the anticipated increases in energy prices.
It is also worth paying attention to the differences between operating costs in different countries. In the base year, the highest cost of vehicle use is expected in Slovakia. In turn, in 2035, in Slovakia, the lowest operating costs of all types of buses are expected. This can be explained by the expected low inflation and price stability since it is the only country from the V4 group in which the euro currency functions.
In the case of using different mega-class buses in the base year, a similarity to the situation of maxi buses can be noticed. Here, too, the costs of using hybrid buses in 2021 are twice as high as electric buses (
Table 16). The operation of diesel buses is relatively high. However, it should be remembered that the costs of building the refueling and charging infrastructure were not considered in the calculation.
In the case of mega-class buses, in the last year of their use, the cost of the vehicle-kilometer for diesel, CNG, and electric vehicles will also increase (
Table 17). The biggest increases are forecast for electric buses. In turn, the expected reductions in hydrogen prices, despite inflation, will make these buses the most economical.
As can be seen from the above analyses, the forecast changes in fuel and energy prices, as well as the expected inflation, will significantly affect the costs of vehicle operation and the economic efficiency of using various types of drives. These changes will have a positive impact on the implementation of zero-emission vehicles into operation. Furthermore, it is worth noting that the analyses of vehicles powered by engines emitting gases or dust do not include charges for the introduction of gases or dust into the air. Currently, it was assumed that the purchased vehicles will meet the Euro 6d ISC-FCM standard, which, among other things, requires the installation of devices recording real fuel or electricity consumption. Furthermore, this standard indicates that the NOx emission level is set at 80 mg/km for diesel vehicles. In normal traffic, however, it can be exceeded a maximum of 1.43 times, previously 2.1 times. In 2023, the ratio is to be tightened. Moreover, there is a CO
2 emission standard in force at a level of 95 g/km. However, work is already underway on the Euro 7 standard, which will further tighten the standards. Unofficial information indicates that the NOx emission limit (nitrogen oxides) is to be 30 mg/km (let us remind—now 80 mg/km). Carbon monoxide (CO) emissions would then drop from 1000 mg/km to 300 mg/km and from 500 mg/km to 100 mg/km for diesel vehicles [
39]. This may mean that currently purchased vehicles will not meet the implemented standard, and the carrier will have to pay for emissions. For example, in Poland, fees are calculated as the product of the fuel consumed (Mg) multiplied by a fee rate for a given year, set by the Minister of Climate for a given year. In addition, these charges significantly increase the operating costs of these vehicles, making zero-emission vehicles more profitable.
5. Conclusions
Undoubtedly, transport is one of the key sectors of the European economy. For over two decades, a gradual increase in the number of people employed in this sector has been noticeable, but first of all, attention should be paid to the over 30% increase in the number of passengers transported. The forecasts carried out, indicate their further growth in the next 30 years. However, such an intensive development of transport brings negative effects in the form of an increase in the emission of harmful substances. It is in the V4 countries where the higher emissions of NMVOC compounds, nitrogen oxides NO, carbon oxides, particulate matter has been noted. The situation in the V4 countries is particularly dramatic in terms of CO2 emissions caused by transport, as, for example, in the Czech Republic and Hungary, the increase in 2018 compared to 1995 was around 85%. It was even worse in Poland, where an increase of over 181% was recorded.
The above alarming statistics contributed to the activities of the EU and individual countries, which make recommendations in the form of various legal documents, ordering all member states to significantly reduce pollutant emissions. It translates, inter alia, on the need to implement measures to reduce emissions in transport, including passenger transport. In addition, such activities can be implemented in the field of introducing low and zero-emission vehicles into operation.
Based on statistical data, the average age of this group of vehicles in the EU is 11.7 years, while in the Czech Republic, Hungary and Poland it is higher. This means that there are vehicles that do not meet strict emission standards on the roads of Europe. Moreover, in Poland, the average age of vehicles is 15.6 years, and most manufacturers recommend the use of their vehicles for 15 years. Therefore, carriers face the necessity to replace their bus fleet, but each newly purchased vehicle, following the guidelines, should have a low or zero-emission propulsion status. For example, in Poland, the Electro-mobility Act [
40] requires local governments with over 50,000 inhabitants to residents that the share of zero-emission buses in the fleet used is to be:
5% from 1 January 2021
10% from 1 January 2023
20% from 1 January 2025
30% from 1 January 2028
This gives rise to the fact that transport organizers and communication operators will consider the choice of the type of buses.
From the economic point of view, every entrepreneur, when purchasing buses, will be guided by the economic efficiency of the vehicles used. Therefore, it becomes necessary to commission cost-benefit analyses of the implementation of low- and zero-emission vehicles. Among these vehicles, CNG-powered buses, considered low-emission vehicles, are currently the most popular, followed by electric buses as zero-emission vehicles. Hydrogen-powered vehicles, on the other hand, are still at the stage of technological development.
The analyses of the total cost of ownership show that CNG-powered buses are the cheapest in the implementation and use of green vehicles. It even emerges that the annual vehicle-kilometer costs of these vehicles in the Czech Republic, Poland, and Hungary are lower than those of traditional diesel vehicles and hybrid buses. Higher operating costs of CNG buses in Slovakia compared to other vehicles are associated with higher gas prices (high tax). The total cost of ownership, on the other hand, is lowest in the Czech Republic and Hungary.
Although the cost of using buses with a diesel engine is not the lowest, carriers buy such buses due to the high costs of the vehicle charging infrastructure.
However, the EU, as well as the governments of individual countries, support enterprises and communication operators by offering them financing for investments. Even though in the current period, there is no defined budget and detailed aid programs for the coming years, the announcements show that the highest co-financing will be available for investments in hydrogen-powered buses and electric buses, and to a lesser extent for low-emission buses. On the other hand, carriers will not receive any support for the purchase of diesel vehicles. This will significantly increase the economic attractiveness of new investments in low-emission and, above all, zero-emission transport.
Currently, in the case of zero-emission vehicles, electric buses are more economical in this case. Their operation is definitely cheaper compared to hydrogen buses. It is worth noting that this applies to both buses with standard capacity (maxi—12 m) and large-capacity buses (mega—18 m). The difference in operating costs is quite significant, as the use of hydrogen-powered buses is about 25–30% more expensive than electric buses. These high costs of using hydrogen vehicles are mainly influenced by the purchase price of these buses. These buses are approximately 15–20% more expensive than electric vehicles. This high purchase price is also caused, among others, by the initial stage of the development process, as hydrogen technologies are only just leaving the prototyping stage. As is well known, any new technology entails high investment costs. This was also the case with the initial production stage of electric buses. In this case, however, the problem of high operating costs is the need to use high-capacity batteries, as well as the need to replace them after 8 years of use.
Finally, it is worth pointing out that the forecasts of fuel and electricity prices show that diesel and CNG will increase by approx. 10% until 2026. This price should stabilize later. In the case of electricity, forecasts indicate a price increase of approx. 4% annually until 2025, and then by approx. 3.2% per year. On the other hand, in the case of hydrogen prices, it is expected that the price of this fuel will initially decrease by about 4% annually, and after 2030, by about 2.1%. Hence, fuel prices, nearly 30% of the total cost of ownership, will be a key element in selecting the most cost-effective vehicles. In addition, in this case, in the perspective of 15 years, hydrogen-powered buses well fare.


