Article

Higher Wind: Highlighted Expansion Opportunities to Repower Wind Energy

by
Francisco Haces-Fernandez
College of Business Administration, Texas A&M University Kingsville, Kingsville, TX 78363, USA
Energies 2021, 14(22), 7716; https://doi.org/10.3390/en14227716
Submission received: 24 October 2021 / Revised: 11 November 2021 / Accepted: 16 November 2021 / Published: 18 November 2021

Abstract

:
Decarbonizing the world economy, before the most damaging effects of climate change become irreversible, requires substantially increasing renewable energy generation in the near future. However, this may be challenging in mature wind energy markets, where many advantageous wind locations are already engaged by older wind farms, potentially generating suboptimal wind harvesting. This research developed a novel method to systematically analyze diverse factors to determine the level of maturity of wind markets and evaluate the adequacy of wind farm repowering at regional and individual levels. The approach was applied to wind markets in the United States (U.S.), in which several states were identified as having diverse levels of maturity. Results obtained from case studies in Texas indicated a consequential number of wind farms that have reached their twenty-year end-of-life term and earlier obsolescence levels. The proposed approach aided in determining wind farms that may benefit from total or partial repowering. The method indicated that total repowering of selected installations would significantly increase overall wind energy generation, considering that these older installations have access to some of the best wind speeds, infrastructure and areas to grow. The proposed method can be applied to different world wind markets.

Graphical Abstract

1. Introduction

Wind energy has been highlighted as one the main strategies to decarbonize the global economy [1] and help achieve the goals of the Paris Agreement on Climate Change [2]. However, wind energy in the United States for 2020 contributed only 8.4% (on average) to utility scale electricity generation [3], while forecasts indicate that wind market penetration will be 20% in 2030 and close to 35% in 2050 [4]. Furthermore, the recently published Sixth Assessment Report of the Intergovernmental Panel on Climate Change stressed the urgency of accelerating renewable energy market growth and decarbonizing the global economy to prevent permanent damages from climate change [5]. Therefore, further efforts and investment should be devoted to increasing wind energy generation, contributing to this critical endeavor.
Increasing wind energy generation normally relies on two main options: opening new wind farms in previously untapped locations (green fields) or repowering existing wind farms, improving current power outputs [6]. The green fields alternative is a good fit for regions that contain untapped optimal wind harvesting locations [7]. However, in mature markets, these optimal wind locations may be scarce, and repowering may be the best option, boosting wind energy market penetration [8]. It is critical to identify relevant elements to aid stakeholders in repowering decisions, ensuring wind energy continuous growth and further expansion [9].
It has been estimated that the average useful life of wind turbines is 20 years [10], considering that all mechanical equipment are subject to performance deterioration and obsolescence [11]. After this period, replacement parts become harder to procure and manufacturer’s maintenance contracts have expired, increasing downtimes for wind turbines [12,13]. Ageing equipment suffers from unrecoverable performance loss, which cannot be corrected by maintenance. It is caused by operational or environmental factors such as wear of gears [14], fouling of the blades [15] or upper section peeling from high-velocity particle impacts [16,17]. It is estimated that wind turbines experience yearly unrecoverable performance loss [18], leading to capacity factor (CF) reductions of 21–28.5% after 19 years of operation, which may increase the levelized electricity cost up to 9% [12]. Reports indicate that when a wind turbine fails at this stage, it becomes difficult to repair, causing significant losses in wind farm power output [12,19].
Additionally, wind turbines have recently sustained accelerated obsolescence rates caused by rapid technological advances [20,21]. For instance, equipment height, size and Name Plate Capacities (NPC) have exponentially increased in the last decade [22], allowing for remarkably improved capacity factors and power output substantial increases [8,23,24]. Therefore, the lifespan of many wind farms may have been further reduced [25]. Moreover, installation and operational costs for newer, more advanced wind farms have fallen considerably [26]. As such, wind farms that have reached obsolescence levels are good candidates for repowering (total or partial) [27], allowing them to increase their contribution to the electric grid to aid in combatting climate change [28].
Partial repowering involves the replacement of worn-out components (blades and nacelle) while keeping the towers, foundations and electrical grid installation [29]. This alternative has the benefit of reducing Capital Expenditure (CapEx) when compared with total equipment replacement [6,30]. Additionally, since most of the specifications for the wind farm will remain essentially the same (occupied area, equipment height and power output), the operator might avoid securing new permits and new leasing or interconnection agreements [10]. However, the renovated wind farm under partial repowering will only provide a minimal power output increase, considering that the replacement equipment will be very similar in size, height and NPC to existing turbines [29,31]. The issue has critical importance considering that previous literature has suggested that the first installed wind farms occupied the best wind locations, which are now engaged by smaller, less efficient wind turbines [6,7,20].
Consequently, installing more advanced wind turbines, able to extract much more power form these wind optimal locations, would advance wind energy development, increasing overall electricity generation and wind market penetration [32]. However, since more advanced wind turbines are taller and have larger rotor diameters, the spacing between wind turbines will necessarily grow, to minimize negative turbulent wake interferences [10,13]. Developers will need to assess the area in the proximity of older wind farms to evaluate location potential and decide on the size and direction for wind expansion [25,33].
Previous research on wind energy repowering has focused on the financial, technical and legal feasibility of the projects. Weiss, for instance, focused on the financial feasibility of replacing the equipment [34], while Lantz et al. evaluates the technical financial feasibility of repowering [35]. Evaluating the technical and economic variables to assess the financial feasibility of wind farm repowering has been the most frequent focus of previous research [20]. Other topics evaluated in previous research involve the extension of the useful lifetime of wind turbines [36] and applying qualitative factors [9,37,38]. The contribution of this study derives from the evaluation of total and partial repowering decisions from the assessment and characterization of resource scarcity, to maximize the use of limited wind resources to significantly increase wind energy penetration in the electric grid. The proposed method allows stakeholders, including community partners and policymakers, to better understand the implications of repowering decisions with the goal of accelerating decarbonization of the economy. Considering the complexities involved in the development of wind energy projects, the objective of this research is to provide stakeholders with a systematic tool to identify repowering opportunities in mature markets.
The method evaluates the degree of maturity of a region to ascertain the fitness of diverse repowering alternatives. Once mature regions have been characterized, individual wind farms are assessed to evaluate their remaining useful life and degree of obsolescence. These factors are weighted evaluating the optimality of the wind farm locations with regards to wind speed potential at diverse heights and access to wind energy required. The goal is to maximize the use of scarce optimal locations for wind energy extraction to increase wind market penetration even further.

2. Materials and Methods

The method developed in this study involves four tasks, each having three individual activities, as outlined in Figure 1. The first task evaluates the degree of maturity of markets, assessing this factor by evaluating the deployed wind inventory, age suitability framework and their obsolescence levels. Resource assessment, the second task in the method, evaluates the goodness of fit of the deployed wind inventory to maximize resource harvesting. The resources are catalogued in meteorological available wind speeds and infrastructure to support these facilities. Cluster comparison, the third task in the proposed method, explores divergences or similarities among wind farms, in proximity of each other, evaluating goodness of fit according to age and technology. The task highlights wind farms that may be having inefficiencies in the use of natural or infrastructure resources, evaluating their obsolescence potential. The last task of the method focuses on individual wind farms, highlighted in the previous tasks, to evaluate their potential for partial or total repowering. Wind farms that may have access to higher wind speeds and area expansions are evaluated for total repowering. These installations may use taller and larger wind turbines, extending wind farm areas to take advantage of better wind potential. Wind farms that do not possess potential improved wind conditions or have limited expansion areas may be considered for partial repowering.
The method was developed through Geographic Information Systems (GIS), coupled with big data analytics. To evaluate the method, the more than 60,000 wind turbines installed in the United States (U.S.) were incorporated in the system. Spatial data were obtained from the U.S. Wind Turbine Database (USWTDB) developed by the U.S. Geological Survey, the American Wind Energy Association and Lawrence Berkeley National Laboratory [39]. The databases applied in this research have a high degree of reliability, considering that they were developed in a joint project from academia, industry and the federal government. The database was collected and compiled from public and private data sources, available to each stakeholder. Furthermore, the database is continuously updated and the records are validated, and quality is checked using aerial imagery [40,41].
Average wind speeds at diverse heights were obtained from the Global Wind Atlas, developed, owned and operated by the Technical University of Denmark—DTU [42]. Data were provided in raster format with 250 m resolution and information for wind speeds (meters per second) at heights of 10, 50, 100, 150 and 200 m. Data were transformed into vector format to perform geospatial analysis, assessing wind farm suitability and future development in the United States. Figure 2 shows wind speeds in the continental U.S. at a 100 m height overlaid with the more than 60,000 wind turbines from the USWTDB.
Power output for wind farms in Texas was evaluated from the Hourly Wind and Solar Generation Profiles (1980–2019) commissioned by the Electric Reliability Council of Texas (ERCOT). The databases provide hourly power outputs from diverse wind farms in Texas, comprising 24 GW installed capacity. The model was generated applying historical meteorological data from the Weather Research and Forecasting (WRF) model on a 9 km grid. The modeled hourly wind power output in the database was validated by their developers, applying historical generation data of the highest available granularity on the measured data from operational wind farms [43]. The proposed method additionally applied critical infrastructure data, such as transmission lines, railways, highways and census data [44]. Extra-high-voltage (EHV) transmission lines are essential infrastructure required to connect electricity generated on the wind farms to consumption areas. One of the milestones that allowed the development of wind farms in Texas was the creation in 2005 of Competitive Renewable Energy Zones (CREZs) with the development of new transmission lines. By 2013, USD 7 billion had been invested to create 2900 miles of EHV to bring up to 18,500 MW of wind power from West Texas to urban areas [45,46]. Figure 3a showcases EHV lines [47] overlaid with the wind turbines in Texas, while Figure 3b overlays railways [48,49] and highways [50] applied in the analysis for this study.

3. Results

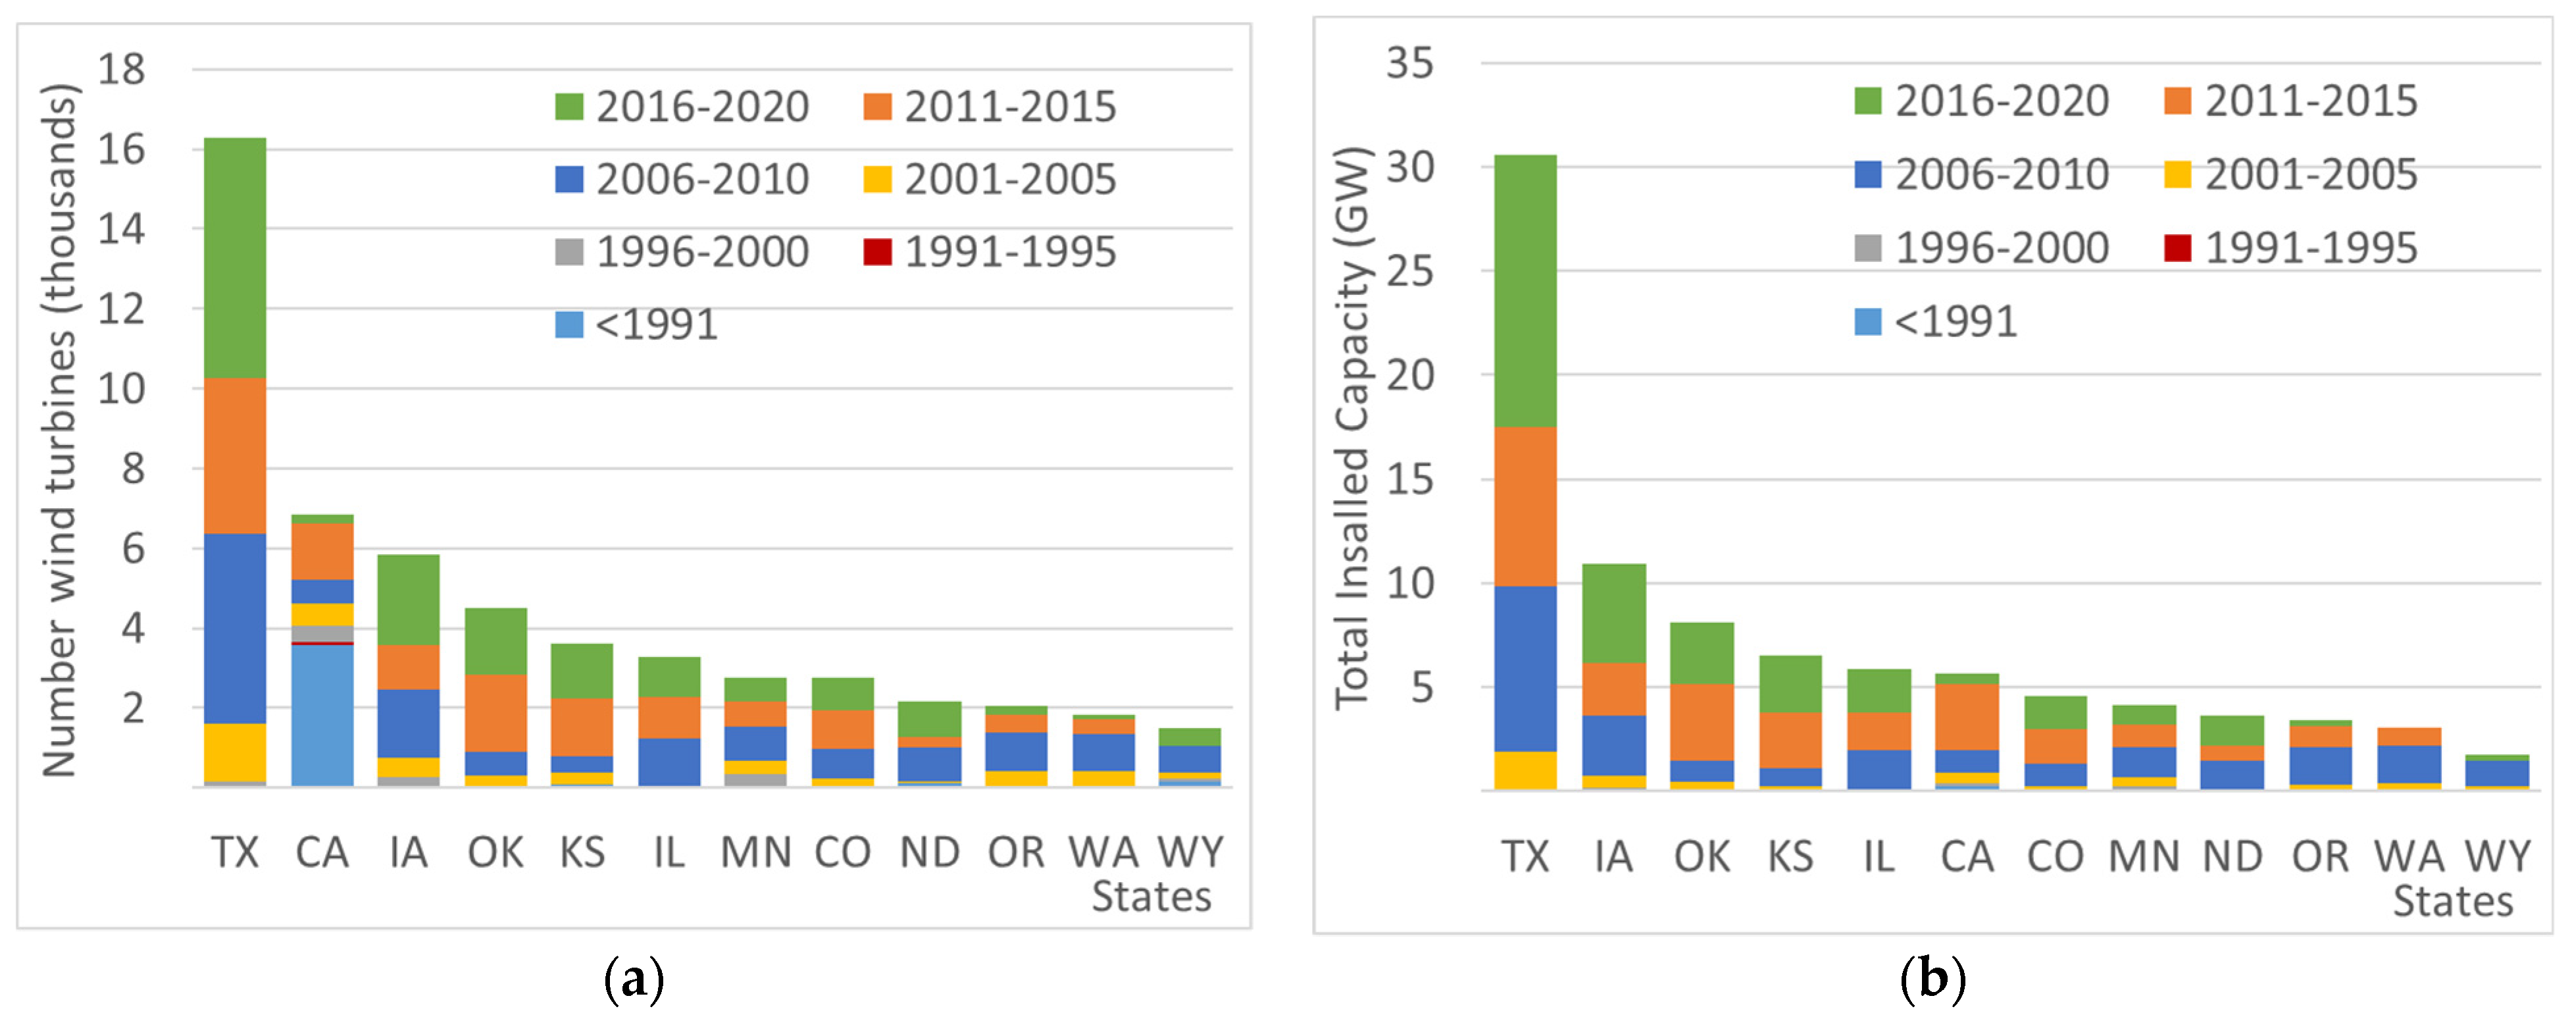
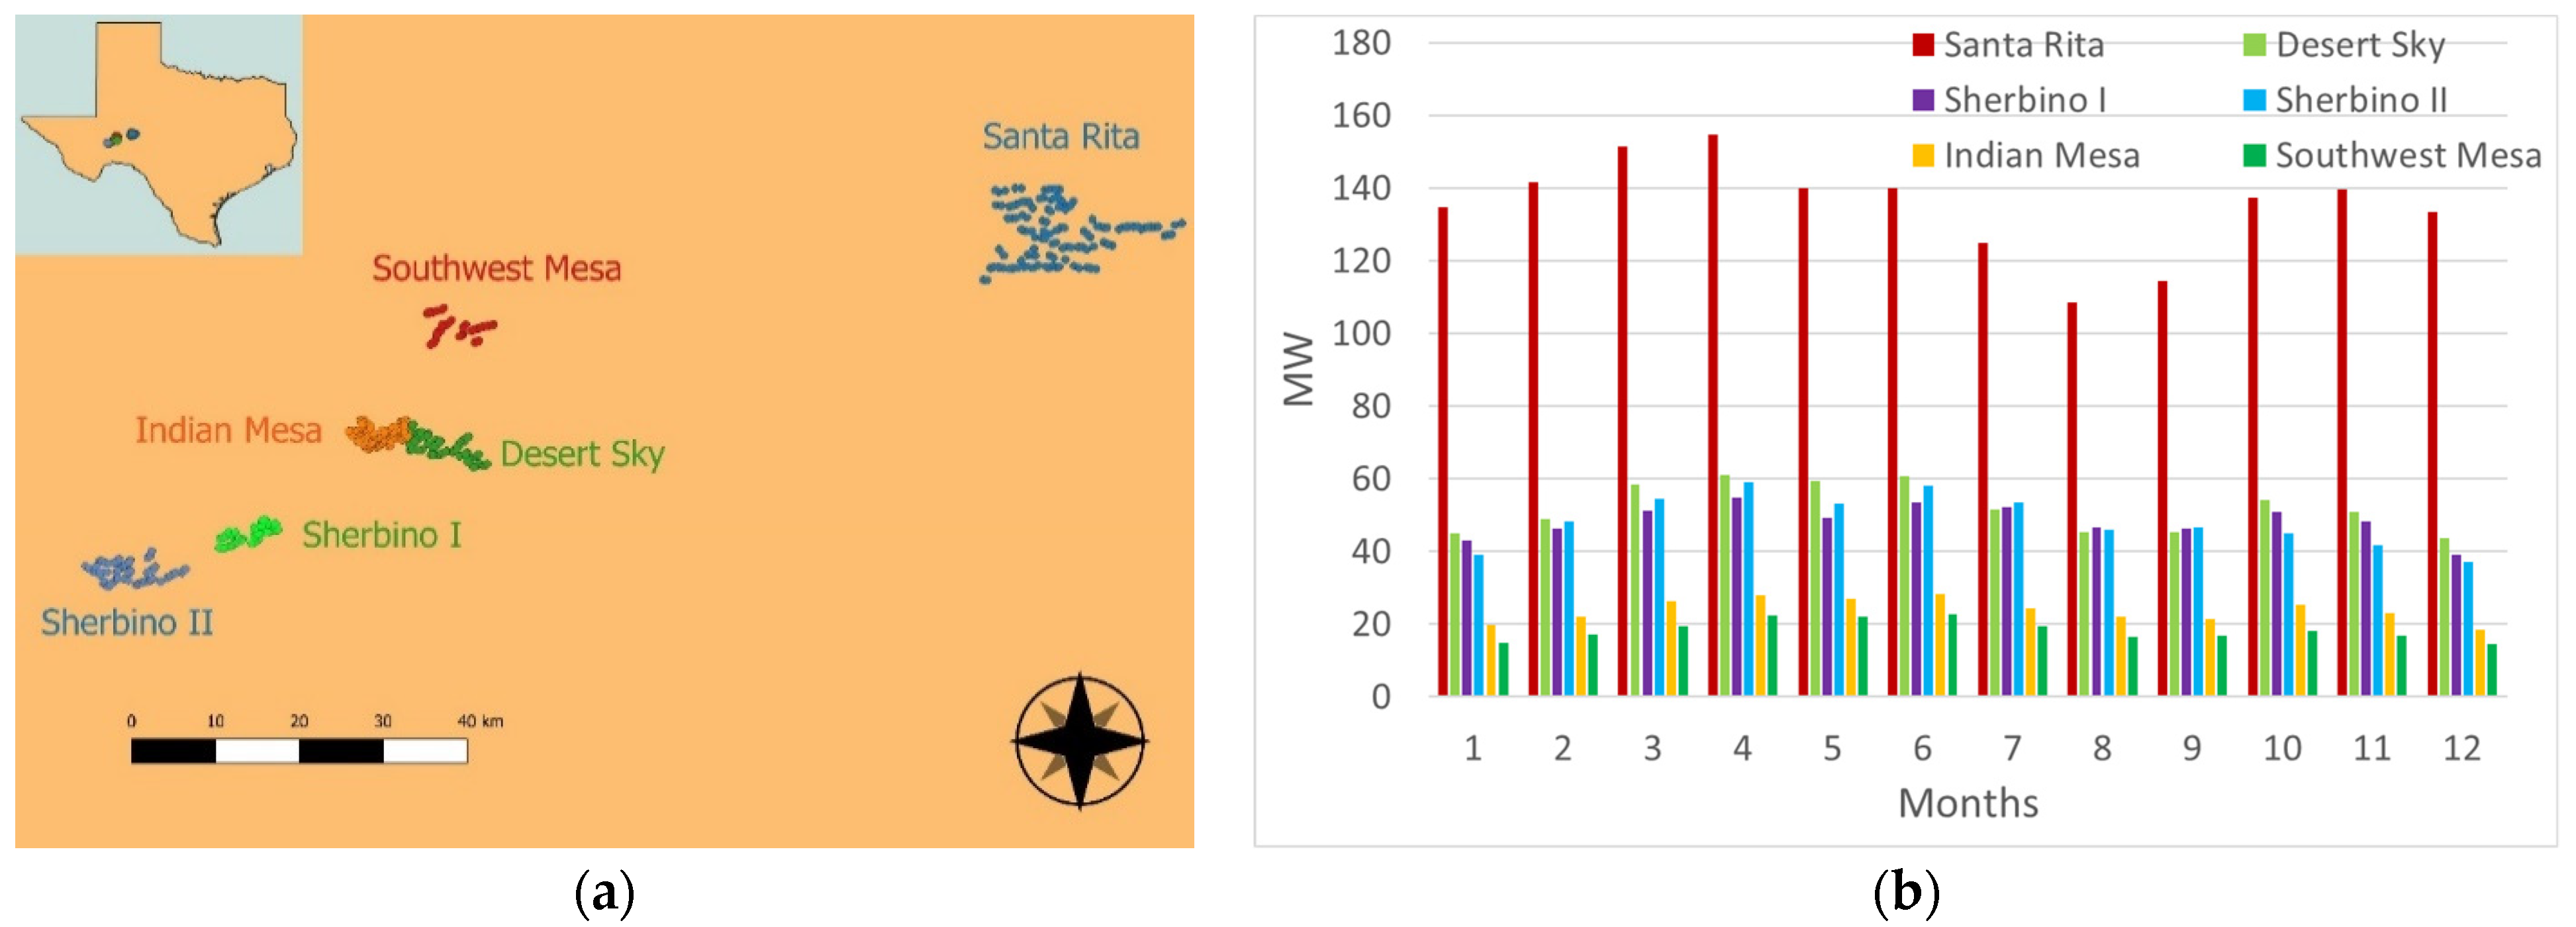
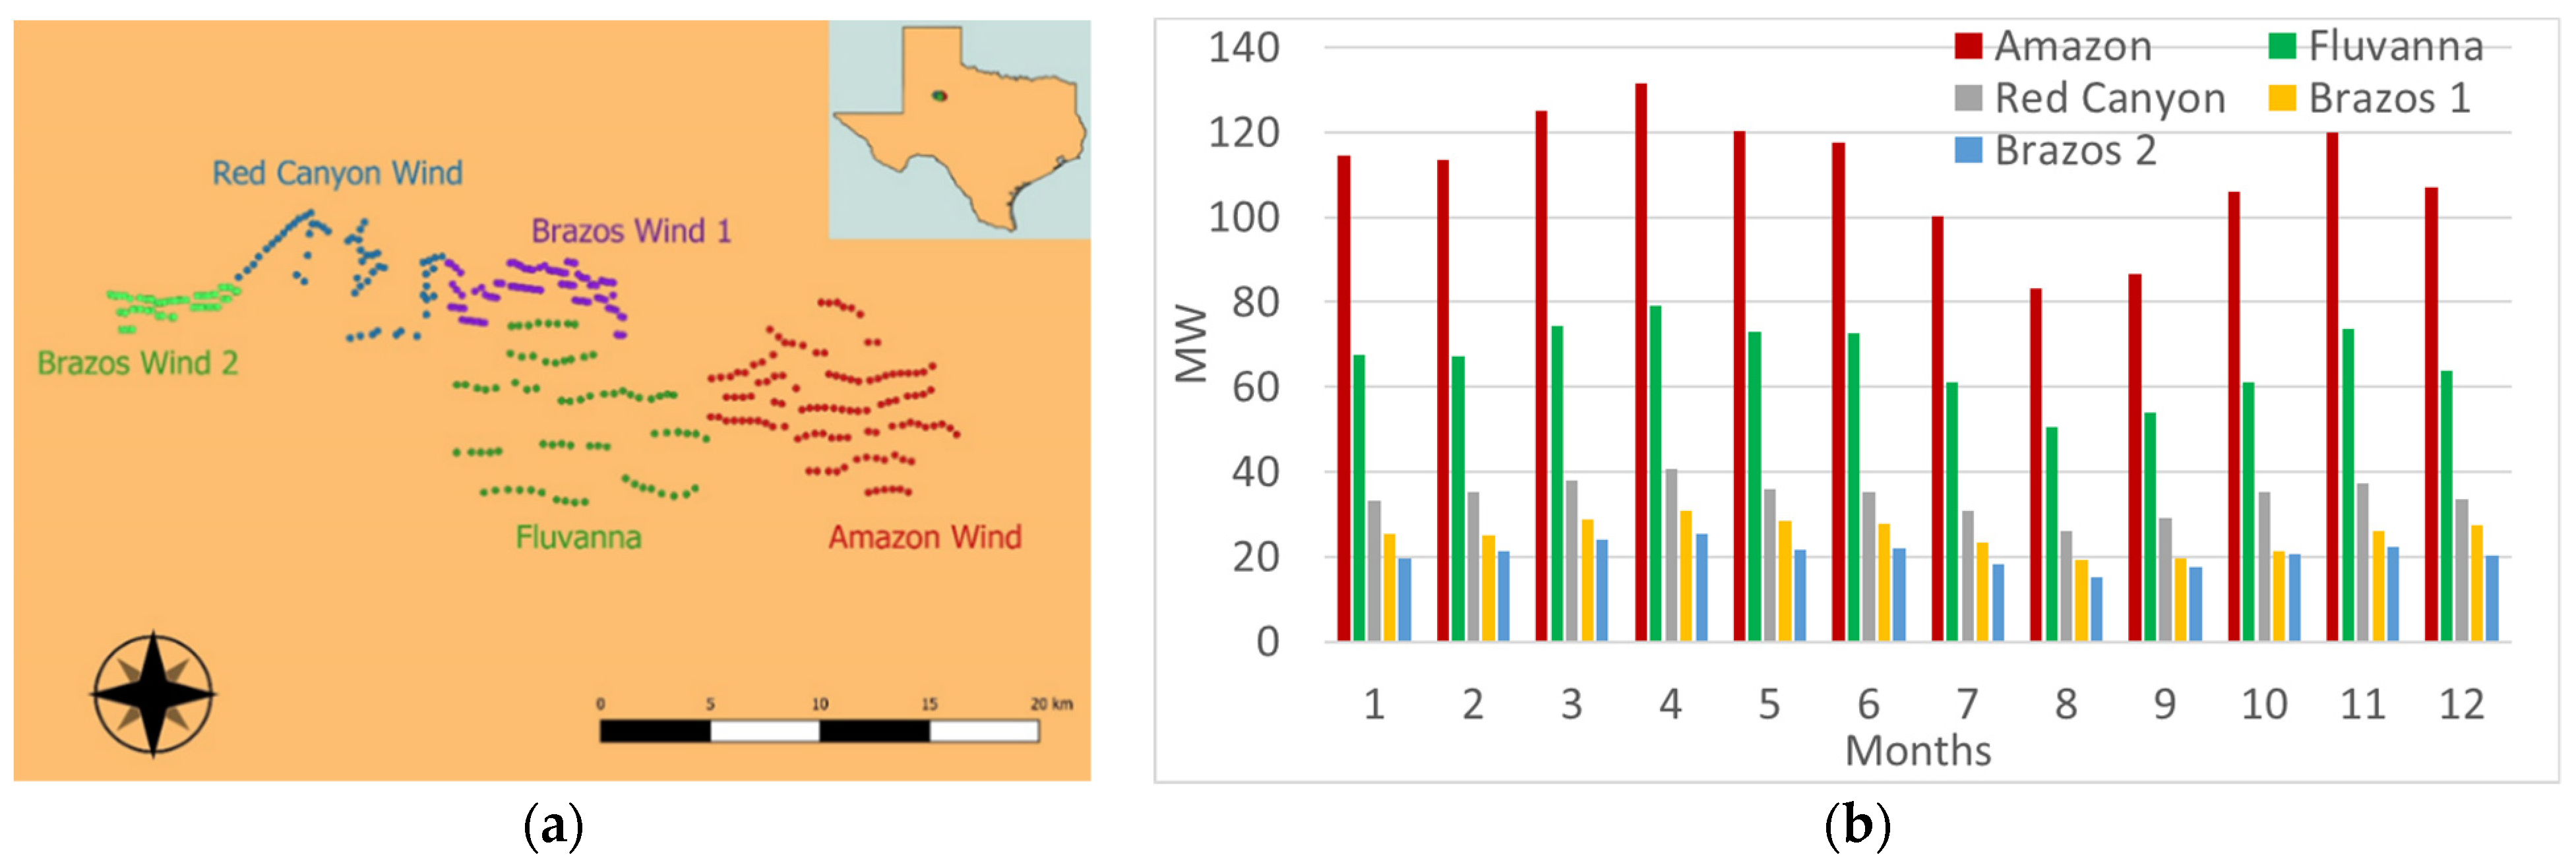
3.1. Wind Equipment Inventory

The wind turbine inventory of the United States was evaluated applying data from the USWTDB [40], selecting the 12 states with the highest installed number and NPC turbines. Texas is the state with the most wind turbines, as shown by Figure 4. The second state with the largest number of wind turbines is California, which drops to the sixth place when evaluating installed capacity (NPC). Considering that California is the state with the longest history of wind energy in the U.S., a comparison analysis with Texas will provide insights into the age-performance framework. The oldest wind farms in California were installed more than four decades ago, while in Texas, most of them are slightly older than 20 years. Both states have a large and varied wind inventory to assess their performance and evaluate repowering suitability. As indicated in Figure 4a, in California, more than 3500 of its almost 6800 (51%) wind turbines were installed before 1991, making them more than 30 years old. For this reason, as indicated in Figure 4b, California drops to the sixth place in the U.S. with regards to installed wind capacity. All the wind turbines installed before 1991 contribute just over 4% to total capacity. On the other hand, wind turbines installed after 2010 (which represent 23% of the total wind turbines) contribute 56% to total installed capacity. When comparing with Texas, it is possible to ascertain that 59% of all wind turbines were installed after 2010, and they contribute to 66% of the installed wind capacity. However, gestation of an imbalance is already showing in Texas for wind turbines older than 2005, with 11% of installed wind turbines contributing only 7% of installed capacity. These results indicate that managing the age of the current inventory of wind turbines in the U.S., potentially even before they reach the 20-year limit, is crucial for the successful development of this sector. Substitution of older equipment in a timely manner will allow supplying the grid with increasingly larger power outputs at lower costs to satisfy demand in a timely fashion. Allowing older equipment to remain in operation for extended periods might create a situation where having a large number of wind turbines does not necessarily signify having a good installed capacity.

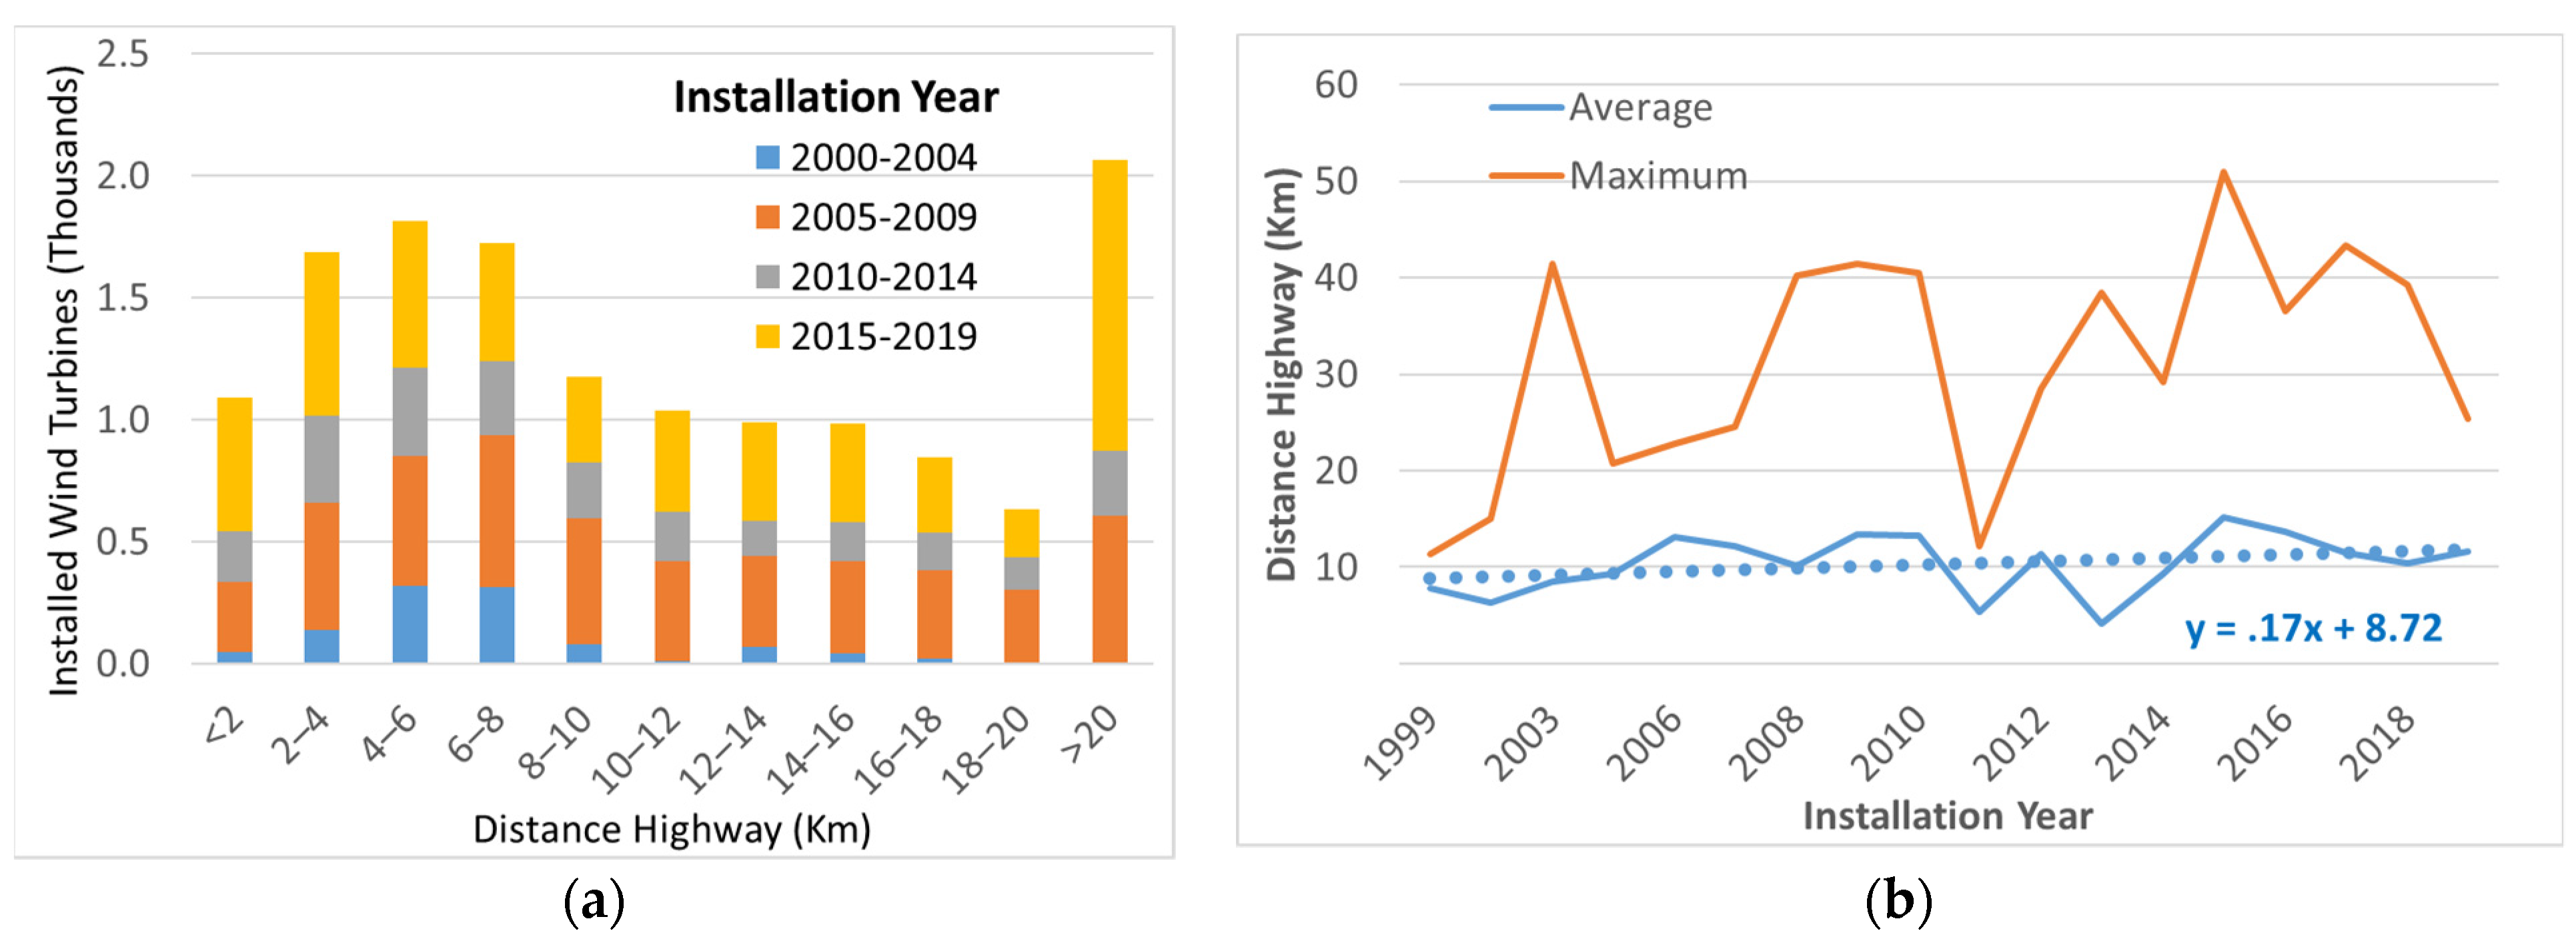
3.2. Suitability-Age Analysis

Previous literature has assumed that under the first-come first-served paradigm, wind farms installed earlier have selected the best locations for wind energy generation, with newer equipment being installed in progressively less appealing locations [12]. The assumption was evaluated applying the proposed method for the U.S., comparing the age of wind turbines and the wind area in which they are installed. Wind energy data from the Global Wind Atlas 3.0 at a 50 m height [42] were overlaid with the USWTDB data [40]. Average wind speed data for each wind turbine location were extracted and evaluated in correlation with the number of installed wind turbines, the total installed capacity and the year of installation, as shown in Figure 5. Figure 5a indicates that almost 32% of existing wind turbines in California were installed in 9 m/s or better wind speed locations, which none of the other states are able to match. However, as shown in Figure 5b, those wind locations only contribute less than 12% of the installed capacity. In Texas, less than 0.2% of its wind turbines are in area of 9–10 m/s, with all of them installed before the year 2008. Less than 7% are in areas of 8–9 m/s, with only 35% of them installed after 2010. For lower wind areas, it is possible to observe a trend of progressively installing more wind turbines in lower wind areas as time advances: 47% of all wind turbines in areas of 7–8 m/s were installed after 2010, while 65% of wind turbines in areas of 6–7 m/s were installed after 2010.

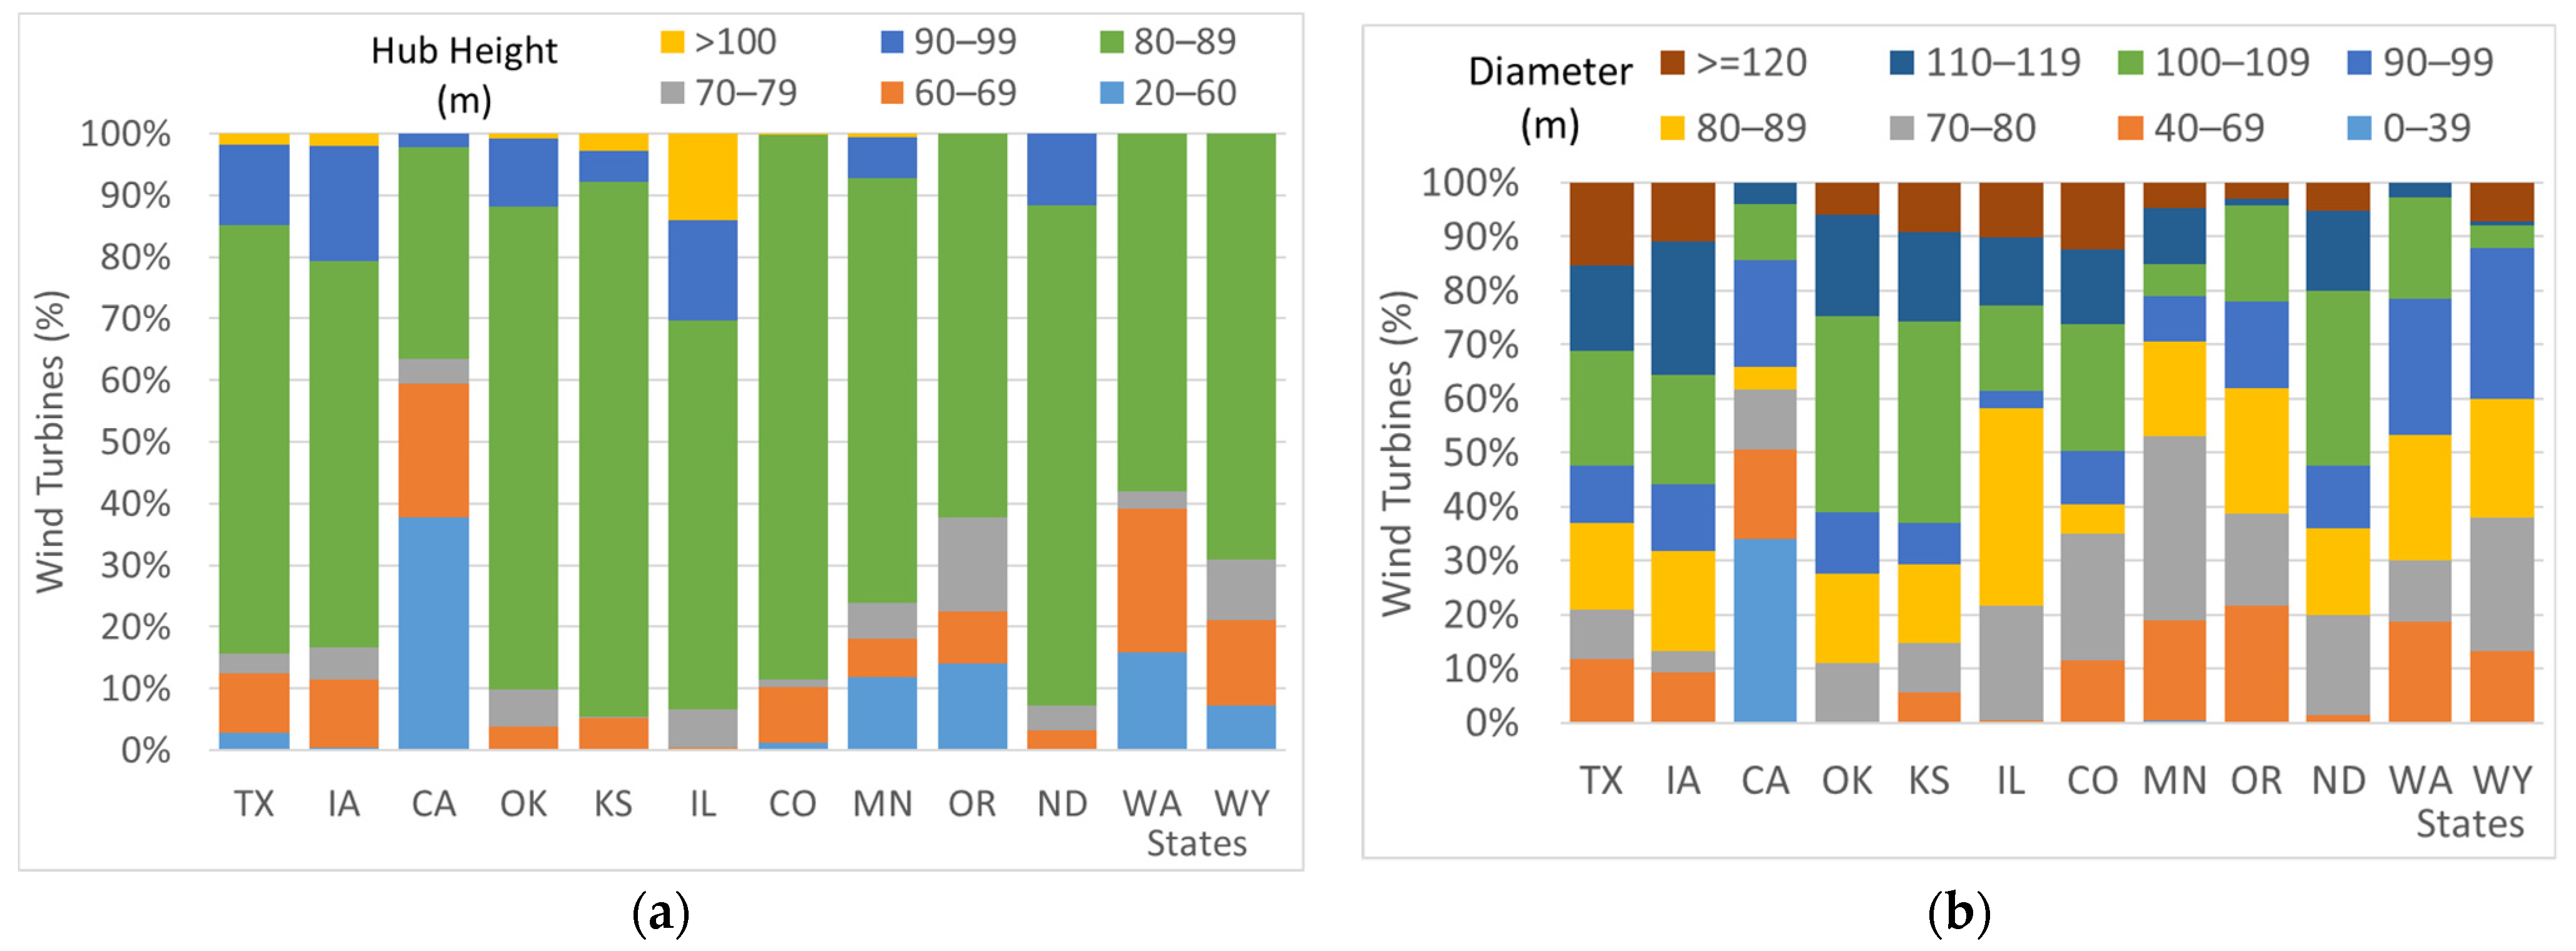
3.3. Wind Technology Assessment

As part of the Market Maturity assessment (first task of the proposed method), hub height and diameter of wind turbines were evaluated. The two factors indicate the technology stage of equipment and their wind energy harvesting potential. As turbine heights increase, they are able to reach much more powerful wind speeds, and as their rotor diameter grows, their potential wind harvesting capacity increases exponentially. These two factors have been very closely correlated with turbines’ NPC, and therefore output power. Their growth is closely link to increased turbine performance [51]. Figure 6a showcases the potential to improve wind energy generation by increasing hub heights. Currently, five of the largest generation states, including California, have almost all of their wind turbines shorter than 90 m. Four states, including Texas, have between 80% and 90% of their wind turbines below a 90 m hub height, and only Illinois has almost 30% of their turbines at a 90 m hub height or higher. Rotor diameter size is an important factor on the equipment potential to extract energy from wind. As technology advances, blade length has increased, allowing for much more energy capture. Figure 6b indicates that ten of the states with the highest concentration of wind farms have rotors equal to or higher than 120 m in diameter. Four states have 10% of the turbines with rotors equal to or larger than 120 m, and five states, including Texas, have 50% of their turbine inventory with diameters of at least 100 m.
The historical evolution of hub height and rotor diameter in the continental United States is presented in Figure 7. The figure showcases the rapid increase on both turbine characteristics, not just at a national level, but also for individual states. The Texas average turbine diameter increased from less than 50 m in 1999 to more than 120 m at present, as illustrated by Figure 7b. The hub height of wind turbines has significantly increased from an average of less than 60 m two decades ago to more than 90 m in 2020. Furthermore, two wind farms in Texas, Mesteño (2019) and Hidalgo II (2020), have turbines with hub heights of 112 m. The trend for higher hub heights will continue, considering that in 2018, two demonstration turbines were installed in Texas with hub heights of 120 and 130 m, respectively. However, these wind turbines are potentially being installed in progressively less attractive areas with regards to wind speeds. Some locations occupied by older wind farms would benefit from newer equipment. Figure 7c illustrates the growth of equipment in California, the state with the longest history of wind energy. The diameter of the wind turbines increased in the last four decades, from less than 16 m on average to more than 110 m, while the hub height increased from 23 m to more than 90 m. As California has fewer good locations with higher wind speed potential, repowering would be an important factor to improve wind energy generation. California indicates, from these results, a higher degree of market maturity than Texas. However, Texas has considerable locations and wind farms that may have reached maturity levels and may be adequate for repowering.

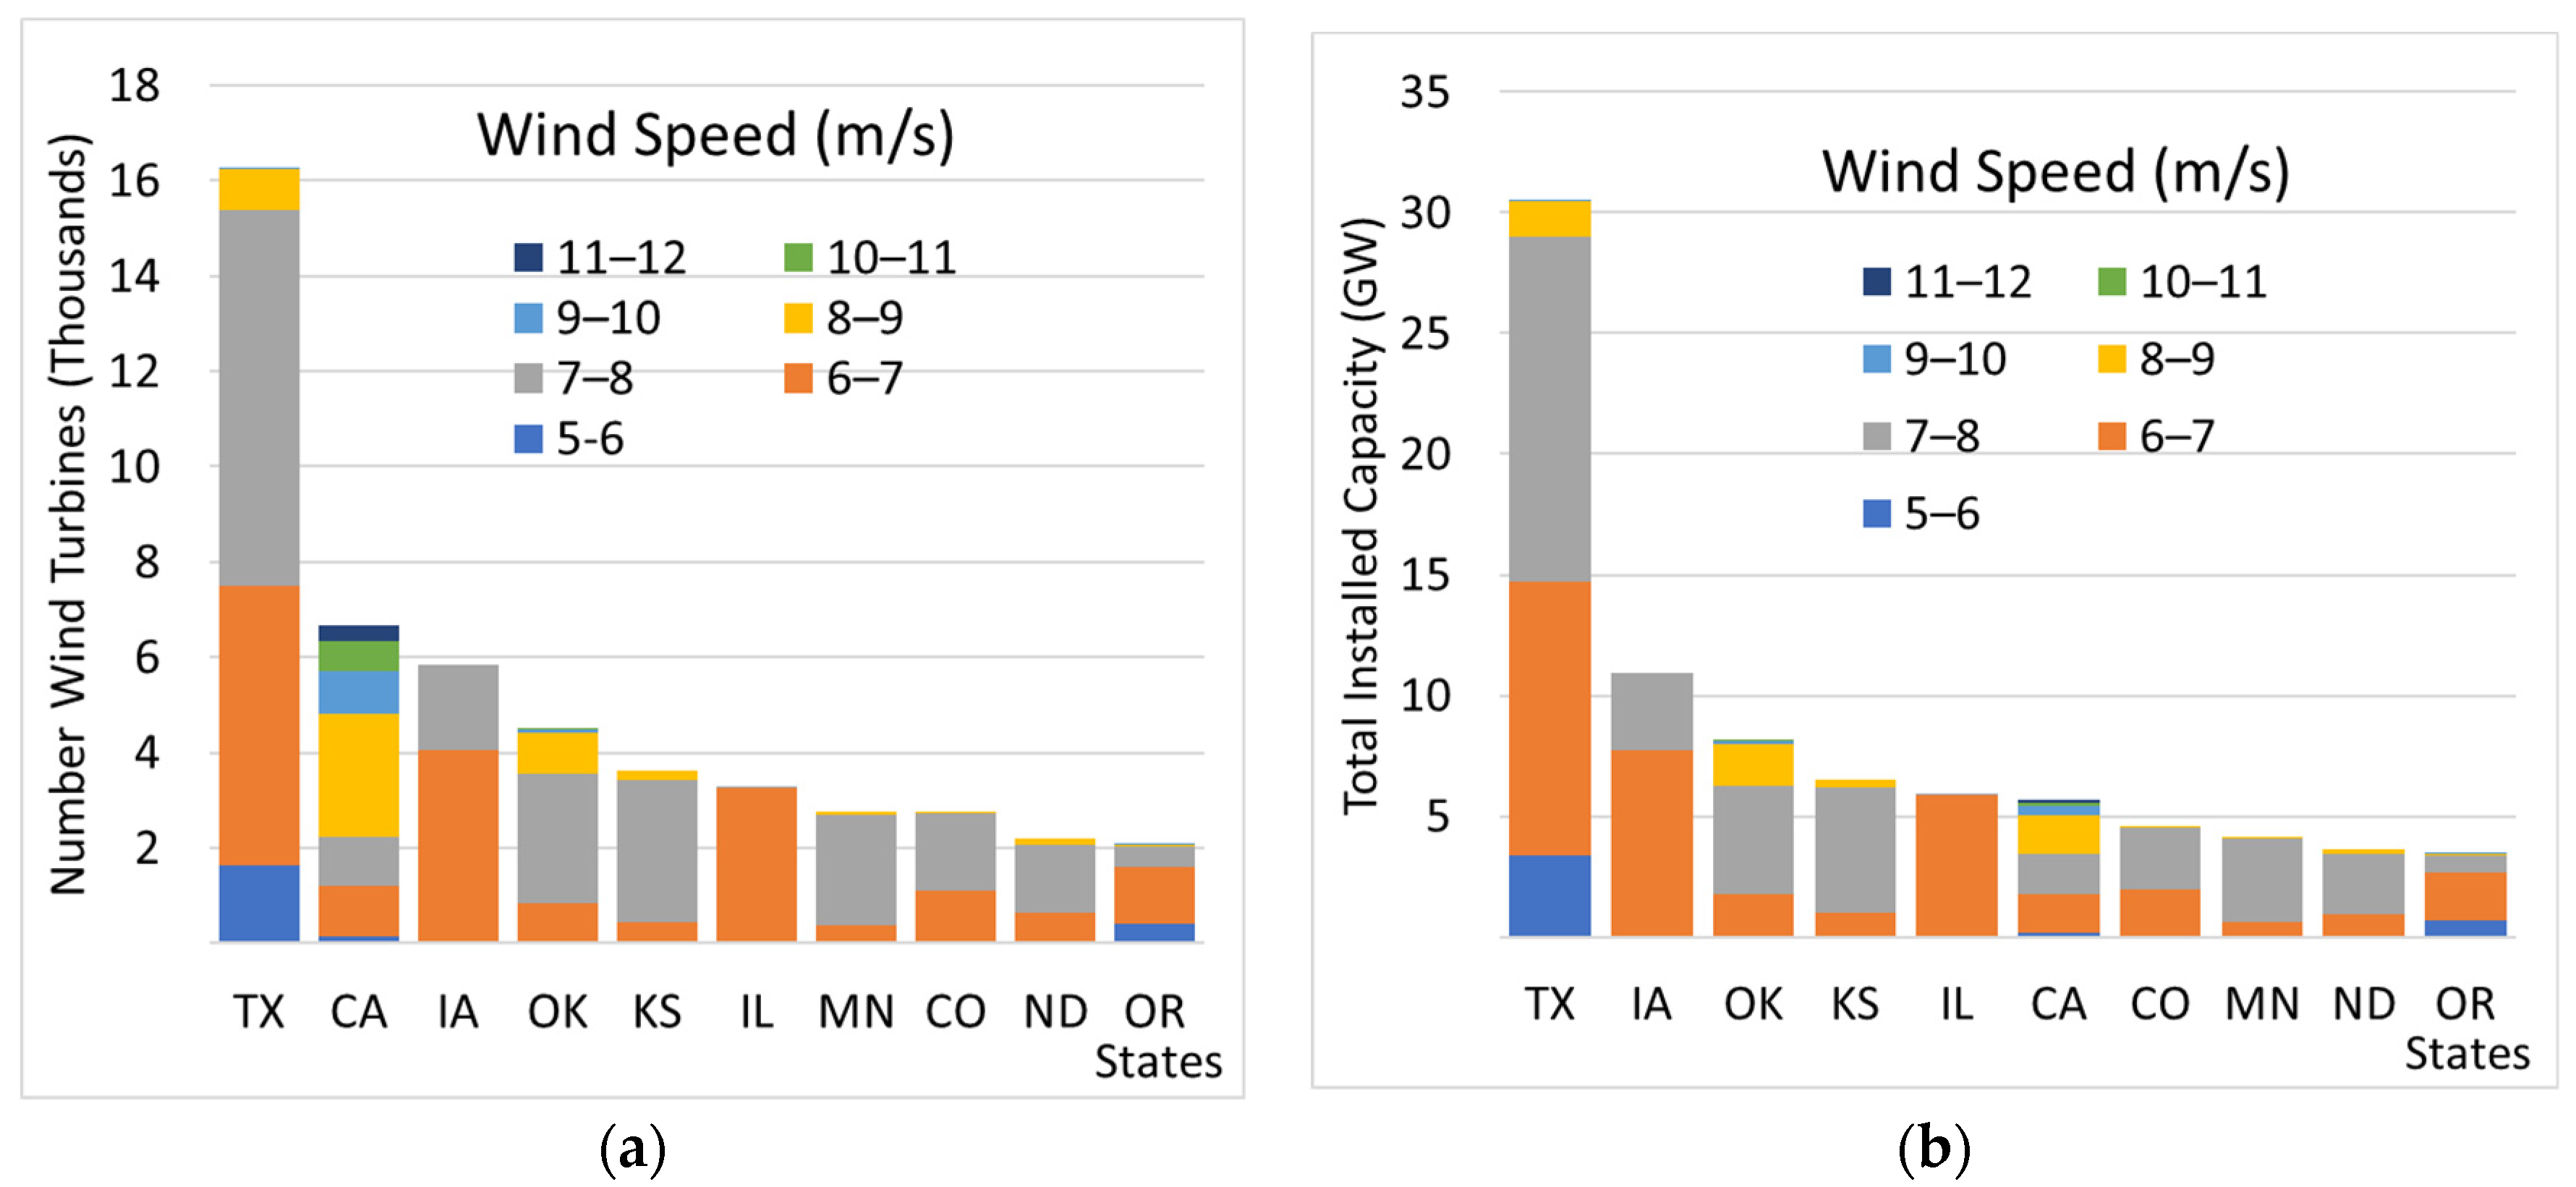
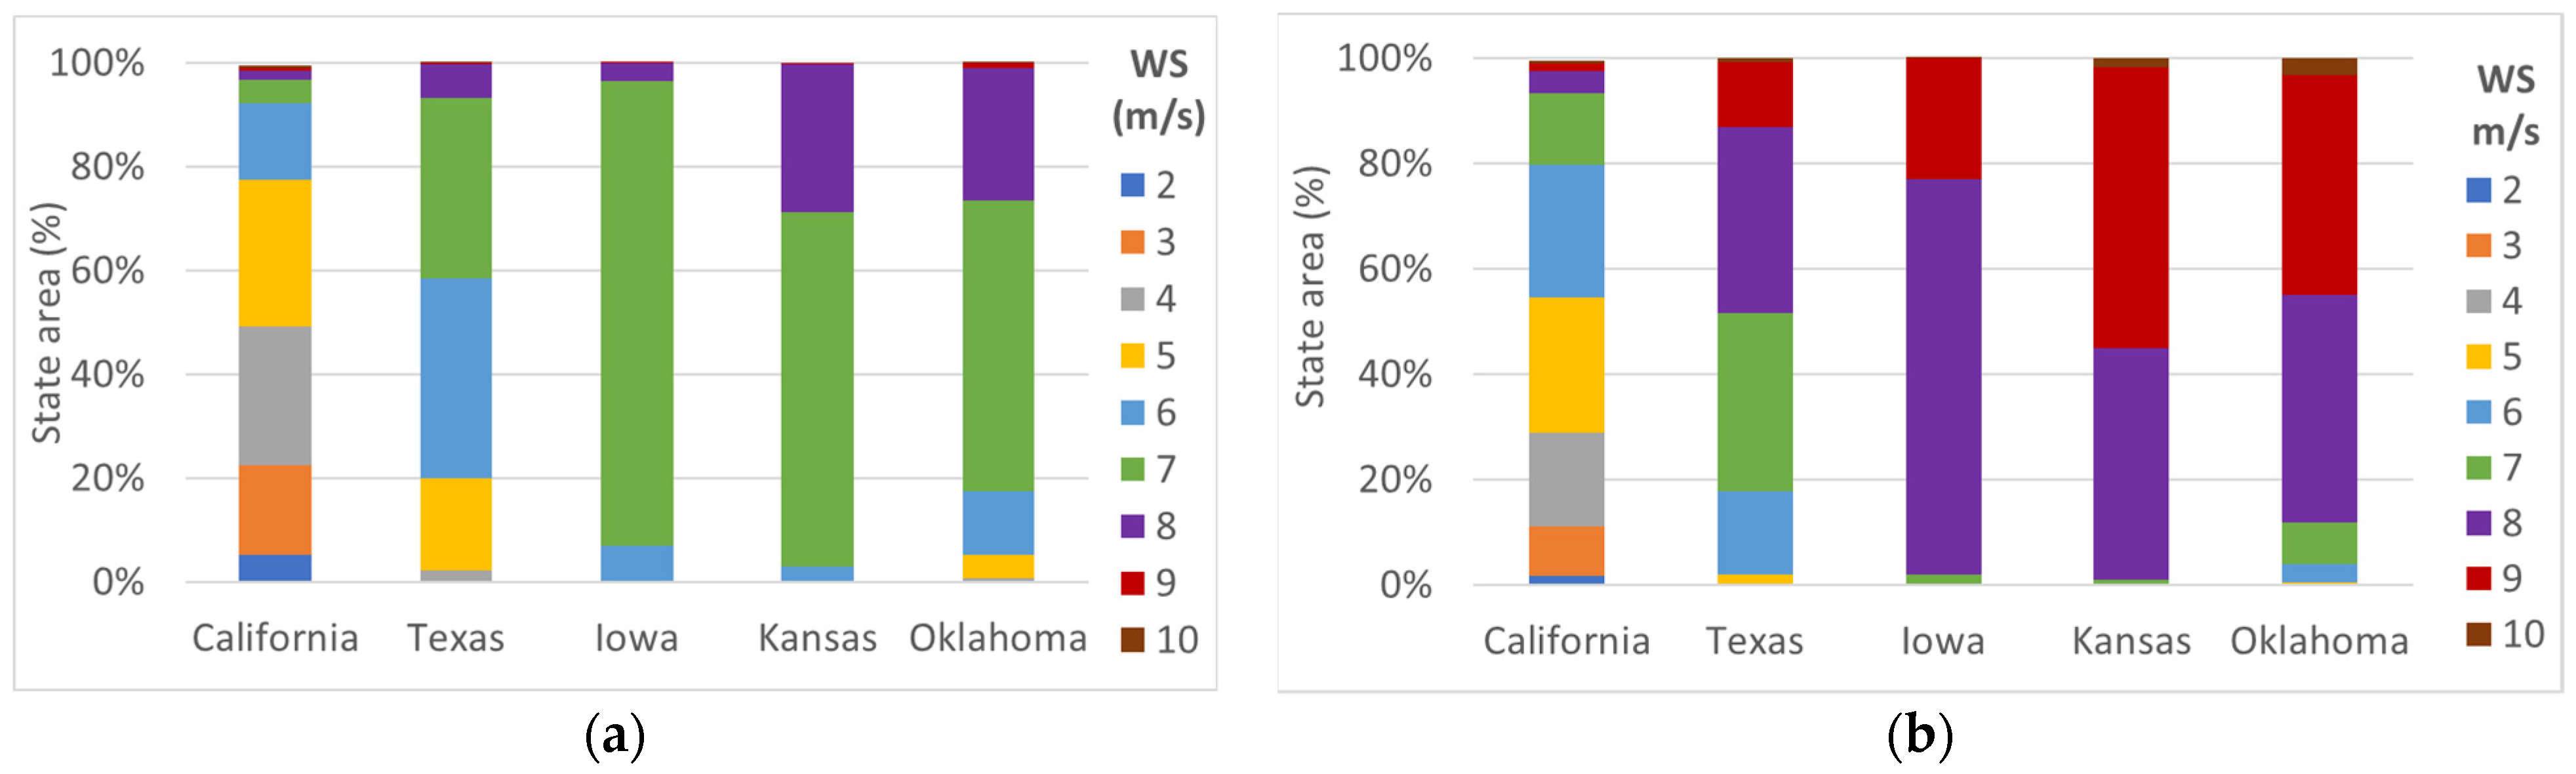
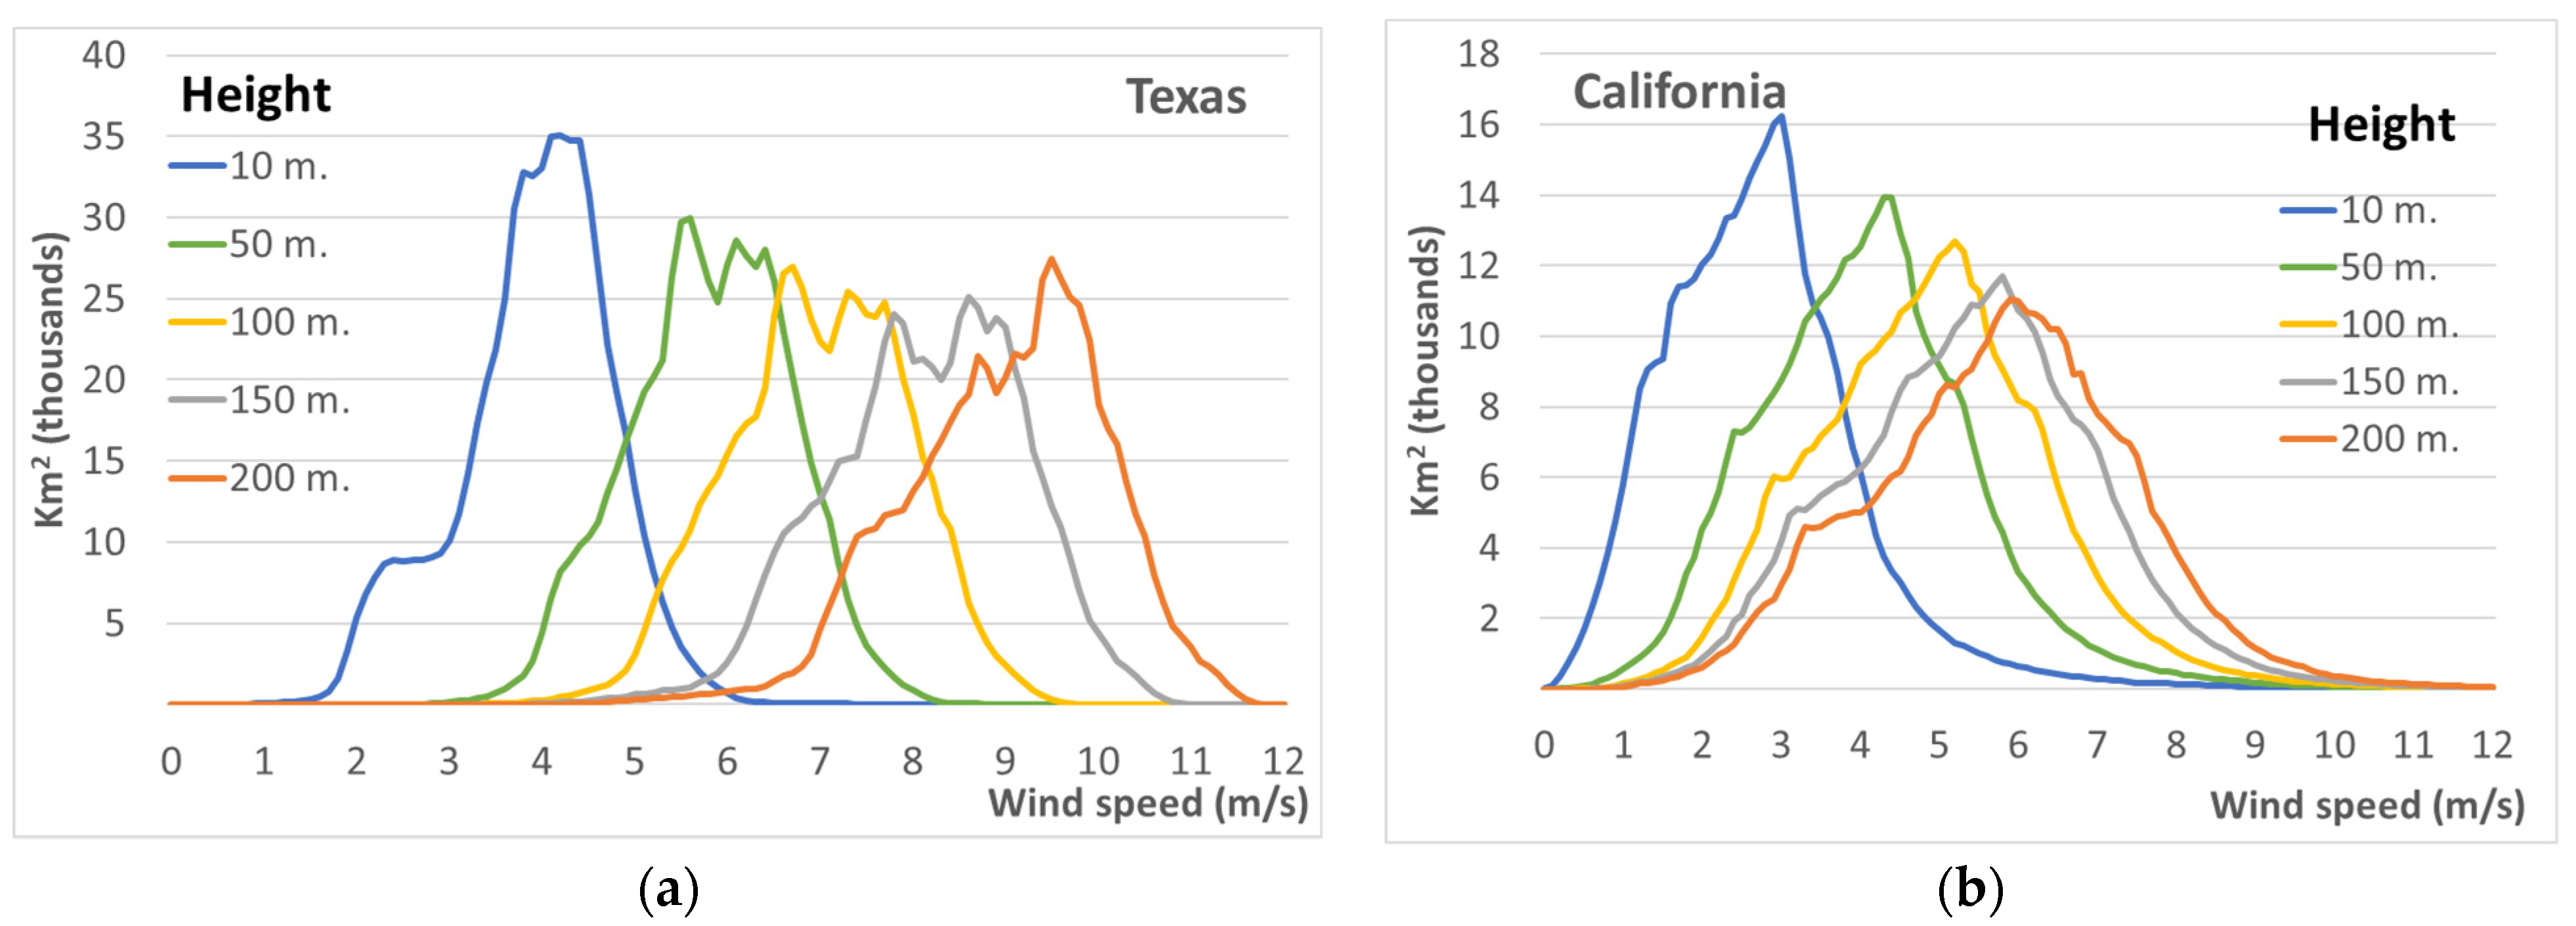
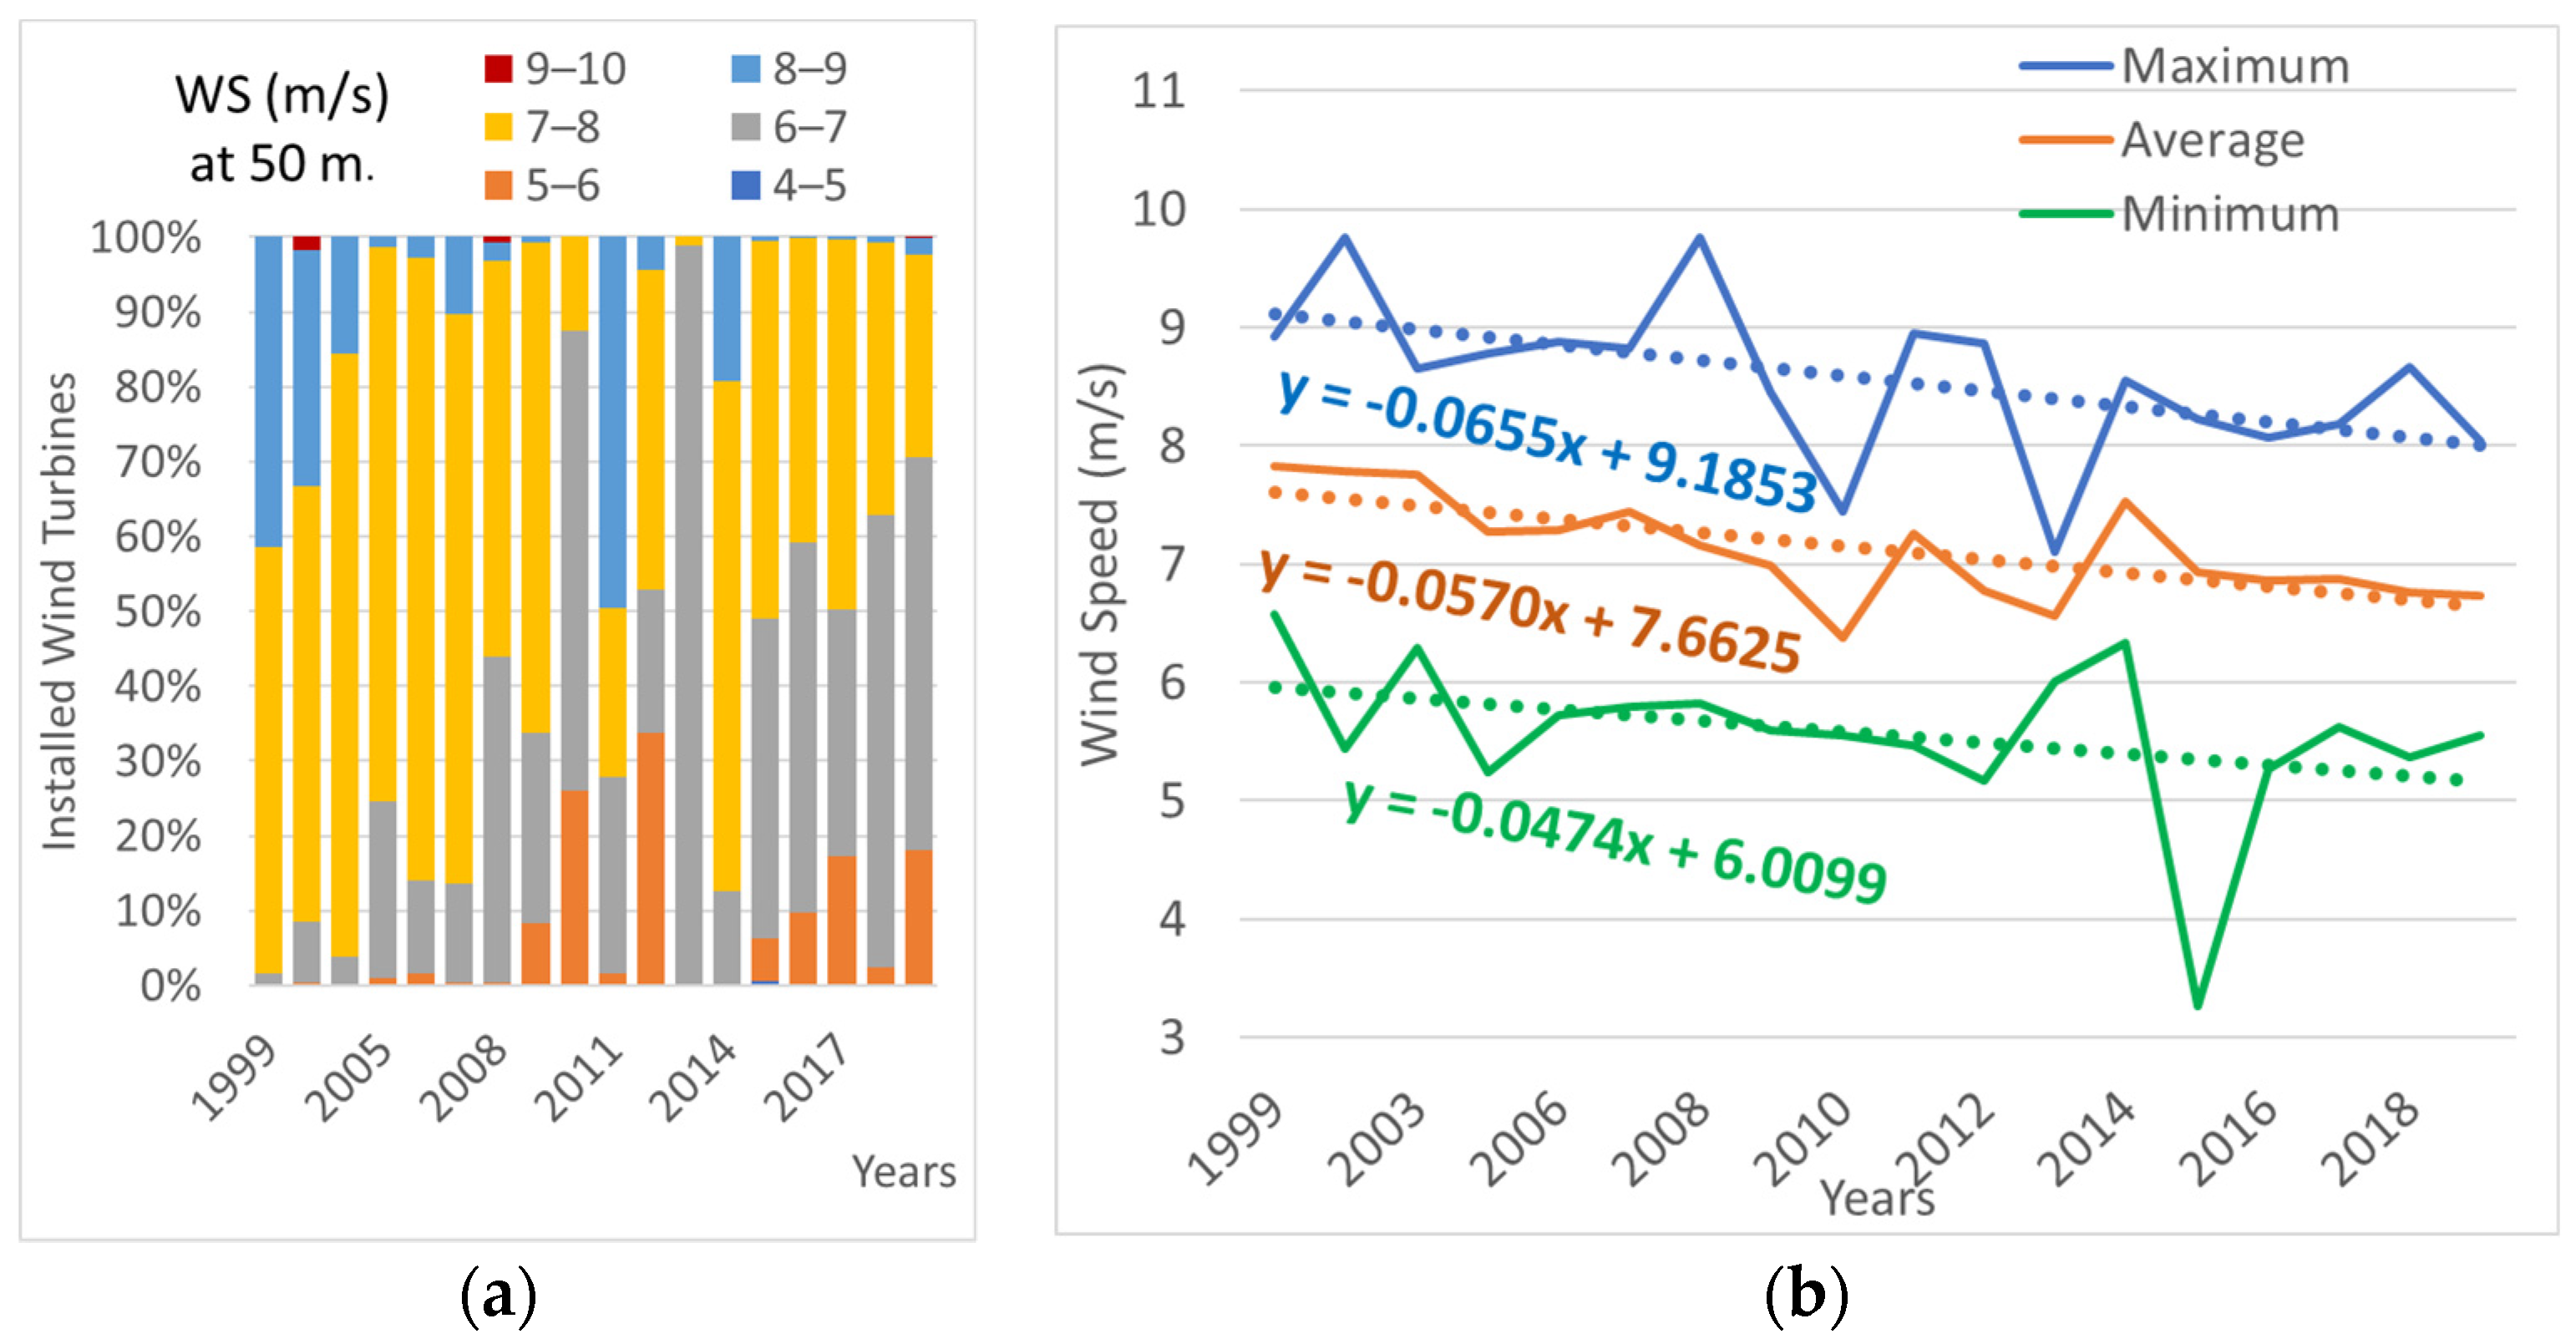
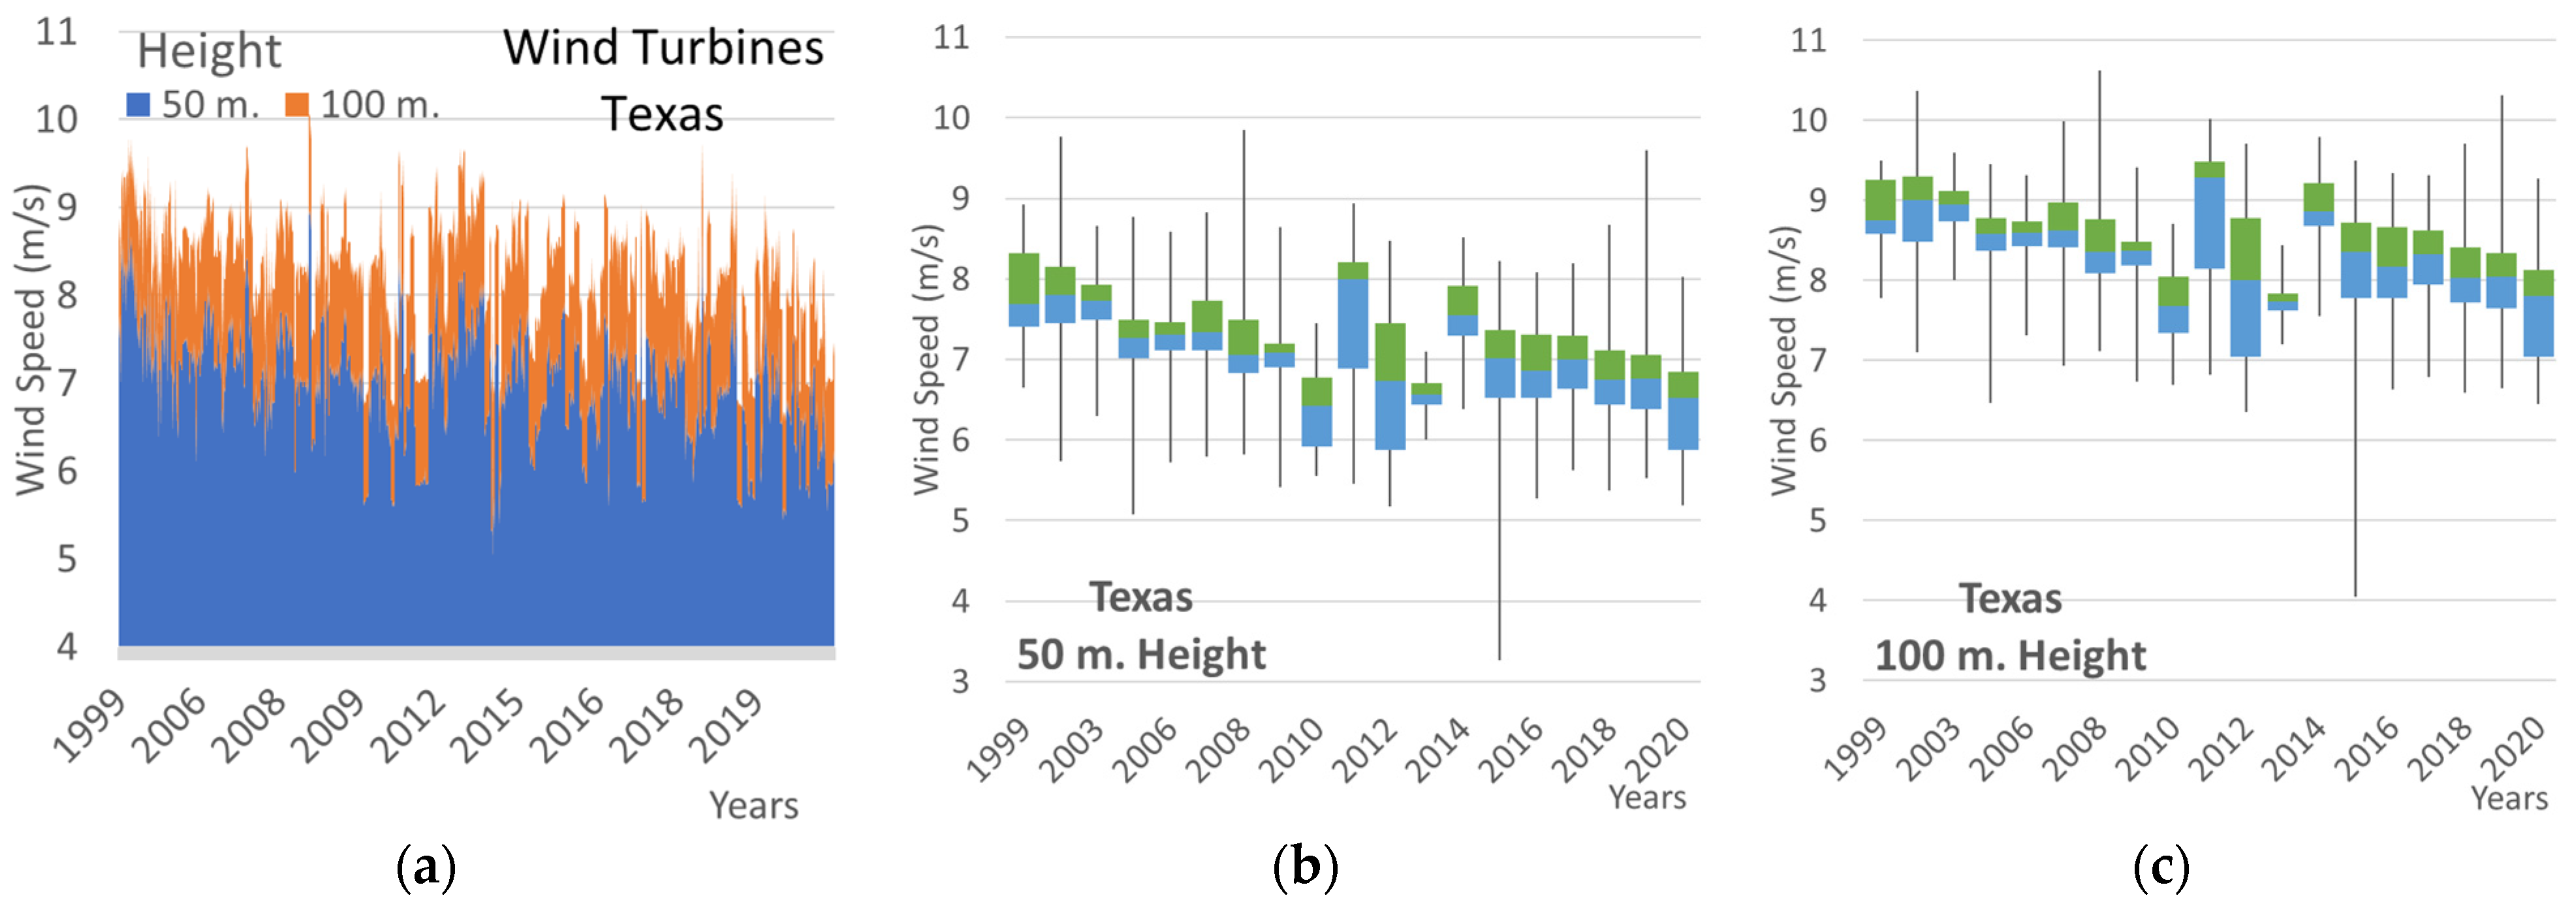
3.4. Assessment of Wind Resource

Resource assessment (second task of the proposed method) evaluates the availability of wind resources in the area of the five states with the highest installed wind energy capacity, as shown in Figure 8. State areas are classified according to average wind speed, applying data from the Global Wind Atlas 3.0 considering 50 and 100 m heights [42]. Figure 8a indicates that at a 50 m height, Kansas, Oklahoma and Iowa are the states with the highest average wind speed on a larger proportion of their territories. On the other side of the spectrum, California has the lowest area percentage with higher wind speeds, reinforcing the notion that this state will highly benefit from repowering their wind farms. Texas has almost 40% of its area with an average 7 m/s wind speed, highlighting the importance of managing wind farms’ repowering to avoid suboptimal wind energy extraction. The analysis provides similar results for wind speeds at a 100 m height, as shown in Figure 8b. Significant availability of stronger wind speeds at higher altitudes provides an incentive to evaluate repowering of ageing wind farms. Newer wind turbines with higher hub heights will reach stronger wind speeds, extracting substantially more power.
A further granular study on resource assessment is provided by the results in Figure 9. These results describe the area distribution of wind speeds for Texas and California at diverse hub heights, applying data form the Global Wind Atlas 3.0 [42]. As expected, higher altitudes lead to larger wind speeds. Texas, as shown in Figure 9a, has an increase between 1 and 2 m/s per location when comparing 50–100 m heights. The shape of the curve is very similar for ranges of 50–150 m, with a slight reduction on area availability. Locations with high wind energy potential overlap in this distribution, with points representing high wind speeds at a 50 m height similarly having corresponding high wind speeds at 100–150 m altitudes. Therefore, when older, smaller wind turbines are installed in these locations, they block installation of bigger wind turbines, confirming the risks of first-come first-served for wind farms. California wind speed per area and height, shown in Figure 9b, has divergent performance distribution when compared with Texas. The availability of high wind speed areas is reduced as altitude increases, indicating reduced areas with good wind energy harvesting performance. However, for California, the curves show a very long tail and right skew, extending to higher wind speeds, but limiting potential areas with optimal wind speeds. For instance, for both 50 and 100 m heights, the curve’s tail has notable length, reaching to high wind speeds of 11–13 m/s. The findings further strengthen the need to optimize wind turbine equipment to maximize energy extraction, considering the reduced number of locations with high wind energy potential.
Wind turbines in Texas are mostly placed in areas of 6–8 m/s, as shown in Figure 10a, with turbines in the 6–7 m/s range representing 33% of all wind turbines, and more than 70% were installed after the year 2010. In contrast, 53% of wind turbines in Texas were installed in 7–8 m/s ranges, and more than 54% of them were installed before 2010. The analysis confirms that in Texas, older wind turbines were installed in better wind locations, making these locations unavailable for new equipment. This is underscored by the fact that in 2015, for the first time in Texas, wind turbines were installed in ranges lower than 5 m/s. Figure 10b evaluates the trend change for wind turbine installation in Texas according to wind speed areas over the last twenty years. The maximum values (blue) highlight that since 2008, no wind turbine has been installed in an area higher than 9 m/s, that in 2013, the maximum wind speed location was 7.1 m/s, and that after this year, a very limited number of wind turbines has been installed in areas higher than 8.5 m/s. Furthermore, the trendline reflects a negative coefficient, with every year showing an average decrease on the maximum wind locations where turbines are installed. The minimum wind speed locations are revealing, showing a negative trend over time with a wind turbine installed in a very low wind speed location of 3.26 m/s in 2015, and after that not reaching locations above 6 m/s. The average wind speed data for locations (orange line) highlight that before 2009, the average wind speed for all locations was above 7 m/s, and after that, in only two years, the average wind speed reached above this value, but never after 2015. The data confirm that newer wind turbines were pushed to progressively less favorable locations due to older equipment remaining in operation in the optimal wind areas.
As part of the resource assessment task, results in Figure 11 were generated, evaluating potential improvements that may be achieved through total repowering, increasing turbines’ hub height. These results indicate wind speeds that can be reached from older wind turbines’ locations at a 100 m height. Figure 11a showcases an average increase for all installed wind turbines of almost 1.3 m/s, from 50 to 100 m hub height. Considering that turbines installed 20 years ago in Texas had on average a 60 m hub height (Figure 7), the potential to improve power output with taller equipment would be significant. Furthermore, these figures confirm previous results on the gradual reduction over time of wind speeds as the wind industry grows in Texas. Figure 11b,c further display that wind turbines installed before 2010 have great potential at 100 m height, considering that wind speed distribution above the second quartile indicates consequential availability for 9 m/s and above.

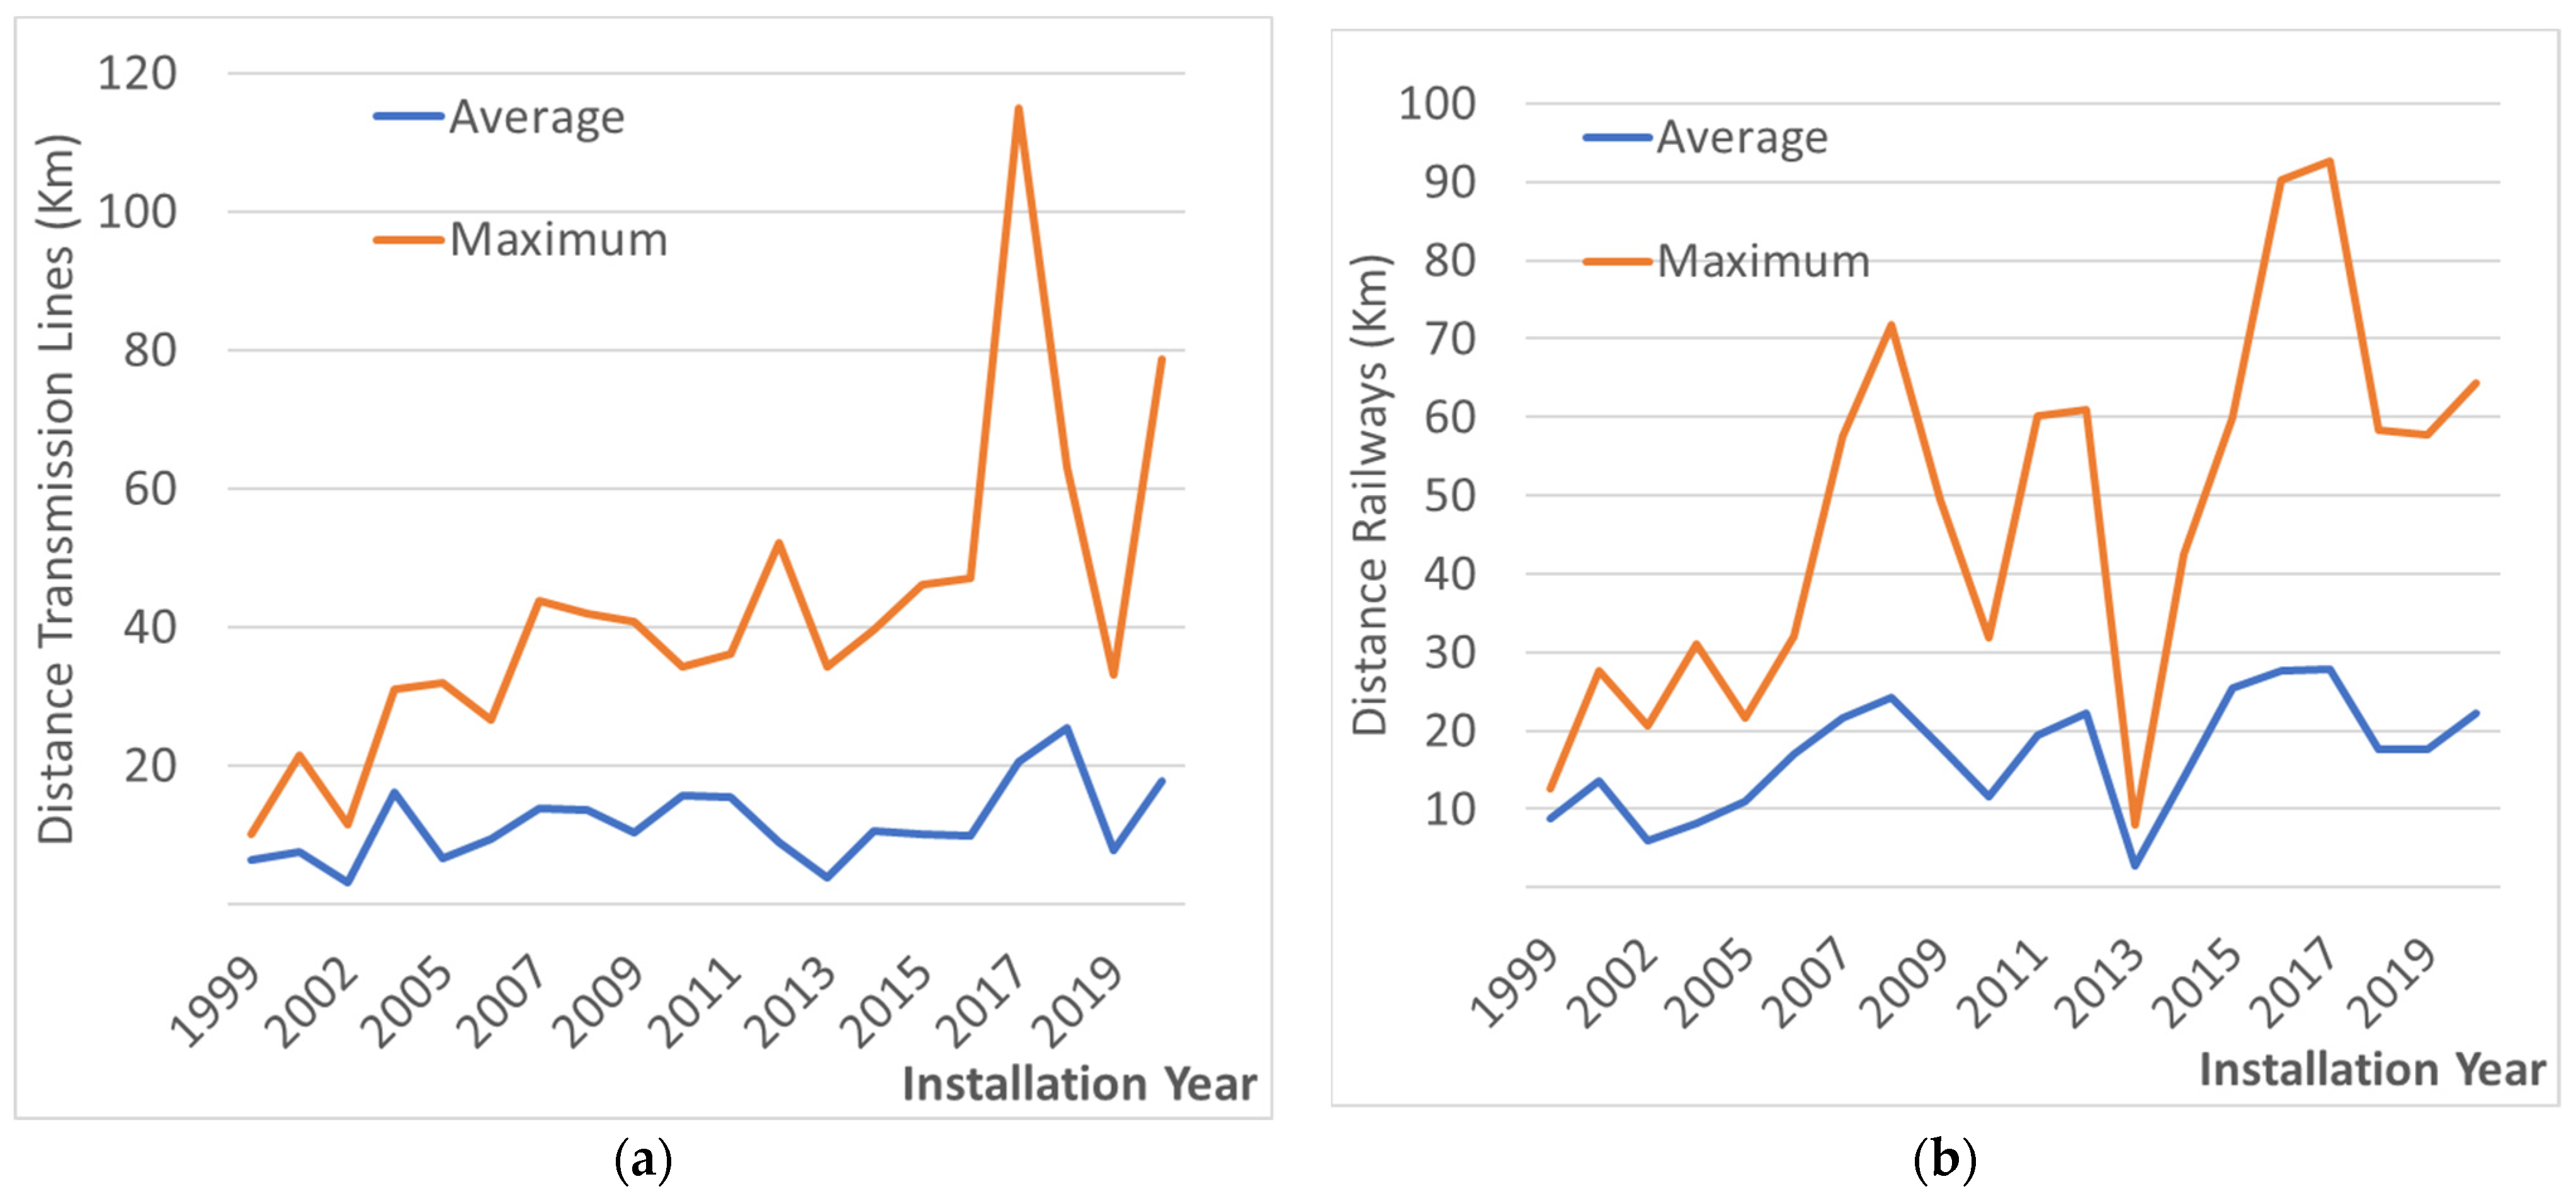
3.5. Assessment of Transmission and Transportation Infrastructure

Distance from wind turbines to EHV is a relevant factor for the development and operational costs. Greater distances imply a higher cost, including longer cables and higher power lost during transmission. Figure 12a shows an increasing yearly trend of the average and maximum distances from wind turbines to EHV. Three of the four years preceding 2020 have shown record high distances: 2017 with more than a 21 km average distance and 115 km maximum distance, 2018 indicating an average distance of 25 km and maximum 63 km and 2020 with a 79 km maximum distance. Another important parameter for successful wind farms is the transportation of ever-growing massive wind turbines. This is one of the biggest logistic challenges for the development and management of wind farms. Trains have been the preferred method of transportation for wind equipment in recent years. Figure 12b indicates the distance from individual wind turbines to the nearest train track. Average distance and maximum values have increased yearly. Four of the most recent six years (since 2015) have represented historical records on average distances from railroads. Three of those years have been higher than 25 km for averages and two years higher than 90 km for maximum values. Both analyses showcase that newer wind farms have been installed increasingly on more costly locations, further away from critical infrastructure. Wind farm repowering may be recommended for older wind farms occupying prime locations for access to critical transportation and transmission networks.
Existing highways and access roads to wind farms are an important infrastructure resource. In the construction phase crews, machinery and equipment are brought using existing highways and roads. During the operational stage, access to facilities to perform maintenance and management road access is very important. Road construction for new wind farms would substantially increase the Capital Expenditure (CapEx), in some cases decreasing the project feasibility. Therefore, distance to existing highways is an important element to reduce costs and improve project viability for wind farms [52]. Accordingly, more than 50% of all installed wind turbines in Texas are less than 10 km away from the closest major highway, as shown in Figure 13a, while more than 85% are nearer than 20 km. These results indicate that from wind turbines in the state in the period 2000–2004, only 1% were at distances higher than 10 km, while for 2015–2020, more than 20% were at distances higher than 10 km. Results reveal that wind farms are progressively being installed further away from major highways, as confirmed by Figure 13b. The average distance from wind turbines after 2006 has fluctuated between 10 and 15 km. Only two years, on which there were fewer new turbines installed (2011 and 2013), generated averages of 5 km. The maximum distance values for four out of the five most recent years have distances of almost 40 km or higher.
Results presented in Figure 14 evaluate the ERCOT’s Hourly Wind Generation Profiles [43], further highlighting obsolescence as a substantial factor deciding wind farm repowering. Figure 14a shows an almost yearly continuous increase in individual wind turbines’ average power output, generating more than five times the average power output in 2018 compared with 1999, and almost double compared with 2010. Furthermore, the NPC has continuously grown since 2013, with the last three years having the highest values, all above 3.5 MW. Newer wind turbines are clearly outperforming many older turbines that are less than twenty years old. However, when the capacity factor (CF) is evaluated in Figure 14b, results become even starker. Almost all the wind turbines installed before 2014 have a CF of less than 40%. On the other hand, modern turbines have performed at 40% CF or higher over the last six years, with some recent wind turbines achieving values above 50% CF. Therefore, installing advanced turbines in locations of older wind farms will bring the additional benefit of significantly increasing CF values, strengthening the case for total repowering of some Texas wind farms

4. Discussion

Task three in the proposed method, cluster comparison, evaluated the performance of wind farms that may be a good candidate for repowering, benchmarking with newer installations in close proximity. A geospatial analysis was performed on these facilities considering that their proximity allowed for a fair comparison among them. Figure 15a shows six wind farms located in central west Texas. From these wind farms, South West Mesa, Desert Sky and Indian Mesa are potentially ready for repowering, considering that they have reached the 20-year threshold. These older wind farms are compared with Sherbino I and II, which are in the middle age range, and with Santa Rita, one of the newest wind farms in Texas. These six wind farms contain 572 wind turbines, 20% of which were installed in 1999 and 40% in 2001, having reached the end of their optimal lifetime. Figure 15b indicates the average monthly power output for each wind farm. Data were obtained from ERCOT—IL report [43], geospatially joined with the USWTDB. Santa Rita, with only 20% of the wind turbines of this cluster, generates almost the same power output as the other five wind farms combined. South West Mesa, with almost 20% of the wind turbines in the group, generates less than 15% of the average monthly output from Santa Rita.
Table 1 indicates the average wind speeds for each wind farm at 50 and 100 m heights [42], alongside their configuration data. South West (SW) Mesa has almost the same number of wind turbines as Santa Rita, but its rotor diameter and hub height are nearly half, and the NPC is less than one third. However, SW Mesa has substantially better average wind speeds at both heights. Furthermore, Santa Rita, the newest wind farm, has the lowest wind speed average of all the options in the cluster. The best wind speeds are in the location of Sherbino I, which is 12 years old. This contributes to validate the initial assumption that older wind farms are occupying the best wind potential locations. Given its lower wind speed potential, it is notable that Santa Rita, containing only one third of the installed NPC of the cluster, generates almost the same power as the other wind farms combined (Figure 15b). An important factor contributing to greater power output is the hub height of Santa Rita, able to reach superior wind speeds as compared with the older wind farms in this group. Since the three original wind farms (installed during or before 2001) are able to access wind speeds of almost 9 m/s or higher at 100 m, it would be relevant to consider a total repowering option, with increased hub heights, capable of accessing wind speeds that are exceptionally rare in Texas.
With regards to the assessment of infrastructure accessibility for the wind farms under evaluation, Table 2 shows that the oldest wind farms have the shortest distance to transmission lines. The maximum distances from the three wind farms installed during or before 2001 are much shorter than the average separation for the three newer wind farms. Distance evaluation to the transportation infrastructure highlights a chronological increasing trend every year, with the exception of SW Mesa (the oldest) and Santa Rita (the newest). This is relevant as it reflects that the wind turbines in the oldest installation were much smaller and their transportation may not have been a consequential concern. However, for the newer wind farm, the turbines with large rotor diameters and hub heights would require better access to railways, which is reflected in the shorter distances among all locations in the considered hub. As SW Mesa repowering is evaluated, road transportation would require further analysis to ascertain if existing smaller roads or railways may be applied to deliver the large equipment for this project.
Wind farm assessment (task four of the proposed method) allows evaluation of individual farm repowering, initially assessing the suitability of wind speeds in neighboring areas. The wind assessment provides a better understanding of the direction and scope of the expansion of the facility to install larger wind turbines. Additionally, evaluating the winds at higher altitudes is important, considering the potential to install taller wind turbines, capable of accessing more favorable winds. Figure 16a overlays wind speeds at 50 m with SW Mesa, the oldest of the wind farms in this case study. The analysis clearly displays the potential to grow the wind farm, potentially occupying internal areas of the facility and extending the first north row in both the east and west direction. A large area located 7 km to the east of the wind farm offers possibilities to expand the wind farm in that direction or open a new interconnected section. Figure 16b presents wind speed availability at a 100 m height, further validating the possibility of installing taller wind farms in internal areas of the wind farm and expanding the length of the first north row. The large area to the east of the wind farm continues to provide meaningful growth opportunity for this installation.
A second case study further showcases the application of tasks three and four of the proposed methodology. In this case, five wind farms were evaluated, two about to reach 20 years of operation, one in the 14-year operational range and two recent facilities, as presented in Figure 17a. The cluster spatial proximity creates the potential to compare the performance of each facility. The three oldest wind farms in the group comprise almost 55% of all wind turbines, but less than 38% of all NPC. On the other hand, the newest wind farm (Amazon) has less than 28% of the wind turbines, almost 39% of the NPC and more than 70% of the average power output of all the other wind farms combined, as shown in Figure 17b. The two oldest installations, with 45% more wind turbines than the Amazon wind farm, generate only one third of the average power output of the newest facility. The analysis highlights the imbalance between older and newer installations, reinforcing the case for their potential total repowering.
Table 3 indicates that two of the wind farms in the north west Texas cluster will reach their end-of-life in two years, while Red Canyon will reach this milestone in five years. However, as other factors are explored, it becomes clearer that waiting for 20 years to repower wind farms may lead to missed opportunities. The oldest wind turbines have NPC which are 60% lower compared with the newer equipment, are 25% shorter and have almost half the size of the rotor diameter. Technology has advanced significantly since this first equipment was installed in this cluster, and now is unable to take full advantage of the prime wind speed areas on which they are installed. The three oldest wind farms have the best wind speed potential of the cluster at both heights. Furthermore, Brazos 1 reaches beyond 9 m/s wind speeds at 100 m, which is rare in Texas. These locations would benefit from taller and larger wind turbines, able to access the outstanding winds on these locations. This case study continues to reinforce the notion that the first installed wind farms, which are now older, occupy the best spots for wind energy generation.
The distance analysis to relevant infrastructure for the wind farm cluster in north west Texas, displayed in Table 4, indicates mixed results. The shortest distance to EHV transmission lines corresponds to the newest wind farms, with Brazos 2 and Red Canyon being the furthest away from this infrastructure. Interconnection lines to EHV will need to be evaluated for these older wind farms on their repowering CapEx, evaluating if new transmission lines are required. With the exception of Brazos 2, all the remaining wind farms in this case study are at close distances from transportation infrastructure, allowing for easier access of newer equipment when repowering activities are performed.
Wind farm assessment (task four of the proposed method) is presented in Figure 18. This second case study evaluates the potential repowering for the three oldest wind farms. The wind speeds at a 50 m height shown in Figure 18a highlight some potential growth to the southeast for Brazos 2 and to the south for Red Canyon. Brazos 1 has a significant area segment on the high 8–9 m/s wind speed range, making it very attractive for repowering. Wind speeds at a 100 m height, as highlighted in Figure 18b, open very consequential opportunities to expand these three wind farms. For both Brazos 2 and Wind Canyon, expansion opportunities arise to the south, with higher wind speeds that can be tapped by applying taller and more advanced wind turbines. For Brazos 1, the opportunities to repower are even more substantial, with a large area opening up to its northeast and creating a large nucleus inside the original area of wind speeds in the range of 9–10 m/s, which is scarce in Texas. Therefore, planning the expansion of these wind farms by applying the proposed methodology provides an insightful tool for stakeholders to maximize wind extraction in locations currently occupied by outdated equipment.

5. Conclusions

Building new wind farms in previously untapped locations or repowering existing wind farms are the two main options to achieve wind energy growth. Decisions on wind farm repowering, partial or total, are challenging considering the wide array of factors involved. This research developed a method to provide clarity to stakeholders on the appropriateness of wind farm repowering, caused by equipment obsolescence or its end of useful life (20 years).
The method evaluates diverse wind market areas to determine their degree of maturity. Maturity degree evaluation involves assessing and characterizing the wind turbine inventory based on the technological advanced capabilities, applying the most recent equipment as a benchmark. The method assesses the wind speed optimality of wind turbines based on age and morphology. Results identified locations in the United States with noteworthy levels of wind market maturity.
The proposed method compared wind farms in geospatial close proximity to ascertain its wind speed area optimality, equipment characteristics and power output. Results indicated that a substantial number of wind farms in Texas have reached their 20-year useful lifetime or are experiencing obsolescence levels before reaching this time limit. Furthermore, it was confirmed that the majority of older wind farms occupy the best wind speed locations, validating the first-come first-served assumption. Individual wind farm case studies showcased that older installations would significantly benefit from total repowering, having access to notable wind speeds and proximity to critical infrastructure, generating much higher power outputs. The case studies showcased the application of the proposed method in determining the potential for partial or total repowering.
The method developed in this research will help stakeholders to better evaluate diverse factors impacting wind farm repowering, both partial and total. Having a better understanding of the maturity level of wind markets and resource availability will help developers make decisions to continue growing wind energy. The tools integrated in this method can be used in diverse wind markets all over the world, incorporating data for wind speed availability, wind turbine inventory and power generation. The comparison of wind farms in geospatial close proximity to ascertain their wind speed area optimality, equipment characteristics and power output can also be performed for diverse locations, all over the world. This would be achieved by providing the required geospatial data to the method, which was designed with a plug-in approach, only requiring the input of data from diverse wind markets to ascertain the potential for repower in each location. Future research will incorporate financial and economic decision parameters into the model, aiding stakeholders to achieve a more complete panorama on wind farm continuous development.

Funding

This research was funded by the College of Business Administration 2021–2022 Summer Research Grant at Texas A&M University, Kingsville.

Institutional Review Board Statement

Not applicable.

Informed Consent Statement

Not applicable.

Data Availability Statement

Not applicable.

Acknowledgments

I would like to gratefully acknowledge the support of the College of Business Administration at Texas A&M University, Kingsville.

Conflicts of Interest

The author declares no conflict of interest.

Abbreviations

CapExCapital Expenditure
CFCapacity factor
CREZsCompetitive Renewable Energy Zones
EHVExtra-high-voltage transmission lines
ERCOTElectric Reliability Council of Texas
NPCName Plate Capacity
USWTDBU.S. Wind Turbine Database
WRFWeather Research and Forecasting

References

  1. Traber, T.; Hegner, F.S.; Fell, H.J. An Economically Viable 100% Renewable Energy System for All Energy Sectors of Germany in 2030. Energies 2021, 14, 5230. [Google Scholar] [CrossRef]
  2. IPCC-United Nations Intergovernmental Panel on Climate Change. Sixth Assessment Report. 2021. Available online: https://www.ipcc.ch/report/ar6/wg1/#SPM (accessed on 10 September 2021).
  3. EIA-US Energy Information Administration. Electricity Generation from Wind. 17 March 2021. Available online: https://www.eia.gov/energyexplained/wind/electricity-generation-from-wind.php (accessed on 10 September 2021).
  4. DE—U.S. Department of Energy. WindVision: A New Era for Wind Power in the United States. U.S. Department of Energy. Office of Scientific and Technical Information. DOE/GO-102015-4557—April 2015. Available online: https://www.energy.gov/sites/prod/ files/WindVision_Report_final.pdf (accessed on 22 September 2021).
  5. Masson-Delmonte, V.; Zhai, P.; Pirani, A.; Connors, S.; Péan, C.; Berger, S.; Gomis, M.; Arias, P.; Bellouin, N.; Coppola, E.; et al. Climate Change 2021: The Physical Science Basis: Contribution of Working Group I to the Sixth Assessment Report of the Intergovernmental Panel on Climate Change; IPCC: Geneva, Switzerland, 2021.
  6. Mai, T.T.; Lantz, E.J.; Mowers, M.; Wiser, R. The Value of Wind Technology Innovation: Implications for the US Power System, Wind Industry, Electricity Consumers, and Environment (No. NREL/TP-6A20-70032); National Renewable Energy Lab. (NREL): Golden, CO, USA, 2017.
  7. Lacal-Arántegui, R.; Uihlein, A.; Yusta, J.M. Technology effects in repowering wind turbines. Wind Energy 2020, 23, 660–675. [Google Scholar] [CrossRef]
  8. Chaurasiya, P.K.; Warudkar, V.; Ahmed, S. Wind energy development and policy in India: A review. Energy Strategy Rev. 2019, 24, 342–357. [Google Scholar] [CrossRef]
  9. Del Río, P.; Silvosa, A.C.; Gómez, G.I. Policies and design elements for the repowering of wind farms: A qualitative analysis of different options. Energy Policy 2011, 39, 1897–1908. [Google Scholar] [CrossRef]
  10. Colmenar-Santos, A.; Campíñez-Romero, S.; Pérez-Molina, C.; Mur-Pérez, F. Repowering: An actual possibility for wind energy in Spain in a new scenario without feed-in-tariffs. Renew. Sustain. Energy Rev. 2015, 41, 319–337. [Google Scholar] [CrossRef]
  11. Hughes, G. The performance of wind farms in the United Kingdom and Denmark. Renew. Energy Found. 2012, 48. [Google Scholar]
  12. Staffell, I.; Green, R. How does wind farm performance decline with age? Renew. Energy 2014, 66, 775–786. [Google Scholar] [CrossRef] [Green Version]
  13. Ziegler, L.; Gonzalez, E.; Rubert, T.; Smolka, U.; Melero, J.J. Lifetime extension of onshore wind turbines: A review covering Germany, Spain, Denmark, and the UK. Renew. Sustain. Energy Rev. 2018, 82, 1261–1271. [Google Scholar] [CrossRef] [Green Version]
  14. Mollasalehi, E.; Wood, D.; Sun, Q. Indicative fault diagnosis of wind turbine generator bearings using tower sound and vibration. Energies 2017, 10, 1853. [Google Scholar] [CrossRef] [Green Version]
  15. Baheta, A.T.; Leong, K.P.; Sulaiman, S.A.; Fentaye, A.D. CFD analysis of fouling effects on aerodynamics performance of turbine blades. In Rotating Machineries; Springer: Singapore, 2019; pp. 73–84. [Google Scholar]
  16. Han, W.; Kim, J.; Kim, B. Effects of contamination and erosion at the leading edge of blade tip airfoils on the annual energy production of wind turbines. Renew. Energy 2018, 115, 817–823. [Google Scholar] [CrossRef]
  17. Katsaprakakis, D.A.; Papadakis, N.; Ntintakis, I. A Comprehensive Analysis of Wind Turbine Blade Damage. Energies 2021, 14, 5974. [Google Scholar] [CrossRef]
  18. Olauson, J.; Edström, P.; Rydén, J. Wind turbine performance decline in Sweden. Wind Energy 2017, 20, 2049–2053. [Google Scholar] [CrossRef]
  19. De Mello, E.; Kampolis, G.; Hart, E.; Hickey, D.; Dinwoodie, I.; Carroll, J.; Dwyer-Joyce, R.; Boateng, A. Data driven case study of a wind turbine main-bearing failure. J. Phys. Conf. Ser. 2021, 2018, 012011. [Google Scholar] [CrossRef]
  20. Silvosa, A.C.; Gómez, G.I.; Río, P.D. Analyzing the techno-economic determinants for the repowering of wind farms. Eng. Econ. 2013, 58, 282–303. [Google Scholar] [CrossRef]
  21. Tang, T. Explaining technological change in the US wind industry: Energy policies, technological learning, and collaboration. Energy Policy 2018, 120, 197–212. [Google Scholar] [CrossRef]
  22. Kaldellis, J.K.; Apostolou, D. Life cycle energy and carbon footprint of offshore wind energy. Comparison with onshore counterpart. Renew. Energy 2017, 108, 72–84. [Google Scholar] [CrossRef]
  23. Ramírez, F.J.; Honrubia-Escribano, A.; Gómez-Lázaro, E.; Pham, D.T. The role of wind energy production in addressing the European renewable energy targets: The case of Spain. J. Clean. Prod. 2018, 196, 1198–1212. [Google Scholar] [CrossRef]
  24. Arvesen, A.; Hertwich, E.G. Assessing the life cycle environmental impacts of wind power: A review of present knowledge and research needs. Renew. Sustain. Energy Rev. 2012, 16, 5994–6006. [Google Scholar] [CrossRef] [Green Version]
  25. Madlener, R.; Glensk, B.; Gläsel, L. Optimal Timing of Onshore Wind Repowering in Germany under Policy Regime Changes: A Real Options Analysis. Energies 2019, 12, 4703. [Google Scholar] [CrossRef] [Green Version]
  26. Abraham, J. Wind Energy Is a Key Climate Change Solution. The Guardian. 10 December 2015. Available online: https://www.theguardian.com/environment/climate-consensus-97-per-cent/2015/dec/10/wind-energy-is-a-key-climate-change-solution (accessed on 22 September 2021).
  27. Villena-Ruiz, R.; Ramirez, F.J.; Honrubia-Escribano, A.; Gómez-Lázaro, E. A techno-economic analysis of a real wind farm repowering experience: The Malpica case. Energy Convers. Manag. 2018, 172, 182–199. [Google Scholar] [CrossRef]
  28. Oroschakoff, K. Small Old Wind Towers Make for Big New Problems. EU Politico. 23 December 2018. Available online: https://www.politico.eu/article/small-old-wind-towers-make-for-big-new-problems/ (accessed on 14 February 2020).
  29. Serri, L.; Lembo, E.; Airoldi, D.; Gelli, C.; Beccarello, M. Wind energy plants repowering potential in Italy: Technical-economic assessment. Renew. Energy 2018, 115, 382–390. [Google Scholar] [CrossRef]
  30. Haces-Fernandez, F. GoWInD: Wind Energy Spatiotemporal Assessment and Characterization of End-of-Life Activities. Energies 2020, 13, 6015. [Google Scholar] [CrossRef]
  31. Piel, J.H.; Stetter, C.; Heumann, M.; Westbomke, M.; Breitner, M.H. Lifetime Extension, Repowering or Decommissioning? Decision Support for Operators of Ageing Wind Turbines. J. Phys. Conf. Ser. 2019, 1222, 012033. [Google Scholar] [CrossRef]
  32. Enevoldsen, P.; Valentine, S.V. Do onshore and offshore wind farm development patterns differ? Energy Sustain. Dev. 2016, 35, 41–51. [Google Scholar] [CrossRef]
  33. German Wind Power Blown off Course. Deutsche Welle. 21 November 2019. Available online: https://www.dw.com/en/ german-wind-power-blown-off-course/a-51341340 (accessed on 18 February 2020).
  34. Weiss, T. Wind Power Project Development: Financial Viability of Repowering with RETScreen as a Decision Aid Tool. Ph.D. Thesis, Department of Earth Sciences, Uppsala University, Uppsala, Sweden, 2015. [Google Scholar]
  35. Lantz, E.; Leventhal, M.; Baring-Gould, I. Wind Power Project Repowering: Financial Feasibility, Decision Drivers, and Supply Chain Effects (No. NREL/TP-6A20-60535); National Renewable Energy Lab. (NREL): Golden, CO, USA, 2013.
  36. De Bona, J.C.; Ferreira, J.C.E.; Duran, J.F.O. Analysis of scenarios for repowering wind farms in Brazil. Renew. Sustain. Energy Rev. 2021, 135, 110197. [Google Scholar] [CrossRef]
  37. Krah, K.; Callahan, M.; Elsworth, J. Catalina Repower Feasibility Study: NREL Phases I & II Summary Report (No. NREL/TP-7A40-76779); National Renewable Energy Lab. (NREL): Golden, CO, USA, 2020.
  38. Sovacool, B.K. A qualitative factor analysis of renewable energy and Sustainable Energy for All (SE4ALL) in the Asia-Pacific. Energy Policy 2013, 59, 393–403. [Google Scholar] [CrossRef]
  39. Hoen, B.D.; Diffendorfer, J.E.; Rand, J.T.; Kramer, L.A.; Garrity, C.P.; Hunt, H.E. United States Wind Turbine Database; USWTDB V2.3; U.S. Geological Survey: Reston, VA, USA; American Wind Energy Association: Washington, DC, USA; Lawrence Berkeley National Laboratory: Berkeley, CA, USA, 2020.
  40. USWTDB. The U.S. Wind Turbine Database. About the Database. 2021. Available online: https://eerscmap.usgs.gov/uswtdb/ (accessed on 11 November 2021).
  41. Haces-Fernandez, F.H.; Martinez, A.; Camacho, L.; Ramirez, D.; Su, H.; Li, H. GIS based tool for analyzing US wind farms development. In IIE Annual Conference. Proceedings; Institute of Industrial and Systems Engineers (IISE): Peachtree Corners, GA, USA, 2017; pp. 109–114. [Google Scholar]
  42. DTU—Technical University of Denmark. Global Wind Atlas 3.0. Technical University of Denmark (DTU) Released in Partnership with the World Bank Group, Utilizing Data Provided by Vortex. Database in the Form of Raster; DTU: Lyngby, Denmark, 2020. [Google Scholar]
  43. Rojowsky, K.; Gothandaraman, A.; Beaucage, P. Hourly Wind and Solar Generation Profiles (1980–2019); Database, UL—AWS Truepower, LLC Ref. No.: 19-08-027944; Electric Reliability Council of Texas (Ercot): Austin, TX, USA, 2020. [Google Scholar]
  44. USCB—US Census Bureau. Centers of Population. 2010. Available online: https://www.census.gov/geographies/reference-files/time-series/geo/centers-population.html (accessed on 23 September 2021).
  45. Malewitz, J. $7 Billion Wind Power Project Nears Finish. The Texas Tribune. 14 October 2021. Available online: https://www.texastribune.org/2013/10/14/7-billion-crez-project-nears-finish-aiding-wind-po/ (accessed on 23 September 2021).
  46. Lee, N.; Flores-Espino, F.; Hurlbut, D.J. Renewable Energy Zone (REZ) Transmission Planning Process: A Guidebook for Practitioners (No. NREL/TP-7A40-69043); National Renewable Energy Lab. (NREL): Golden, CO, USA, 2017.
  47. HIFLD—Homeland Infrastructure Foundation Level Data. Electric Power Transmission Lines; Shapefile; HIFLD: Washington, DC, USA, 2019. [Google Scholar]
  48. BTS—Bureau of Transportation Statistics. North American Rail Lines. 2020. Available online: https://data-usdot.opendata.arcgis.com/datasets/north-american-rail-lines (accessed on 12 March 2020).
  49. FRA—Federal Railroad Administration. Maps—Geographic Information System; US Department of Transportation: Washington, DC, USA, 2020.
  50. TxDOT—Texas Department of Transportation. Roadway Inventory on System; Shapefile; Transportation Planning and Programming Division, Data Management Section: Austin, TX, USA, 2020.
  51. Enevoldsen, P.; Xydis, G. Examining the trends of 35 years growth of key wind turbine components. Energy Sustain. Dev. 2019, 50, 18–26. [Google Scholar] [CrossRef]
  52. Van Haaren, R.; Fthenakis, V. GIS-based wind farm site selection using spatial multi-criteria analysis (SMCA): Evaluating the case for New York State. Renew. Sustain. Energy Rev. 2011, 15, 3332–3340. [Google Scholar] [CrossRef]
Figure 1. Repowering assessment method for mature market application.
Energies 14 07716 g001
Figure 2. Wind speeds classified by quartiles in the continental U.S. at a 100 m height overlaid with wind turbines from the USWTDB.
Energies 14 07716 g002
Figure 3. (a) Wind turbines in Texas database with power lines. (b) Highways and railways database.
Energies 14 07716 g003
Figure 4. Wind turbines in 12 states that contain more than 80% of installed wind capacity in the U.S. (a) Number of wind turbines, including 2058 wind turbines with no NPC data in California. (b) Total installed capacity (GW).
Energies 14 07716 g004
Figure 5. Evaluation of the average wind speed (m/s) at a 50 m height from the Global Wind Atlas 3.0 for each wind turbine per state: (a) number of wind turbines and (b) total installed capacity (NPC).
Energies 14 07716 g005
Figure 6. Assessment of (a) hub height of wind turbines by state and (b) diameter of wind turbines by state.
Energies 14 07716 g006
Figure 7. Average rotor diameter (meters) and average hub height (meters) through time in (a) the United States, (b) Texas and (c) California.
Energies 14 07716 g007
Figure 8. Area classification according to average wind speed ranges for five states with the highest wind energy installed capacity (a) at 50 m height and at (b) 100 m height.
Energies 14 07716 g008
Figure 9. Wind speed distribution per area and height according to the Global Wind Atlas 3.0 for (a) Texas and (b) California.
Energies 14 07716 g009
Figure 10. Trends of new wind turbines in Texas per wind speed area (m/s) at a height of 50 m: (a) percentage installed wind turbines and (b) as trend of the change in wind speed area.
Energies 14 07716 g010
Figure 11. Wind speed corresponding to the location of wind turbines installed in Texas over the last two decades at 50 and 100 m height: (a) Stacked area, (b) box plot at 50 m height and (c) box plot at 100 m height.
Energies 14 07716 g011
Figure 12. Distance change over time for Texas wind turbines to closest infrastructure. (a) Maximum and average distance of wind turbine to closest EHV. (b) Maximum and average distance of wind turbine to closest railways.
Energies 14 07716 g012
Figure 13. Distance from wind turbines in Texas to closest major highways over time. (a) Number of wind turbines. (b) Maximum and average distance from wind turbines.
Energies 14 07716 g013
Figure 14. Power output from ERCOT’s Hourly Wind Generation Profiles according to installation year. (a) Individual wind turbines’ average performance. (b) Yearly average capacity factor for wind farms.
Energies 14 07716 g014
Figure 15. Six wind farms in central west Texas in close proximity to each other. (a) Map showing the configuration of the wind farms. (b) Monthly average power output in 1980–2018.
Energies 14 07716 g015
Figure 16. Evaluation of total repowering and size growth for the South West Mesa wind farm overlaid with wind speed vector at (a) 50 m height and (b) 100 m height.
Energies 14 07716 g016
Figure 17. Six wind farms in north west Texas in close proximity to each other. (a) Map showing the configuration of the wind farms. (b) Monthly average power output in 1980–2018.
Energies 14 07716 g017
Figure 18. Evaluation of total repowering and size growth for wind farms in this case study, overlaid with wind speed vector at (a) 50 m height and (b) 100 m height.
Energies 14 07716 g018
Table 1. Data from the evaluated cluster of six wind farms in central west Texas.
NameYearNo. of TurbinesCap (MW)Diameter (m)Hub Height (m)Wind Speed (m/s)Wind Speed (m/s)
50 m100 m
SW Mesa199911480.248508.0128.939
Desert Sky200110514370.5658.2319.253
Indian Mesa200112582.547508.3089.422
Sherbino I20085015090808.7969.925
Sherbino II20115814596808.0969.325
Santa Rita2018120300116907.2088.496
Table 2. Distance to infrastructure from a group of wind farms in central west Texas.
NameTransmission Line Distance (km)Highway Distance (km)Railway Distance (km)
AvgMaxMinAvgMaxMinAvgMaxMin
SW Mesa8.710.26.88.611.36.28.611.36.1
Desert Sky7.99.25.33.05.51.224.227.620.9
Indian Mesa3.14.90.75.47.43.220.722.617.9
Sherbino I18.821.716.18.19.76.028.930.627.0
Sherbino II30.734.026.310.312.27.930.333.027.5
Santa Rita24.531.718.84.68.40.34.499.740.3
Table 3. Data from the evaluated cluster of five wind farms in north west Texas.
NameYearNo. of TurbinesCap (MW)Diameter (m)Hub Height (m)Wind Speed (m/s)Wind Speed (m/s)
50 m100 m
Brazos 12003999961.4697.8149.067
Brazos 22003616161.4607.6358.694
Red Canyon2006568477807.7688.817
Fluvanna I201774155.4114807.1488.456
Amazon2017110253116807.2828.573
Table 4. Distance to infrastructure from the wind farm cluster in north west Texas.
NameTransmission Line Distance (km)Highway Distance (km)Railway Distance (km)
AvgMaxMinAvgMaxMinAvgMaxMin
Brazos 111.816.07.73.56.80.93.46.70.9
Brazos 227.731.114.314.517.44.914.517.64.8
Red Canyon20.325.516.37.611.74.47.511.64.2
Fluvanna I9.915.33.95.611.30.45.611.30.3
Amazon2.04.50.24.59.30.44.69.40.5
Publisher’s Note: MDPI stays neutral with regard to jurisdictional claims in published maps and institutional affiliations.

