Abstract
This article presents laboratory and spatial numerical modeling of cemented paste backfill. The first part of the research concerned laboratory tests of a mixture of sand, water, and variable cement content (5%, 10%, and 15%). The density and curing time of the mixture were determined. Moreover, cylindrical samples with a diameter of 46 mm and a height of 92 mm were constructed, for which compressive and tensile strength were calculated after one, two, three, and four weeks. The second part of the research concerned 3D numerical modeling with the use of RS3 software. For the exploitation field with dimensions of 65 m × 65 m, a strip-mining method was designed. The main objective of the research was to determine the changes in displacements around the haulage room and transportation roadway located in the immediate vicinity of the exploitation field. For the first time in numerical modeling, a two-sided strip method was used for the four stages of mining the ore deposit where the post-mining space was filled with a cemented paste backfill. Based on this research, the compressibility coefficient was determined.
1. Introduction
The increasing demand for metals in the energy, construction, automotive, and telecommunications industries causes a systematic increase in the extraction of useful minerals [1]. With the increase in extraction, the resources of raw materials decrease, which contributes to the design of more efficient mining methods, often in difficult conditions, taking into account the protection of both underground mine excavations [2] as well as surface objects [3]. The source of a significant reduction in the efficiency of individual mining methods and an increase in outlays for possible secondary exploitation of the deposit is the remaining balance of resources in a deposit, in particular in the inter-room pillars [4]. One of the ways to improve the economic indicators of exploitation is the use of systems with hardened backfill, which enables the implementation of many complex geological and mining problems in the underground mining of mineral deposits. The most important advantages of cemented paste backfill include the exploitation of the deposit by open-pit and underground methods at the same time [5]. Due to the exploitation of deposits prone to spontaneous combustion, filling a selected space with cemented paste backfill creates favorable conditions because the hardened filling provides good isolation of the goafs and their access to fresh air, which prevents the formation of favorable conditions for the formation of endogenous fires [6]. Additionally, various types of backfills are used in the rock mass, which is prone to the release of seismic energy in the form of tremors and rock bursts [7]. For shallow deposits, the hardened backfill protects against surface subsidence, preventing the loosening of overlying layers, which is of great importance in creating safe operating conditions, especially under water reservoirs, important objects of ground infrastructure [8]. In the case of the mining of thick deposits divided into horizontal layers, the hardened filling serves as a floor on which self-propelled mining machines move [9]. To improve the strength properties of the hardened backfill, metakaolin and silica fume can be added, the increased effect of which is noticeable after both 7 and 28 days [10].
The solid mass of the hardened backfill can absorb significant pressure and prevent deformation of the surrounding rocks, thus enabling the excavation to be secured with a rock bolt support [11], and the subsequent operation of adjacent blocks [12]. Underground mining methods with the use of backfills are often used to reduce the negative impact of mining on the surface [13]. Feng et al. [14] proposed strip mining with paste backfilling for the continuous mining face. Currently, the possibility of using hardened backfill in mining excavations is very often modeled using numerical methods based on: finite difference and the distinct element method. Hai et al. [15] modeled the stability of coal pillar and roof movement for four stages of exploitation using FLAC 3D software. Shao et al. [16] analyzed stress evolution in the three stages of the backfilling process for strip-mining methods in a hard coal mine. Gang et al. [17] presented a 3D discontinuum numerical model with application of 3DEC software in order to model the backfilling sequence for an iron mine in China.
The behavior of the rock mass after excavation and filling it with cemented paste backfill is still not fully understood due to the variable depth of exploitation as well as the strength, deformation, and structural conditions of individual rock layers. Therefore, this article presents strength tests of the backfill mixture consisting of water and sand, and the addition of cement in the amounts of 5%, 10%, and 15% by volume. The test results were used in spatial numerical modeling with the use of RS3 software based on the finite element method. In the numerical model tests, for the first time, a two-sided strip-mining method was designed, in which total displacement was determined for the four stages of mining the deposit by filling the post-mining space with a cemented paste backfill, for which the compressibility index was determined. In conclusion, it was found that the replacement of inter-strip pillars with a cemented paste backfill was beneficial from the point of view of the compressibility and contributed to a reduction in operational losses.
2. Laboratory Tests of the Cemented Paste Backfill
Laboratory tests were carried out in the backfill materials laboratory of the Department of Mining Engineering and Work Safety at the AGH University of Science and Technology in Krakow, Poland. The backfill mixture consisted of sand with a grain size of up to 2 mm, water, and cement. The sand used was mainly composed of SiO2 (97.6%), Al2O3 (2.26%), and Fe2O3 (0.14%). Variable 42.5R cement content of 5%, 10%, and 15% was added to the mixture. The individual components of the backfill mixture were mixed in a volume ratio. First, 500 cm3 of sand was poured into the measuring cylinder (Figure 1a) with a volume of 1000 cm3, then cement was added in the amounts of 50 cm3, 100 cm3, and 150 cm3, respectively. The remaining volume was water in the appropriate amounts of 450 cm3 (Figure 1b), 400 cm3 (Figure 1c), and 350 cm3 (Figure 1d). The tests were performed after one, two, three, and four weeks from the moment of preparing the cemented paste mixture. The main aim of the tests was to determine: bulk density, curing time, and compressive and tensile strength for the cemented mixture samples. In the first stage of the laboratory tests, the bulk density was determined. After the cemented paste backfill mixture was prepared with the appropriate cement contents of 5%, 10%, or 15%, it was placed in a measuring cylinder. The sample was then deaerated using a laboratory shaker and weighed on a laboratory balance with an accuracy of 0.1 g. The tests were carried out in accordance with the Polish standard [18]. The bulk density results are shown in Figure 2.
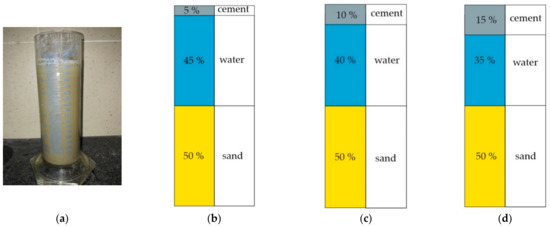
Figure 1.
The proportion of the components of the backfill mixture: (a) general view of measuring cylinder; (b) 5% cement; (c) 10% cement; (d) 15% cement.
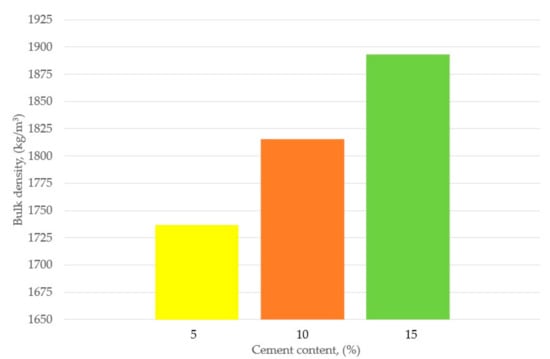
Figure 2.
Summary of bulk density results.
The volume of the excavation to be filled determines the composition of the individual components of the mixture. Chu [19] calculated the compacting factor for paste mixtures with different cement contents and found that the mortar film thickness decreased as the paste volume decreased. In research carried out at AGH, it was found that the volume of the cemented paste backfill after mixing the ingredients in a glass cylinder with a capacity of 1000 cm3 for 5%, 10%, and 15% of cement addition was 970 cm3, 930 cm3, and 860 cm3, respectively. In terms of mining technology, the excavation filling factor is important, expressing the amount of material supplied to the volume of the strip, which can be confirmed by in situ tests and certain numerical assumptions.
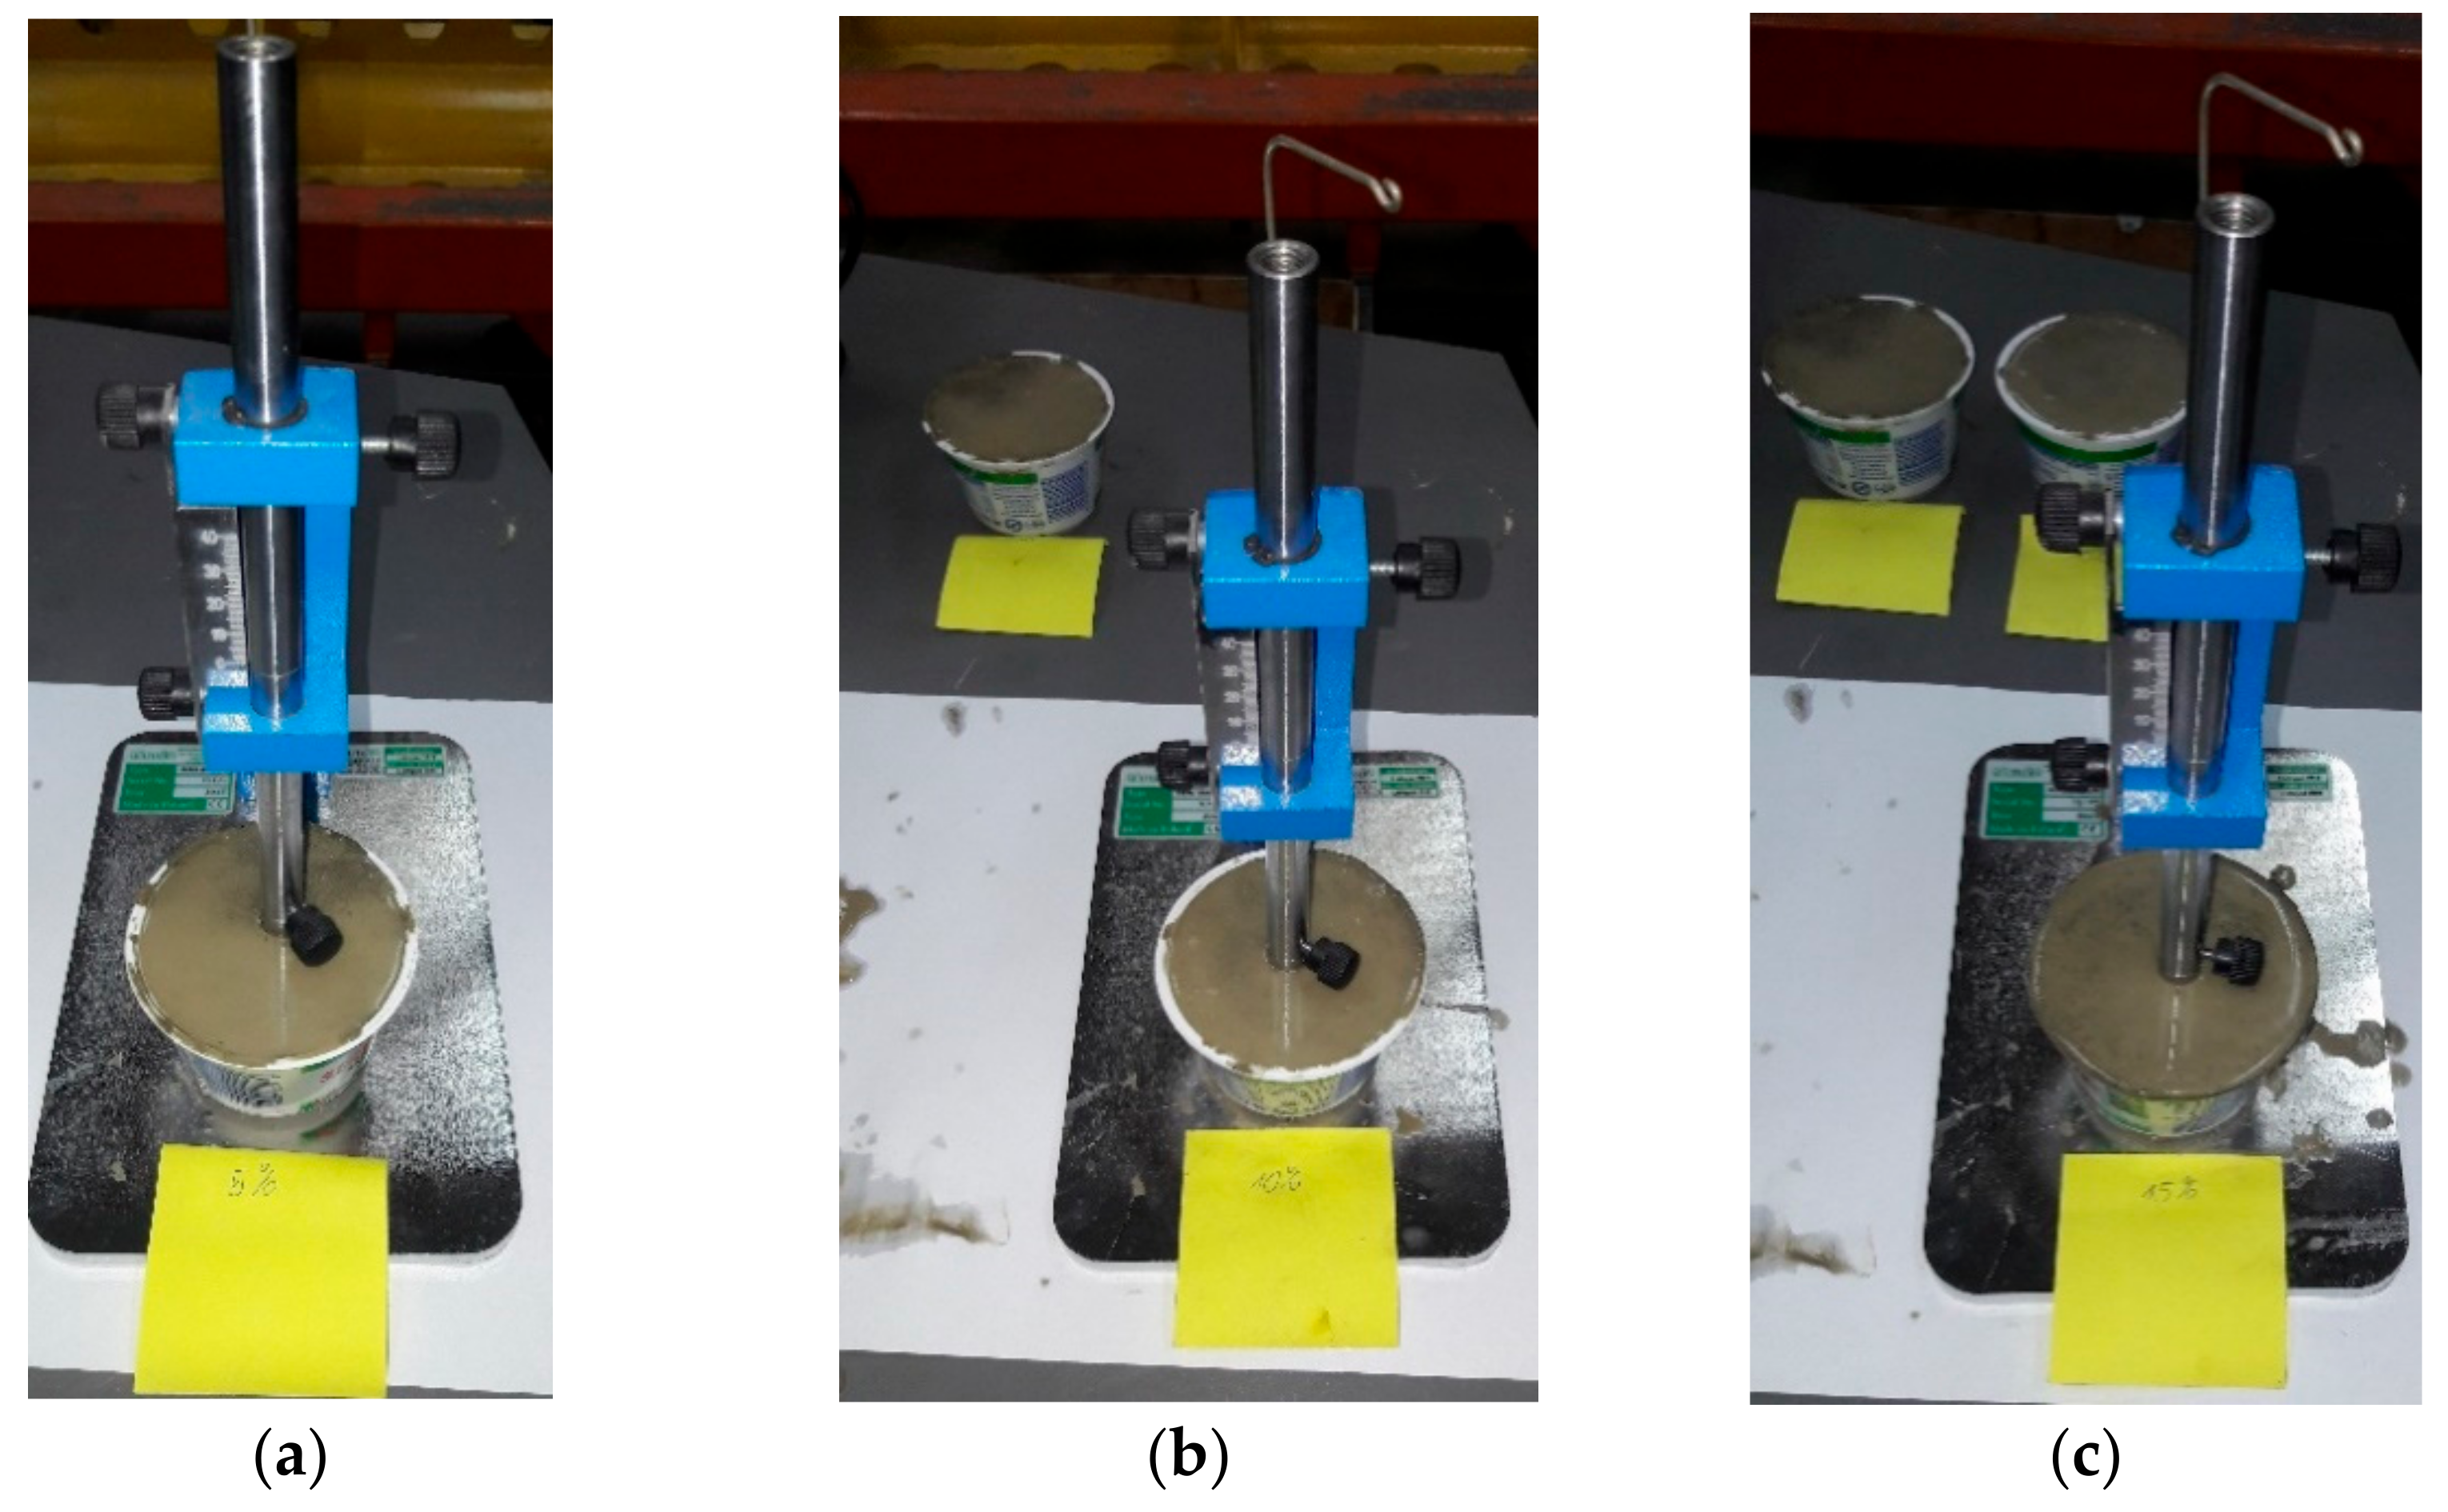
In the tests, the curing time of the cemented paste mixture was determined, which was carried out in accordance with the standard [20] using the Vicat apparatus (Figure 3a–c). In the tests, a measurement of the penetration depth of a steel needle with a diameter of 1 mm was taken under a specific weight of the moving part of the apparatus. The tests were completed when the steel needle was submerged to a depth of less than 3 mm (Figure 4).
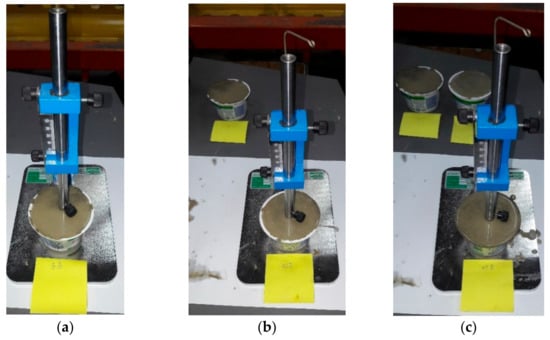
Figure 3.
Determination of the curing time of the backfill mixture with the cement content: (a) 5%; (b) 10%; (c) 15%.
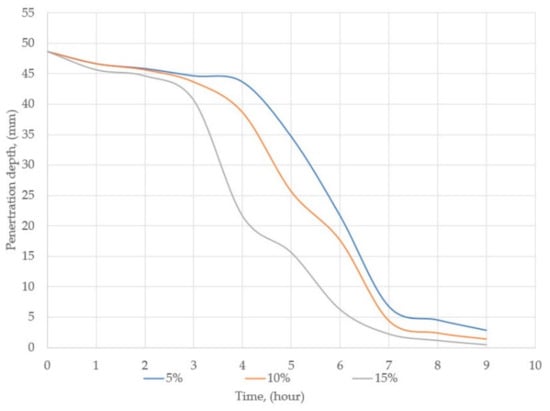
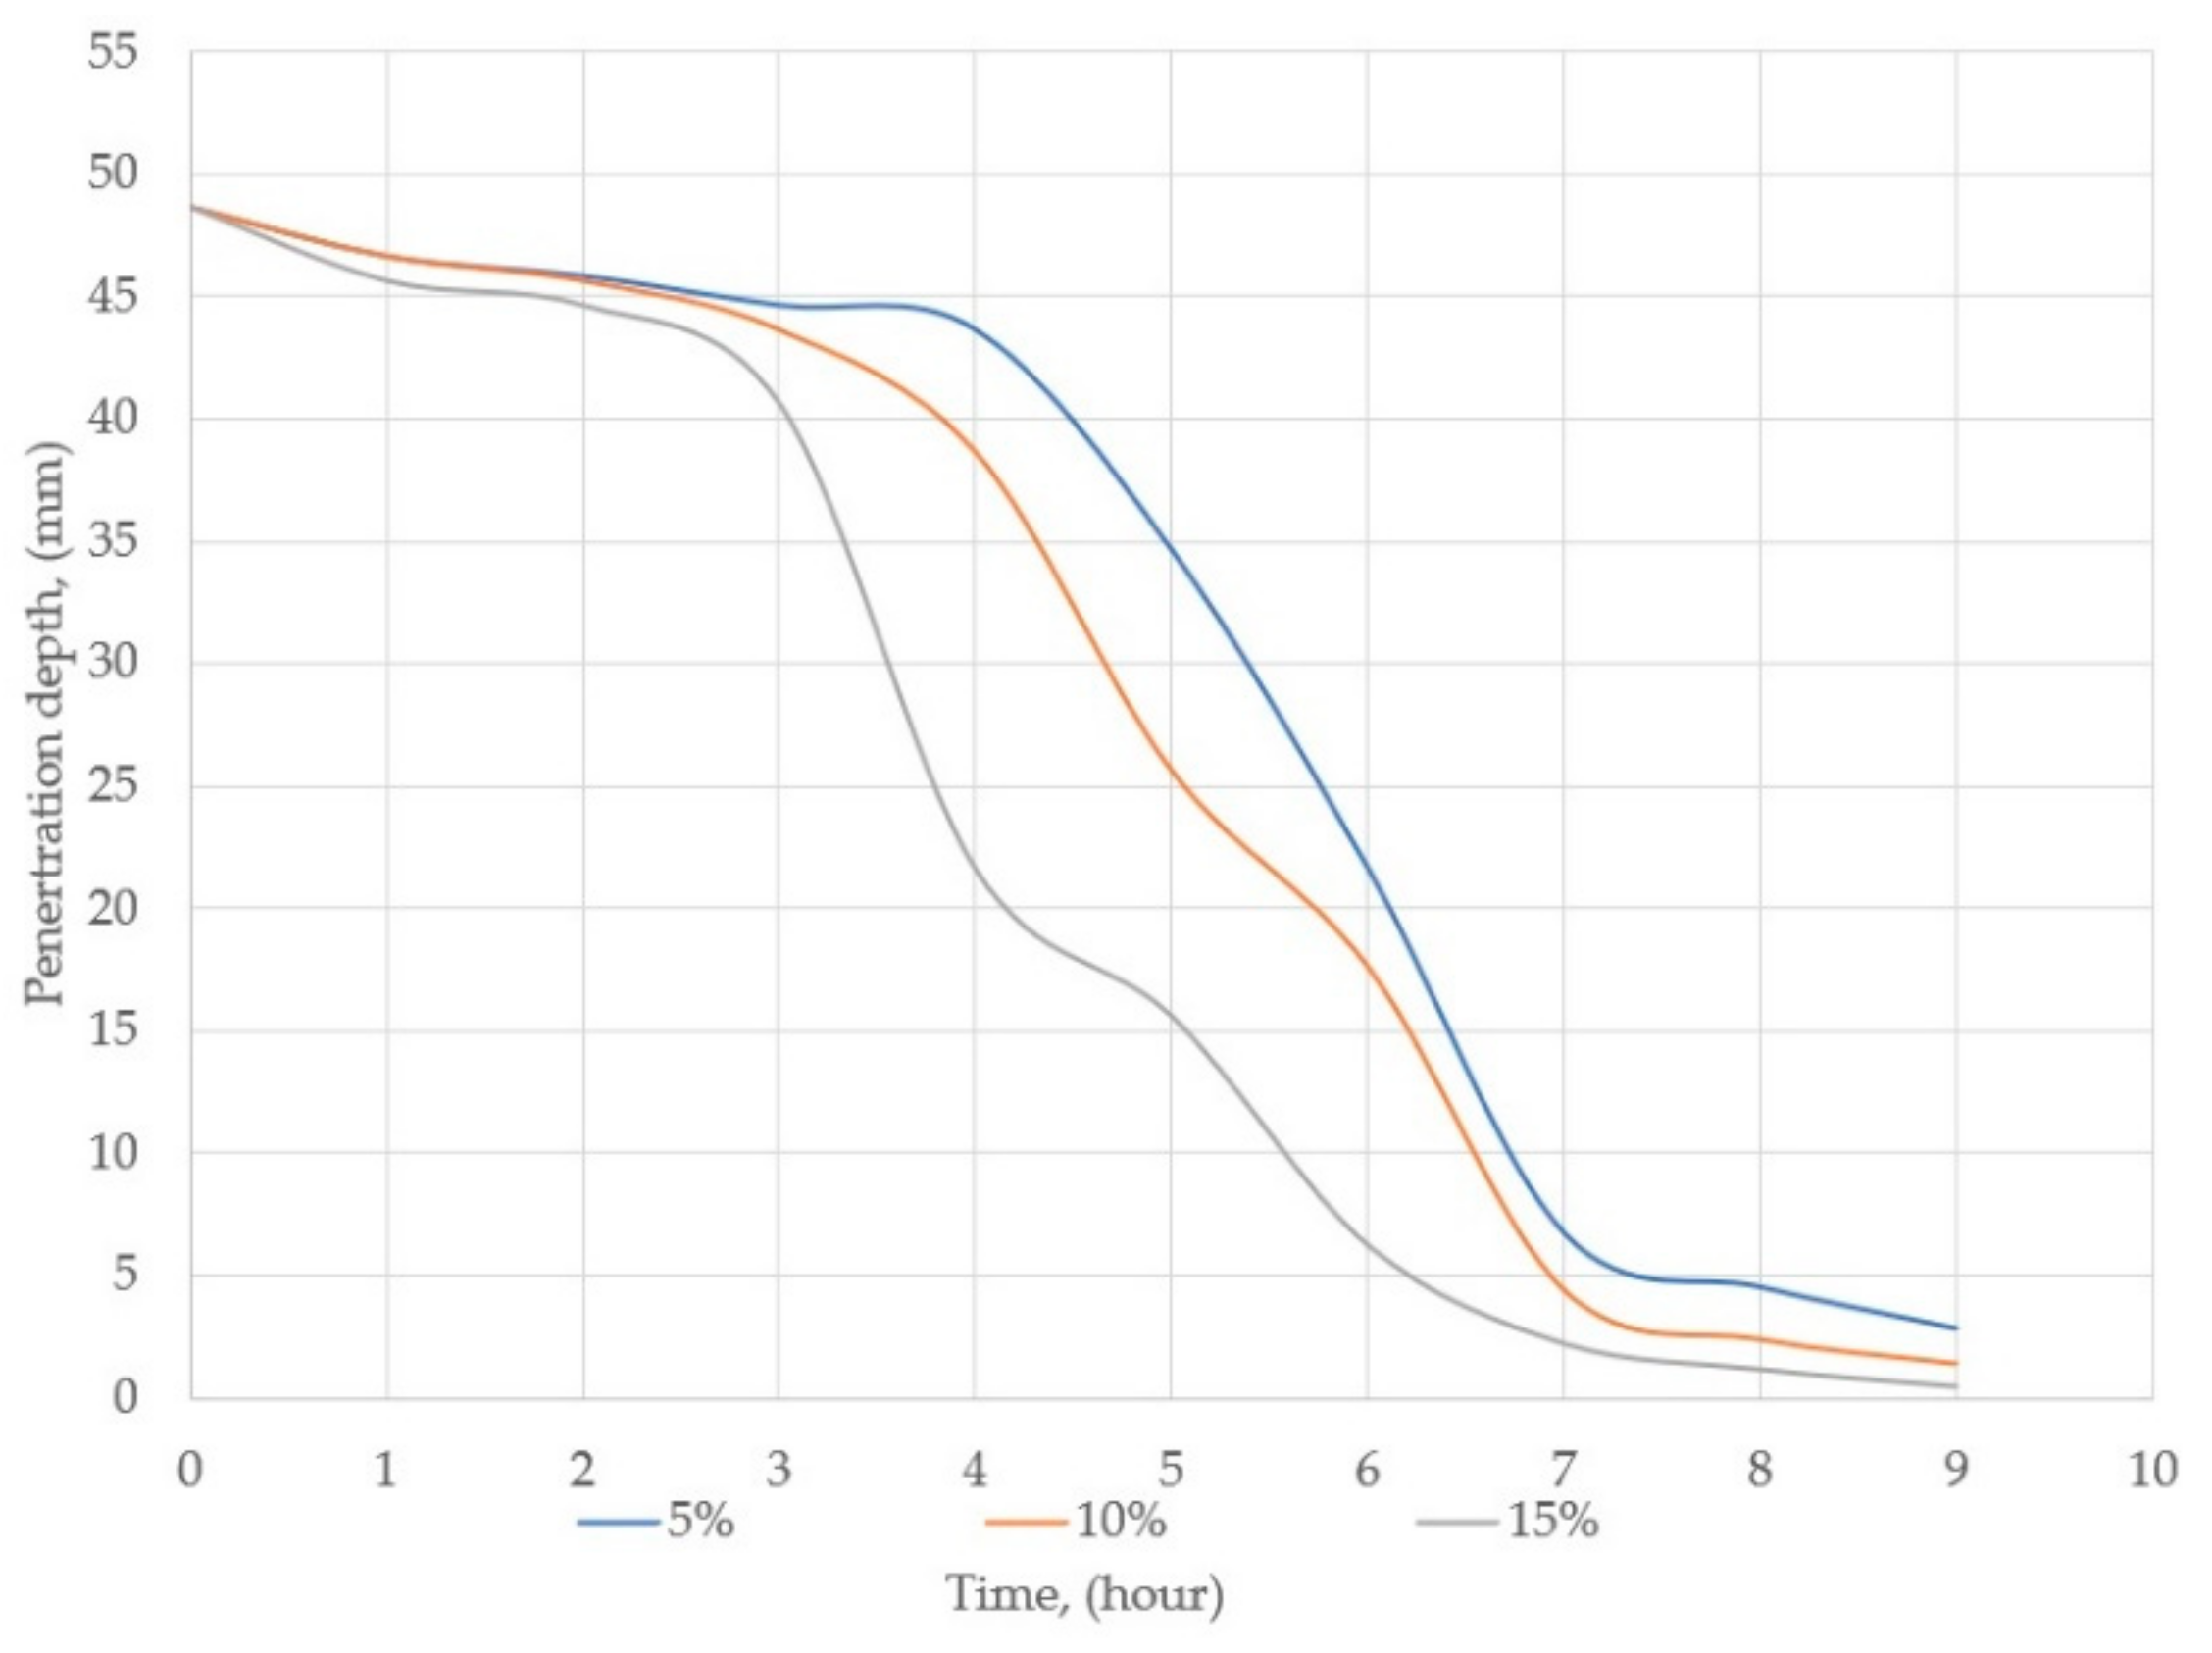
Figure 4.
Curing time results for the backfill mixtures, each with a different cement content.
In order to determine the uniaxial compression and tensile strength using the Brazilian test, cylinders made of plastic (polyvinyl chloride) were used, which were cut into equal lengths of 92 mm. The internal diameter of the cylinders was 46 mm. The cemented backfill mixture was poured into the prepared cylinders (Figure 5). Then, after a period of one, two, three, and four weeks, the samples were removed from the cylinders and tested on a hydraulic press, which was equipped with three strain gauge force sensors and one cable encoder by means of which the displacement was determined. The sensors were connected to the measuring amplifier, which in turn was connected to the computer via an ethernet cable, where the load-displacement characteristics were monitored on an ongoing basis. The sampling rate was set to 100 Hz and the load rate was 0.1 kN/s. The compressive strength was defined as the ratio of the maximum force to the cross-sectional area of the sample (Figure 6a). However, the tensile strength was determined by the indirect method (Brazilian test) (Figure 6b). The failure modes and planes of the cemented paste samples were characterized by a main shear crack and a small number of secondary tensile cracks. The test results are shown in Figure 7a–c and Figure 8a–c and in Table 1. Because the length of the sample was twice as large as its diameter, the following Equation (1) was used to calculate the tensile strength [21]:
where
- Ts—tensile strength, (MPa);
- k—ratio of length to diameter;
- P—maximum load, (N);
- d—diameter, (mm);
- t—length (mm).

Figure 5.
Regular samples filled with a backfill mixture with different cement contents.
Figure 5.
Regular samples filled with a backfill mixture with different cement contents.
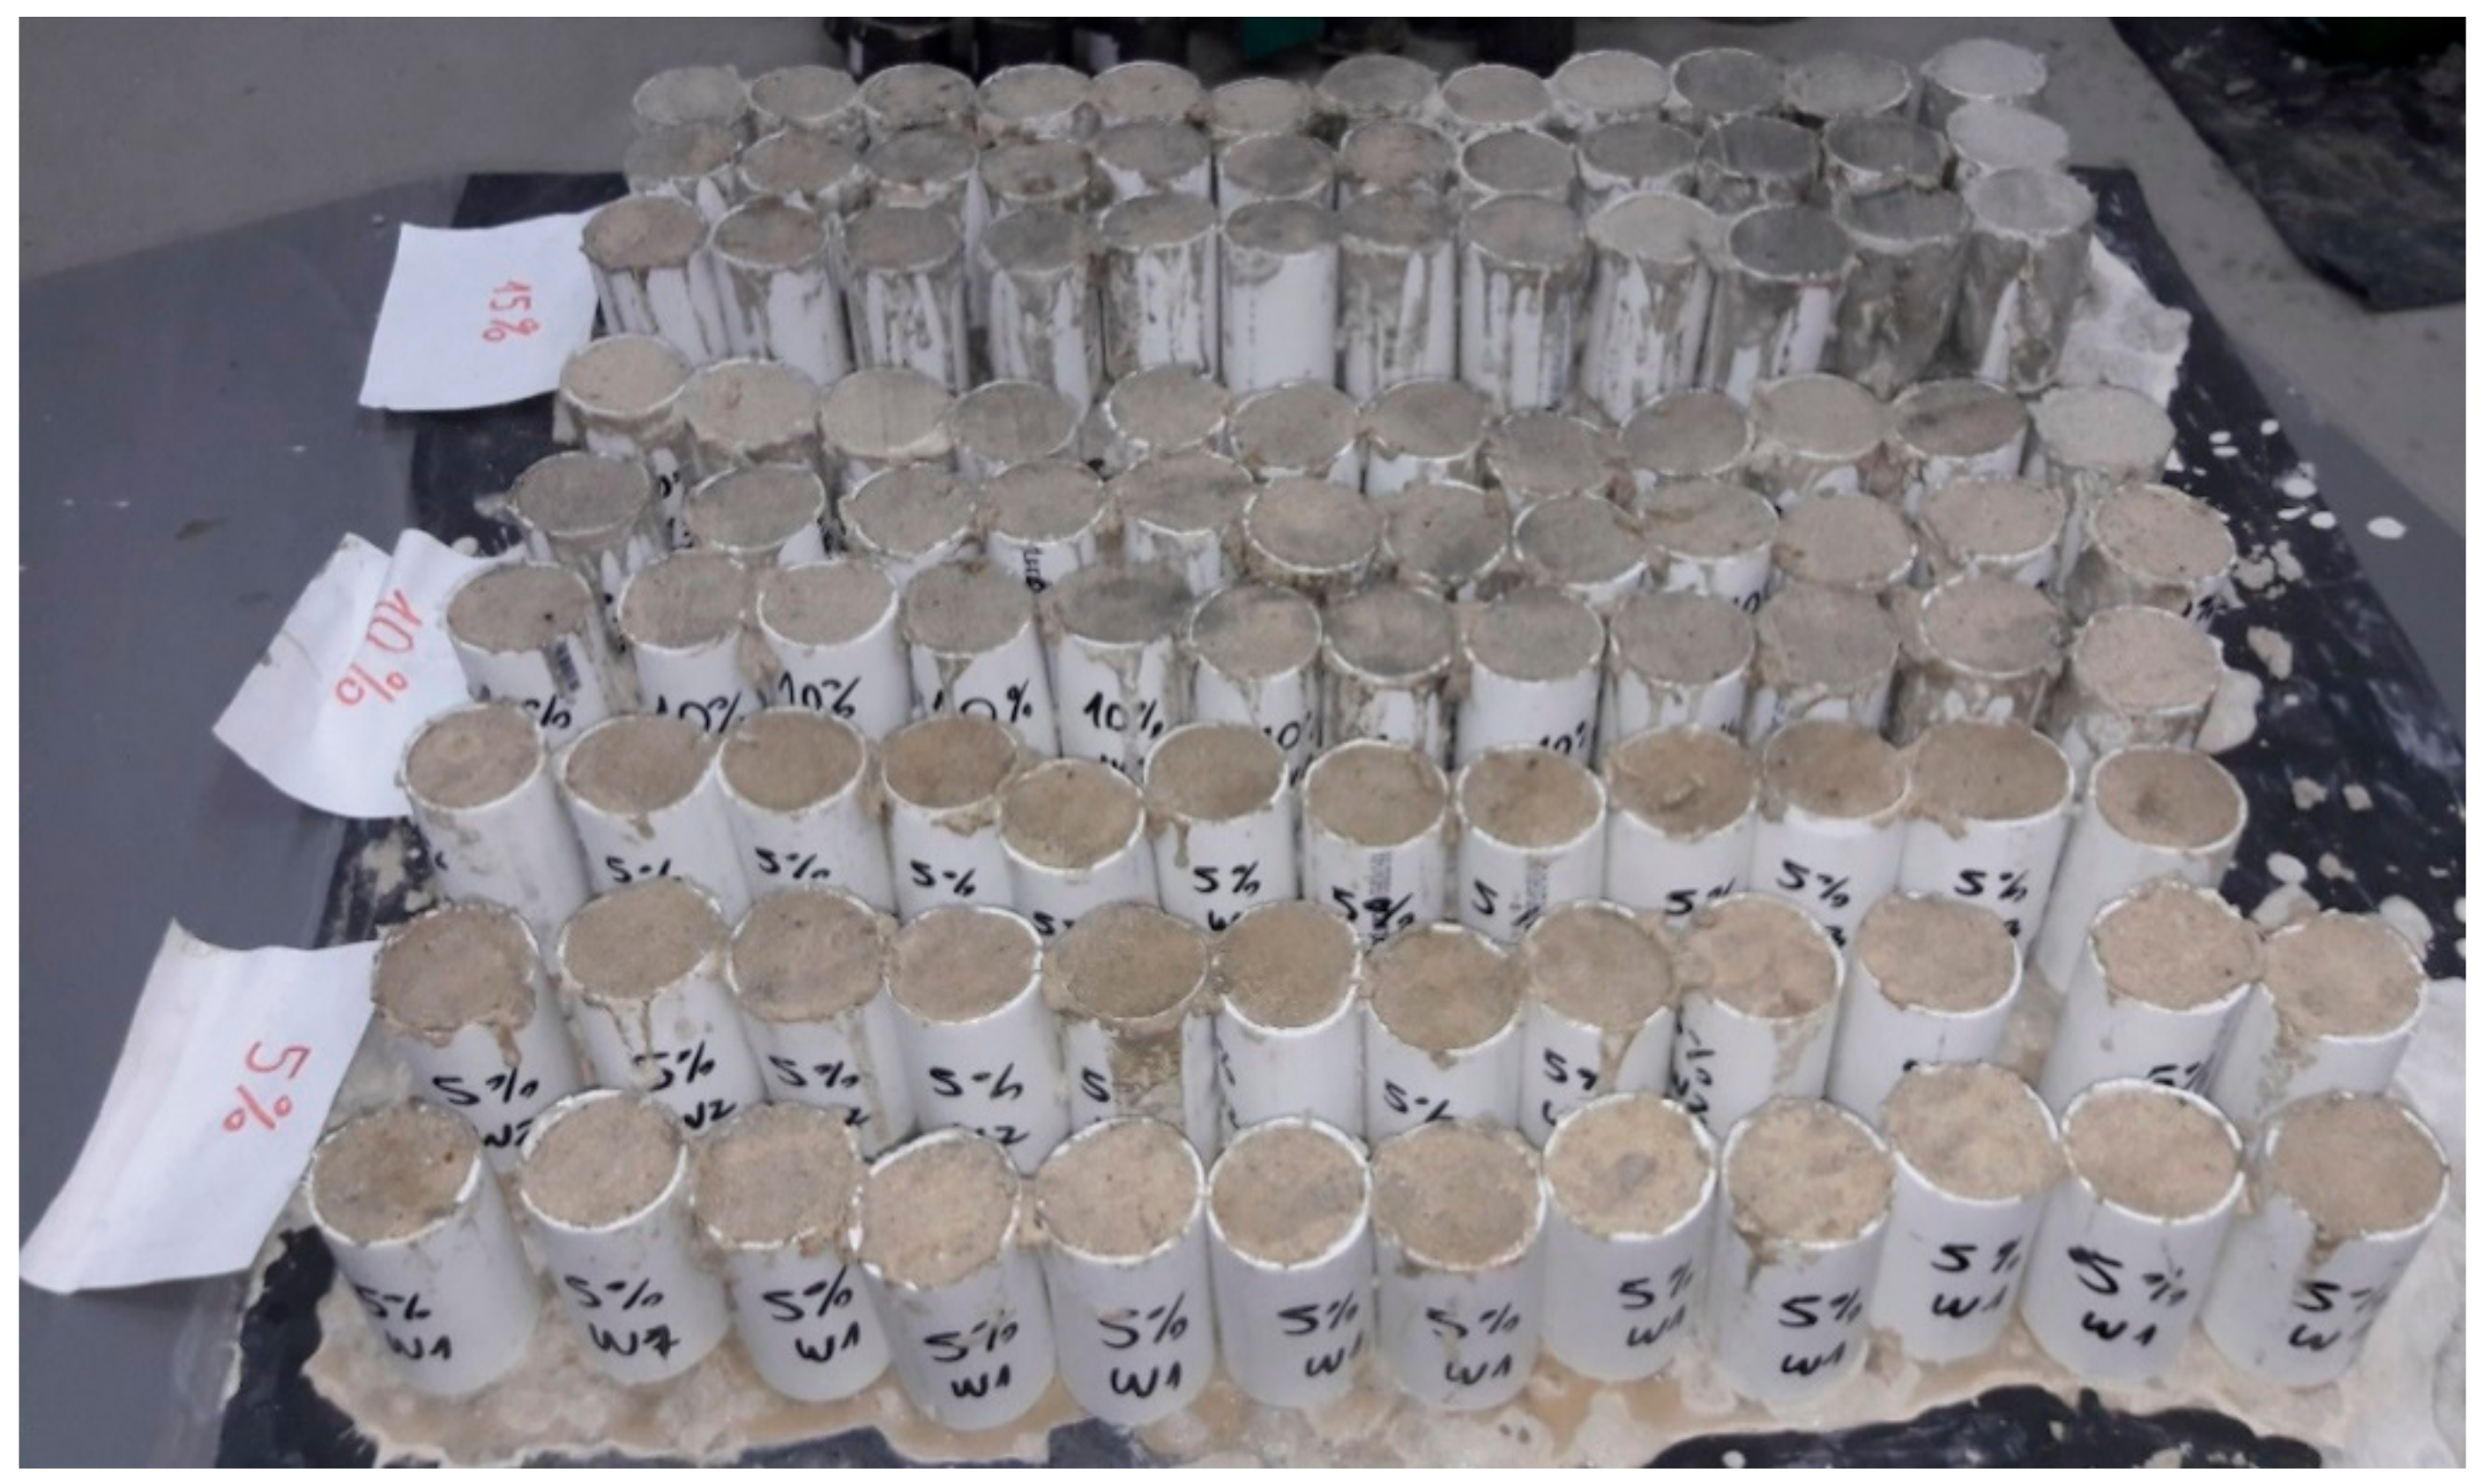
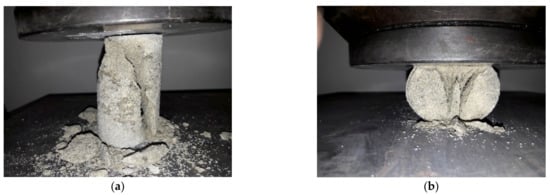
Figure 6.
Strength test: (a) compressive; (b) indirect tensile.
Figure 6.
Strength test: (a) compressive; (b) indirect tensile.

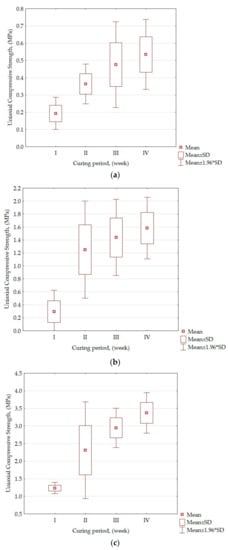
Figure 7.
Uniaxial compressive strength of the paste backfill in the period up to the fourth week with addition of: (a) 5% cement; (b) 10% cement; (c) 15% cement. SD—standard deviation.
Figure 7.
Uniaxial compressive strength of the paste backfill in the period up to the fourth week with addition of: (a) 5% cement; (b) 10% cement; (c) 15% cement. SD—standard deviation.
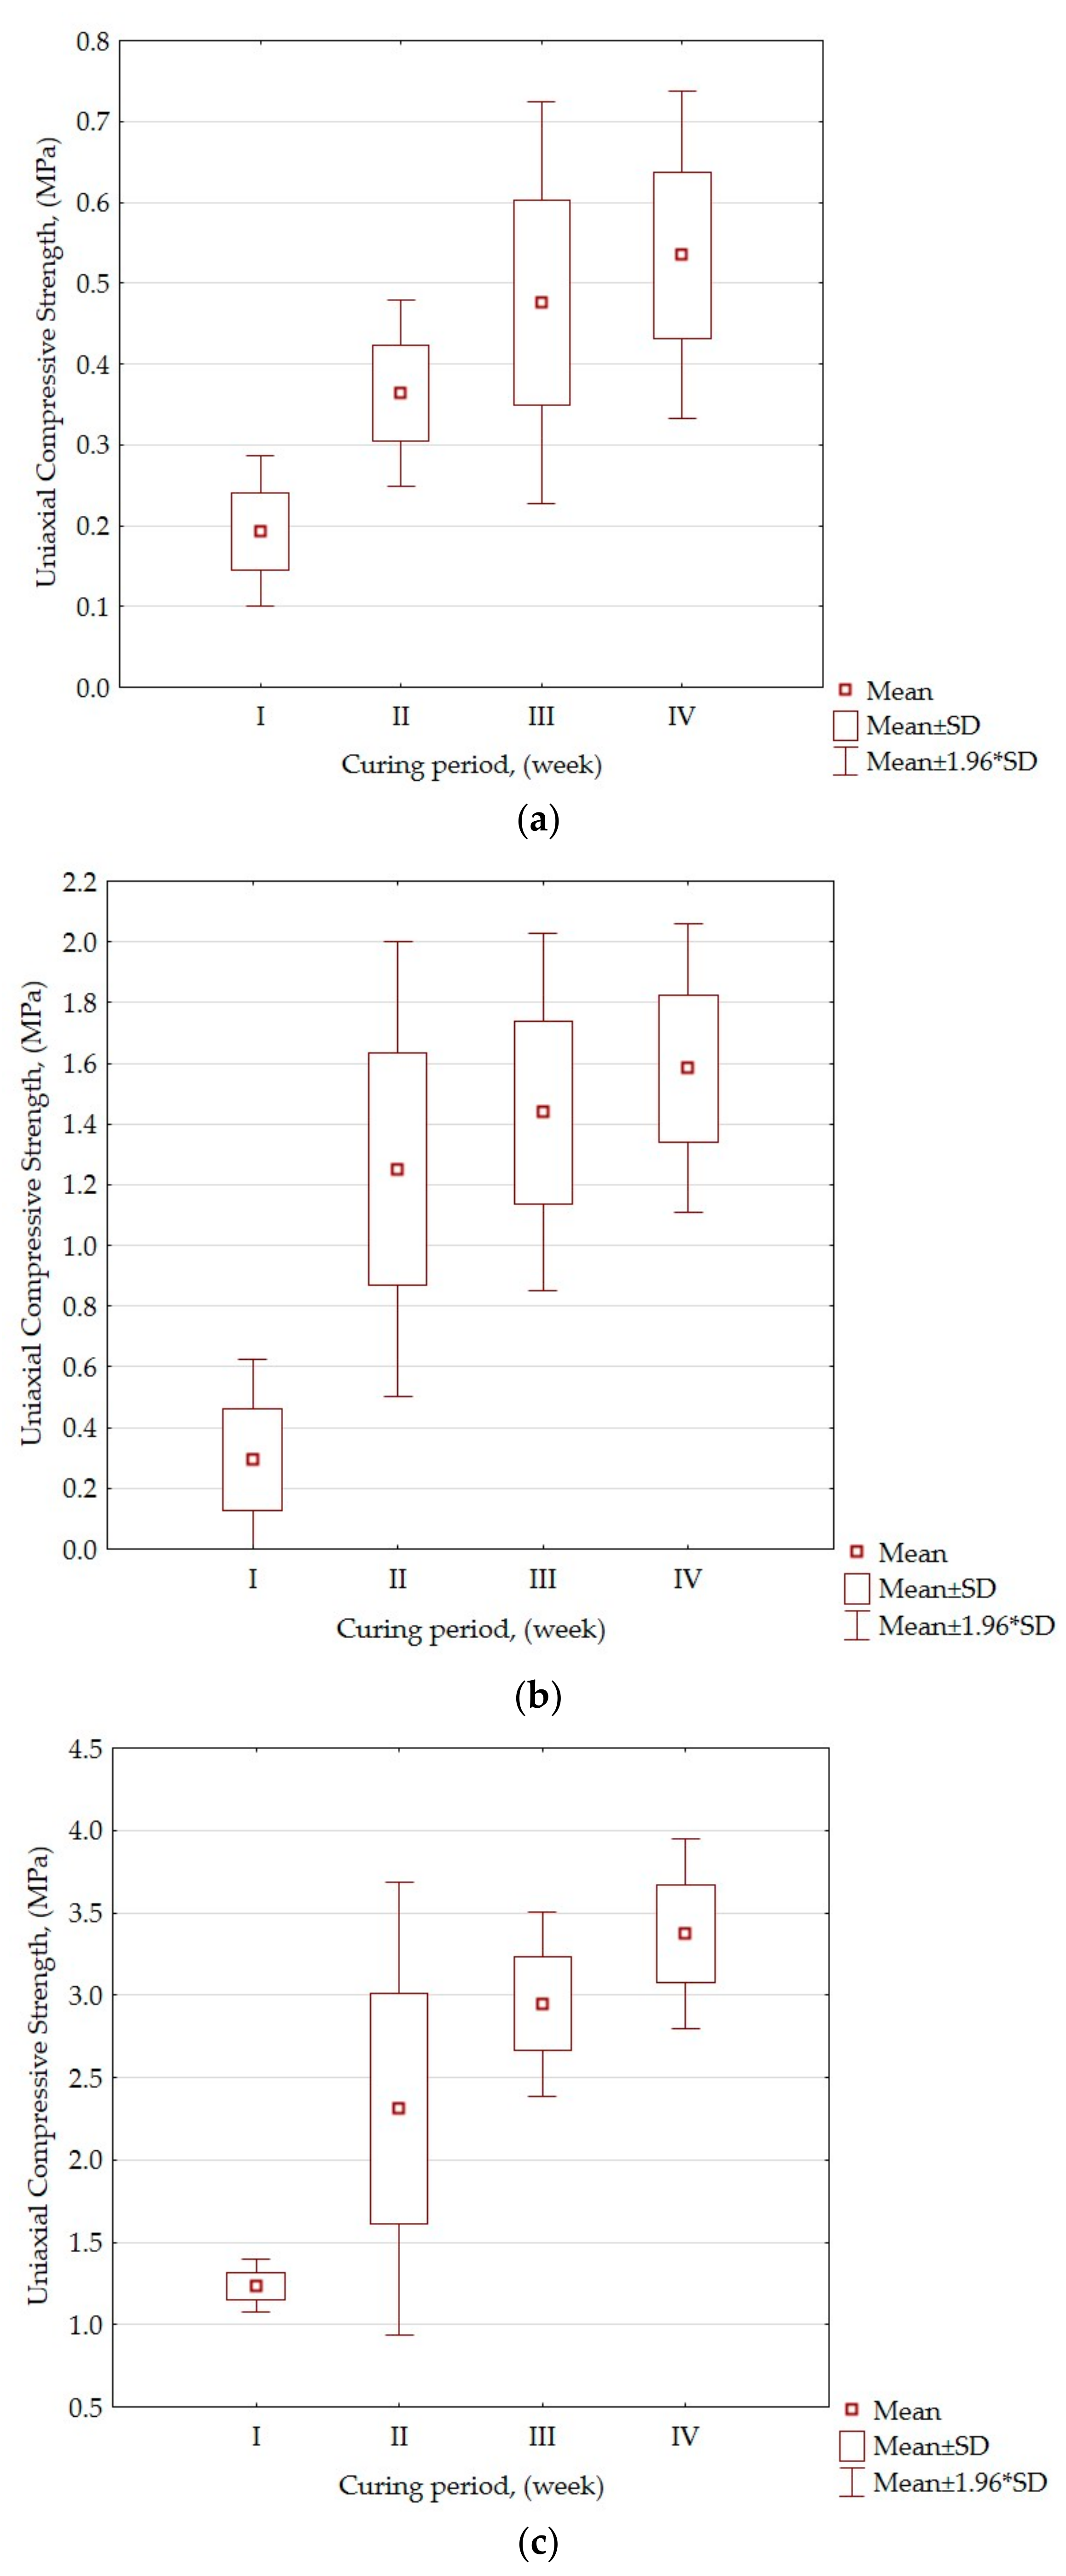
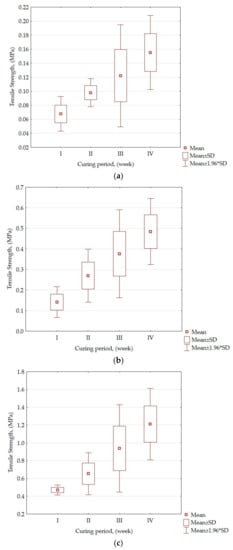
Figure 8.
Tensile strength (Brazilian test) of the paste backfill in the period up to the fourth week with addition of: (a) 5% cement; (b) 10% cement; (c) 15% cement. SD—standard deviation.
Figure 8.
Tensile strength (Brazilian test) of the paste backfill in the period up to the fourth week with addition of: (a) 5% cement; (b) 10% cement; (c) 15% cement. SD—standard deviation.
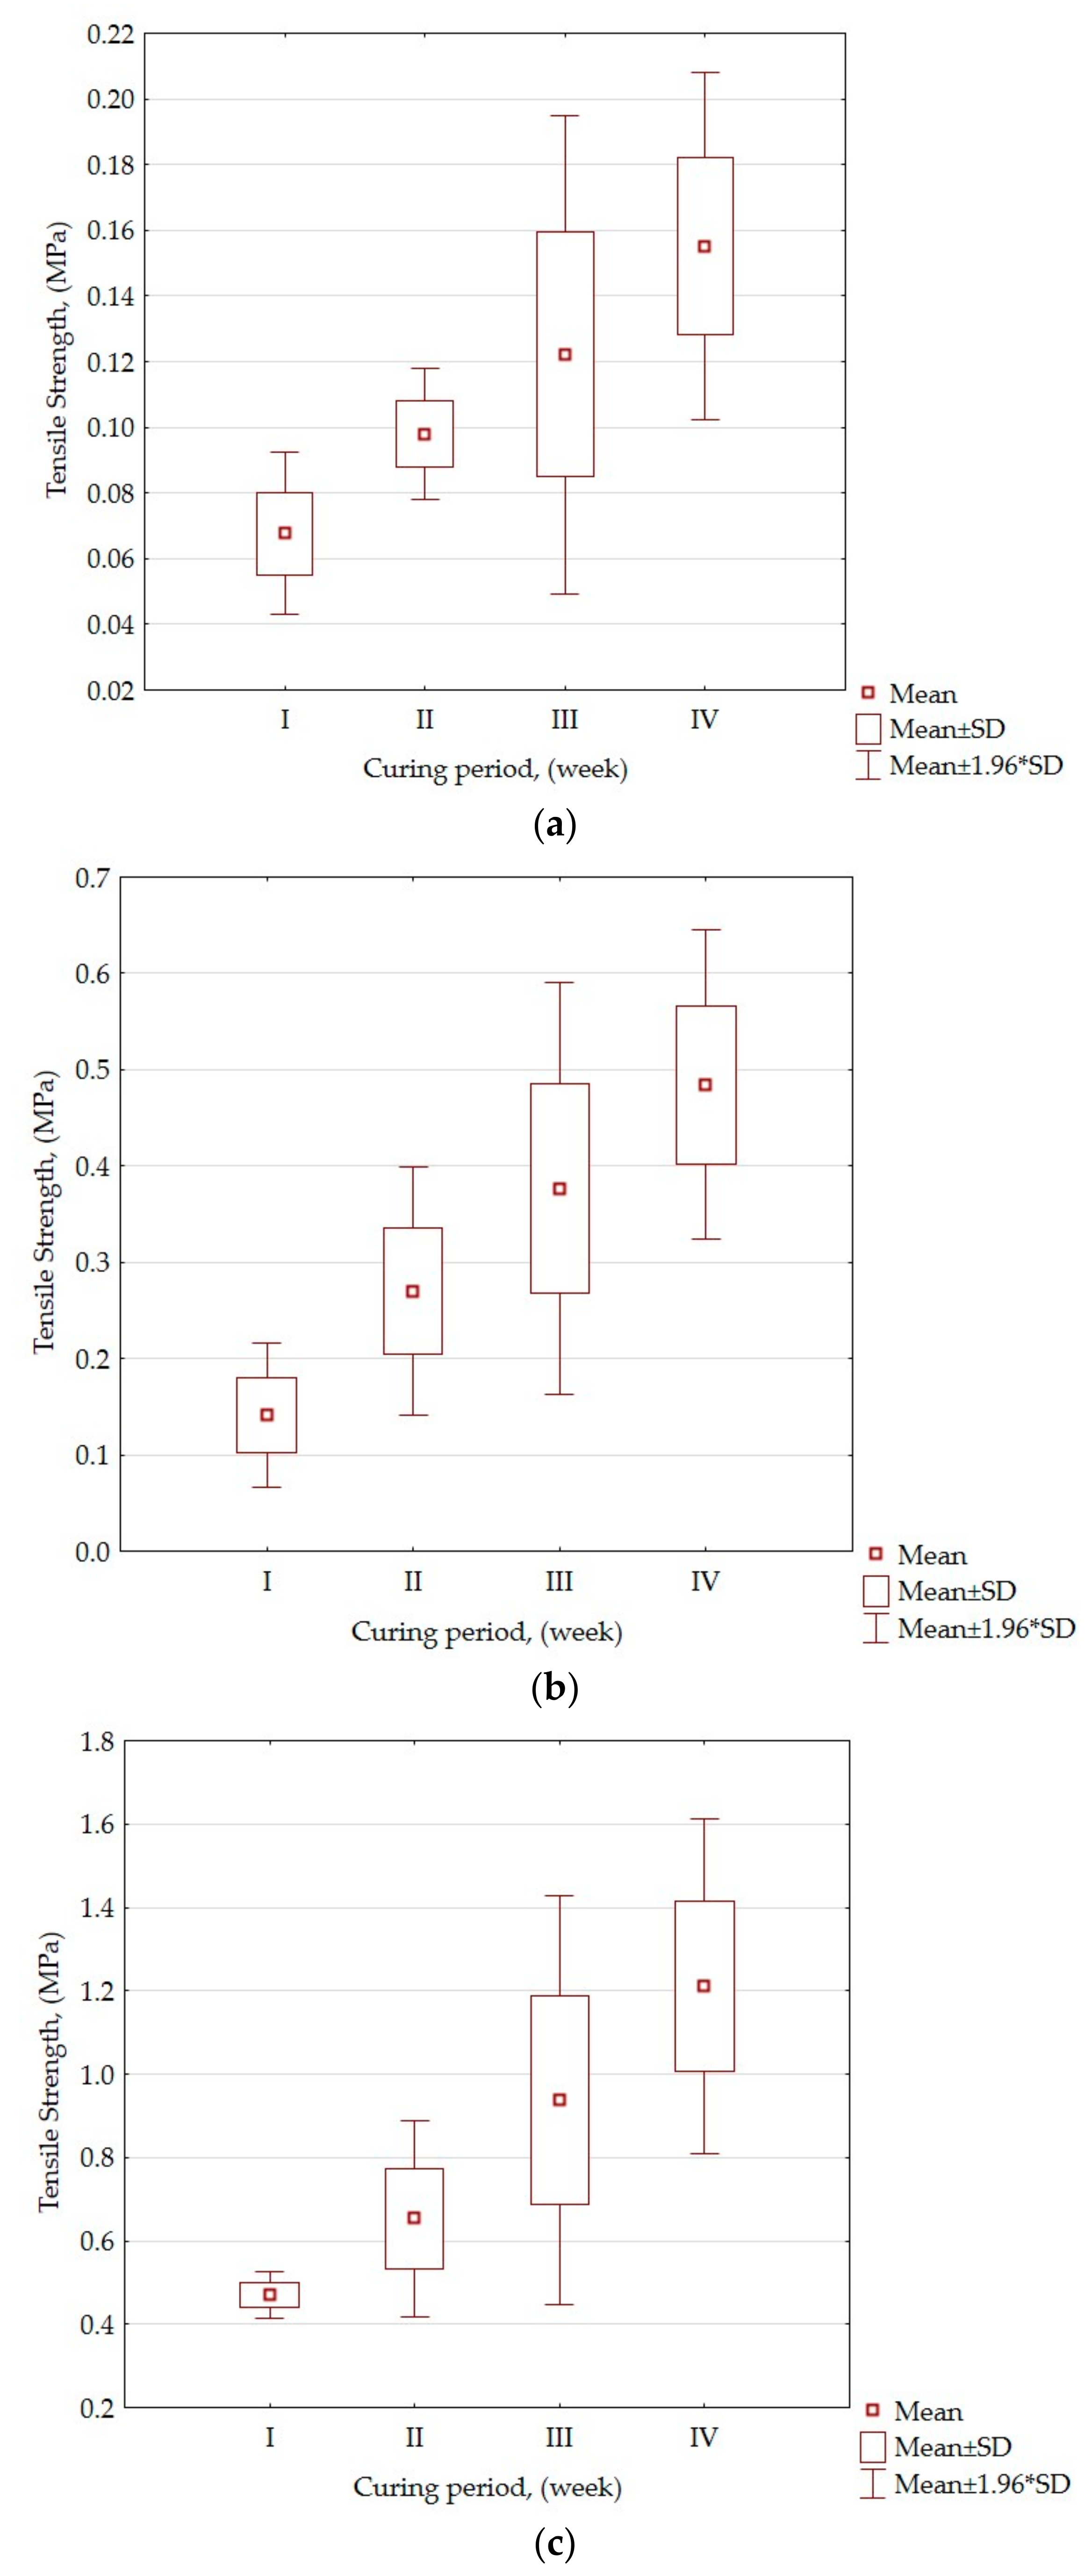

Table 1.
Summary of the results of the strength tests (average values) of the cemented paste backfill.
Table 1.
Summary of the results of the strength tests (average values) of the cemented paste backfill.
| Cement Content (%) | Curing Period (Week) | |||||||
|---|---|---|---|---|---|---|---|---|
| I | II | III | IV | |||||
| UCS (MPa) | Ts (MPa) | UCS (MPa) | Ts (MPa) | UCS (MPa) | Ts (MPa) | UCS (MPa) | Ts (MPa) | |
| 5 | 0.193 | 0.068 | 0.364 | 0.098 | 0.476 | 0.122 | 0.535 | 0.155 |
| 10 | 0.296 | 0.141 | 1.250 | 0.270 | 1.439 | 0.377 | 1.583 | 0.485 |
| 15 | 1.234 | 0.471 | 2.312 | 0.653 | 2.947 | 0.938 | 3.473 | 1.211 |
UCS—uniaxial compressive strength; Ts—tensile strength.
3. Numerical Modeling of Strip Mining with Cemented Paste Backfill
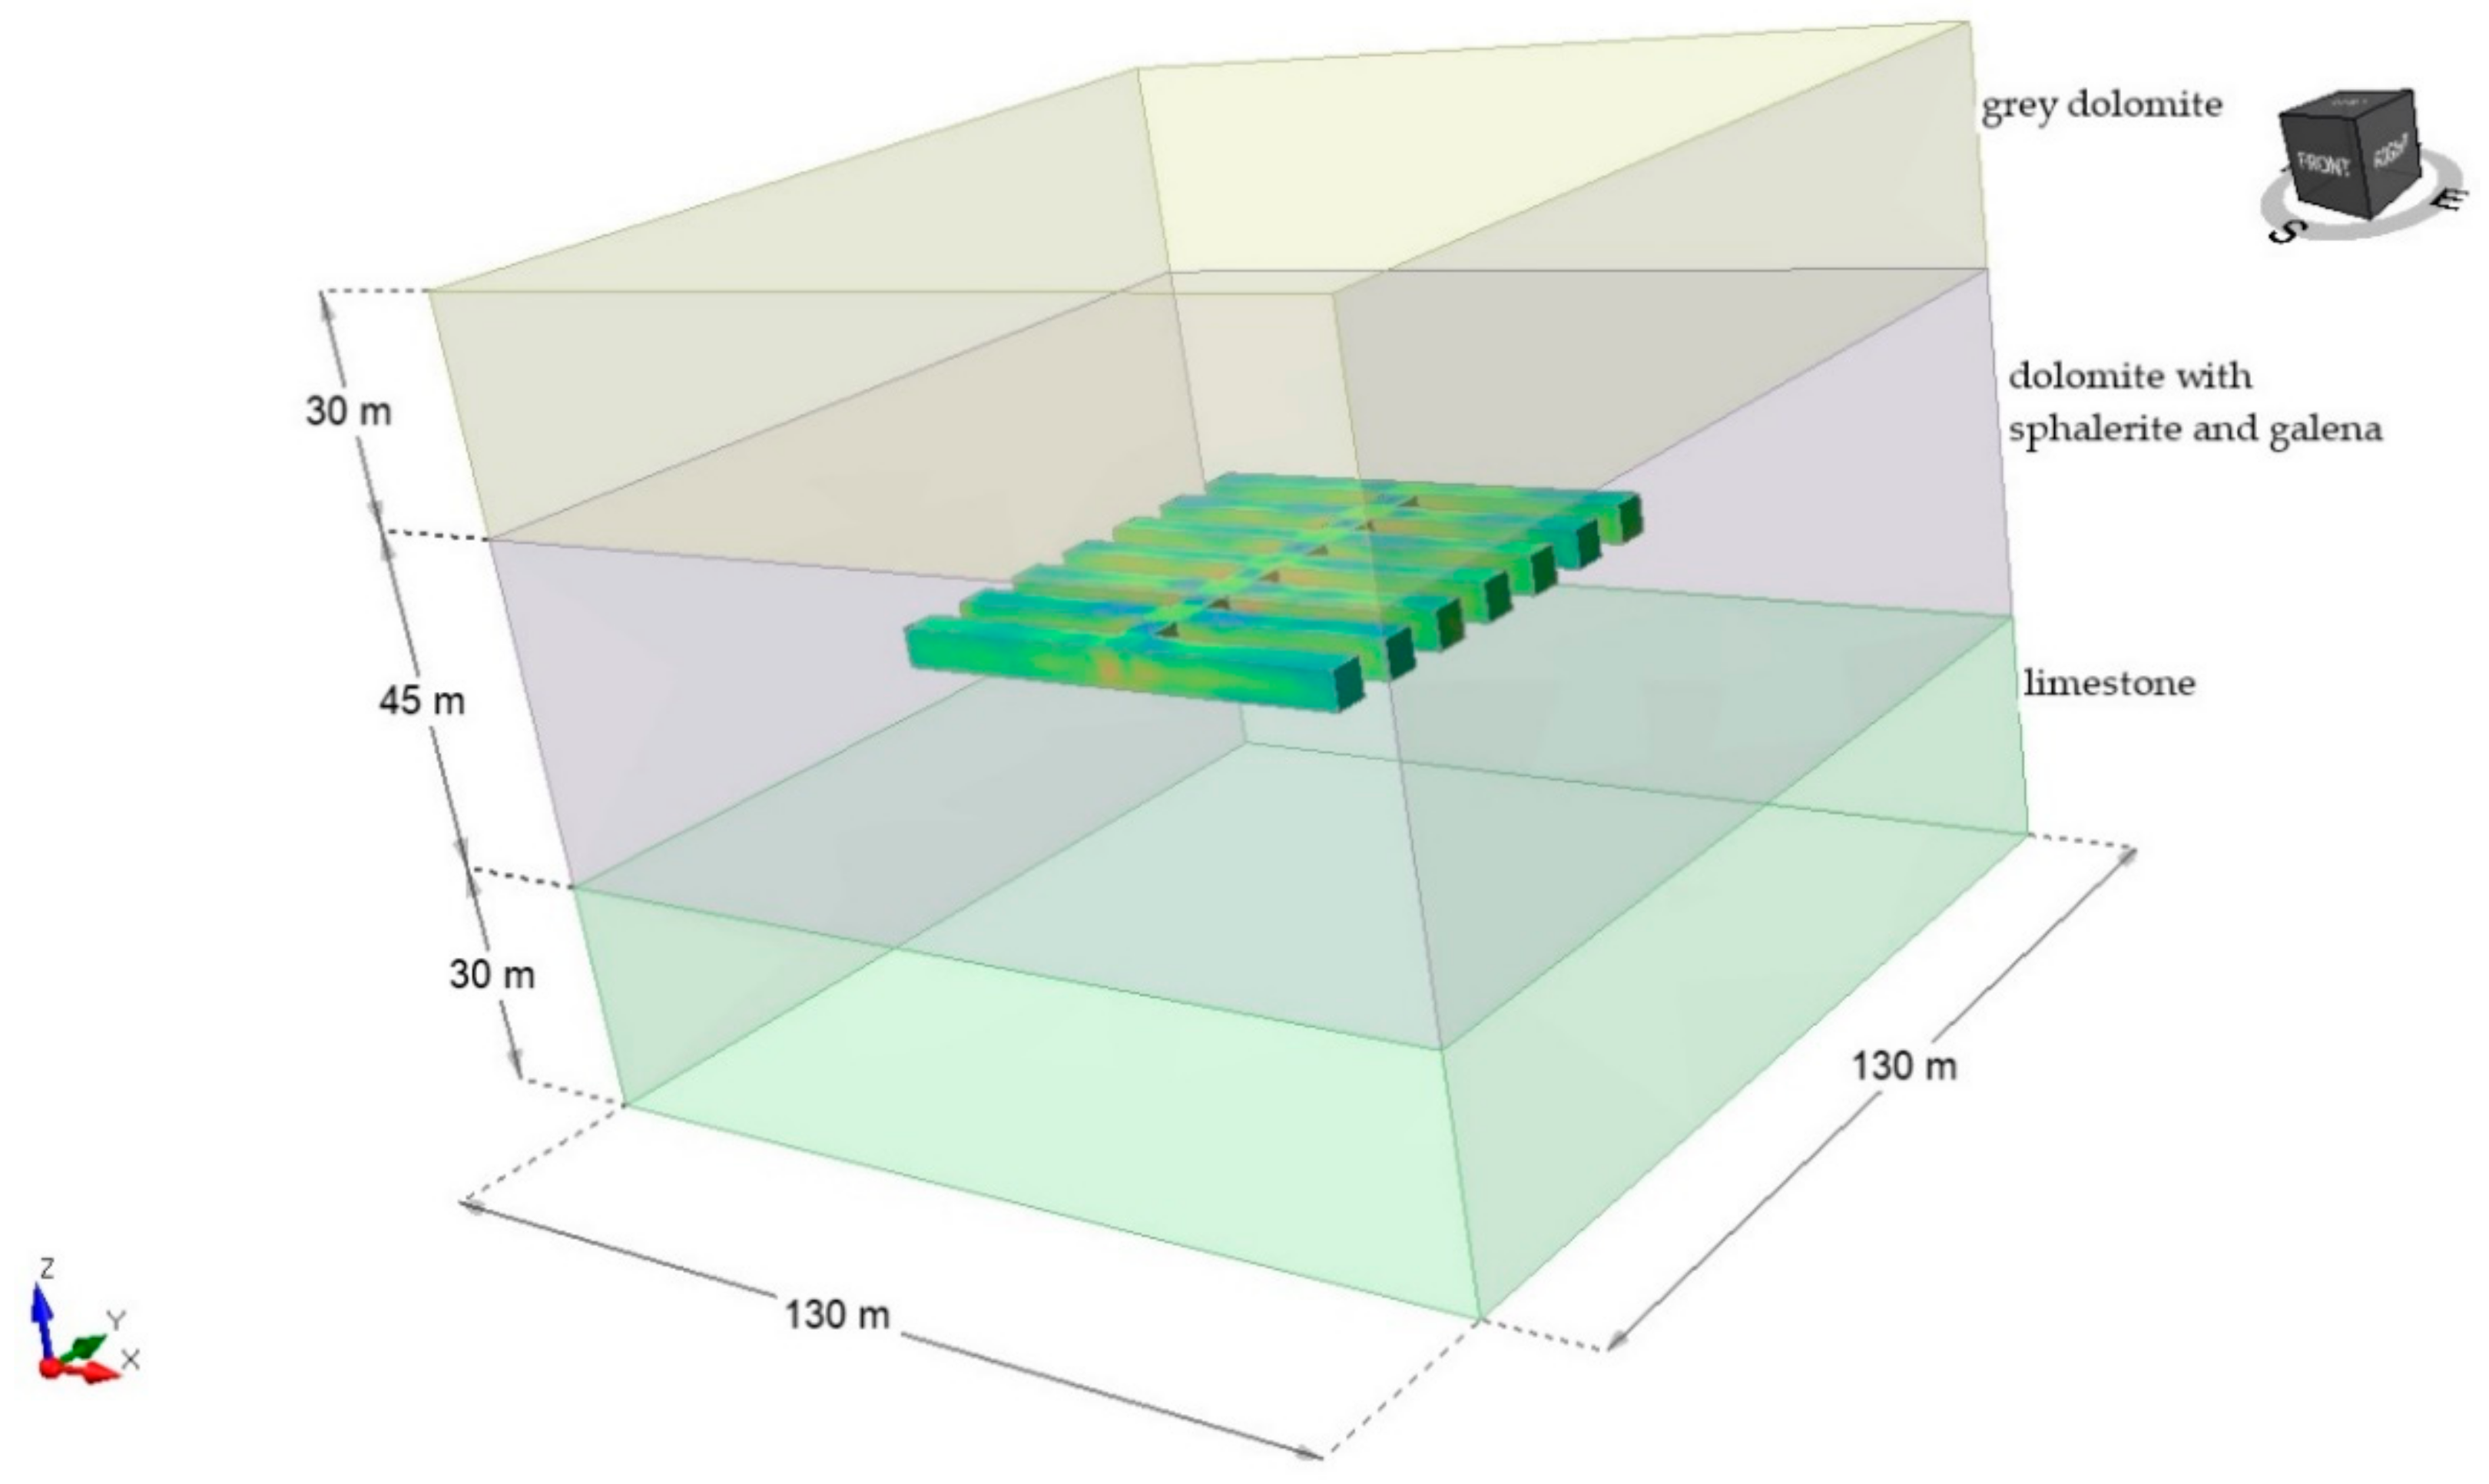
Numerical tests were performed in three-dimensional RS3 software [22], which is based on the finite element method. For the conditions of zinc and lead ore deposits found in Poland [23], a rock mass model was built, which consisted of the following layers: gray dolomite; ore-bearing dolomites with useful minerals such as galena and sphalerite; and limestone. The model (Figure 9) was 130 m (length) × 130 m (width) × 105 m (height), and was restrained in all directions. A four-noded tetrahedra mesh type was used. In the numerical simulations, it was assumed that the vertical stresses were equal to the horizontal stresses and were as follows: σ1 = σ2 = σ3 = 2.7 MPa. In addition, the Mohr–Coulomb failure criterion was applied. The parameters of the rock mass and the cemented paste backfill adopted in the modeling are presented in Table 2.

Figure 9.
The 3D model of rock mass.
Table 2.
Parameters of the rock mass and the cemented paste backfill.
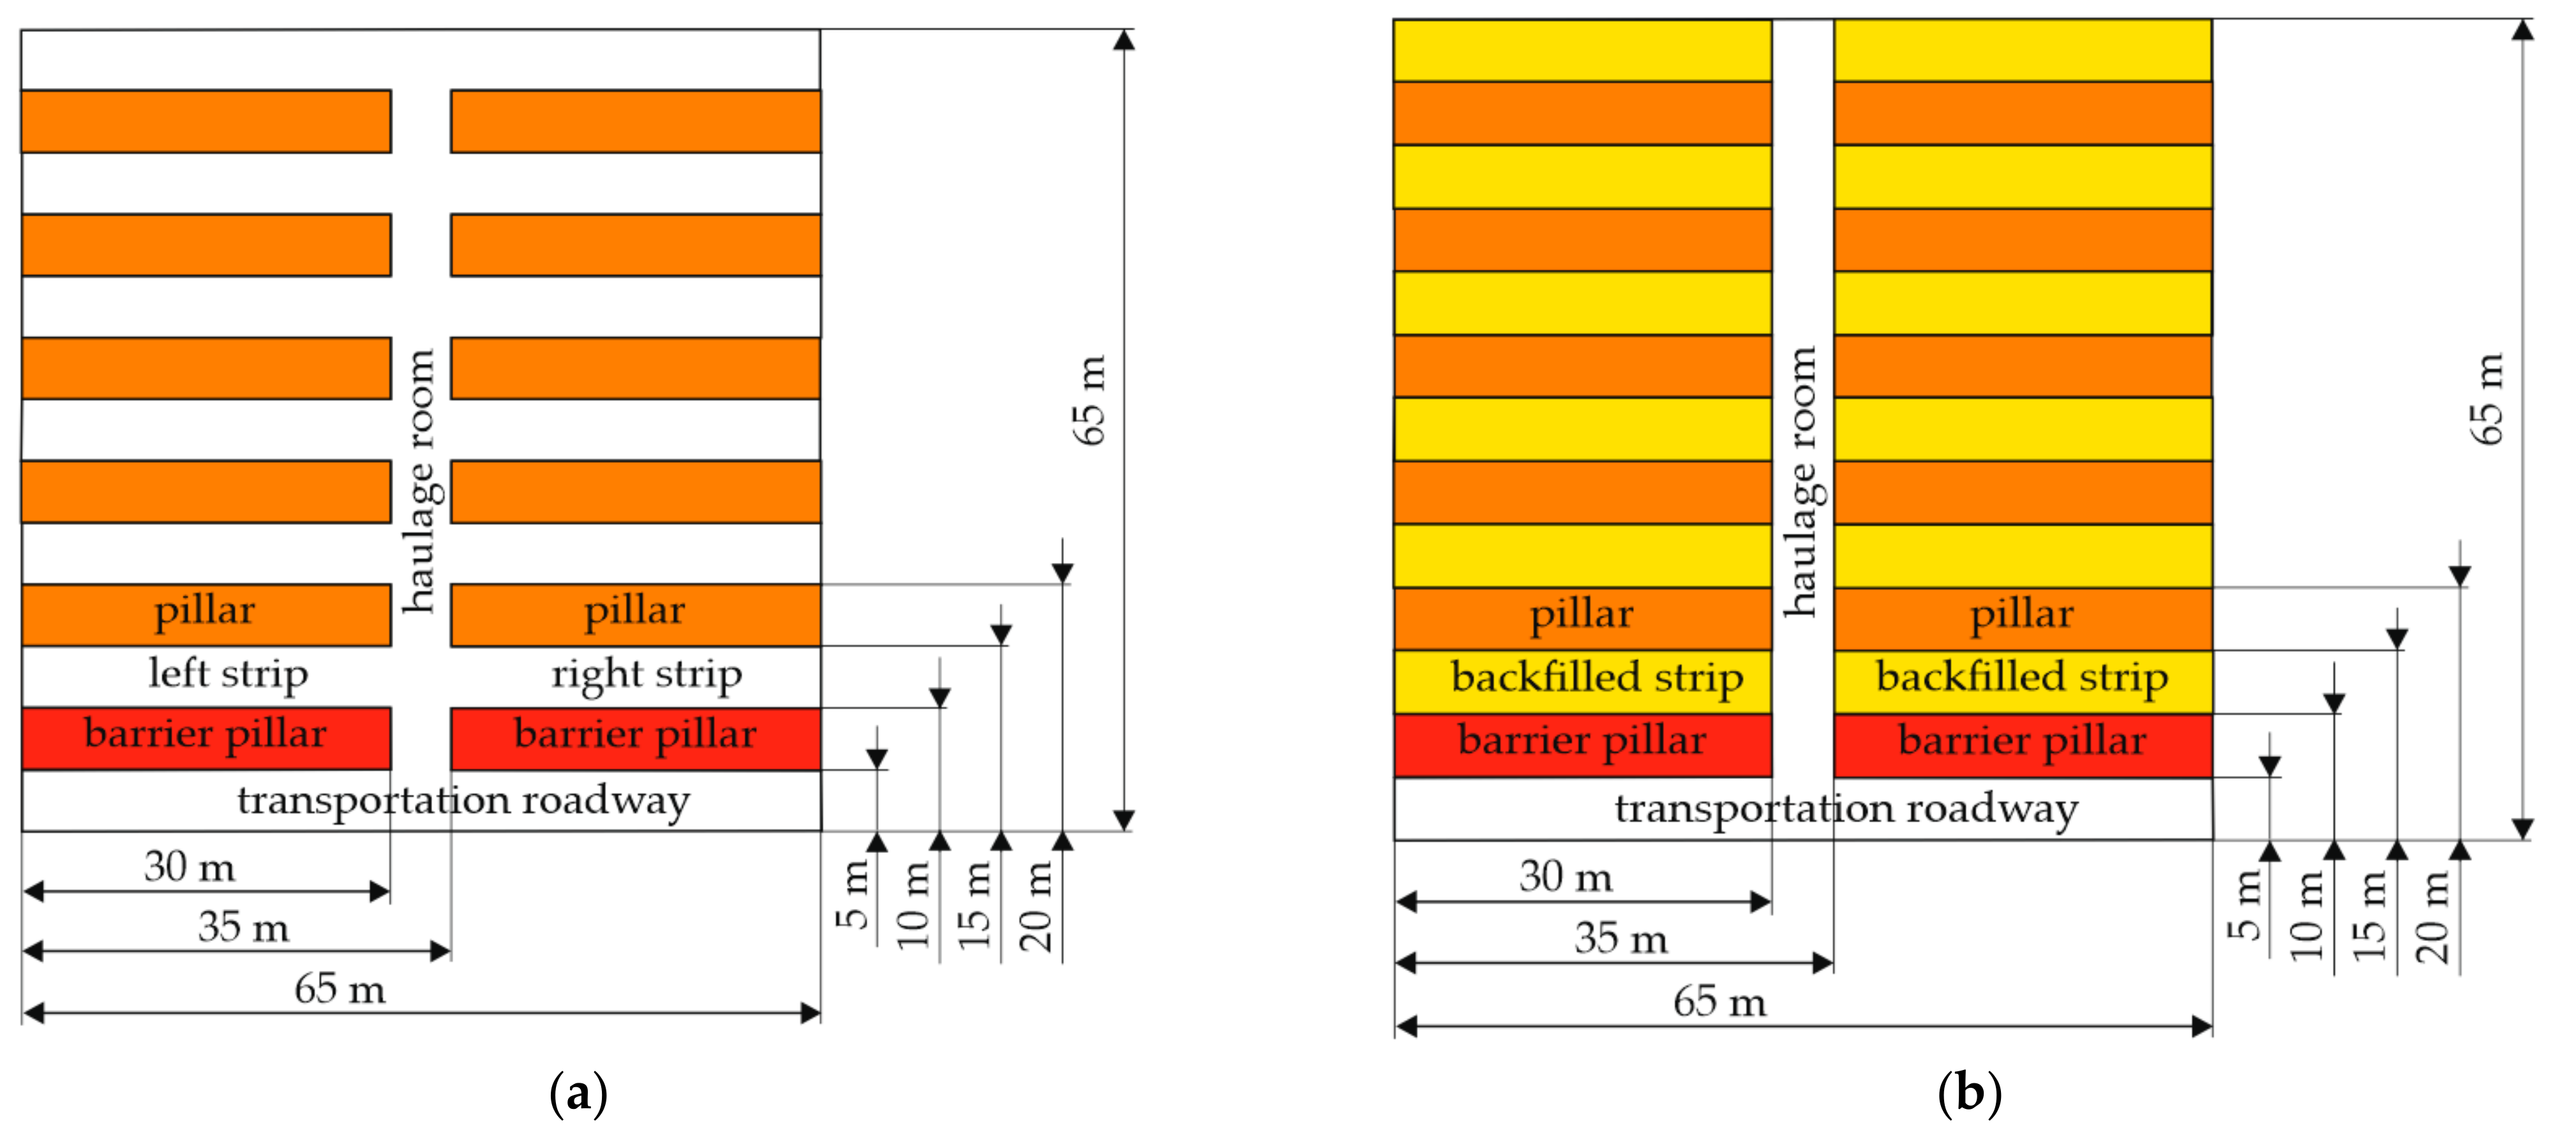
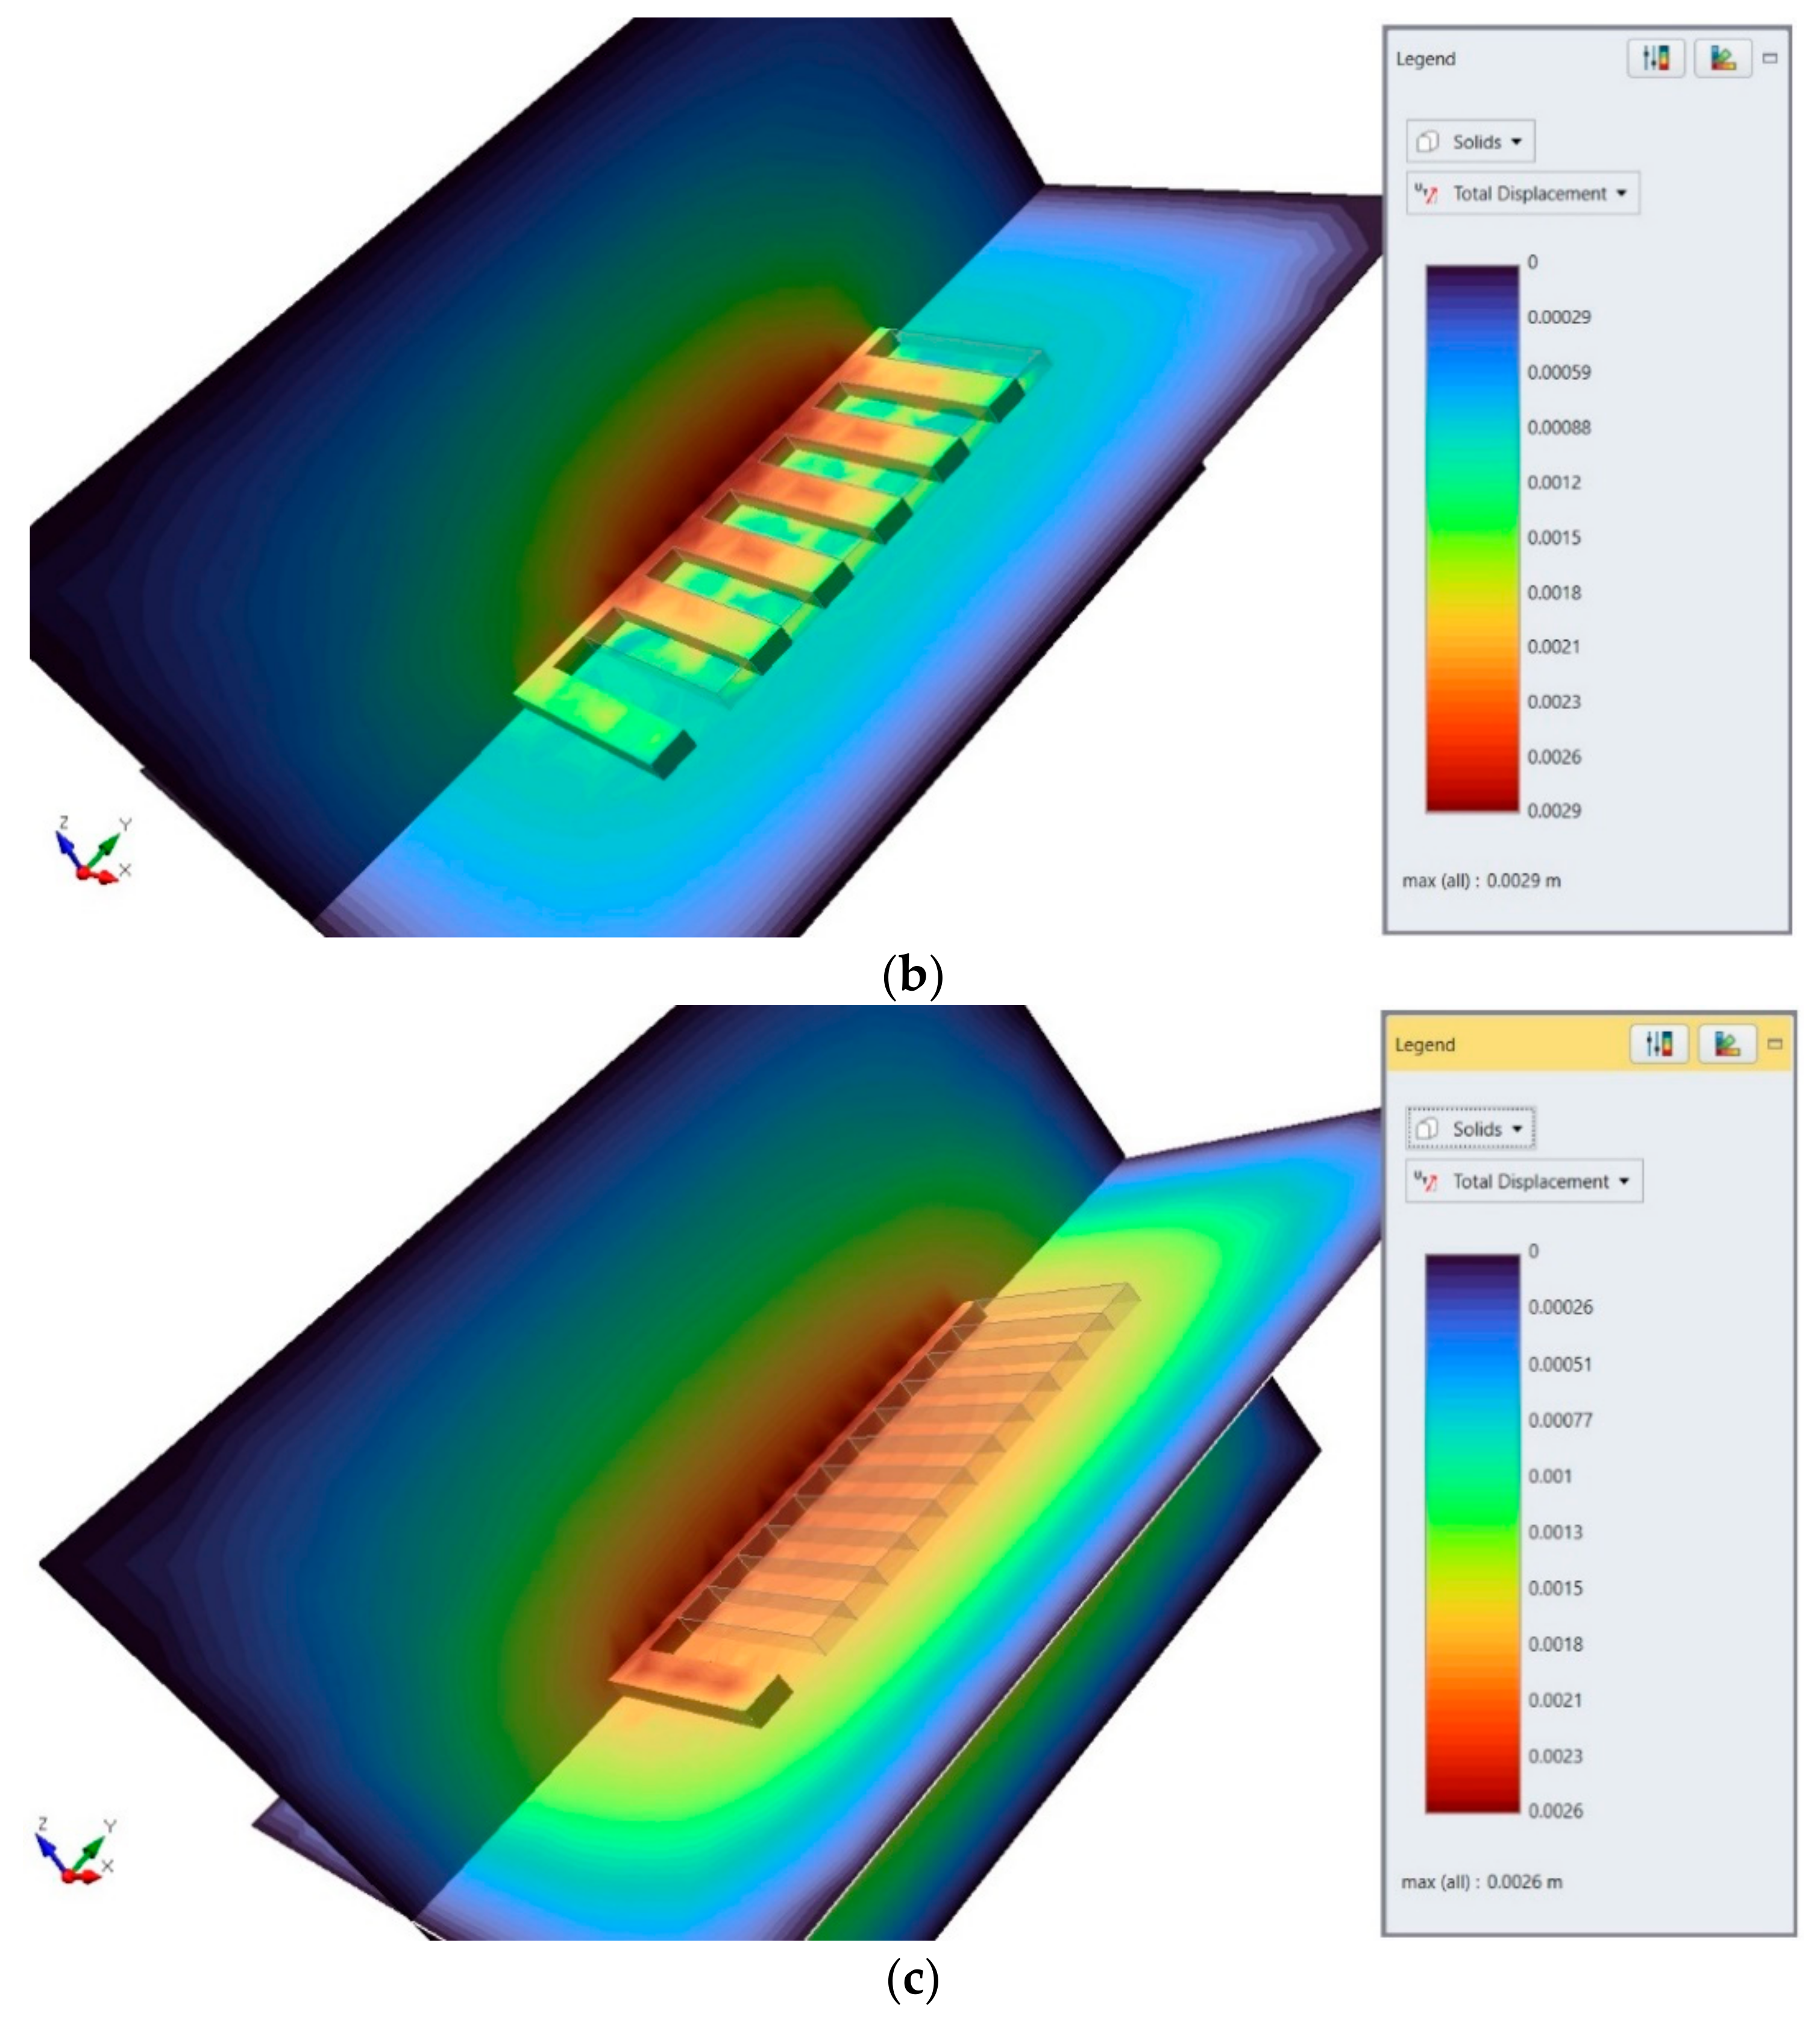
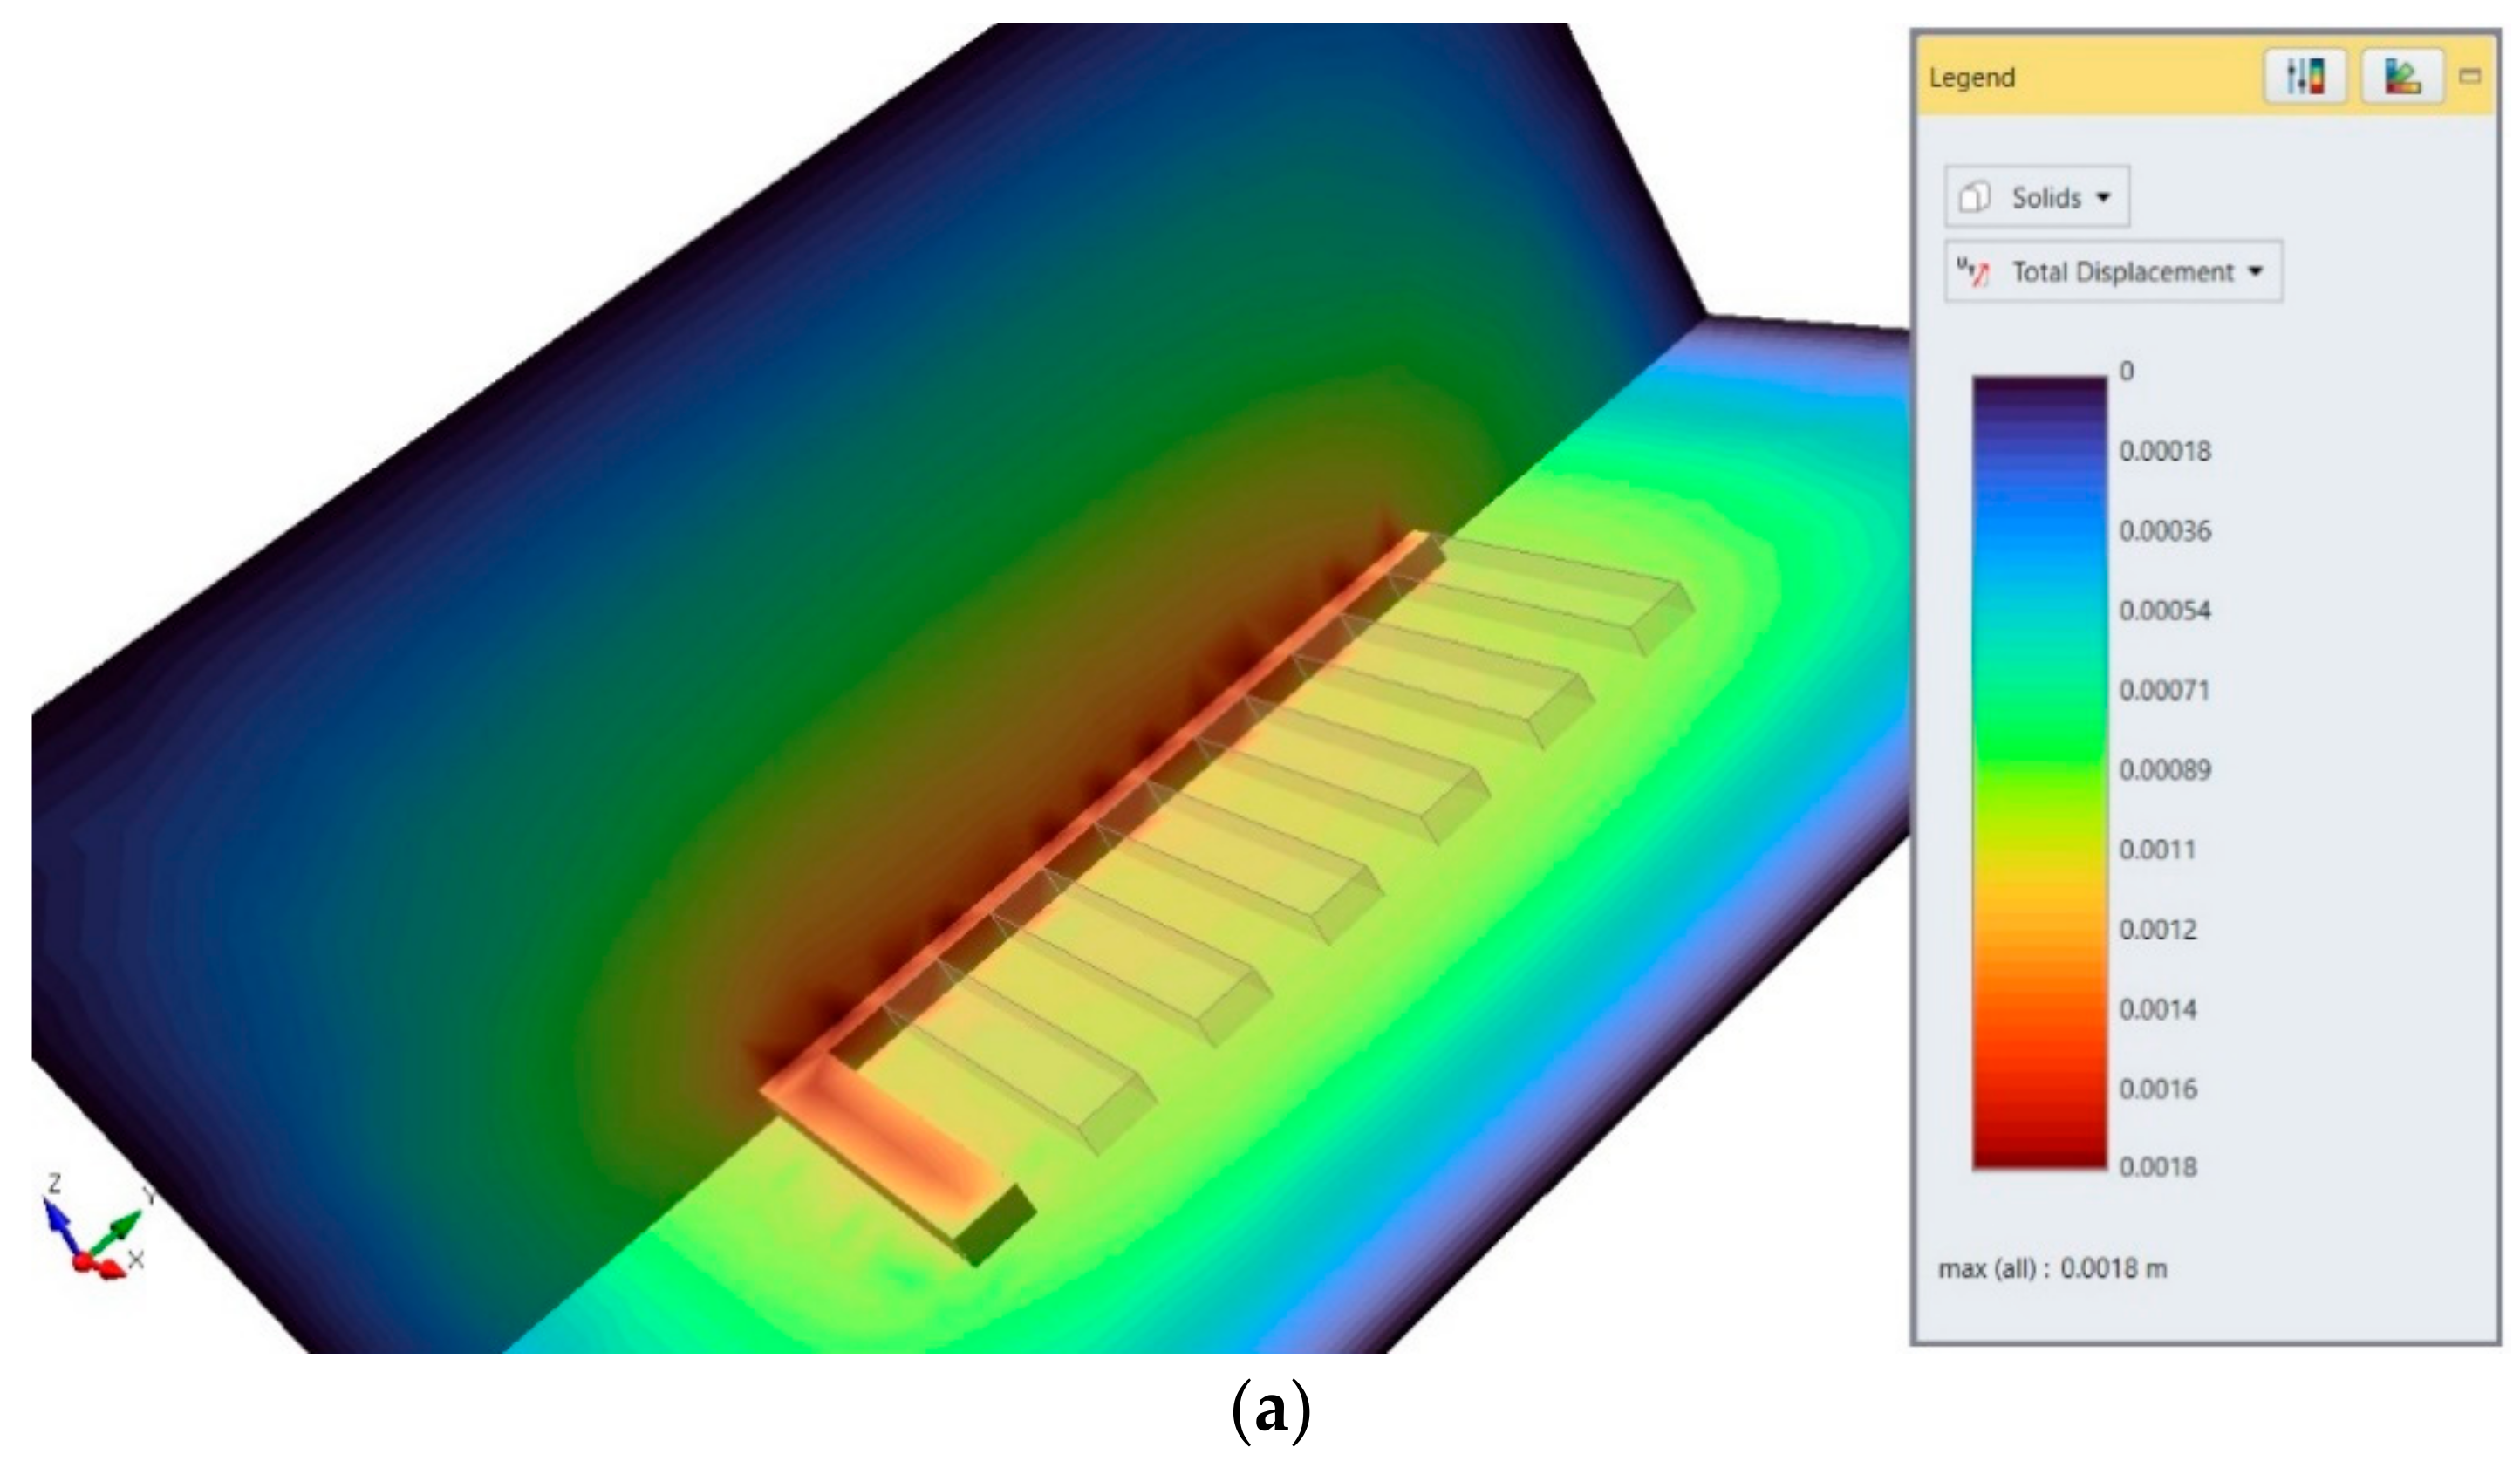
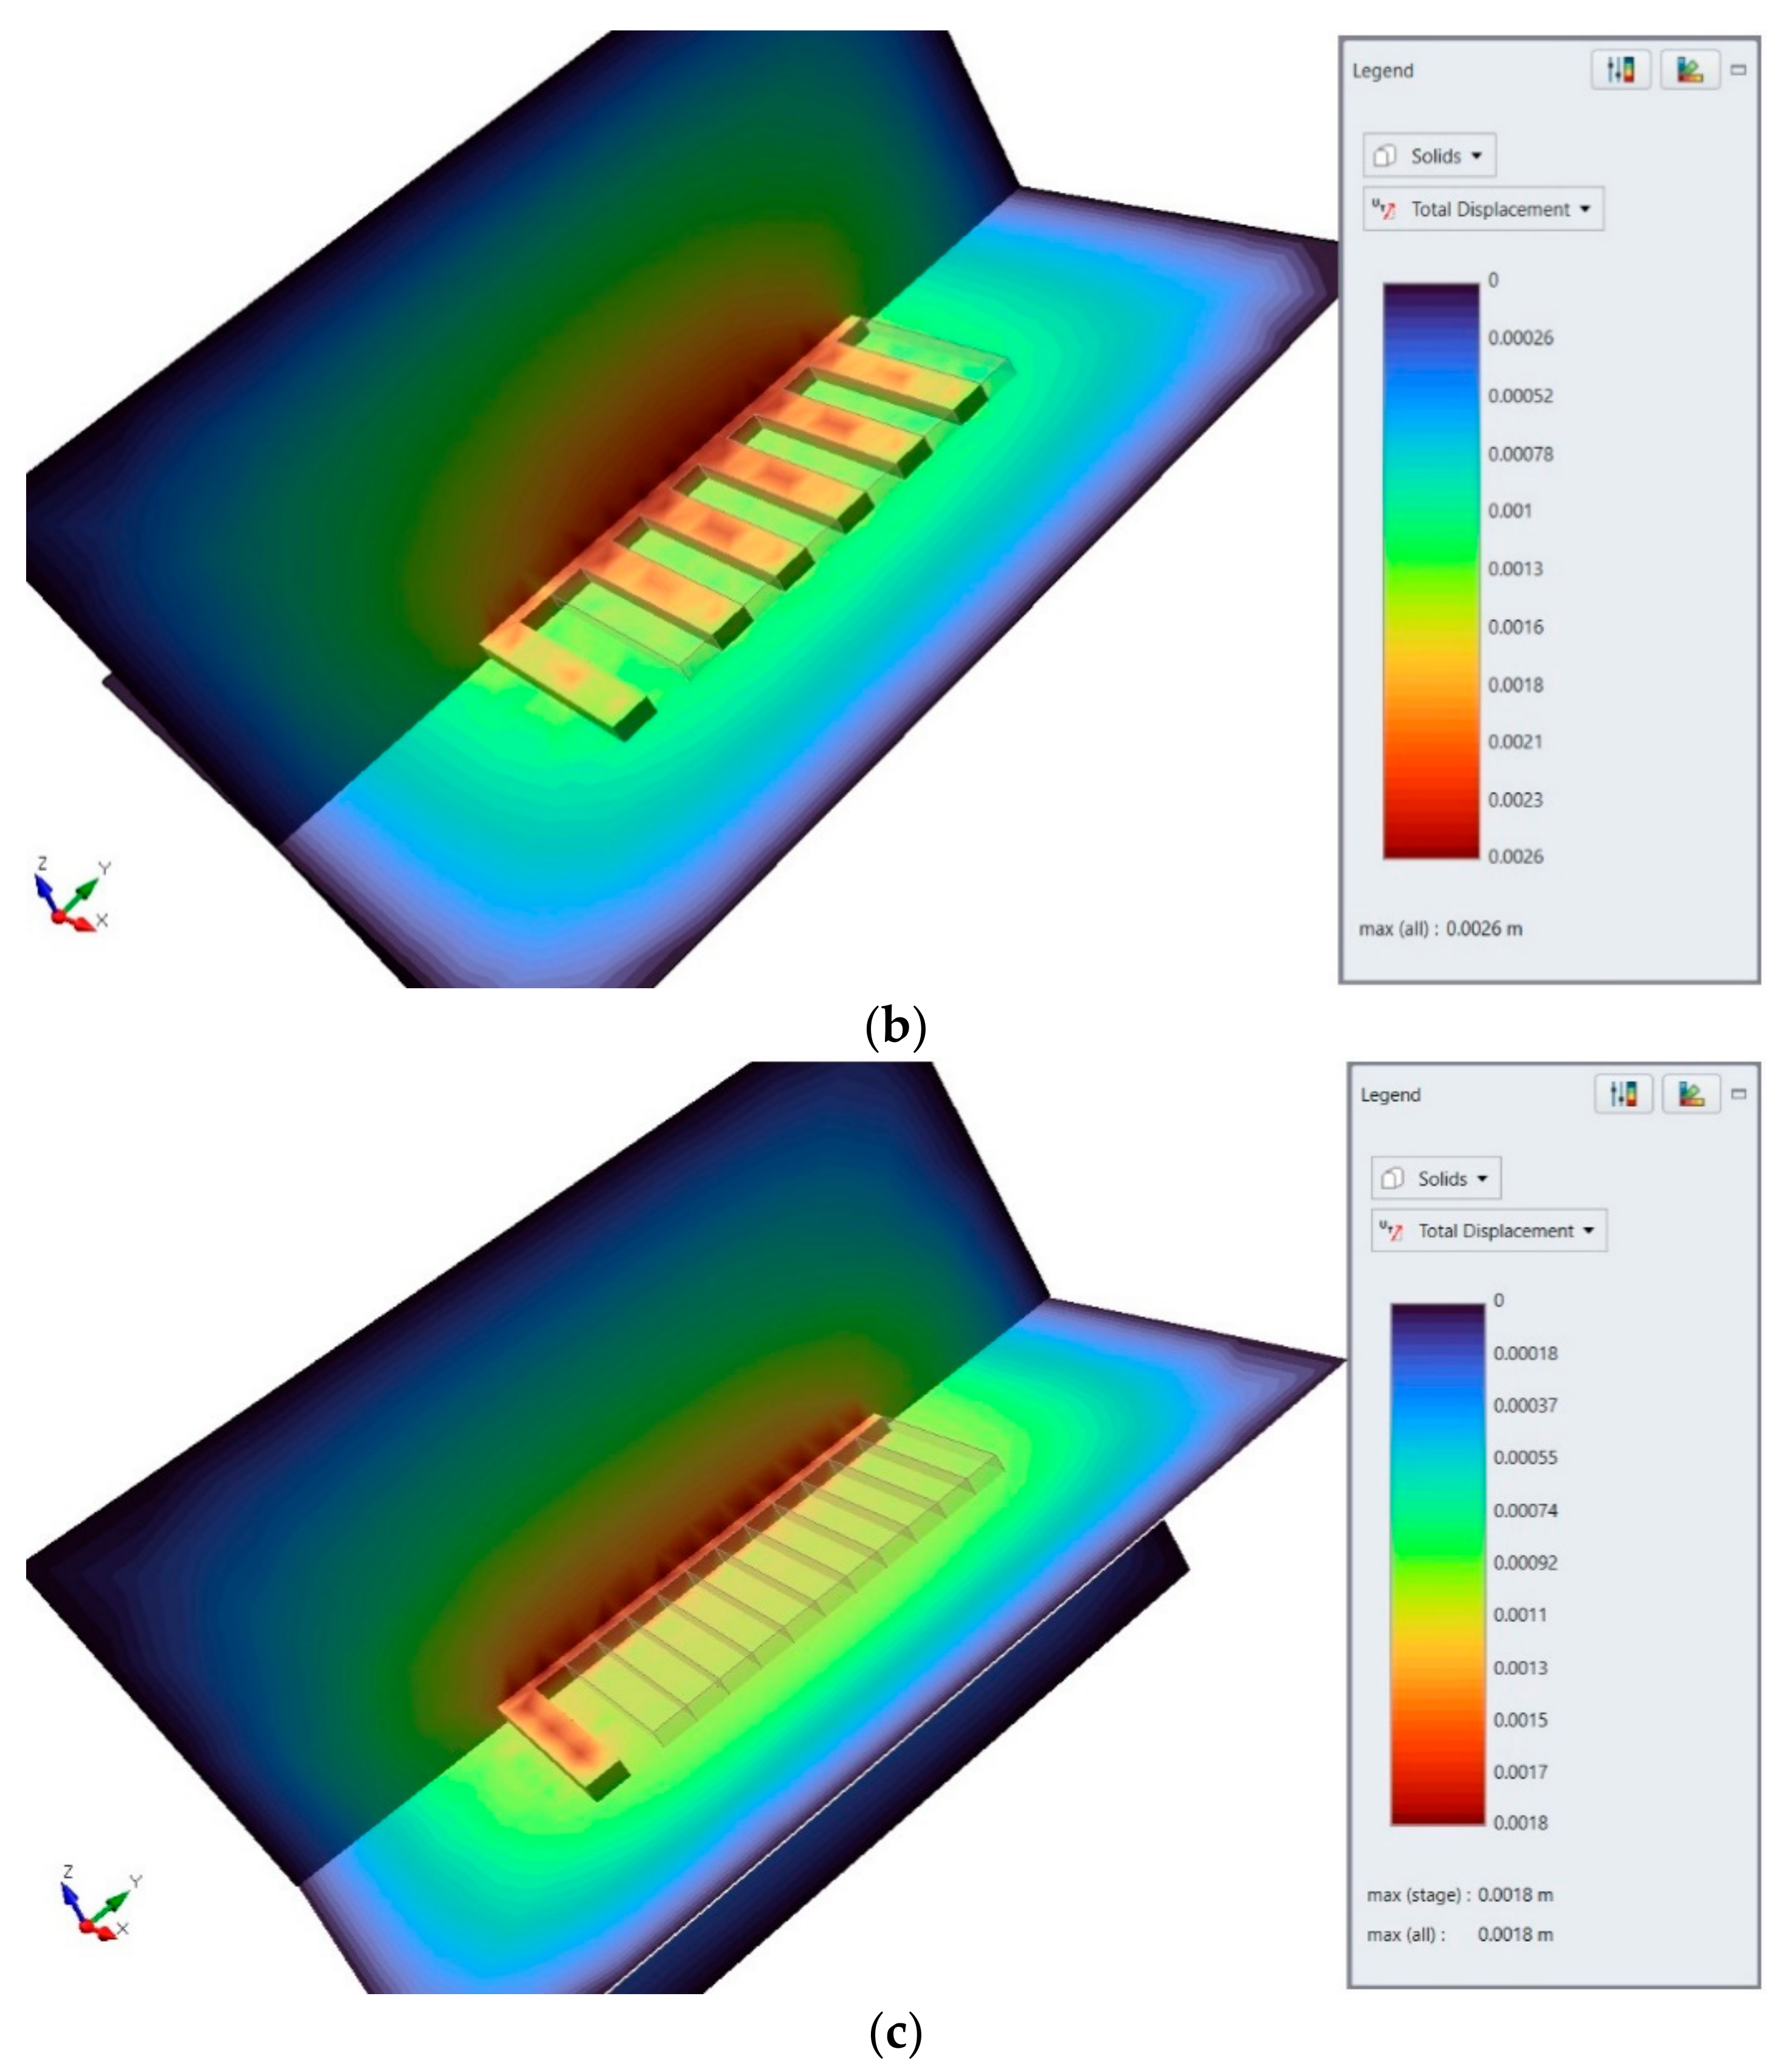
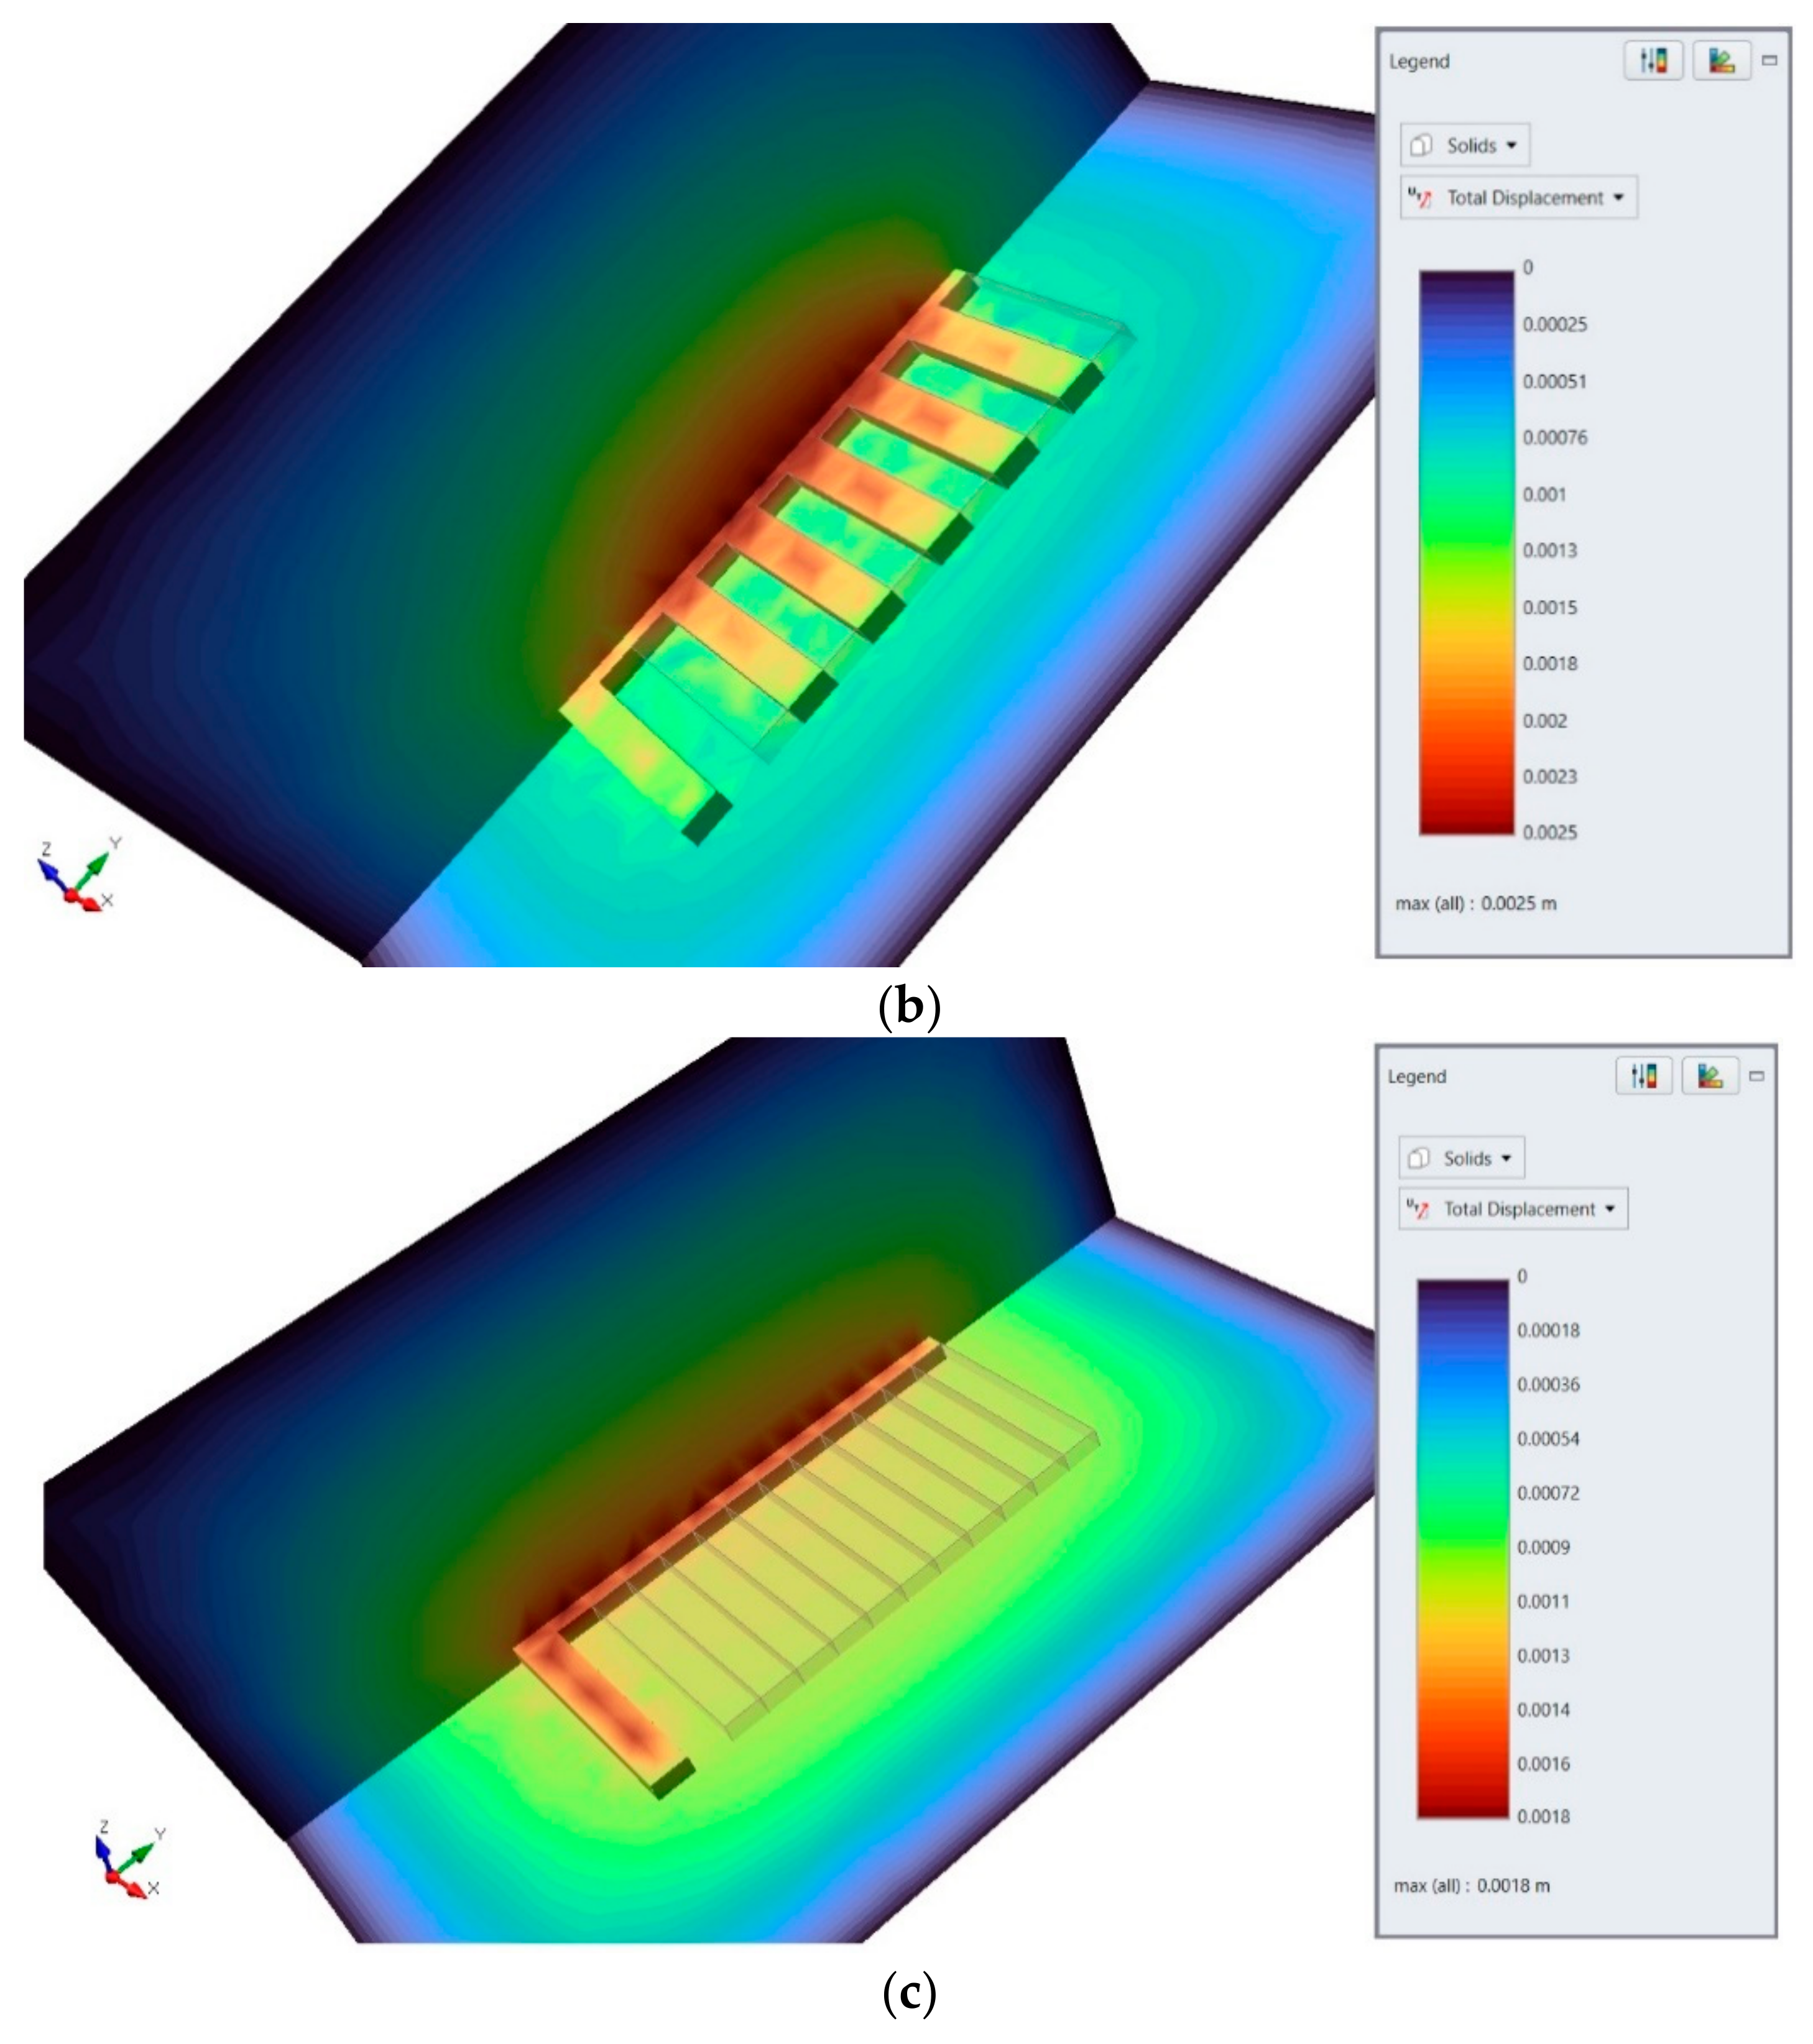
In the layer of ore-bearing dolomites, a two-sided strip-mining method was designed in the exploitation field with dimensions of 65 m × 65 m, and was located at a depth of 100 m. Both the strips and the rooms as well as the roadway were 5 m (width) and 5 m (height). The primary goal of the numerical modeling was to determine the changes in displacements around the excavations for the four stages in the mining field. The post-mining space was modeled as a paste backfill with three different cement contents: 5%, 10%, and 15%. In the first stage, the ore deposit was selected in the mining field with the use of 30 m long strips. The width and height of the strip were both 5 m. Pillars with the same dimensions were left between the strips (Figure 10a). Additionally, in order to protect the transportation roadway, 5 m wide pillar barriers were left in the ore deposit. In the second stage, the strips were filled with the cemented paste backfill (Figure 10b). In the third stage, inter-strip pillars were selected, both on the left and on the right (Figure 10c). In the last stage, the space that was left after the pillars had been selected was filled (Figure 10d). The results of numerical modeling of the total displacement are presented in Figure 11, Figure 12, Figure 13 and Figure 14 and in Table 3.
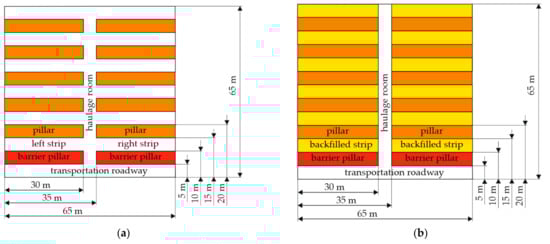
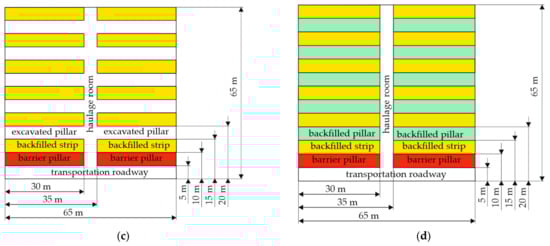
Figure 10.
Underground strip-mining method: (a) without backfilling; (b) backfilled strips; (c) exploited inter-strip pillars; (d) backfilled excavated pillar.
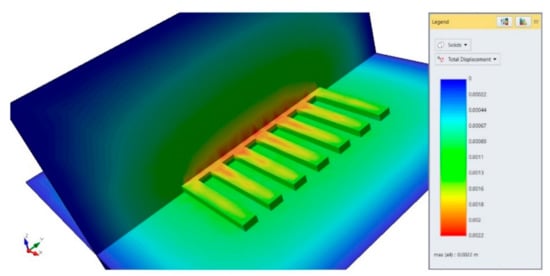
Figure 11.
Total displacement for the mining field without cemented paste backfill.
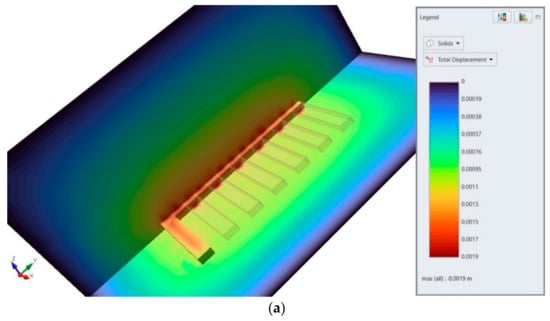
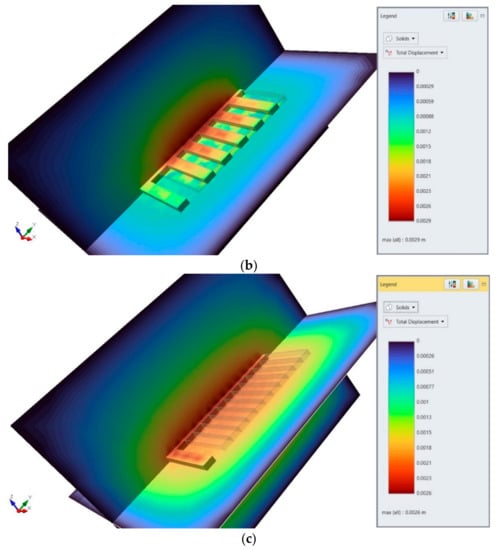
Figure 12.
Total displacement for the mining field with 5% cement content in paste backfill: (a) second stage; (b) third stage; (c) fourth stage.


Figure 13.
Total displacement for the mining field with 10% cement content in paste backfill: (a) second stage; (b) third stage; (c) fourth stage.
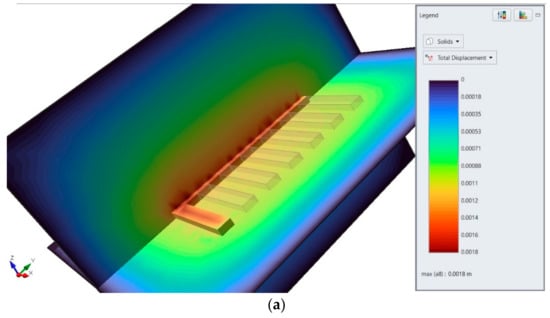

Figure 14.
Total displacement for the mining field with 15% cement content in paste backfill: (a) second stage; (b) third stage; (c) fourth stage.
Table 3.
Summary of the results of the 3D numerical modeling.
4. Discussion
The highest bulk density was obtained by the backfill mixture with the addition of 15% cement, this value was 1893 kg/m3 and was higher by 4.1% and 8.2%, respectively, for the cement content of 10% and 5%. Studies of the curing time of the backfill mixture also showed that the addition of 15% cement contributed to the accelerated curing time, which was 7 h. This was the time after which the steel needle of the Vicat apparatus was submerged to a depth of less than 3 mm, in accordance with the Polish Standard [18]. Lowering the cement content to 10% and 5% increased the curing time to 8 h and 9 h, respectively. In the laboratory tests, sand with a grain size of up to 2 mm was used, which is used in cemented paste backfill technologies [24]. Despite the fact that the cement addition usually has not exceeded a few percent [25], with cemented paste backfill technologies, tests have been performed with the cement content exceeding 10% [26]. The highest compressive strength for cylindrical samples consisting of sand, water, and 5%, 10%, and 15% cement volume additions was obtained after four weeks from the time of preparation. Zhang et al. [27] noticed that, apart from the curing time, the cement–sand ratio determined the strength parameters. Chu et al. [28] concluded that, among the main factors influencing the improvement of strength parameters, in particular the flexural strength of the cemented paste, were the synergistic effects that resulted from the process of metakaolin and silica fume filling the voids between larger particles. Moreover, another parameter contributing to the increase in the strength of the cemented paste is the use of fiber composite materials. Chu [29] found that compressive strength of the infilled cementitious composites increased with the fiber volume. It is also worth mentioning that, for cemented paste with the use of steel fibers, a packing model was developed in which geometrical parameters were taken into account [30]. For the backfill samples with the addition of 5% cement volume, the compressive strength value in the fourth week was 0.535 MPa and was higher by 11%, 32%, and 63%, respectively, compared to the third, second, and first weeks. The addition of 10% by volume of cement increased the compressive strength by 9%, 21%, and 81%, respectively, compared to the third, second, and first weeks. On the other hand, for the backfill samples with the addition of 15% of cement volume, the compressive strength value in the fourth week was 3.473 MPa and was higher by 15%, 33%, and 64%, respectively, compared to the third, second, and first weeks. According to Polish requirements, the minimum load-bearing capacity of the hardened backfill should be 0.5 MPa [18]. Much lower values were obtained in the tensile tests of the samples. As for the compressive strength, the highest tensile strength was achieved in the fourth week for the samples with the addition of 15% cement, which was 1.211 MPa. This was a value greater by 22%, 46%, and 61%, respectively, compared to the third, second, and first weeks. For the cement addition of 10%, the tensile strength value was 0.485 MPa and was higher by 22%, 44%, and 70%, respectively, compared to the third, second, and first weeks. In turn, for the samples with the addition of 5% cement in the fourth week, the tensile strength value was 0.155 MPa and was higher by 21%, 36%, and 56%, respectively, compared to the third, second, and first weeks. The use of a two-sided extraction method with cemented paste backfill enabled the extraction of ore deposits while minimizing operational losses. However, the advantages of this type of backfilling mean that despite certain time limitations, the number of extractions systematically increases [31]. Due to the variety of geological and technical-mining conditions, it is necessary to use mixtures of backfill materials with a variable binder content, which may be cement. For the presented exploitation field with the dimensions of 65 m × 65 m, without application of the backfill, the exploitation losses could be over 45%. Exploitation of the inter-strip pillars, and filling them with cemented paste backfill, reduced operational losses to a value of about 7% (the need to leave barrier pillars to protect the transportation roadway). The obtained results of numerical modeling may be useful for estimating the amount of compression of the backfill material. The size of the backfill compressibility index can be determined according to Equation (2):
where
- a—backfill compressibility index, (%);
- S—the surface of the exploited strip, (m2);
- g1—the average thickness of the backfill after compression, (m);
- g2—the average height of backfilling the strip, (m).
Taking into account the values of floor displacements and floor uplift (Figure 15), the values of g1 and g2 are represented by Equations (3) and (4):
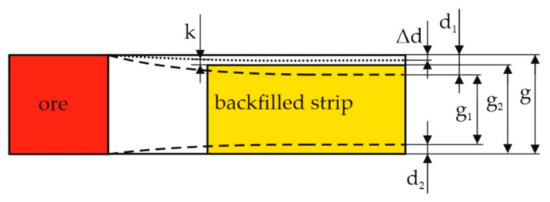
Figure 15.
Compressibility scheme of the backfill.
- g—average thickness of the exploited strip, (m);
- d1—subsidence of the direct roof, (m);
- d2—floor lift, (m);
- k—height not backfilled, (m);
- Δd—subsidence of the roof before backfilling, (m).
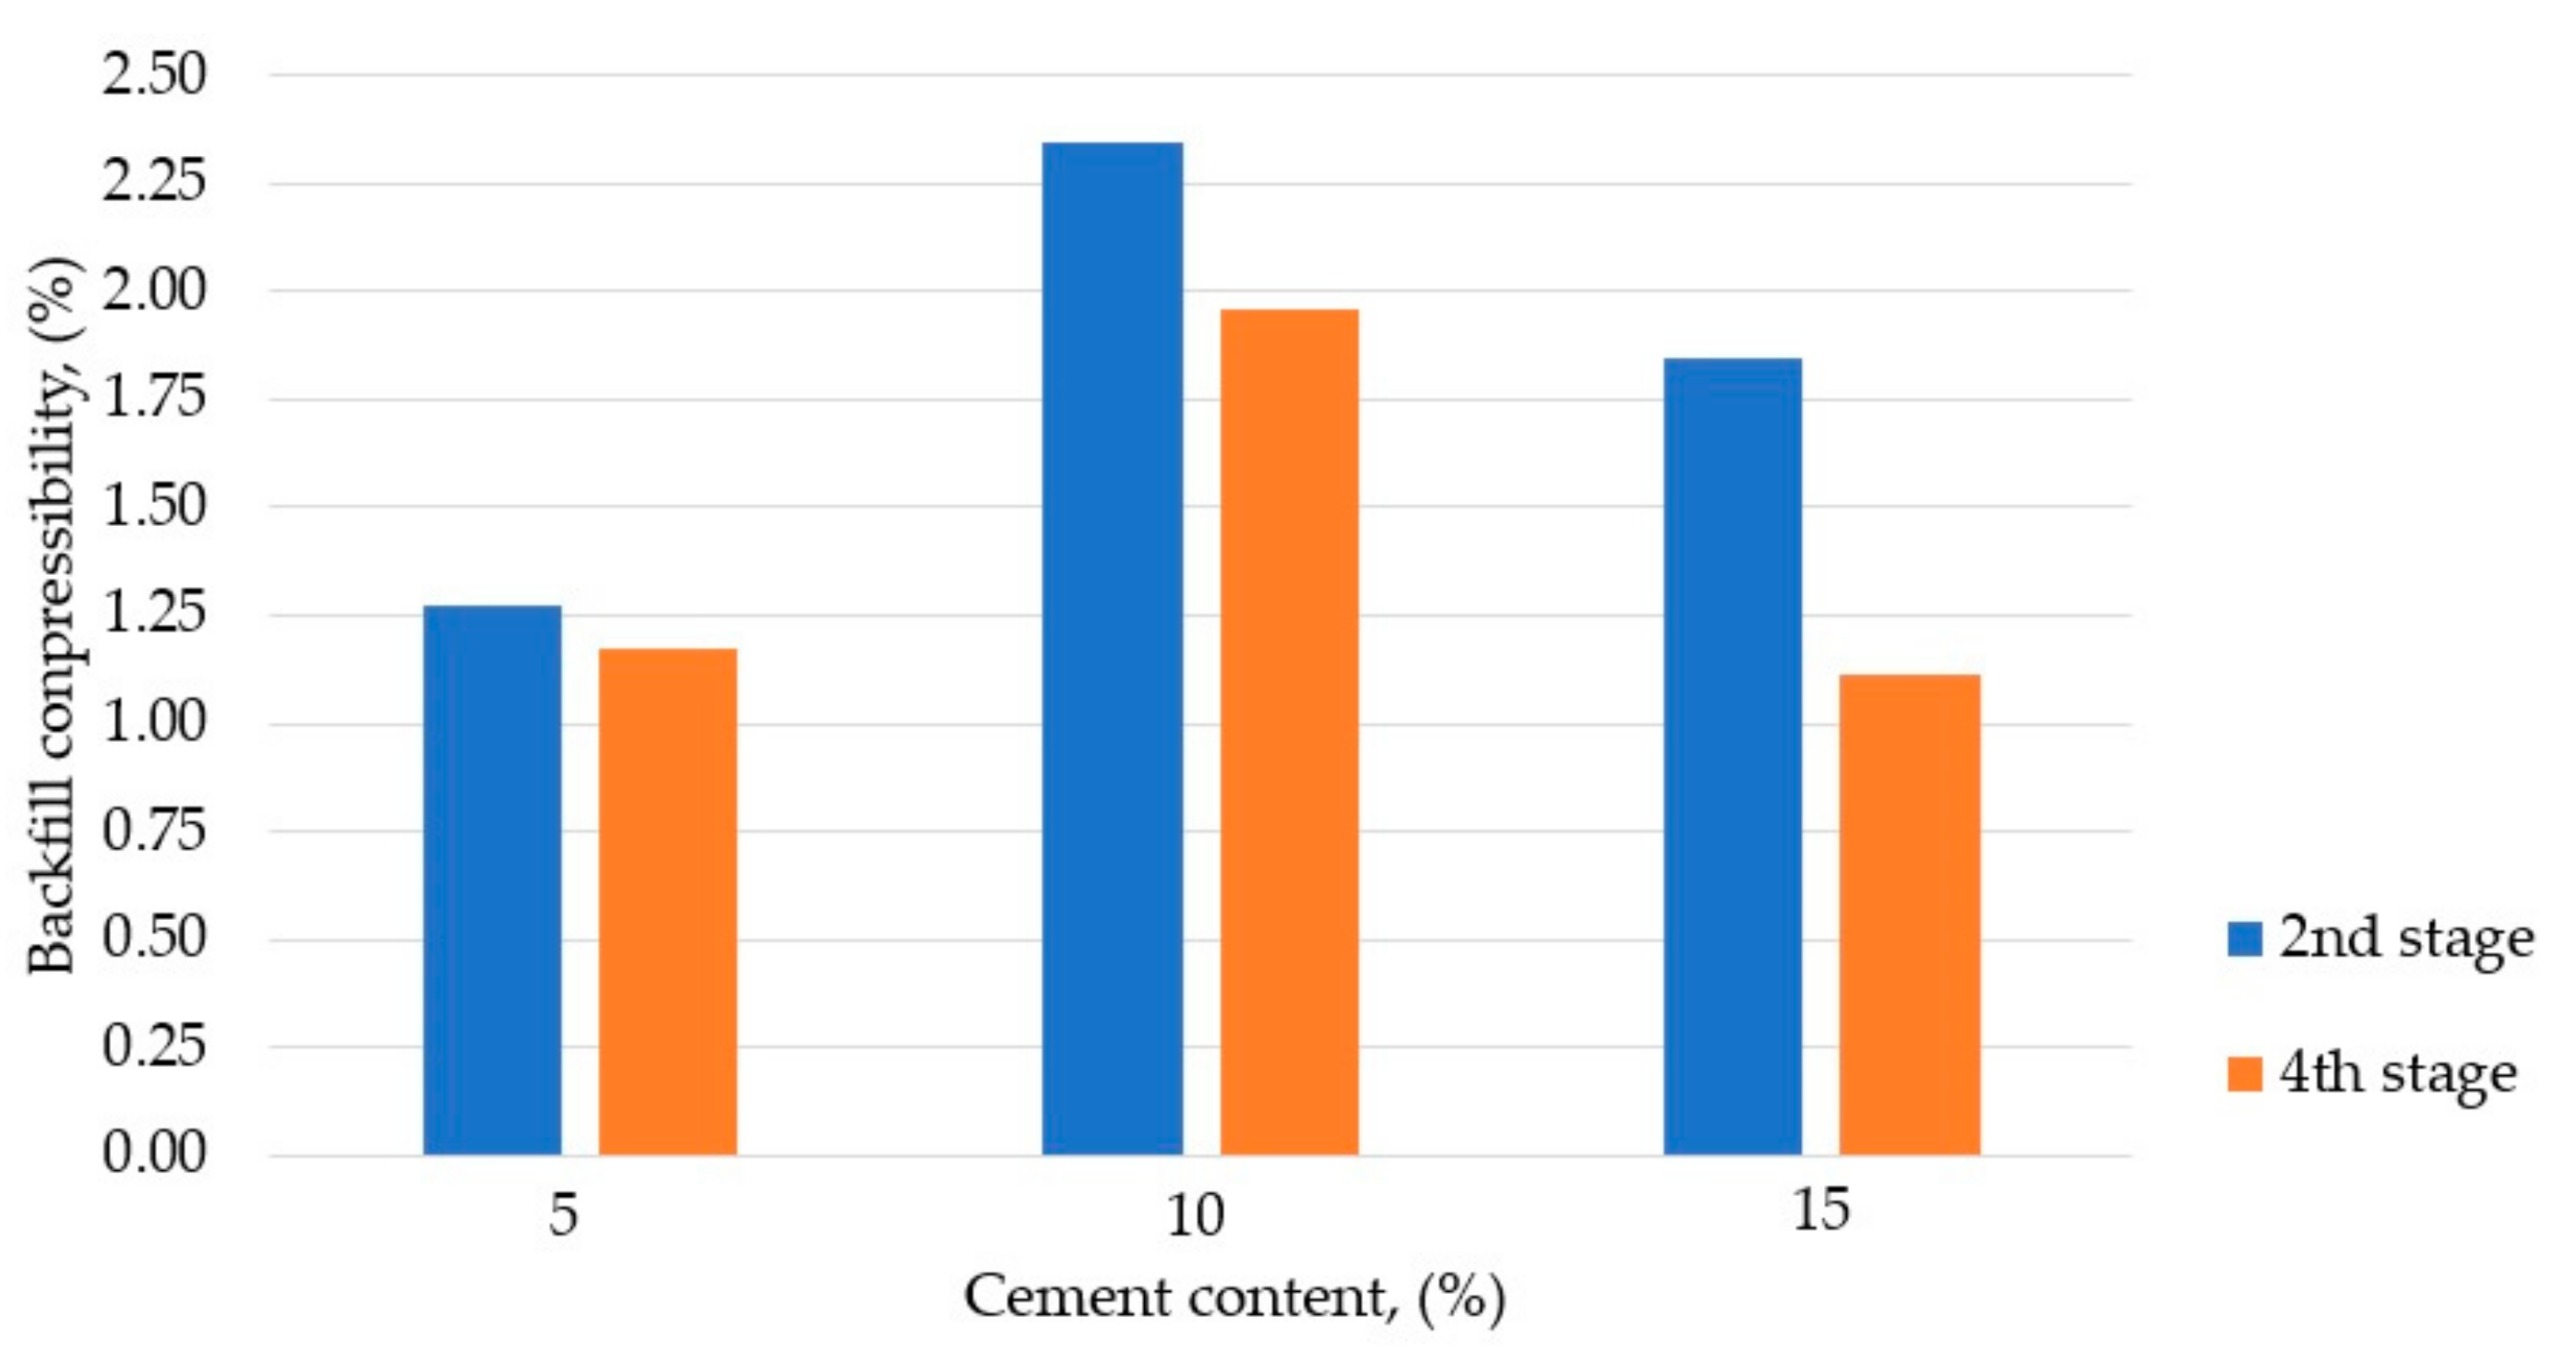
By substituting the data of total displacements from Table 3 into Equations (3) and (4), it is possible to determine the value of the backfill compressibility for the three different cement contents and for the second and fourth stage of filling the excavations with cemented paste. The calculations assumed that S = 150 m2; d1 = d2 = (total displacement for the second, third, and fourth stages); k = 0.01 m; g = 5 m; and Δd = total displacement from the previous stage. The results are shown in Figure 16.
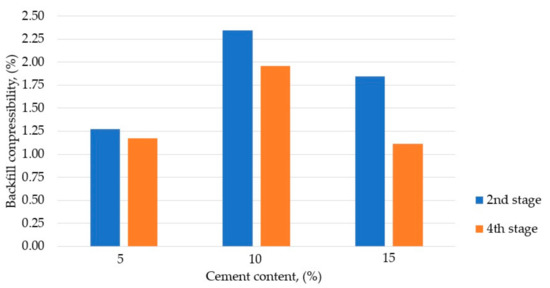
Figure 16.
The dependence of the backfill compressibility on the cement content, taking into account the stages of exploitation and filling the strip excavations.
Filling the post-exploitation space with the backfill with the addition of 5%, 10%, and 15% cement in the fourth stage of the production process (Figure 10d) improved the value of the backfill compressibility by 8%, 17%, and 60%, respectively, compared to the second stage (Figure 10b). Improvement means less deformation of the overlying layers, which directly translates into the stability of the haulage and transportation excavations.
5. Conclusions
The possibility of filling the post-mining space with cemented paste backfill and then exploiting the inter-strip pillars is very advantageous due to the ore deposit utilization factor. However, the long period of obtaining support by the mixture may contribute to the updating of the schedule and the sequence of selecting individual mining fields. Due to the fact that the highest values of both compressive and tensile strengths were achieved in the fourth week, the beginning of the exploitation of the rock pillars should be initiated after this period at the earliest. For the backfill, consisting of sand, water, and different cement volumetric content, it can be concluded that:
- For the cemented paste backfill (15% of cement), the compressive strength in the fourth week was 3.473 MPa and was greater by 54% and 84% for the 10% and 5% cement addition, respectively;
- In the case of tensile strength, the maximum value was 1.211 MPa for cemented paste backfill (15% cement) and was 60% and 87% higher for 10% and 5% cement addition, respectively.
On the basis of numerical modelling for the strip-mining method, it was found that:
- Filling the excavations with 5%, 10%, or 15% cemented paste reduced the total displacement values by 13% and 18%, respectively;
- The exploitation of the inter-strip rock pillars in the third stage of the deposit exploitation caused an increase in displacement by 52%, 44%, and 38%, respectively, compared to the second stage;
- Filling the post-exploitation spaces between artificial pillars with 5%, 10%, and 15% cemented paste reduced the total displacements by 10%, 31%, and 28%, respectively, compared to the third stage of operation;
- The value of the backfill compressibility in the second and fourth stage of filling the strip did not exceed the value of 2.5%, which indicates that the filling effectively contributed to the reduction in displacements around the workings.
Funding
This research received no external funding.
Institutional Review Board Statement
Not applicable.
Informed Consent Statement
Not applicable.
Data Availability Statement
Not applicable.
Conflicts of Interest
The author declares no conflict of interest.
References
- Watari, T.; Nansai, K.; Nakajima, K. Major metals demand, supply, and environmental impacts to 2100: A critical review. Resour. Conserv. Recycl. 2021, 164, 105107. [Google Scholar] [CrossRef]
- Jiang, F.; Zhou, H.; Sheng, J.; Li, X.; Hu, Y.; Zhou, Y. Evaluation of safety and deformation characteristics of cemented tailings backfill mining disturbed area near shafts: A case study in China. Geomech. Geophys. Geo-Energy Geo-Resour. 2020, 6. [Google Scholar] [CrossRef]
- Zhang, J.; Li, M.; Taheri, A.; Zhang, W.; Wu, Z.; Song, W. Properties and Application of Backfill Materials in Coal Mines in China. Minerals 2019, 9, 53. [Google Scholar] [CrossRef] [Green Version]
- Skrzypkowski, K. Decreasing Mining Losses for the Room and Pillar Method by Replacing the Inter-Room Pillars by the Construction of Wooden Cribs Filled with Waste Rocks. Energies 2020, 13, 3564. [Google Scholar] [CrossRef]
- Xu, H.; Apel, D.B.; Wang, J.; Wei, C.; Pourrahimian, Y. Investigation of Backfilling Step Effects on Stope Stability. Mining 2021, 1, 155–166. [Google Scholar] [CrossRef]
- Xu, W.; Li, Q.; Zhang, Y. Influence of temperature on compressive strength, microstructure properties and failure pattern of fiber-reinforced cemented tailings backfill. Constr. Build. Mater. 2019, 222, 776–785. [Google Scholar] [CrossRef]
- Wang, J.; Apel, D.B.; Pu, Y.; Hall, R.; Wei, C.; Sepehri, M. Numerical modeling for rockbursts: A state-of-the-art review. J. Rock Mech. Geotech. 2021, 13, 457–478. [Google Scholar] [CrossRef]
- Bai, E.; Guo, W.; Tan, Y.; Yang, D. The analysis and application of granular backfill material to reduce surface subsidence in China’s northwest coal mining area. PLoS ONE 2018, 13, e0201112. [Google Scholar] [CrossRef] [Green Version]
- Belem, T.; Benzaazoua, M. An overview on the use of paste backfill technology as a ground support method in cut-and-fill mines. In Ground Support in Mining and Underground Construction, Proceedings of the Fifth International Symposium on Ground Support, Perth, Australia, 28–30 September 2004; Villaescusa, E., Potvin, Y., Eds.; Australian Centre for Geomechanics: Perth, Australia, 2004; pp. 637–650. [Google Scholar]
- Chu, S.H.; Kwan, A.K.H. Co-addition of metakaolin and silica fume in mortar: Effects and advantages. Constr. Build. Mater. 2019, 197, 716–724. [Google Scholar] [CrossRef]
- Raffaldi, M.J.; Seymour, J.B.; Richardson, J.; Zahl, E.; Board, M. Cemented Paste Backfill Geomechanics at a Narrow-Vein Underhand Cut-and-Fill Mine. Rock Mech. Rock Eng. 2019, 52, 4925–4940. [Google Scholar] [CrossRef]
- Liu, G.; Li, L.; Yang, X.; Guo, L. Required strength estimation of a cemented backfill with the front wall exposed and back wall pressured. Int. J. Min. Miner. Eng. 2018, 9. [Google Scholar] [CrossRef] [Green Version]
- Zhu, W.; Yu, S.; Xuan, D.; Shan, Z.; Xu, J. Experimental study on excavating strip coal pillars using caving zone backfill technology. Arab. J. Geosci. 2018, 11. [Google Scholar] [CrossRef]
- Feng, X.; Zhang, N.; Gong, L.; Xue, F.; Zheng, X. Application of a Backfilling Method in Coal Mining to Realise an Ecologically Sensitive “Black Gold” Industry. Energies 2015, 8, 3628–3639. [Google Scholar] [CrossRef]
- Lin, H.; Yang, R.; Li, Y.; Fang, S. Stability of Coal Pillar and Roof Movement Characteristics in Roadway Backfill Mining. Adv. Civ. Eng. 2021, 2021, 5588923. [Google Scholar] [CrossRef]
- Shao, X.; Li, X.; Wang, L.; Fang, Z.; Zhao, B.; Liu, E.; Tao, Y.; Liu, L. Study on the Pressure-Bearing Law of Backfilling Material Based on Three-Stage Strip Backfilling Mining. Energies 2020, 13, 211. [Google Scholar] [CrossRef] [Green Version]
- Gang, H.; Kulatilake, P.H.S.W.; Shreedharan, S.; Cai, S.; Song, H. 3-D discontinuum numerical modeling of subsidence incorporating ore extraction and backfilling operations in an underground iron mine in China. Int. J. Min. Sci. Technol. 2017, 27, 191–201. [Google Scholar]
- Polish Standard PN-G-11011. Mining. Materials for Backfilling and Caulking of Caving. Requirements and Tests; Polish Committee for Standardization: Warsaw, Poland, 1998; p. 4. [Google Scholar]
- Chu, S.H. Effect of paste volume on fresh and hardened properties of concret. Constr. Build. Mater. 2019, 218, 284–294. [Google Scholar] [CrossRef]
- Polish Standard PN-EN 196-3. Cement Test Methods-Part 3: Determination of Setting Times and Volume Stability; Polish Committee for Standardization: Warsaw, Poland, 2006; p. 13. [Google Scholar]
- Yu, Y.; Yin, J.; Zhong, Z. Shape effects in the Brazilian tensile strength test and a 3D FEM correction. Int. J. Rock Mech. Min. Sci. 2006, 43, 623–627. [Google Scholar] [CrossRef]
- Rocscience. Available online: https://www.rocscience.com (accessed on 20 September 2021).
- Skrzypkowski, K. Determination of the Backfilling Time for the Zinc and Lead Ore Deposits with Application of the BackfillCAD Model. Energies 2021, 14, 3186. [Google Scholar] [CrossRef]
- Sivakugan, N.; Veenstra, R.; Naguleswaran, N. Underground Mine Backfilling in Australia Using Paste Fills and Hydraulic Fills. Int. J. Geosynth. Ground Eng. 2015, 1, 18. [Google Scholar] [CrossRef] [Green Version]
- Zhao, Y.; Taheri, A.; Karakus, M.; Deng, A.; Guo, L. The Effect of Curing under Applied Stress on the Mechanical Performance of Cement Paste Backfill. Minerals 2021, 11, 1107. [Google Scholar] [CrossRef]
- Han, B.; Zhang, S.; Sun, W. Impact of Temperature on the Strength Development of the Tailing-Waste Rock Backfill of a Gold Mine. Adv. Civ. Eng. 2019, 2019, 4379606. [Google Scholar] [CrossRef]
- Zhang, Q.; Chen, Q.; Wang, X. Cemented Backfilling Technology of Paste-Like Based on Aeolian Sand and Tailings. Minerals 2016, 6, 132. [Google Scholar] [CrossRef] [Green Version]
- Chu, S.H.; Chen, J.J.; Li, L.G.; Ng, P.L.; Kwan, A.K.H. Roles of packing density and slurry film thickness in synergistic effects of metakaolin and silica fume. Powder Technol. 2021, 387, 575–583. [Google Scholar] [CrossRef]
- Chu, S.H. Development of Infilled Cementitious Composites (ICC). Compos. Struct. 2021, 267, 113885. [Google Scholar] [CrossRef]
- Chu, S.H.; Jiang, Y.; Kwan, A.K.H. Effect of rigid fibres on aggregate packing. Constr. Build. Mater. 2019, 224, 326–335. [Google Scholar] [CrossRef]
- Li, Y. Comprehensive Benefit Evaluation of Cemented Paste Backfill in the Mining Industry. Adv. Civ. Eng. 2021, 2021, 6646671. [Google Scholar] [CrossRef]


Publisher’s Note: MDPI stays neutral with regard to jurisdictional claims in published maps and institutional affiliations. |
© 2021 by the author. Licensee MDPI, Basel, Switzerland. This article is an open access article distributed under the terms and conditions of the Creative Commons Attribution (CC BY) license (https://creativecommons.org/licenses/by/4.0/).