Article

An Integrated Fuzzy Fault Tree Model with Bayesian Network-Based Maintenance Optimization of Complex Equipment in Automotive Manufacturing

by
Hamzeh Soltanali
1,
Mehdi Khojastehpour
1,*,
José Torres Farinha
2,3 and
José Edmundo de Almeida e Pais
4,5
1
Department of Biosystems Engineering, Ferdowsi University of Mashhad, Mashhad 9177948974, Iran
2
Centre for Mechanical Engineering, Materials and Processes (CEMMPRE), 3030-199 Coimbra, Portugal
3
Coimbra Institute of Engineering, Polytechnic of Coimbra, 3030-199 Coimbra, Portugal
4
EIGeS—Research Centre in Industrial Engineering, Management and Sustainability, Lusófona University, Campo Grande 376, 1749-024 Lisboa, Portugal
5
CISE—Electromechatronic Systems Research Centre, University of Beira Interior, 6201-001 Covilhã, Portugal
*
Author to whom correspondence should be addressed.
Energies 2021, 14(22), 7758; https://doi.org/10.3390/en14227758
Submission received: 23 August 2021 / Revised: 10 November 2021 / Accepted: 11 November 2021 / Published: 19 November 2021
(This article belongs to the Special Issue Modeling and Optimization of Electrical Systems)

Abstract

:
Process integrity, insufficient data, and system complexity in the automotive manufacturing sector are the major uncertainty factors used to predict failure probability (FP), and which are very influential in achieving a reliable maintenance program. To deal with such uncertainties, this study proposes a fuzzy fault tree analysis (FFTA) approach as a proactive knowledge-based technique to estimate the FP towards a convenient maintenance plan in the automotive manufacturing industry. Furthermore, in order to enhance the accuracy of the FFTA model in predicting FP, the effective decision attributes, such as the experts’ trait impacts; scales variation; and assorted membership, and the defuzzification functions were investigated. Moreover, due to the undynamic relationship between the failures of complex systems in the current FFTA model, a Bayesian network (BN) theory was employed. The results of the FFTA model revealed that the changes in various decision attributes were not statistically significant for FP variation, while the BN model, that considered conditional rules to reflect the dynamic relationship between the failures, had a greater impact on predicting the FP. Additionally, the integrated FFTA–BN model was used in the optimization model to find the optimal maintenance intervals according to the estimated FP and total expected cost. As a case study, the proposed model was implemented in a fluid filling system in an automotive assembly line. The FPs of the entire system and its three critical subsystems, such as the filling headset, hydraulic–pneumatic circuit, and the electronic circuit, were estimated as 0.206, 0.057, 0.065, and 0.129, respectively. Moreover, the optimal maintenance interval for the whole filling system considering the total expected costs was determined as 7th with USD 3286 during 5000 h of the operation time.

1. Introduction

With the advent of new technologies and the increase in the complexity of systems in modern manufacturing industries, reliable and effective maintenance programs are required to ensure high levels of productivity and availability at a low cost and a lower number of unexpected shutdowns [1,2]. In particular, automotive manufacturer industries are required to improve their productivity, process safety, and availability by preventing unexpected failures. Therefore, a reliable maintenance program can provide a beneficial service to fulfil such objectives. Moreover, such industries still suffer from some aleatory uncertainties derived from process integrity and the complexity issues of complex equipment, dependency issues among failures, as well as epistemic uncertainties due to the lack of precise and sufficient data to acquire a well-structured maintenance program [3,4,5,6,7]. Such fluctuations can affect the accuracy estimation of key indicators, such as the failure rate or failure probability (FP), as well as proper maintenance and production programs.
In this context, the fault diagnosis and prognosis approaches have received the most attention from researchers to support proper maintenance programs within process-oriented systems [8,9,10,11]. Moreover, such approaches have been widely used to diagnose critical hotspots, troubleshoot, and continue the monitoring of systems with regard to data-driven- and knowledge-based methods [12,13,14,15,16,17]. Knowledge-based approaches are recognized as very useful techniques that provide data-driven-based methods for evaluating risk and reliability, fault detection, and maintenance decision making to face the imprecise and insufficient data related to equipment failures, environmental factors, and human activities [18,19,20].
There are many types of knowledge-based techniques that chiefly refer to failure/hazard analyses, namely failure mode and effect analysis (FMEA), hazard analysis critical control points (HACCP), hazard and operability study (HAZOP), event tree analysis (ETA), fault tree analysis (FTA) [21,22,23,24,25]. In general, these methods are employed to investigate an accident or failure before or after the occurrence, or in both situations, as well as to describe and trace the causes of failures whilst providing appropriate remedies to predict the failure or prevent it. However, each of these methods uses its own rules to analyze the failure. For example, some approaches follow the bottom-up analysis versus others that adopt a top-down approach to assess the failure consequences. Additionally, some approaches merely have the ability to analyze failures qualitatively, while other models, in addition to the qualitative analysis of a system’s status, possess other capabilities, such as quantitative analysis. In addition, some methods have an advantage in complex environments/systems, while other failure analysis models do not have such capabilities, and so on [18,26,27].
Since this study seeks to determine the FP considering the major uncertainty factors, such as complexity and integrity issues as well as the insufficient failure data in manufacturing processes, the FTA technique was used as the main method among other failure models, whose results could also be used in the planning of maintenance intervals. In fact, the FTA technique is recognized as a powerful diagnosis tool that has been one of the most important knowledge-based methods since the twentieth century. It is a deductive procedure in which the combinations of both system faults and human errors can be determined [28,29]. In general, the FTA analyses are classified into qualitative and quantitative levels. In qualitative analysis, the tree networks are transferred into minimal cut sets consisting of the smallest combinations of basic events to cause the top event. In quantitative analysis, the estimating FP value for the TE and other indicators present importance measures that are mathematically computed [30,31]. After designing the FTA structure, the outcomes can present some indicators about system reliability and enable the analysist to determine which units of a system are in urgent risk; therefore, the corrective actions can adapt for such critical units. In fact, the analysis procedure reflects how failures of units, human error, or environmental factors can result in the system failure [32,33]. Furthermore, FTA are regularly being performed to improve product quality and availability through the prevention of unexpected failures using the convenient maintenance activities in various industrial systems [34,35,36,37,38,39].
Therefore, the present study attempts to estimate the FP by proposing a new framework of maintenance optimization using an improved FTA technique. Moreover, this paper focuses on computational intelligence and decision tree network techniques, proposing key attributes to deal with the epistemic uncertainty and static limitations. Consequently, the proposed framework of maintenance optimization can help engineers to make better decisions on how to improve the availability and safety of complex equipment concerning automotive production lines.
The remainder of this paper is structured as follows: “Literature Review of FTA” deals with a summary of literature related to the FTA concept and its diverse applications and drawbacks; “Research Methodology” presents a new framework for maintenance optimization using an improved FTA intervening the computational intelligence and graphical techniques; “Results and Discussion” presents the main results of the proposed framework by means of an empirical case study; and, finally, “Conclusion”, summarizes the final remarks and future directions.

2. Literature Review of FTA

The FTA technique has been extensively used within numerous industrial systems aimed at diverse applications; for instance, the assessment of system safety in a nuclear reactor and gas distribution systems [33,40]; the diagnosis and prognosis of faults/failures in electric power, electronic components, pipelines, and aerospace [41,42]; the implication of maintenance tasks in medical devices, mining, chemical processes, and mechanical systems [36,37,43,44]; and the analysis of FP values in automotive, chemical, and petrochemical processes [39,45,46].
Despite many advantages and the successful feedback of the FTA technique to estimate the FP values, the technique includes some limitations, such as the simplification of the model due to the system’s complexity and the lack of knowledge about the system’s behavior; an assumption of the independence of events; and the possibility of human error while specifying the logical structure of fault trees and the presence of the redundant or common cause failures [28,29]. Such fluctuations can affect the accuracy of the expected analysis, especially for the FP results, and the implementation of the proper corrective decisions and solutions. Therefore, to improve the credibility of the results of FTA, it is imperative that the uncertainties are addressed. The computational intelligence and decision tree network techniques/theories have been commonly addressed to take the uncertainties into account and supplement the classical FTA calculations.
In this context, the fuzzy set theory has been widely used to handle the uncertainty issues of FTA, while estimating FP in various industrial applications. Recently, Aghaei et al. [47] developed a fuzzy FTA (FFTA) model for the risk assessment of functional safety in shopping center construction projects to determine the FP. Their results indicated that the proposed model could offer the suitable management responses to functional risks by considering the uncertainties. In another study, Yazdi et al. [48] established an FFTA using expert opinions to compute the FP values in an uncertain environment. In order to reduce the probability of the top events in terms of three parameters (safety consequences, costs, and benefits), an importance measurement technique was employed. Akhtar and Kirmani [49] applied an FFTA framework for the reliability evaluation of a wind energy system. The outcomes showed that the fuzzy-based technique can combine the imprecision and inaccuracy of probabilities in reliability engineering. Zhou and Ren [50] conducted a novel FFTA method in the assumption of the values of the probability of basic events expressed with triangular intuitionistic fuzzy numbers. The example of a weapon system is employed to reflect the effectiveness of the proposed FFTA method. In another study, a novel approach to evaluate system FPs was developed using the FFTA with qualitative failure data. In this study, the linguistic terms are quantified by triangular intuitionistic fuzzy numbers. However, the effect of other membership functions was not investigated [51]. A FFTA framework to address some uncertainties concerning the classical FTA model, e.g., the crisp values of FPs, ignoring human errors, and the lack of historical data, was carried out to predict the FP of oil and natural gas pipelines. The outcomes of the developed FFTA model can help safety professionals while making decisions related to the risk management of oil and gas pipelines [52]. Moreover, a remarkable number of studies have been produced for fault diagnosis, probability of failures, and risk and reliability analysis, under various variabilities and uncertainties, using the FFTA model [53,54,55,56]. Prior to such studies, Rajakarunakaran et al. [57] proposed an FFTA model to quantify the fault tree of the LPG refueling facility in the absence or existence of data. The qualitative expert assessment was conducted using fuzzy logic to accommodate the uncertainties in the process. The results revealed that the approach was extremely beneficial for the probabilistic reliability estimation when quantitative historical failure data are scarce or are not available at all.
On the other hand, the decision tree networks, especially the Bayesian networks (BNs), have been dominant in overcoming the static structure limitation of the FTA, while estimating the FP. In fact, BNs as the well-known graphical model tend to create a causal relationship between events in a system [58,59,60]. BN analysis, depending on the scope of the analysis, can be qualitative, quantitative, or both, in the reliability and risk domains [61,62,63,64]. In recent years, the integrated FTTA–BN model has been extremely effective in handling the major subjective uncertainties of the classical template of FTA aimed at FP analysis, fault analysis, and failure diagnosis and prognosis [65,66,67,68].
Based on literature, in order to build up the integrated FTTA–BN models in uncertain environments, the recent studies often use the triangular (Trimf) or trapezoidal (Trapmf) as the core membership function, the center of gravity (Centroid) technique as the main defuzzification algorithm, and the three- or five-linguistic scale as the main fuzzy numbers to estimate the FP. However, to the best of the authors knowledge, the accuracy and capability of the other types of functions and algorithms have not yet been investigated by researchers. As main contribution, this study seeks to make a comprehensive survey of various influential and decision-making factors, including the assorted membership functions the linguistic scale of fuzzy numbers, and the defuzzification of algorithms to ensure a well-established FTTA–BN model, against the recent integrated models, while estimating FP. As its main innovation, subsequently, the results of the FP values acquired from integrated FTTA–BN models, along with the total expected cost, were used in the optimization model to find the optimal maintenance intervals. As its main motivation, due to the process integrity and complexity issue of new equipment, dependency between the failures of the units, as well as the importance of the safety guarantee in manufacturing systems, the proposed model was implemented in a complex fluid filling system in an Iranian automotive industry. Therefore, the main objective of this study is to obtain an optimal maintenance interval using a developed FTTA–BN model aimed at helping the engineers to manage the operation and maintenance tasks, effectively.

3. Methodology

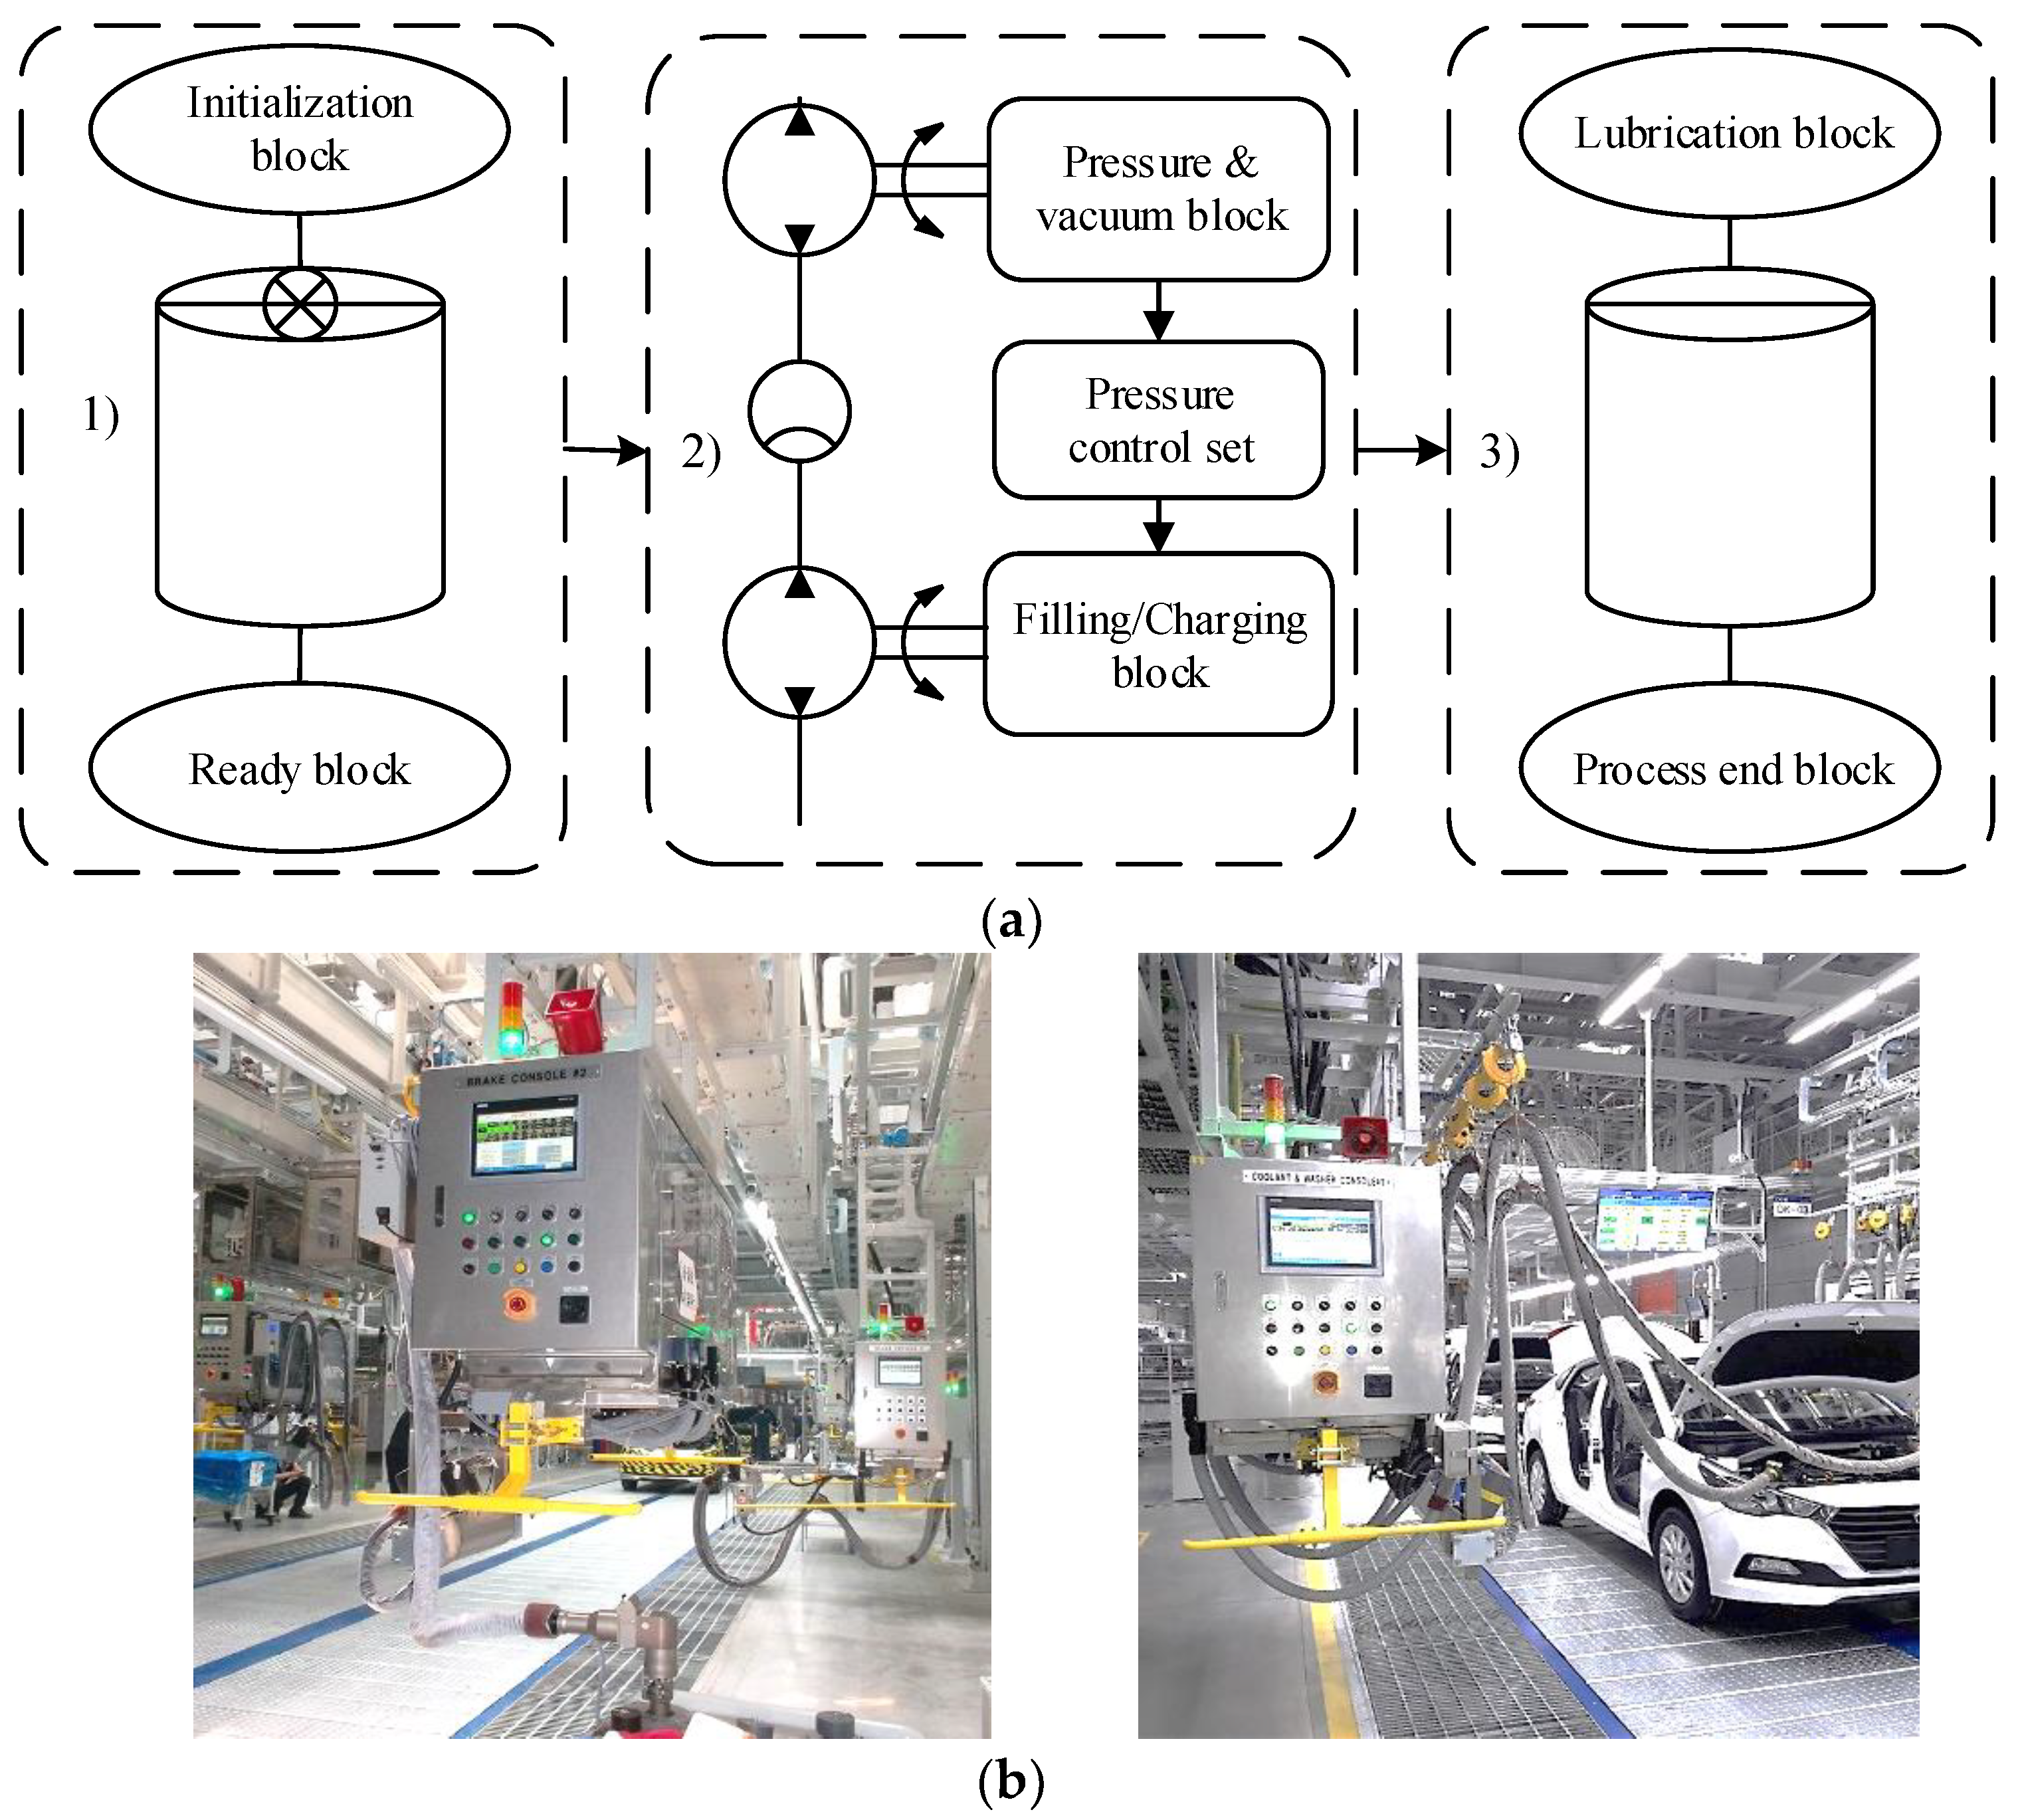
3.1. System Description

The reliability and safety guarantees of complex equipment, such as fluid filling systems in automotive manufacturing, are the key to preventing unexpected failures. Such systems suffer from crucial uncertainties, including sufficient operational data, the dependency between the failure of units, and the complexity of processes that cause some problems in the accuracy of the prediction of the failure probability [19,22]. Therefore, to overcome such uncertainties, this study proposes an integrated FTTA–BN model to enhance the accuracy prediction of the failure probability to be able to acquire a reliable maintenance program. The main functions of a filling system consist of levelling, filling, and controlling the leakages. Figure 1a,b represents the critical blocks of the system and its general filling operation in an Iranian automotive assembly line. The initialization, pressure, vacuum, filling, lubrication, and process ending are the main critical blocks of the system which are presented in Figure 1a. As can be observed, the process of releasing the pressure, due to the fullness of the tanker, takes place in the initialization block. In the second category, the vacuum pump, pressure control set (PCS), and filling pump are enabled to measure pressure/vacuum level. Following the vacuum and pressure settings, the filling block is allowed to fill the liquids and monitor the level of fluids. Subsequently, the lubrication block is circulated to provide the required oil during the filling process (Figure 1).

3.2. Research Theory

Figure 2 represents an improved framework for the integrated FFTA–BN model to achieve a reliable maintenance program for the complex fluid filling systems considering all possible uncertainties. The construction of FTA and BN models, expert judgment processes, and maintenance optimization are three key factors in the proposed framework. First, the top events are identified as the main problem. Subsequently, the classification of the computations into qualitative and quantitative levels is performed. For the qualitative analysis, the FTA structure is constructed to determine the root cause of the top event affected by intermediate events and basic events, as well as to clarify the relationship of events, statically, with the aid of logic gates at the level of the system’s components. Following this, and supported in the quantitative analysis, the knowledge of the experts and the fuzzy set theory are used to calculate the probability of failure and the system reliability in terms of each minimal cut set in the FFTA model. The results of the FFTA are employed as input factors in the BN structure; so, the reliability function is predicted under the dynamic relationship between events. Finally, the results of the combined FFTA–BN model are applied to optimization model to predict the optimal maintenance intervals. The details of each step are illustrated in Figure 2.

3.2.1. Theory of the FTA Approach

FTA belongs to the deductive methods used to identify the occurrences in equipment or systems that can result in system failure. It provides interrelations between occurrences through a graphic representation that can result in system failure [69,70]. Graphic symbols are commonly used to set up the FTA structure. For instance, from the logic gates, the OR gate indicates that there is an occurrence at the output, since there is at least one entry. Moreover, the AND gate implies that there is an occurrence at the output only when there are simultaneous occurrences in all entries [71,72]. In the quantitative analysis level of FTA, the FP of TE or P(T), by estimating the FP of BEs or P(Xi) under AND/OR gates, can be computed as follows [73]:
P ( T ) = { i = 1 N P ( X i ) f o r A N D g a t e 1 i = 1 N ( 1 P ( X i ) ) f o r O R g a t e
where N is the number of Bes, P(Xi) is the FP of the event Xi, and P(T) is the probability of failure of top event. The FP of the TE is evaluated by obtaining its minimal cut sets. Once all the minimal cut sets, denoted by Ci (i = 1, 2, …, Nc), where Nc is the number of minimal cut sets, are determined, the FP of the top event, denoted by P(T), is given as:
P ( T ) = 1 i = 1 N c ( 1 P ( C i ) )
where P(Ci) is the FP of Ci. As long as the FPs of the BEs are small (i.e., P(Xi) ≤ 1), the above estimate of P(T) can be approximated by Equation (3):
P ( T ) i = 1 N c P ( C i )

Expert Judgment Process

There are several ways to compute the probability of all Bes, such as expert judgment, extrapolation, and statistical-based methods. In this study, the experts’ knowledge is used to calculate the probability of failures. Due to the various attributes belonging to the experts, such as age, expertise, skill, experience, and knowledge level, they can lead to a number of uncertainties in the probability of failure values. Therefore, such heterogeneity must be addressed while creating the FTA team. The main experts’ attributes and their weights are described in Table 1 [19].
The weighting score of an expert is the summation of these weights for attributes. The weighting factor for each expert was then computed by Cheliyan and Bhattacharyya (2018):
Weighting   factor   of   the   expert = Weighting   score   of   the   expert Sum   of   weighting   scores   of   all   experts
Table 2 shows how the experts weighed and judged the process of FTA in the current study.

Fuzzy Set Theory

Additionally, linguistic expressions were used to fulfil the experts’ opinions about the probability of the BEs. Moreover, the fuzzy numbers were adapted to handle such linguistic expressions. In fact, the fuzzy set theory uses linguistic variables capable of providing a flexible model of imprecise data and information [74,75]. To enhance the accuracy of current FFTA for predicting FPs, the 3-scale, 5-scale, and 10-scale of fuzzy numbers based on the 4 types of membership functions, namely triangular-shaped (Trimf), trapezoidal-shaped (Trapmf), Π-shaped (Pimf), and Gaussian (Gaussmf), as well as 5 algorithms, including the centroid; bisector; smallest of maximum (som); middle of maximum (mom); and largest of maximum (lom), were assessed in the fluid filling systems (Table 3, Table 4 and Table 5) [76,77,78,79].

Aggregation Process

This process was appointed to aggregate the expert’s judgments which are provided via the five following steps [55]:
1.
Computing the similarity degree of opinion between two experts S ( A ˜ , B ˜ ) , Equation (5):
S ( A ˜ , B ˜ ) = 1 1 J i = 1 J | a i b i |
where J is a membership function parameter; ai and bi are also parameters of the membership function.
2.
Computing the average of agreement (AA) degree (AA(Eu)) of an expert’s opinions, Equation (6):
A A ( E u ) = 1 J 1 v = 1 , u v J S ( R ˜ u , R ˜ v )
3.
Calculating the relative agreement (RA(Eu)) degree (RA(Eu)) of all experts, Equation (7):
E u ( u = 1 , 2 , J ) a s R A ( E u ) = A A ( E u ) u = 1 J A A ( E u )
4.
Estimating the coefficient degree of expert’s judgment (CC(Eu)), Equation (8):
C C ( E u ) = β W ( E u ) + ( 1 β ) R A ( E u )
where W is the weight of each expert, β is the relaxation factor (0 ≤ β ≤ 1).
5.
Finally, calculating the aggregated result of the expert’s opinions ( R ˜ A G ), Equation (9):
R ˜ A G = C C ( E 1 ) R ˜ 2 C C ( E 2 ) R ˜ 2 C C ( E m ) R ˜ M
where R ˜ A G   is a fuzzy set that requires defuzzification algorithms to be converted into a single point value called the fuzzy possibility score (FPS), which represents the possibility of the basic events.

Computing the FP of Basic and Top Events

Finally, the FPS of all basic events must be converted to their FP or P(Xi), in which the values can vary between 0 and 1. The FP, as defined by Onisawa [80], is given by Equation (10):
P ( x ) = { 1 10 k f o r F P S 0 0 f o r F P S = 0 k = 2.301 ( 1 F P S F P S ) 1 3
A computer programming was deployed in MATLAB-vR-2020b (Mathworks Inc., Natick, MA, USA) to calculate the P(Xi) in the FFTA model.

3.3. Mapping the FFTA into the BN Model

In order to handle the static drawback of the FFTA model and to display the dynamic relationship of failures within the case study, a Bayesian updating mechanism was conducted, which provided a causal relationship between the causes and effects in a system. It entailed a set of random variables represented by root, intermediate, and leaf nodes, bounded by oriented arcs or a directed acyclic graph and was accompanied by their conditional dependencies. In the BN, a node from which an edge/link is directed to another node is called “parent”, while the other node to which the edge is called “child”. The probabilities of the root events were assigned to the corresponding root nodes as prior probabilities, while, for intermediate nodes as well as the leaf nodes (top event), conditional probability tables should be developed [19]. In this study, the results of the FP are considered as prior probability for estimating the posterior probability in BN. Given the conditional dependency of variables and the chain rule, BN represents the joint probability distribution of a set of variables T = {X1, , Xn}, as follows:
P ( T ) = i = 1 n ( P ( X i | P a ( X i ) )
where Pa(Xi) is the parent set of variables Xi. The probability of Xi is calculated according to Equation (12):
P ( X i ) = x i j i P ( T )
During the BN analysis, a series of evidence (E) is examined, and the posterior or updated probability distribution of Xi can be calculated using the Bayesian theorem, as follows:
P ( X i | E ) = P ( X i , E ) P ( E ) = P ( E | X i ) · P ( X i ) V P ( X i | E ) · P ( X i )
where, P (Xi|E) is the posterior probability under a given evidence E, P(Xi) is the prior probability of event Xi, P(E|Xi) is the evidence likelihood of the given event Xi, P(E) is the pre-defined posterior probability of evidence, and V P ( X i | E ) · P ( X i ) is the joint probability distribution of E. The Bayesian network mapping process, as well as related calculations, was made using GeNIe 3.0 academic software.

3.4. Maintenance Optimization Model

In this subsection, the outcomes of he developed FFTAt–BN model, specifically the probability of failures and reliability indexes, were employed in the maintenance optimization model. The optimal maintenance interval for cycle T (planning horizon) has been proposed by Rezaei [81]. It assumes that failures occur at the times kτ (τ, 2τ, …, kτ), and the repair is made at the end of cycle T (for k = n, at the time nτ). τ is the time between two consecutive maintenances: it means that τ = T/n. The objective is to find the optimal maintenance interval time to minimize the total expected cost of the system over cycle T. Hence, the total expected cost in the kth inspection for each cycle ( τ ) is given by Equation (14):
( i = 1 n k = 1 T τ ( τ i I W I + τ i I P ) + i = 1 n k = 1 T τ ( R e i + τ i R W R + τ i R P ) ( 1 R ( k τ ) ) + i = 1 n k = 1 T τ ( τ i P F P + L ) ( 1 R ( k τ ) ) ) E τ [ C T o t a l T ] = i = 1 n k = 1 T τ E τ [ C i ( k 1 ) τ , k τ ] τ = T , T / 2 , T / 3 , , T / T
where E τ [ C T o t a l T ] is the total expected cost, W is the inspection/preventive cost, Re is the repair/perfect replacement cost, P is the production loss cost, and L is the downtime cost. In accordance with the work of Rezaei [81], the optimal maintenance interval can be estimated as follows:
η C = i = 1 n k = 1 T τ E τ [ C i ( k 1 ) τ , k τ ] k · 0 τ R   ( k τ ) d t
where η C (k τ ) is the optimal maintenance interval at k τ ( τ , 2 τ ,…, k τ ), and R(k τ ) is the computed reliability based on the proposed FTTA–BN model.

4. Results and Discussion

4.1. The FFTA–BN Model Results

Figure 3 represents an FTA structure for all possible faults in complex filling equipment as TE. The operational units of system include the filling headset, the hydraulic–pneumatic circuit, and the electronic circuit. The hydraulic–pneumatic circuit is in charge of the fluid injection by filling pump, controlling the pressure using PCS, and transferring the air and various fluids through the pipes and fittings. The electronic circuit consist of an anti-lock braking system (ABS), starter set, and several sensors, such as a detector, temperature, and pressure. The filling headset is mounted on the vehicles and includes the mini-valves, pipes, couplings, and seals.
Table 6 illustrates 33 basic events for the fluid filling system that are linked directly and/or indirectly to the specified top event. In order to calculate the FP of basic events, the questionnaire-based method was employed involving a group of experts related to the complex filling system in an Iranian automotive production line, and their opinion to express the lowest to highest value of FPs from 1 to 10 for each basic event. The experts’ characteristics and their weighting results are provided in Table 3 to complete the process judgment in the FTA approach.
The fuzzy linguistic expressions, considering various fuzzy scales and diverse membership functions, and defuzzification algorithms were used to fulfil the experts’ judgments to be able to predict the FP of basic events related to the fluid filling system. Figure 4a–e displays the impact of 4 membership functions subjected to the 3-scale, 5-scale, and 10-scale of fuzzy numbers for predicting the FP of basic events, respectively. As can be observed, Figure 4a,b reflects the effect of 4 membership functions in the 3-scale of fuzzy numbers and their statistics test results. The average values of the FP under Trimf, Trapmf, Pimf, and Gaussmf of membership functions in the 3-scale of fuzzy numbers were obtained as the following values: 0.006, 0.006, 0.005, and 0.007, respectively. Based on the mean comparison test (Tukey’s test), there was no significant difference between the membership functions in the 3-scale of fuzzy numbers for estimating the FP, statistically (p value > 0.05). In other words, if an interval does not contain zero, the corresponding means that they are not significantly different. Figure 4c,d shows the effect of 4 membership functions in the 5-scale of fuzzy numbers and their statistics test results for estimating the FP. The average values of FP under Trimf, Trapmf, Pimf, and Gaussmf membership functions in 5-scale of fuzzy numbers were acquired as the following values: 0.008, 0.008, 0.005 and 0.007, respectively. As can be observed, based on Tukey’s test, there is no significant difference between the membership functions in 5-scale of fuzzy numbers for estimating the FP, statistically (p value > 0.05). These results are also similar for the membership functions in 10-scale of fuzzy, for which the outcomes are shown in Figure 4e,f. Therefore, it can be concluded that the impact of 4 membership functions subjected to 3-scale, 5-scale, and 10-scale of fuzzy numbers was not significant, statistically, for predicting the FP of basic events.
Figure 5a,b shows the effects of various scales of fuzzy numbers and their statistics test results for estimating the FP of basic events. The average values of FP under 3-, 5-, and 10-scale of fuzzy numbers were obtained as the following values: as 0.006, 0.007 and 0.009, respectively. As observed, based on Tukey’s test, there was no significant difference between 3-, 5-, and 10-scale of fuzzy numbers for predicting the FP, statistically (p value > 0.05). In other words, if an interval did contain zero, the corresponding means were not significantly different.
Additionally, the various defuzzification algorithms were compared to determine the FP of basic events, for which the results are presented in Figure 6a,b. The average values of FP under centroid, bisector, mom, lom, and som defuzzification algorithms were obtained as 0.008, 0.009, 0.010, 0.008, and 0.102, respectively. The comparison mean test shows that there is no significant difference between the defuzzification algorithms for predicting the FP, statistically (p value > 0.05). Since, in FFTA model, the effect of various attributes, such as the scales variation and assorted membership, and the defuzzification functions were not statistically significant, the average values can be considered to estimate the FP of basic events in the fluid filling system.
Moreover, due to the static structure assumption of the FFTA model throughout the estimation of the FP of basic events, the Bayesian mechanism was employed to consider all possible dynamic interactions between the components. The FFTA model was mapped into the BN structure, shown in Figure 7. In this BN, G.1 was a leaf node that corresponded to the TE of the FTA model, and G.2 to G.16 were the intermediate nodes associated with the intermediate events of the FTA model, in which the conditional probability values of each node were occupied based on the type of logic gates (state = 0 means faulty, state = 1 means healthy) using GeNIe 3.0 software (Figure 8).
The average values of the FP derived from the FFTA method were used as the prior probability values of the root nodes in the Bayesian mechanism, to predict the posterior FP while considering all possible dynamic interactions between the BEs. Moreover, Figure 9 shows the comparison of the results of the FP based on the FFTA and BN models for the hydraulic–pneumatic circuit, electronic circuit, and filling headset of the filling system, along with their critical components. As can be observed, since the BN method approaches the dynamic relationship between events, the FP values are higher in most cases with that of the results of the FFTA model. According to the BN analysis, the FP of the leaf node (G.1), or failure of the whole filling system, was estimated as 0.206, for which the system reliability was approximately 0.813. Furthermore, the FPs of the intermediate nodes, including 3 subsystems, such as the filling headset (G.2), the hydraulic–pneumatic circuit (G.3), and the electronic circuit (G.4) were obtained as 0.057, 0.065, and 0.129, respectively, in which the reliability was around 0.945, 0.936, and 0.879, respectively. Among other sub-intermediate nodes, the ABS’s failure (G.15), the starter’s fault (G.14), the mini-valve’s fault (G.7), the pipe’s failure (G.8), and the coupling’s fault (G.8) are allocated the highest FP values of 0.075, 0.058, 0.030, 0.029, and 0.027, respectively. In addition, the FP of the system components, such as the adapter’s failure (basic event.14) with a 0.042 FP and a disruption of the cable (basic event.15) with a 0.034 related to ABS unit, an operation error (basic event.12), with a 0.030 FP and a failure of the power button (basic event.13) with a 0.019 FP related to state’s failure as well as being affected by a more function fault (basic event.1) with a 0.014 FP related to the O-ring and seal’s failure, had the highest rank at the root node level in the BN model. Consequently, it was also beneficial to perform the convenient maintenance and inspection programs to prevent such failures/faults with the highest FP in the fluid filling systems in automotive production lines.

4.2. Maintenance Optimization Results

A scheduled maintenance model was proposed and subjected to the total expected cost (e.g., repair cost, inspection/preventive cost, and downtime cost), as well as the computed FP or reliability derived from the above BN model for a finite period (5000 h of operation). As shown in Figure 10a, for the whole fulling filling system, the optimal maintenance intervals considering the repair, inspection, downtime, and total expected costs are estimated as 18th, 4th, 10th, and 7th, respectively, with USD 1967, USD 469, USD 176, and USD 3286, during the plan horizon (T = 5000 h), respectively. Moreover, Figure 10b displays the optimal maintenance intervals for each component of the fluid filling system based on the total expected cost. The optimal number of intervals for the mini-valves, PCS, valves, sensors, O-rings, and the seals, starter, coupling, and vacuum pump, were obtained as 10th, 5th, 4th, 5th, 3rd, 6th, and 11th, respectively, with USD 475, USD 34, USD 21, USD 75, USD 58, USD 471, and USD 1630, during the plan horizon (T = 5000 h), respectively. The majority of failures affecting the vacuum pump were related to the fatigue and strain of spring, as well as the filter’s failure due to frequent usage. The corrosion of the O-ring and seals, due to the chemical impact of fluids, resulted in leakages in the couplings and mini-valves in the filling headset. The previously mentioned maintenance activities/intervals can help the engineers to detect and prevent the unexpected failures to achieve improved safety levels and the availability of the complex fluid filling system in the automotive production line.

5. Conclusions

This study proposed a knowledge-based framework for the optimization of the maintenance intervals in manufacturing systems. Knowledge-based approaches are recognized as quite useful alternatives along with data-driven-based methods for evaluating risk and reliability, fault detection, and maintenance decision making to face the imprecise and insufficient data related to equipment failures, environmental factors, and human activities. The authors developed an FTA approach to find an optimized scheduled-based maintenance with subjective information derived by domain experts. Since the classical FTAs are subjected to epistemic uncertainty and static structure limitations, the fuzzy set theory and Bayesian mechanism were conducted to overcome such problems by statistical analyzing the effective attributes, such as experts’ trait impacts, scales variation, assorted membership, and defuzzification functions. The results revealed that, in the fuzzy model, the changes in the decision attributes were not statistically significant for the FP estimation, while the Bayesian model considered conditional rules to reflect the interaction between events that had more of an impact on the FP values. Ultimately, the result of integrated FTTA–BN model was employed in the optimization model to find the optimal maintenance intervals associated with the estimated FP values and the total expected cost. To demonstrate the feasibility of the proposed framework, it implemented complex filling equipment in an automotive assembly process. Consequently, the proposed framework can help engineers to make better decisions on how to improve the availability and safety of complex equipment in the automotive manufacturing systems. For further research, we suggest employing the random forests methods and their combination with hybrid models to diagnose and analyze the failures in automotive systems, as well as their comparison with the FFTA–BN model, proposed in the present study.

Author Contributions

Conceptualization, H.S. and M.K.; Data curation, M.K.; Formal analysis, H.S. and M.K.; Methodology, H.S.; Resources, M.K.; Software, H.S.; Supervision, M.K. and J.T.F.; Validation, M.K., J.T.F. and J.E.d.A.e.P.; Visualization, J.T.F. and J.E.d.A.e.P.; Writing—original draft, H.S. and J.E.d.A.e.P.; Writing—review & editing, H.S., M.K., J.T.F. and J.E.d.A.e.P. All authors have read and agreed to the published version of the manuscript.

Funding

This research project was supported and funded by the Ferdowsi University of Mashhad, Iran (No.FUM-52316). Also, the research leading to these results has received funding from the European Union’s Horizon 2020 research and innovation programme, under the Marie Sklodowvska-Curie grant agreement 871284 project SSHARE, the European Regional Development Fund (ERDF) through the Operational Programme for Competitiveness and Internationalization (COMPETE 2020), under Project POCI-01-0145-FEDER-029494, and by National Funds through the FCT—Portuguese Foundation for Science and Technology, under Projects PTDC/EEI-EEE/29494/2017, UIDB/04131/2020, and UIDP/04131/2020.

Institutional Review Board Statement

Not applicable.

Data Availability Statement

The data that support the findings of this study are available from the corresponding author, upon reasonable request.

Acknowledgments

The authors gratefully acknowledge the financial support from the Ferdowsi University of Mashhad, Iran (No. FUM-52316), which has been research project.

Conflicts of Interest

The authors declare no conflict of interest for this article.

References

  1. Ayvaz, S.; Alpay, K. Predictive maintenance system for production lines in manufacturing: A machine learning approach using IoT data in real-time. Expert Syst. Appl. 2021, 173, 114598. [Google Scholar] [CrossRef]
  2. Holgado, M.; Macchi, M.; Evans, S. Exploring the impacts and contributions of maintenance function for sustainable manufacturing. Int. J. Prod. Res. 2020, 58, 7292–7310. [Google Scholar] [CrossRef]
  3. Jadidi, N.; Bazdar, A.A. Safety Risk Management in Production Process: A case study in the automotive supplier industry. Int. J. Reliab. Risk Saf. Theory Appl. 2020, 3, 85–95. [Google Scholar] [CrossRef]
  4. Soltanali, H.; Rohani, A.; Tabasizadeh, M.; Abbaspour-Fard, M.H.; Parida, A. Operational reliability evaluation-based maintenance planning for automotive production line. Qual. Technol. Quant. Manag. 2020, 17, 186–202. [Google Scholar] [CrossRef] [Green Version]
  5. Soltanali, H.; Garmabaki, A.H.S.; Thaduri, A.; Parida, A.; Kumar, U.; Rohani, A. Sustainable production process: An application of reliability, availability, and maintainability methodologies in automotive manufacturing. Proceedings of the Institution of Mechanical Engineers. Part O J. Risk Reliab. 2019, 233, 682–697. [Google Scholar] [CrossRef] [Green Version]
  6. Fudzin, A.F.; Majid, M.A. Reliability and availability analysis for robot subsystem in automotive assembly plant: A case study. In IOP Conference Series: Materials Science and Engineering; IOP Publishing: Bristol, UK, 2015; Volume 100, p. 012022. [Google Scholar]
  7. Macher, G.; Höller, A.; Sporer, H.; Armengaud, E.; Kreiner, C.A. A combined safety-hazards and security-threat analysis method for automotive systems. In International Conference on Computer Safety, Reliability, and Security; Springer: Cham, Switzerland, 2014; pp. 237–250. [Google Scholar]
  8. Soltanali, H.; Rohani, A.; Abbaspour-Fard, M.H.; Farinha, J.T. A comparative study of statistical and soft computing techniques for reliability prediction of automotive manufacturing. Appl. Soft Comput. 2021, 98, 106738. [Google Scholar] [CrossRef]
  9. Chemweno, P.; Pintelon, L.; Muchiri, P.N.; Van Horenbeek, A. Risk assessment methodologies in maintenance decision making: A review of dependability modelling approaches. Reliab. Eng. Syst. Saf. 2018, 173, 64–77. [Google Scholar] [CrossRef]
  10. Alizadeh, S.; Sriramula, S. Reliability modelling of redundant safety systems without automatic diagnostics incorporating common cause failures and process demand. ISA Trans. 2017, 71, 599–614. [Google Scholar] [CrossRef]
  11. Kiran, S.; Kumar, K.P.; Sreejith, B.; Muralidharan, M. Reliability evaluation and Risk based maintenance in a process plant. Procedia Technol. 2016, 24, 576–583. [Google Scholar] [CrossRef] [Green Version]
  12. Djeziri, M.A.; Benmoussa, S.; Mouchaweh, M.S.; Lughofer, E. Fault diagnosis and prognosis based on physical knowledge and reliability data: Application to MOS Field-Effect Transistor. Microelectron. Reliab. 2020, 110, 113682. [Google Scholar] [CrossRef]
  13. Das, A.K.; Leung, C.K. A fundamental method for prediction of failure of strain hardening cementitious composites without prior information. Cem. Concr. Compos. 2020, 114, 103745. [Google Scholar] [CrossRef]
  14. Garmabaki, A.H.S.; Marklund, S.; Thaduri, A.; Hedström, A.; Kumar, U. Underground pipelines and railway infrastructure–failure consequences and restrictions. Struct. Infrastruct. Eng. 2020, 16, 412–430. [Google Scholar] [CrossRef]
  15. Gao, Z.; Cecati, C.; Ding, S.X. A survey of fault diagnosis and fault-tolerant techniques—Part II: Fault diagnosis with knowledge-based and hybrid/active approaches. IEEE Trans. Ind. Electron. 2015, 62, 3768–3774. [Google Scholar] [CrossRef]
  16. Gao, Z.; Cecati, C.; Ding, S.X. A survey of fault diagnosis and fault-tolerant techniques—Part I: Fault diagnosis with model-based and signal-based approaches. IEEE Trans. Ind. Electron. 2015, 62, 3757–3767. [Google Scholar] [CrossRef] [Green Version]
  17. Alzghoul, A.; Backe, B.; Löfstrand, M.; Byström, A.; Liljedahl, B. Comparing a knowledge-based and a data-driven method in querying data streams for system fault detection: A hydraulic drive system application. Comput. Ind. 2014, 65, 1126–1135. [Google Scholar] [CrossRef]
  18. Leimeister, M.; Kolios, A. A review of reliability-based methods for risk analysis and their application in the offshore wind industry. Renew. Sustain. Energy Rev. 2018, 91, 1065–1076. [Google Scholar] [CrossRef]
  19. Yazdi, M.; Soltanali, H. Knowledge acquisition development in failure diagnosis analysis as an interactive approach. Int. J. Interact. Des. Manuf. 2019, 13, 193–210. [Google Scholar] [CrossRef] [Green Version]
  20. Kumar, S. A knowledge-based reliability engineering approach to manage product safety and recalls. Expert Syst. Appl. 2014, 41, 5323–5339. [Google Scholar] [CrossRef]
  21. Jin, C.; Ran, Y.; Zhang, G. Interval-valued q-rung orthopair fuzzy FMEA application to improve risk evaluation process of tool changing manipulator. Appl. Soft Comput. 2021, 104, 107192. [Google Scholar] [CrossRef]
  22. Soltanali, H.; Rohani, A.; Tabasizadeh, M.; Abbaspour-Fard, M.H.; Parida, A. An improved fuzzy inference system-based risk analysis approach with application to automotive production line. Neural Comput. Appl. 2020, 32, 10573–10591. [Google Scholar] [CrossRef]
  23. Zhang, G.; Thai, V.V.; Yuen, K.F.; Loh, H.S.; Zhou, Q. Addressing the epistemic uncertainty in maritime accidents modelling using Bayesian network with interval probabilities. Saf. Sci. 2018, 102, 211–225. [Google Scholar] [CrossRef]
  24. Yildiz, A.E.; Dikmen, I.; Birgonul, M.T.; Ercoskun, K.; Alten, S. A knowledge-based risk mapping tool for cost estimation of international construction projects. Autom. Constr. 2014, 43, 144–155. [Google Scholar] [CrossRef]
  25. Venkatasubramanian, V.; Rengaswamy, R.; Yin, K.; Kavuri, S.N. A review of process fault detection and diagnosis: Part I: Quantitative model-based methods. Comput. Chem. Eng. 2003, 27, 293–311. [Google Scholar] [CrossRef]
  26. Pasman, H. Chapter 3-Loss Prevention History and Developed Methods and Tools. In Risk Analysis and Control for Industrial Processes—Gas, Oil and Chemicals; Butterworth-Heinemann: Oxford, UK, 2015; pp. 79–184. [Google Scholar] [CrossRef]
  27. Singh, R. Pipeline Integrity: Management and Risk Evaluation; Gulf Professional Publishing: Houston, TX, USA, 2017. [Google Scholar]
  28. Kumar, M.; Kaushik, M. System failure probability evaluation using fault tree analysis and expert opinions in intuitionistic fuzzy environment. J. Loss Prev. Process Ind. 2020, 67, 104236. [Google Scholar] [CrossRef]
  29. Yazdi, M.; Kabir, S.; Walker, M. Uncertainty handling in fault tree-based risk assessment: State of the art and future perspectives. Process Saf. Environ. Prot. 2019, 131, 89–104. [Google Scholar] [CrossRef]
  30. Bobbio, A.; Portinale, L.; Minichino, M.; Ciancamerla, E. Improving the analysis of dependable systems by mapping fault trees into Bayesian networks. Reliab. Eng. Syst. Saf. 2001, 71, 249–260. [Google Scholar] [CrossRef]
  31. Summers, A.E. Viewpoint on ISA TR84. 0.02—Simplified Methods and Fault Tree Analysis. ISA Trans. 2000, 39, 125–131. [Google Scholar] [CrossRef]
  32. Kabir, S.; Geok, T.K.; Kumar, M.; Yazdi, M.; Hossain, F. A method for temporal fault tree analysis using intuitionistic fuzzy set and expert elicitation. IEEE Access 2019, 8, 980–996. [Google Scholar] [CrossRef]
  33. Berrouane, M.T.; Lounis, Z. Safety assessment of flare system by fault tree analysis. J. Chem. Technol. Metall. 2016, 51, 229–234. [Google Scholar]
  34. James, A.T.; Gandhi, O.P.; Deshmukh, S.G. Fault diagnosis of automobile systems using fault tree based on digraph modeling. Int. J. Syst. Assur. Eng. Manag. 2018, 9, 494–508. [Google Scholar] [CrossRef]
  35. Liu, Y.; Wu, Y.; Kalbarczyk, Z. Smart maintenance via dynamic fault tree analysis: A case study on Singapore MRT system. In Proceedings of the 2017 47th Annual IEEE/IFIP International Conference on Dependable Systems and Networks (DSN), Denver, CO, USA, 26–29 June 2017; pp. 511–518. [Google Scholar]
  36. Rusin, A.; Wojaczek, A. Application of fault tree analysis in the maintenance intervals planning for power unit systems. Arch. Energetyki 2012, 42, 95–106. [Google Scholar]
  37. Rice, W.P. Medical device risk-based evaluation and maintenance using fault tree analysis. Biomed. Instrum. Technol. 2007, 41, 76–82. [Google Scholar] [CrossRef]
  38. Lapp, S.A. Applications of fault tree analysis to maintenance interval extension and vulnerability assessment. Process Saf. Prog. 2005, 24, 91–97. [Google Scholar] [CrossRef]
  39. Lambert, H.E. Use of fault tree analysis for automotive reliability and safety analysis. SAE Trans. 2004, 113, 690–696. [Google Scholar]
  40. Purba, J.H.; Lu, J.; Zhang, G.; Ruan, D. Failure possibilities for nuclear safety assessment by fault tree analysis. Int. J. Nucl. Knowl. Manag. 2011, 5, 162–177. [Google Scholar] [CrossRef]
  41. Volkanovski, A.; Čepin, M.; Mavko, B. Application of the fault tree analysis for assessment of power system reliability. Reliab. Eng. Syst. Saf. 2009, 94, 1116–1127. [Google Scholar] [CrossRef]
  42. Yuhua, D.; Datao, Y. Estimation of failure probability of oil and gas transmission pipelines by fuzzy fault tree analysis. J. Loss Prev. Process Ind. 2005, 18, 83–88. [Google Scholar] [CrossRef]
  43. Gupta, S.; Ramkrishna, N.; Bhattacharya, J. Replacement and maintenance analysis of longwall shearer using fault tree technique. Min. Technol. 2006, 115, 49–58. [Google Scholar] [CrossRef]
  44. Khan, F.I.; Haddara, M. Risk-based maintenance (RBM): A new approach for process plant inspection and maintenance. Process Saf. Prog. 2004, 23, 252–265. [Google Scholar] [CrossRef]
  45. Baig, A.A.; Ruzli, R.; Buang, A.B. Reliability analysis using fault tree analysis: A review. Int. J. Chem. Eng. Appl. 2013, 4, 169. [Google Scholar] [CrossRef] [Green Version]
  46. Kim, H.; Koh, J.S.; Kim, Y.; Theofanous, T.G. Risk assessment of membrane type LNG storage tanks in Korea-based on fault tree analysis. Korean J. Chem. Eng. 2005, 22, 1–8. [Google Scholar] [CrossRef]
  47. Aghaei, P.; Asadollahfardi, G.; Katabi, A. Safety risk assessment in shopping center construction projects using Fuzzy Fault Tree Analysis method. Qual. Quant. 2021, 1–17. [Google Scholar] [CrossRef]
  48. Yazdi, M.; Korhan, O.; Daneshvar, S. Application of fuzzy fault tree analysis based on modified fuzzy AHP and fuzzy TOPSIS for fire and explosion in the process industry. Int. J. Occup. Saf. Ergon. 2020, 26, 319–335. [Google Scholar] [CrossRef]
  49. Akhtar, I.; Kirmani, S. An Application of Fuzzy Fault Tree Analysis for Reliability Evaluation of Wind Energy System. IETE J. Res. 2020, 1–14. [Google Scholar] [CrossRef]
  50. Zhou, H.; Ren, H. A novel ranking function-based triangular intuitionistic fuzzy fault tree analysis method. J. Intell. Fuzzy Syst. 2020, 39, 2753–2761. [Google Scholar] [CrossRef]
  51. Kuzu, A.C.; Akyuz, E.; Arslan, O. Application of fuzzy fault tree analysis (FFTA) to maritime industry: A risk analysing of ship mooring operation. Ocean Eng. 2019, 179, 128–134. [Google Scholar] [CrossRef]
  52. Badida, P.; Balasubramaniam, Y.; Jayaprakash, J. Risk evaluation of oil and natural gas pipelines due to natural hazards using fuzzy fault tree analysis. J. Nat. Gas Sci. Eng. 2019, 66, 284–292. [Google Scholar] [CrossRef]
  53. Yazdi, M.; Zarei, E. Uncertainty handling in the safety risk analysis: An integrated approach based on fuzzy fault tree analysis. J. Fail. Anal. Prev. 2018, 18, 392–404. [Google Scholar] [CrossRef]
  54. Yazdi, M.; Darvishmotevali, M. Fuzzy-based failure diagnostic analysis in a chemical process industry. In International Conference on Theory and Applications of Fuzzy Systems and Soft Computing; Springer: Cham, Switzerland, 2018; pp. 724–731. [Google Scholar]
  55. Yazdi, M.; Nikfar, F.; Nasrabadi, M. Failure probability analysis by employing fuzzy fault tree analysis. Int. J. Syst. Assur. Eng. Manag. 2017, 8, 1177–1193. [Google Scholar] [CrossRef]
  56. Yazdi, M. Hybrid probabilistic risk assessment using fuzzy FTA and fuzzy AHP in a process industry. J. Fail. Anal. Prev. 2017, 17, 756–764. [Google Scholar] [CrossRef]
  57. Rajakarunakaran, S.; Kumar, A.M.; Prabhu, V.A. Applications of fuzzy faulty tree analysis and expert elicitation for evaluation of risks in LPG refueling station. J. Loss Prev. Process Ind. 2015, 33, 109–123. [Google Scholar] [CrossRef]
  58. Zheng, Y.; Zhao, F.; Wang, Z. Fault diagnosis system of bridge crane equipment based on fault tree and Bayesian network. Int. J. Adv. Manuf. Technol. 2019, 105, 3605–3618. [Google Scholar] [CrossRef]
  59. Rausand, M. Risk Assessment: Theory, Methods, and Applications; John Wiley & Sons: Hoboken, NJ, USA, 2013; Volume 115. [Google Scholar]
  60. Jong, C.G.; Leu, S.S. Bayesian-network-based hydro-power fault diagnosis system development by fault tree transformation. J. Mar. Sci. Technol. 2013, 21, 367–379. [Google Scholar]
  61. Bouejla, A.; Chaze, X.; Guarnieri, F.; Napoli, A. A Bayesian network to manage risks of maritime piracy against offshore oil fields. Saf. Sci. 2014, 68, 222–230. [Google Scholar] [CrossRef] [Green Version]
  62. Hänninen, M.; Banda, O.A.V.; Kujala, P. Bayesian network model of maritime safety management. Expert Syst. Appl. 2014, 41, 7837–7846. [Google Scholar] [CrossRef]
  63. Huang, H.Z.; Zuo, M.J.; Sun, Z.Q. Bayesian reliability analysis for fuzzy lifetime data. Fuzzy Sets Syst. 2006, 157, 1674–1686. [Google Scholar] [CrossRef]
  64. Khakzad, N.; Khan, F.; Amyotte, P. Quantitative risk analysis of offshore drilling operations: A Bayesian approach. Saf. Sci. 2013, 57, 108–117. [Google Scholar] [CrossRef]
  65. Aydin, M.; Akyuz, E.; Turan, O.; Arslan, O. Validation of risk analysis for ship collision in narrow waters by using fuzzy Bayesian networks approach. Ocean Eng. 2021, 231, 108973. [Google Scholar] [CrossRef]
  66. Yazdi, M.; Kabir, S. A fuzzy Bayesian network approach for risk analysis in process industries. Process Saf. Environ. Prot. 2017, 111, 507–519. [Google Scholar] [CrossRef]
  67. Smith, D.; Veitch, B.; Khan, F.; Taylor, R. Understanding industrial safety: Comparing Fault tree, Bayesian network, and FRAM approaches. J. Loss Prev. Process Ind. 2017, 45, 88–101. [Google Scholar] [CrossRef]
  68. Chiremsel, Z.; Said, R.N.; Chiremsel, R. Probabilistic fault diagnosis of safety instrumented systems based on fault tree analysis and Bayesian network. J. Fail. Anal. Prev. 2016, 16, 747–760. [Google Scholar] [CrossRef]
  69. Vesely, W.E.; Goldberg, F.F.; Roberts, N.H.; Haasl, D.F. Fault Tree Handbook; Nuclear Regulatory Commission: Washington, DC, USA, 1981.
  70. Fussell, J.B. Fault tree analysis: Concepts and techniques. In Pressure Vessels and Piping: Design and Analysis; American Society of Mechanical Engineers: New York, NY, USA, 1976. [Google Scholar]
  71. Geymayr, J.A.; Ebecken, N.F. Fault-tree analysis: A knowledge-engineering approach. IEEE Trans. Reliab. 1995, 44, 37–45. [Google Scholar] [CrossRef]
  72. Farinha, J.M.T. Asset Maintenance Engineering Methodologies, 1st ed.; CRC Press: Boca Raton, FL, USA, 2018; ISBN1 1138035890. ISBN2 978-1138035898. [Google Scholar]
  73. Cheliyan, A.S.; Bhattacharyya, S.K. Fuzzy fault tree analysis of oil and gas leakage in subsea production systems. J. Ocean Eng. Sci. 2018, 3, 38–48. [Google Scholar] [CrossRef]
  74. Zadeh, L.A.; Klir, G.J.; Yuan, B. Fuzzy Sets, Fuzzy Logic, and Fuzzy Systems: Selected Papers; World Scientific: Singapore, 1996. [Google Scholar]
  75. Zhao, R.; Govind, R. Defuzzification of fuzzy intervals. Fuzzy Sets Syst. 1991, 43, 45–55. [Google Scholar] [CrossRef]
  76. Hsu, H.M.; Chen, C.T. Aggregation of fuzzy opinions under group decision making. Fuzzy Sets Syst. 1996, 79, 279–285. [Google Scholar]
  77. Muller, T.E. Buyer response to variations in product information load. J. Appl. Psychol. 1984, 69, 300. [Google Scholar] [CrossRef]
  78. Nicolis, J.S.; Tsuda, I. Chaotic dynamics of information processing: The “magic number seven plus-minus two” revisited. Bull. Math. Biol. 1985, 47, 343–365. [Google Scholar] [PubMed]
  79. Tong, X.; Fang, W.; Yuan, S.; Ma, J.; Bai, Y. Application of Bayesian approach to the assessment of mine gas explosion. J. Loss Prev. Process Ind. 2018, 54, 238–245. [Google Scholar] [CrossRef]
  80. Onisawa, T. An approach to human reliability in man-machine systems using error possibility. Fuzzy Sets Syst. 1988, 27, 87–103. [Google Scholar] [CrossRef]
  81. Rezaei, E. A new model for the optimization of periodic inspection intervals with failure interaction: A case study for a turbine rotor. Case Stud. Eng. Fail. Anal. 2017, 9, 148–156. [Google Scholar] [CrossRef] [Green Version]
Figure 1. A filling system in an Iranian automotive assembly line. (a) Block diagram, and (b) functioning view.
Energies 14 07758 g001
Figure 2. The proposed framework of the FFTA–BN structure-based maintenance optimization.
Energies 14 07758 g002
Figure 3. The FTA structure for the failures in a complex filling system in an Iranian automotive production line.
Energies 14 07758 g003
Figure 4. The results of FP for basic events considering the effects of membership functions.
Energies 14 07758 g004
Figure 5. The results of FP for basic events considering the effects of various scales of fuzzy numbers.
Energies 14 07758 g005
Figure 6. The results of FP for basic events considering the effects of defuzzification algorithms.
Energies 14 07758 g006
Figure 7. Bayesian network of the FFTA model in Figure 3.
Energies 14 07758 g007
Figure 8. The conditional probability process of intermediate nodes based on logic gates in GeNIe 3.0 software.
Energies 14 07758 g008
Figure 9. The comparison results of the FFTA and BN models.
Energies 14 07758 g009
Figure 10. The optimal maintenance intervals for the (a) whole system and (b) critical components.
Energies 14 07758 g010
Table 1. Weight rating according to the experts’ attributes.
ItemCategoriesWeightItemCategoriesWeight
EducationPh.D5Profession PositionHigh-Ranking Academic5
Master4Low-Ranking Academic4
Bachelor3Engineer3
Associate2Technician2
Diploma1Worker1
AgeMore than 404Job TenureMore than 205
36–39316–204
30–35210–153
Less than 3016–92
≤ 51
Table 2. Expert weighting of the group decision-making for the present study.
ExpertEducationAgeProfession PositionJob TenureWeighting Score (w)
Expert 1:Bachelor (3)36 (2)Process Engineer (3)15 (3)0.234
Expert 2:Master (4)38 (3)Mechanical Engineer (3)13 (3)0.276
Expert 3:Bachelor (3)46 (2)Electrical Engineer (3)16 (4)0.255
Expert 4:Bachelor (3)42 (2)Safety Engineer (3)14 (3)0.234
Total139121347/47 = 1
Table 3. 3-scale fuzzy number with 4 membership functions.
CategoryLinguistic ExpressionMembership FunctionFuzzy Number
1, 2, 3Low (L)Trapmf(0.0, 0.0, 0.02, 0.04)
Trimf(0.0, 0.02, 0.04)
Gaussmf(0, 0, 0.07, 0.22)
Pimf(0.0, 0.0, 0.22, 0.38)
4, 5, 6, 7Medium (M)Trapmf(0.23, 0.47, 0.53, 0.77)
Trimf(0.2, 0.5, 0.8)
Gaussmf(0.10, 0.47, 0.50, 0.53)
Pimf(0.23, 0.47, 0.53, 0.77)
8, 9, 10High (H)Trapmf(0.6, 0.8, 1.0, 1.0)
Trimf(0.6, 0.8, 1.0)
Gaussmf(0.7, 0.8, 0.9, 1.0)
Pimf(0.62, 0.78, 1.0, 1.0)
Table 4. 5-scale fuzzy number with 4 membership functions.
CategoryLinguistic ExpressionMembership FunctionFuzzy Number
1Very low (VL)Trapmf(0.0, 0.0, 0.1, 0.2)
Trimf(0.0, 0.1, 0.2)
Gaussmf(0.0, 0.0, 0.03, 0.11)
Pimf(0.00, 0.00, 0.11, 0.19)
2, 3Low (L)Trapmf(0.1, 0.2, 0.3, 0.4)
Trimf(0.05, 0.25, 0.45)
Gaussmf(0.03, 0.19, 0.03, 0.31)
Pimf(0.11, 0.19, 0.31, 0.39)
4, 5, 6Medium (M)Trapmf(0.3, 0.4, 0.6, 0.7)
Trimf(0.20, 0.50, 0.80)
Gaussmf(0.03, 0.39, 0.03, 0.61)
Pimf(0.31, 0.39, 0.61, 0.69)
7, 8High (H)Trapmf(0.6, 0.7, 0.8, 0.9)
Trimf(0.55, 0.75, 0.95)
Gaussmf(0.03, 0.69, 0.03, 0.81)
Pimf(0.61, 0.69, 0.81, 0.89)
9, 10Very high (VH)Trapmf(0.8, 0.9, 1.0, 1.0)
Trimf(0.8, 0.9, 1.0)
Gaussmf(0.03, 0.89, 1.00, 1.00)
Pimf(0.81, 0.89, 1.00, 1.00)
Table 5. 10-scale fuzzy number with 4 membership functions.
CategoryLinguistic ExpressionMembership FunctionFuzzy NumberRankLinguistic ExpressionMembership FunctionFuzzy Number
1Very Low
(VL)
Trimf(0.0, 0.1, 0.2)6More or Less high
(MH)
Trimf(0.5, 0.6, 0.7)
Trapmf(0.01, 0.09, 0.11, 0.19)Trapmf(0.51, 0.59, 0.61, 0.69)
Gaussmf(0.03, 0.09, 0.03, 0.11)Gaussmf(0.03, 0.59, 0.03, 0.61)
Pimf(0.01, 0.09, 0.11, 0.19)Pimf(0.51, 0.59, 0.61, 0.69)
2Low (L)Trimf(0.1, 0.2, 0.3)7Fairly High
(FH)
Trimf(0.6, 0.7, 0.8)
Trapmf(0.11, 0.19, 0.21, 0.29)Trapmf(0.61, 0.69, 0.71, 0.79)
Gaussmf(0.03, 0.19, 0.03, 0.21)Gaussmf(0.03, 0.69, 0.03, 0.71)
Pimf(0.11, 0.19, 0.21, 0.29)Pimf(0.61, 0.69, 0.71, 0.79)
3Fairly Low
(FL)
Trimf(0.2, 0.3, 0.4)8High
(H)
Trimf(0.7, 0.8, 0.9)
Trapmf(0.21, 0.29, 0.31, 0.39)Trapmf(0.71, 0.79, 0.81, 0.89)
Gaussmf(0.03, 0.29, 0.03, 0.31)Gaussmf(0.03, 0.79, 0.03, 0.81)
Pimf(0.21, 0.29, 0.31, 0.39)Pimf(0.71, 0.79, 0.81, 0.89)
4More or Less Low
(ML)
Trimf(0.3, 0.4, 0.5)9Very High
(VH)
Trimf(0.8, 0.9, 1.0)
Trapmf(0.31, 0.39, 0.41, 0.49)Trapmf(0.81, 0.89, 0.91, 0.99)
Gaussmf(0.03, 0.39, 0.03, 0.41)Gaussmf(0.03, 0.89, 0.03, 0.91)
Pimf(0.31, 0.39, 0.41, 0.49)Pimf(0.81, 0.89, 0.91, 0.99)
5Medium
(M)
Trimf(0.4, 0.5, 0.6)10Extremely High
(VH)
Trimf(0.9, 1.0, 1.0)
Trapmf(0.41, 0.49, 0.51, 0.59)Trapmf(0.91, 0.99, 1.00, 1.00)
Gaussmf(0.03, 0.49, 0.03, 0.51)Gaussmf(0.03, 0.99, 1.00, 1.00)
Pimf(0.41, 0.49, 0.51, 0.59)Pimf(0.91, 0.99, 1.00, 1.00)
Table 6. The details of the basic events under experts’ judgments.
UnitComponentBasic Event (BE) TagBEs DescriptionExpert 1Expert 2Expert 3Expert 4
Filling headset failureO-rings and Seal’s failureBE.1Effected more function9558
BE.2High pressure of fluids4553
Coupling’s failureBE.3Hitting due to falling5657
BE.4Operation error5675
BE.5High pressure liquefied material6534
BE.6Leakage6785
Mini-valve’s failureBE.7Effected more function7856
BE.8High pressure of fluids7535
Electronic circuit failureSensor’s failureBE.9Effected more function3558
BE.10PLC circuit disturbance3432
Stater’s failureBE.11Disturbance in PLC circuit3555
BE.12Operation error5998
BE.13Failure of the power button3998
ABS’s failureBE.14Adapter failure8989
BE.15Disruption of cable8988
Hydraulic-pneumatic circuit failureValve’s failureBE.16Effected more function7338
BE.17Abrasive of valve spool3355
BE.18Abrasive of activator4532
Vacuum pump’s failureBE.19Filters fail by effected more function3535
BE.20Rotors fail by effected more function4342
BE.21Blades fail by effected more function3375
BE.22Electromotor failure by effected circuit faults2355
BE.23Fatigue and strain of spring by effected more pressure5558
Filling pump’s failureBE.24Bearing failure4325
BE.25Electromotor failure6335
BE.26Goring the wears5332
BE.27Effected more function4325
BE.28High pressure of fluids4326
Pipe’s failureBE.29Pipe rupture7393
BE.30Leakage3958
BE.31Corrosion3378
Pressure control’s failureBE.32Excessive of system pressure5275
BE.33Spring fails of pressure control valve3575
Publisher’s Note: MDPI stays neutral with regard to jurisdictional claims in published maps and institutional affiliations.

