Article

Thermal Comfort and Energy Analysis of a Hybrid Cooling System by Coupling Natural Ventilation with Radiant and Indirect Evaporative Cooling

1
SJ-NTU Corporate Lab, Nanyang Technological University, 50 Nanyang Avenue, Singapore 639798, Singapore
2
S-Lab for Advanced Intelligence, Nanyang Technological University, 50 Nanyang Avenue, Singapore 639798, Singapore
3
Energy Research Institute, Nanyang Technological University, 50 Nanyang Avenue, Singapore 639798, Singapore
4
School of Civil and Environmental Engineering, Nanyang Technological University, 50 Nanyang Avenue, Singapore 639798, Singapore
*
Author to whom correspondence should be addressed.
Energies 2021, 14(22), 7825; https://doi.org/10.3390/en14227825
Submission received: 19 October 2021 / Revised: 18 November 2021 / Accepted: 19 November 2021 / Published: 22 November 2021
(This article belongs to the Topic Sustainable Energy Technology)

Abstract

:
A hybrid cooling system which combines natural ventilation with a radiant cooling system for a hot and humid climate was studied. Indirect evaporative cooling was used to produce chilled water at temperatures slightly higher than the dew point. With this hybrid system, the condensation issue on the panel surface of a chilled ceiling was overcome. A computational fluid dynamics (CFD) model was employed to determine the cooling load and the parameters required for thermal comfort analysis for this hybrid system in an office-sized, well-insulated test room. Upon closer investigation, it was found that the thermal comfort by the hybrid system was acceptable only in limited outdoor conditions. Therefore, the hybrid system with a secondary fresh air supply system was suggested. Furthermore, the energy consumptions of conventional all-air, radiant cooling, and hybrid systems including the secondary air supply system were compared under similar thermal comfort conditions. The predicted results indicated that the hybrid system saves up to 77% and 61% of primary energy when compared with all-air and radiant cooling systems, respectively, while maintaining similar thermal comfort.

1. Introduction

Energy efficiency in buildings has received great interest due to the increasing energy demand and significant depletion of natural resources. Owing to its hot and humid tropical climate, in Singapore, more than 60% of the total energy consumed by residential and non-residential building is by air-conditioning for thermal comfort [1]. As an effective strategy for reducing energy use in buildings, natural ventilation utilizes the natural forces of wind pressure and stack effects to direct the movement of air through openings [2]. Natural ventilation is becoming increasingly popular, owing to the following significant advantages: (1) low capital and maintenance costs [3]; (2) environmental sustainability [4]; reduced risk of airborne contagions [5]; and (3) positive perception as there is evidence that occupants in buildings prefer to have control over their environment [6]. However, natural ventilation often fails to provide enough cooling capacity for buildings in a hot and humid area or with dense occupancy [7], such as offices where the high-level thermal comfort is required for intellectual productivity [8]. Moreover, natural ventilation performance is easily limited by building design and shape, both of which are difficult to modify after construction [6].
In order to overcome the barriers to the adoption of natural ventilation, numerous efforts have been made in the literature to enhance its wind utilization [9,10,11,12] or buoyancy effect [13,14] and thereby achieve adequate air flow rate and desired thermal comfort. In heat-intensive scenarios, however, natural ventilation alone still cannot meet the requirement of thermal comfort, leading to the increased adoption of mixed-mode or hybrid systems [6]. The basic concept of hybrid ventilation is to maintain a satisfactory indoor environment while minimizing the energy use and operating costs associated with air conditioning by alternating between and combining natural and mechanical systems [15].
Recently, radiant cooling systems, utilizing temperature-controlled indoor surfaces as the cooling source [16], have been gaining much popularity due to good thermal comfort, reduced energy consumption, quiet operation, and space-saving features [17]. It would be very promising to couple radiant cooling with natural ventilation as a hybrid system for both thermal comfort and energy saving in buildings. The literature reveals that, so far, few studies have been conducted on such a hybrid system, mainly because of the condensation issue on radiant surfaces, especially in hot and humid area like Singapore, where dew-point temperature typically exceeds the surface temperature of a chilled ceiling panel (CCP) [18]. A possible solution to the condensation issue is the application of an indirect evaporative cooling (IEC) system to produce chilled water at a temperature between the wet-bulb temperature and dew point of the outdoor air [19]. Moreover, IEC shows the significant advantages of a high coefficient of performance (COP), energy-saving, and environmental sustainability over other conventional air conditioning systems.
Most previous studies have mainly focused on hybrid systems in enclosed environment by coupling radiant cooling with mechanical ventilation (e.g., airbox convector [18,20], personalized ventilation [21,22], underfloor/displacement ventilation [23,24,25,26]), which usually precool the supplied outdoor air to prevent condensation on a chilled surfaces. Yu et al. [27,28] proposed a novel system combining natural ventilation with diffuse ceiling inlet and thermally activated building systems (TABS) and investigated its cooling performance experimentally in Denmark, which has a relatively cold climate even in summer, and hence the condensation issue on the TABS was not considered. Meggers et al. [29] experimentally analyzed the thermal comfort of an open air pavilion using radiant cooling and indirect evaporation under the temperate climate of Princeton. Vangtook and Chirarattananon [30] employed water cooled by a cooling tower for radiant cooling and found that it was sufficient to achieve thermal comfort in night-time application, while the ventilation air precooled by chilled water at 10 °C was required to treat the latent load in day-time application. The effect of natural ventilation on enhancing the cooling capacity of radiant cooling was not studied in their work. To the authors’ knowledge, no studies in the literature have evaluated the thermal comfort of a hybrid system coupling natural ventilation with radiant and IEC for a tropical climate, as well as compared their energy performance with conventional all-air and radiant cooling systems.
Therefore, the present work aims (i) to investigate a hybrid cooling system which couples natural ventilation together with radiant cooling, and which uses IEC to supply chilled water, and (ii) to study the thermal comfort and energy-saving potential of the hybrid cooling system in an office-sized, well-insulated environmental chamber.

2. Proposed Hybrid Cooling System

The proposed hybrid system mainly consists of three parts, namely, the chilled ceiling for radiant cooling, IEC, and a test room with cross ventilated openings for natural ventilation, as shown in Figure 1a,b, where the return water from the CCP is cooled down by IEC first to the temperature between the wet bulb temperature and dew point, and is then circulated into the CCP as the cooling source to remove the intensive sensible loads caused by solar radiation, occupants, lighting, and equipment in the working space. At the same time, natural ventilation removes the latent and a part of the sensible load and provides abundant fresh air.
The psychrometric process to produce a chilled water supply in IEC is shown in Figure 1a. Firstly, the inlet air A is cooled to the state B through the air–water counterflow heat exchanger, while its humidity ratio keeps constant as there is no air–water contact during the indirect heat exchanging process. The air at the state B is then blown into the air–water counterflow padding tower for the air–water direct evaporative cooling process. After being heated and humidified by the water spray, the air is exhausted from the top of the IEC at the state C. Meanwhile, the water spray D is cooled by the air to the state E and is divided into two parts: a smaller portion of water is pumped into the air–water counterflow heat exchanger to pre-cool the inlet air, and the larger portion is pumped into the CCPs, where it removes the heat in the working space together with natural ventilation and then returns to the IEC.

3. CFD Model

To determine the thermal comfort and energy consumption of the proposed hybrid system, the values of key parameters are required, such as the air temperature, surface temperature, airflow rate, and cooling loads. Using CFD, the variation of these key parameters under the effects of radiant heat transfer between two surfaces at different temperature and convective heat transfer induced by the air motion can be analyzed. For this reason, CFD simulation using the FLUENT program was performed. In the present work, CFD simulation was performed to evaluate the thermal conditions in the office-sized space with both radiant cooling and natural ventilation, and to provide the required parameters for thermal comfort and energy calculations. The following assumptions were used for the simulation:
  • Turbulent flow was obtained using the realizable (k-ε) model with enhanced wall treatment including the effects of gravity for flow analysis.
  • An incompressible ideal gas model was assumed.
  • A surface-to-surface radiation heat transfer model was used.
  • A solution method employing a pressure-based coupled scheme for pressure-velocity coupling was used.
  • A body force weighted method for the pressure interpolation scheme was used as it resulted in a stable solution for buoyancy calculations.
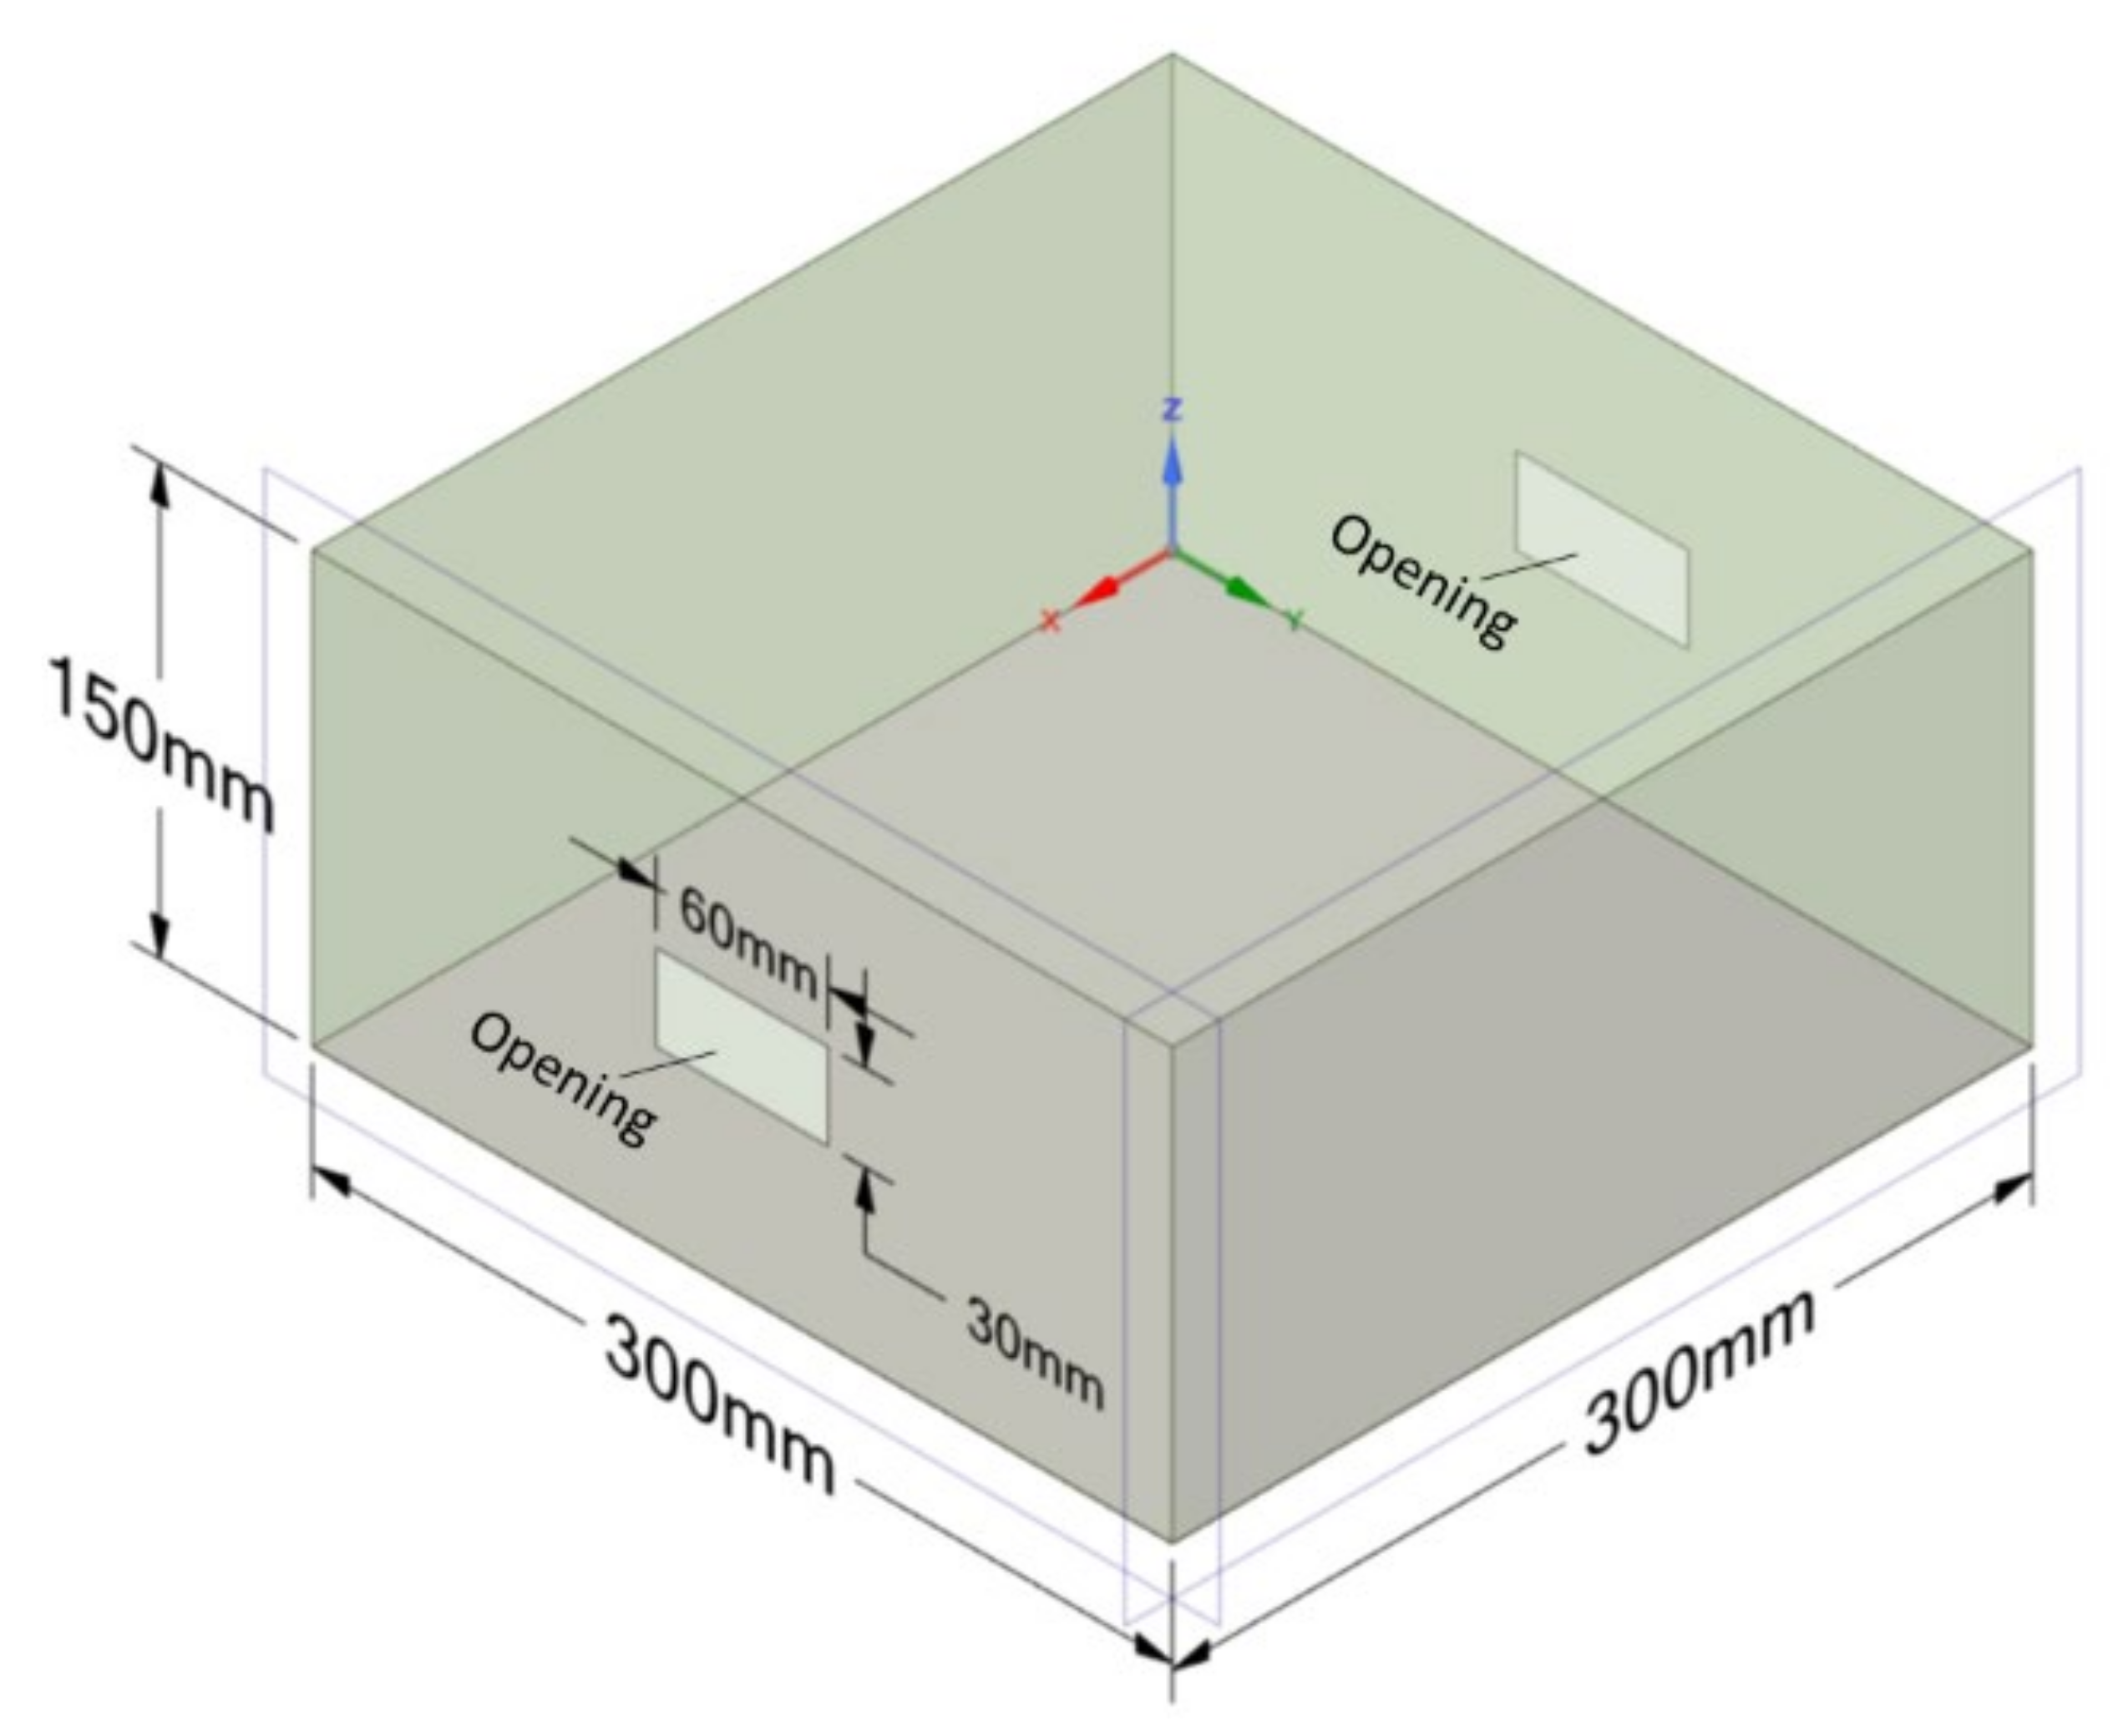
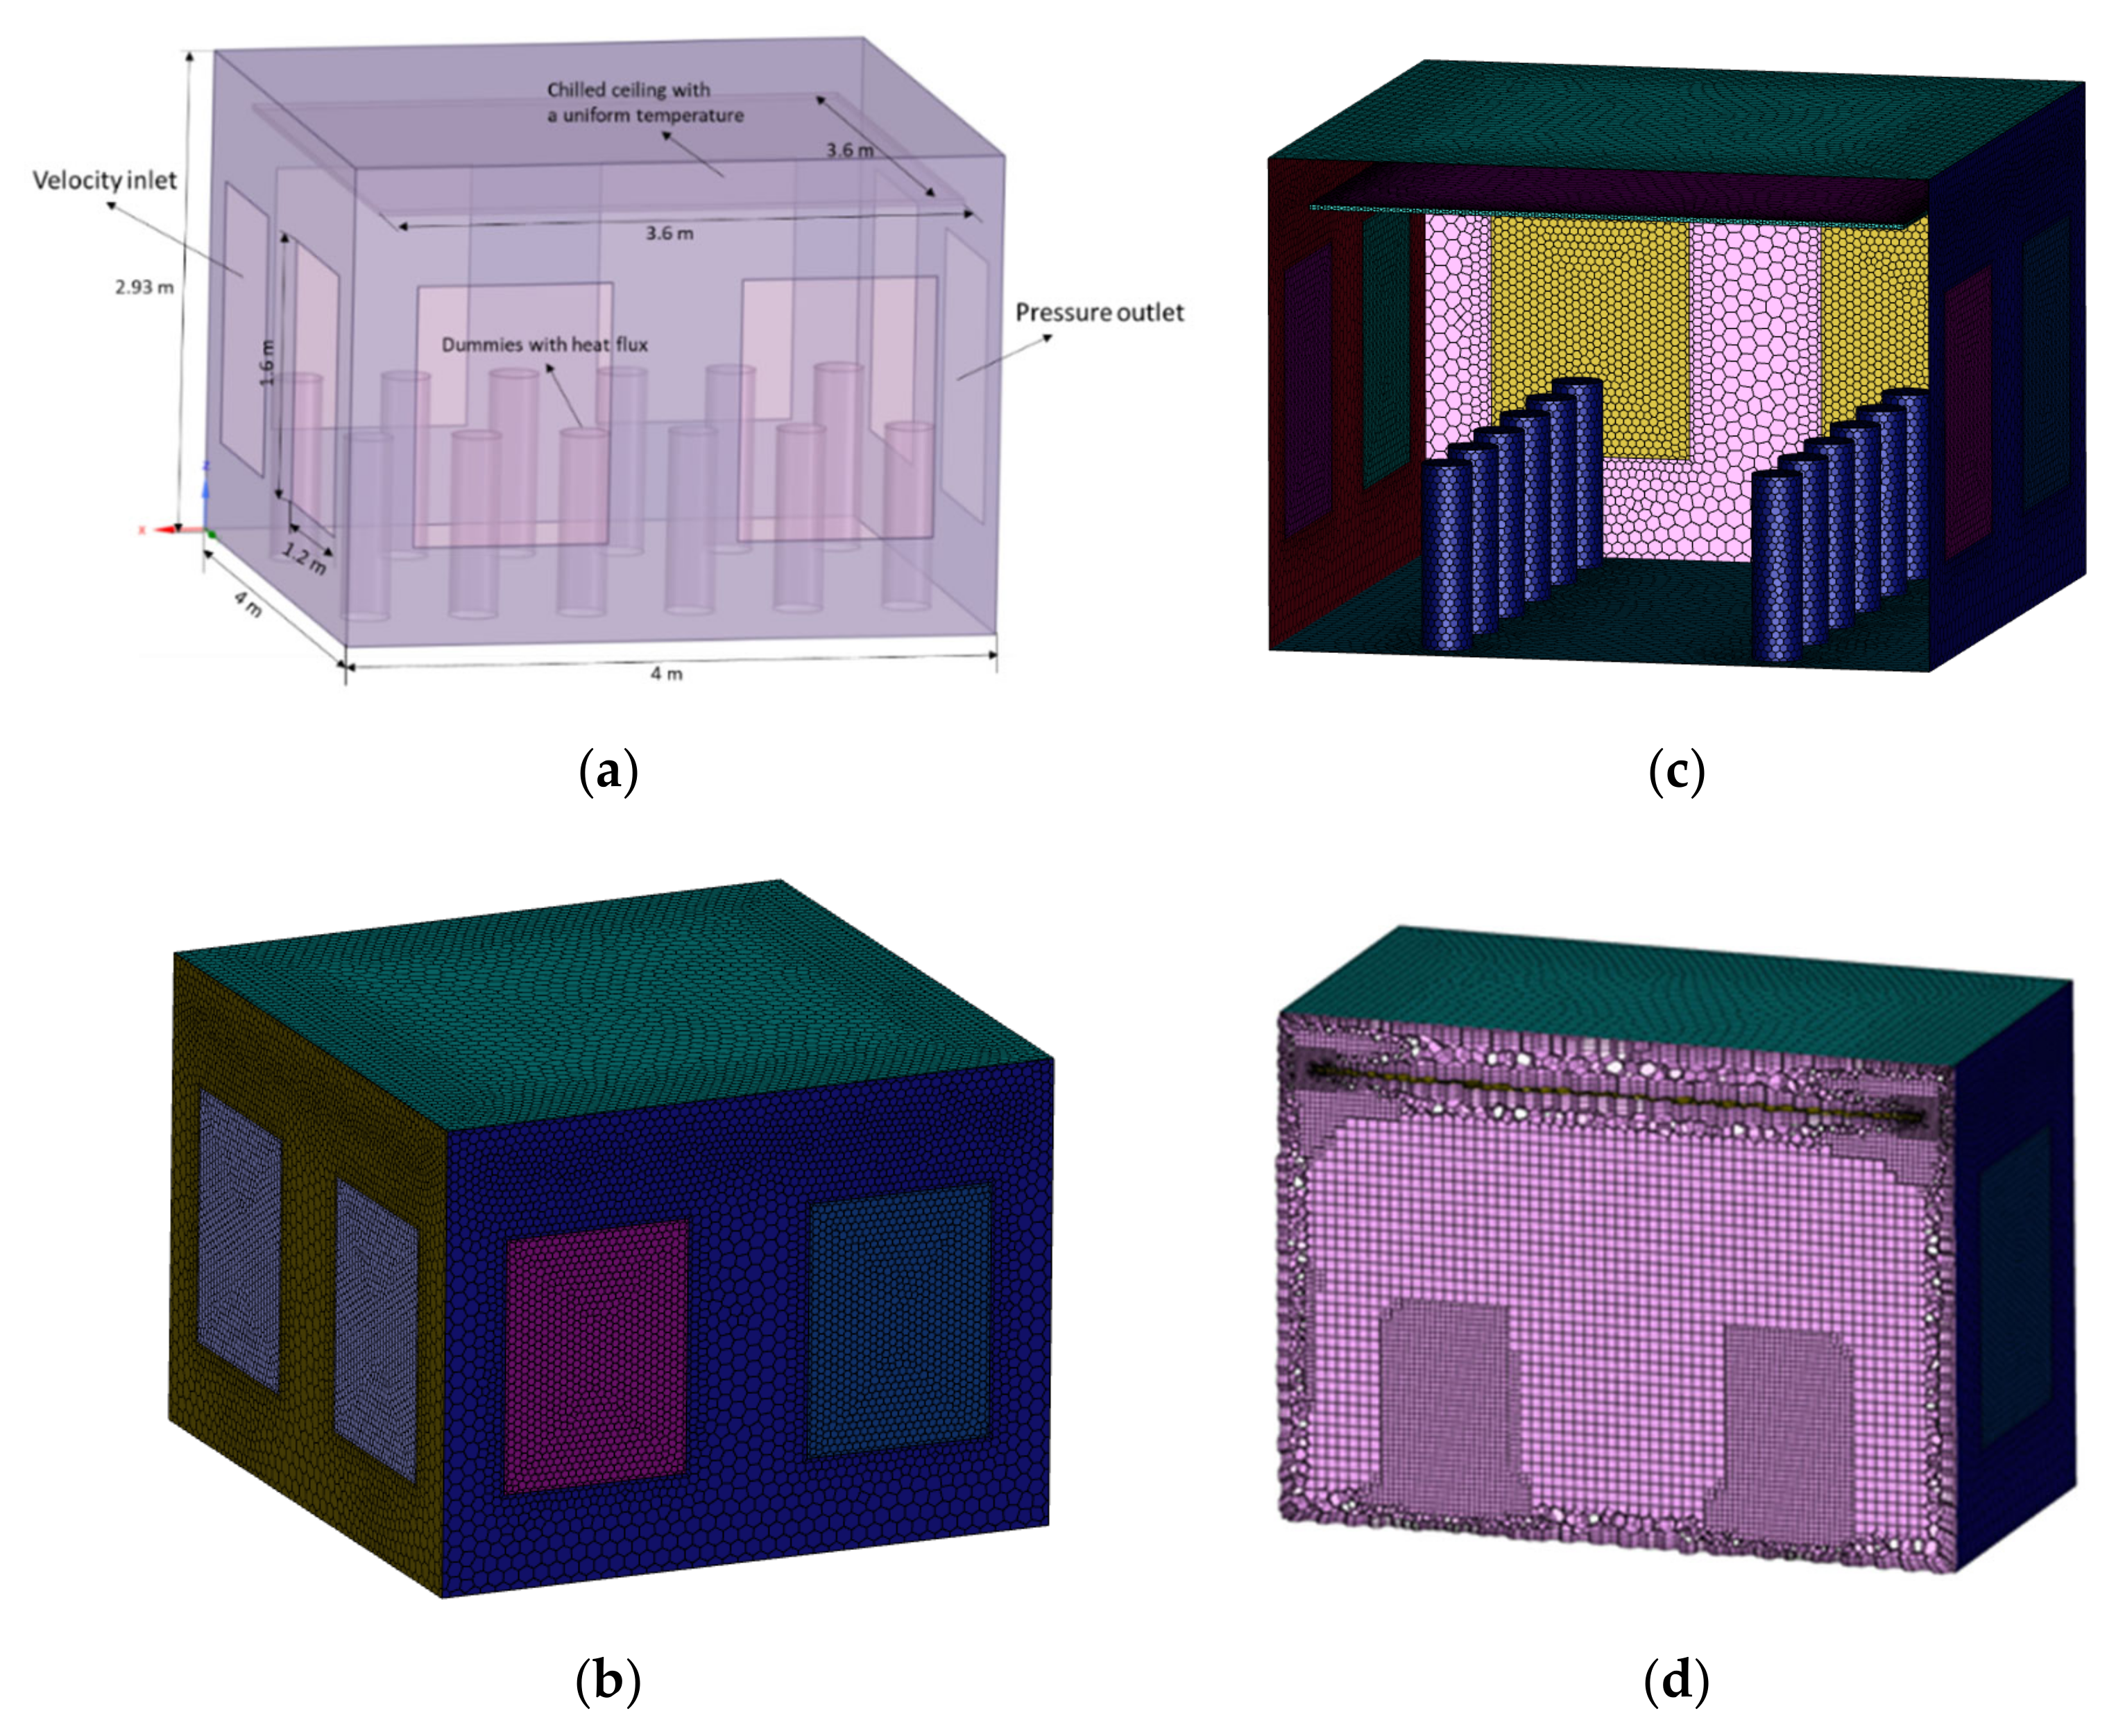
In accordance with the BS EN 14240 testing standard of chilled ceilings [31], the test room was developed using FLUENT, as schematically shown in Figure 2a. Twelve cylindrical dummies were uniformly deployed to simulate the internal heat load and ceiling panels were installed at 2.6 m above the floor. In order to reduce the computational cost of the CFD model, a simplified geometry of the ceiling panels as a flat rectangular parallelopiped with uniform temperatures on the lower and upper surfaces was employed instead of a fully detailed model, which may reduce the accuracy unless all the input parameters are well known [32].
Regarding the boundary conditions, the ‘velocity inlet’ was imposed to the openings in the upstream area of prevailing wind (detailed in Appendix A), while other openings were assigned as ‘pressure outlets’. Internal surfaces were assumed to be ‘no slip walls’, while the internal load and solar flux were assigned to 12 dummies and wall surfaces, respectively, as heat flux in the unit of W/m2, and uniform temperature was applied to the ceiling panel surfaces. Moreover, the floor and roof surfaces were taken as well-insulated walls in a building; hence, their boundary conditions can be assumed to be adiabatic.
It was necessary to adopt the minimum outdoor supply air, solar heat flux, and internal heat loads properly based on relevant standards, which are shown in Table 1. The unit heat flux assigned to the dummy surface was then achieved by dividing the total internal loads over the dummy surface area.

4. Mathematical Models

In this section, the mathematical models to determine the thermal comfort parameters and the power input required for various equipment are presented.

4.1. Thermal Comfort

In general, there are two different categories for thermal comfort evaluation, namely, the heat balance approach for mechanical ventilation and the adaptive approach for natural ventilation [37]. For the hybrid system, with both mechanical and natural ventilation as proposed in the present work, the predicted mean vote (PMV) and predicted percentage of dissatisfied (PPD) models [38] based on the heat balance approach were adopted to quantify the thermal comfort. This is because both indices have been used with success during the past decades and their validity extends to the range of the proposed hybrid system [39]. PMV is an index that predicts the mean value of the votes of a large group of persons on the seven-point thermal sensation scale (−3 cold, −2 cool, −1 slightly cool, 0 neutral, +1 slightly warm, +2 warm, and +3 hot), while PPD is determined from PMV to predict the percentage of thermally dissatisfied people [40], and they are given by [37]
P M V = f t a , t m r t , v , p a , M , I c l
P P D = 100 95 × exp 0.03353 × P M V 4 0.219 × P M V 2
where ta is the air temperature, tmrt is the mean radiant temperature (MRT), v is the relative air velocity, pa is the vapor pressure, M the activity level, and Icl the clothing insulation. tmrt is derived from the temperature of the surrounding surfaces and their positions with respect to the occupant, as described in Equation (3) [41]:
t m r t 4 = t 1 4 F o 1 + t 2 4 F o 2 + + t N 4 F o N
where tN is the surface temperature of a surface N and Fo-N is the angle factor between a surface N and an occupant; the defining method is detailed in [41]. The ranges of PPD and PMV for an acceptable thermal environment are defined as PPD < 10% and −0.5 < PMV < +0.5, respectively [40].

4.2. Energy Calculation

Obviously, a cooling system with both good thermal comfort and minimal energy consumption is much preferred. In the present work, energy consumption for the proposed hybrid system is compared with the that of the conventional all-air and radiant cooling systems, in order to evaluate its potential energy saving contributed to by these factors:
  • The supply fresh air comes from natural ventilation, leading to a reduced fan energy;
  • Higher supply water temperature means higher COP of IEC;
  • The hybrid system can achieve the same thermal comfort with a higher room temperature, because of the elevated air speed and lower MRT.
The primary energy-consuming equipment in the cooling systems include the chiller, fan, and pump. The required electric power input Pch for a chiller was calculated using Equation (4).
P c h = Q c C O P
where Qc is the cooling energy (W) and COP is the coefficient of performance of the water chiller and is dependent on the required chilled water temperature, ambient temperature, and humidity, as well as the operation capacity.
Fan and pump energy, as essential factors in the energy consumption of cooling system, were determined using Equation (5).
P f = V ˙ Δ p 3600 η f
where V ˙ is the air (water) volumetric flow rate (m3/h), Δp is the total pressure rise (Pa), and ηf is the fan (pump) efficiency. Using the standard heat load presented in Table 1, Equation (6) was used to calculate the air (or water) volumetric flow rate.
Q ˙ = ρ V ˙ Δ h / 3600
where Q ˙ is the rate of heat supplied to the system (W), ρ is the density (kg/m3), and Δh is the specific enthalpy change (J/kg).

5. Results and Discussion

In this section, the results obtained using the CFD, thermal comfort, and energy modeling are presented.

5.1. Effect of CCP Surface Temperature

To simulate the office model with natural ventilation and radiant cooling, it is important to assume an appropriate temperature for the chilled ceiling surfaces. The CCP surface temperature will depend upon the chilled water supply temperature and the heat load in the test room. According to the Singapore weather station data, throughout the year, the dew point and wet bulb temperature in Singapore generally varies from 22 °C to 24 °C and 24 °C to 26 °C, respectively [42]. IEC can produce chilled water at a temperature between the wet bulb temperature and dew point of the outdoor air, which are assumed to be 26 °C and 24 °C, respectively, in Singapore as cooling design parameters to avoid the condensation on the chilled ceiling surfaces [43]. Therefore, the chilled water produced by IEC can be assumed as 25 °C for the present work. The panel surface temperature is usually non-uniform due to the temperature difference of the outlet and inlet section. This difference is estimated to be about 1–2 °C [32]; hence, average surface temperature in the model was assumed to be 26 °C and higher. In addition, the wind temperature through the openings was set as 29.5 °C according to the BCA standard [33]. The air flow through the ventilated openings was obtained from the velocity contours determined using the macro CFD model, which is presented in Appendix A, Figure A3.
To evaluate the thermal comfort of the hybrid system, the test room was firstly simulated with only natural ventilation, that is, with the CCP turned off. Secondly, with both CCP and natural ventilation on, three variations of the CCP surface temperature were considered (Table 2). The variation of the CCP surface from 26 °C to the upper threshold of 28 °C was considered due to the reason that CCP surface temperatures higher than 28 °C result in failure to comply with thermal comfort requirements.
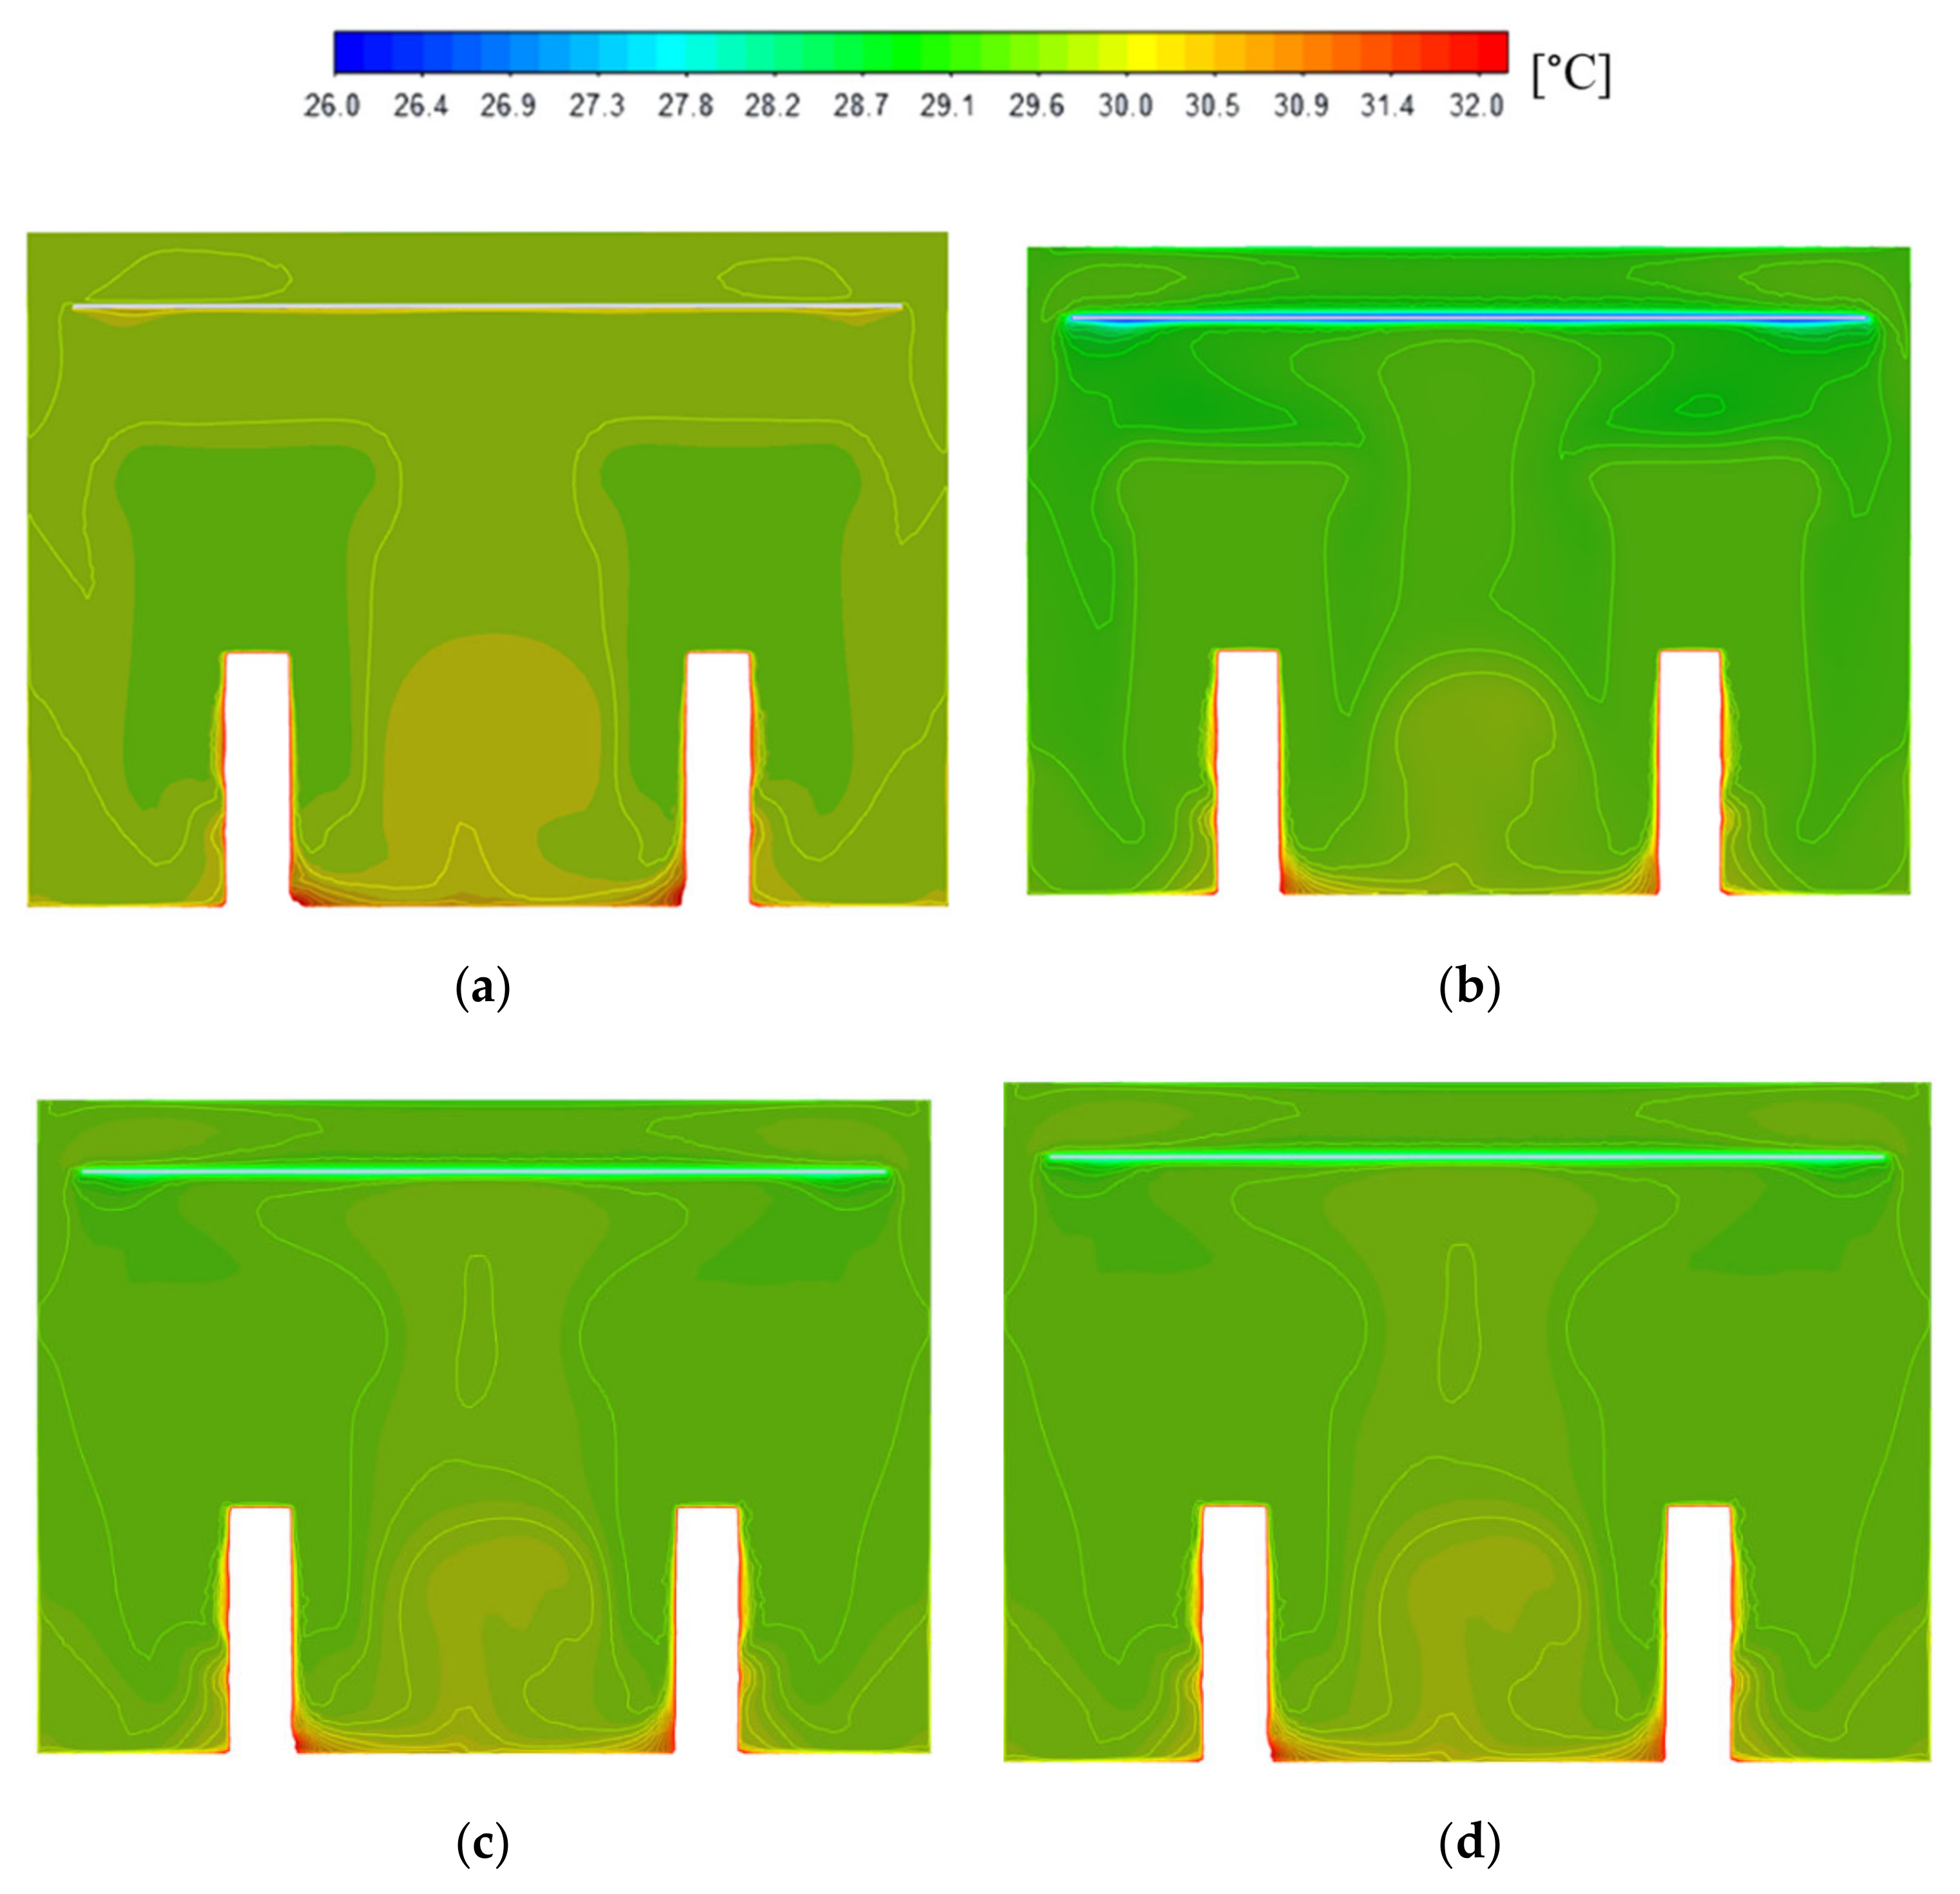
Using the CFD simulation, the sensible cooling load obtained for the CCP and ventilation was 842 W and 358 W, respectively. Figure 3a–d shows the variation of temperature on the vertical plane 1.6 m from the wall inside the room. The MRT was calculated using Equation (3) based on the wall surface temperatures obtained from the CFD. For the test scenarios considered, it is evident that as the CCP surface temperature increased, the air temperature and MRT became higher. It was also found that the pure natural ventilation system results in slightly a higher air velocity inside the room, followed by Test no. 4, 3, and 2, possibly because the zone air with the higher temperature usually introduces more drastic air movement.
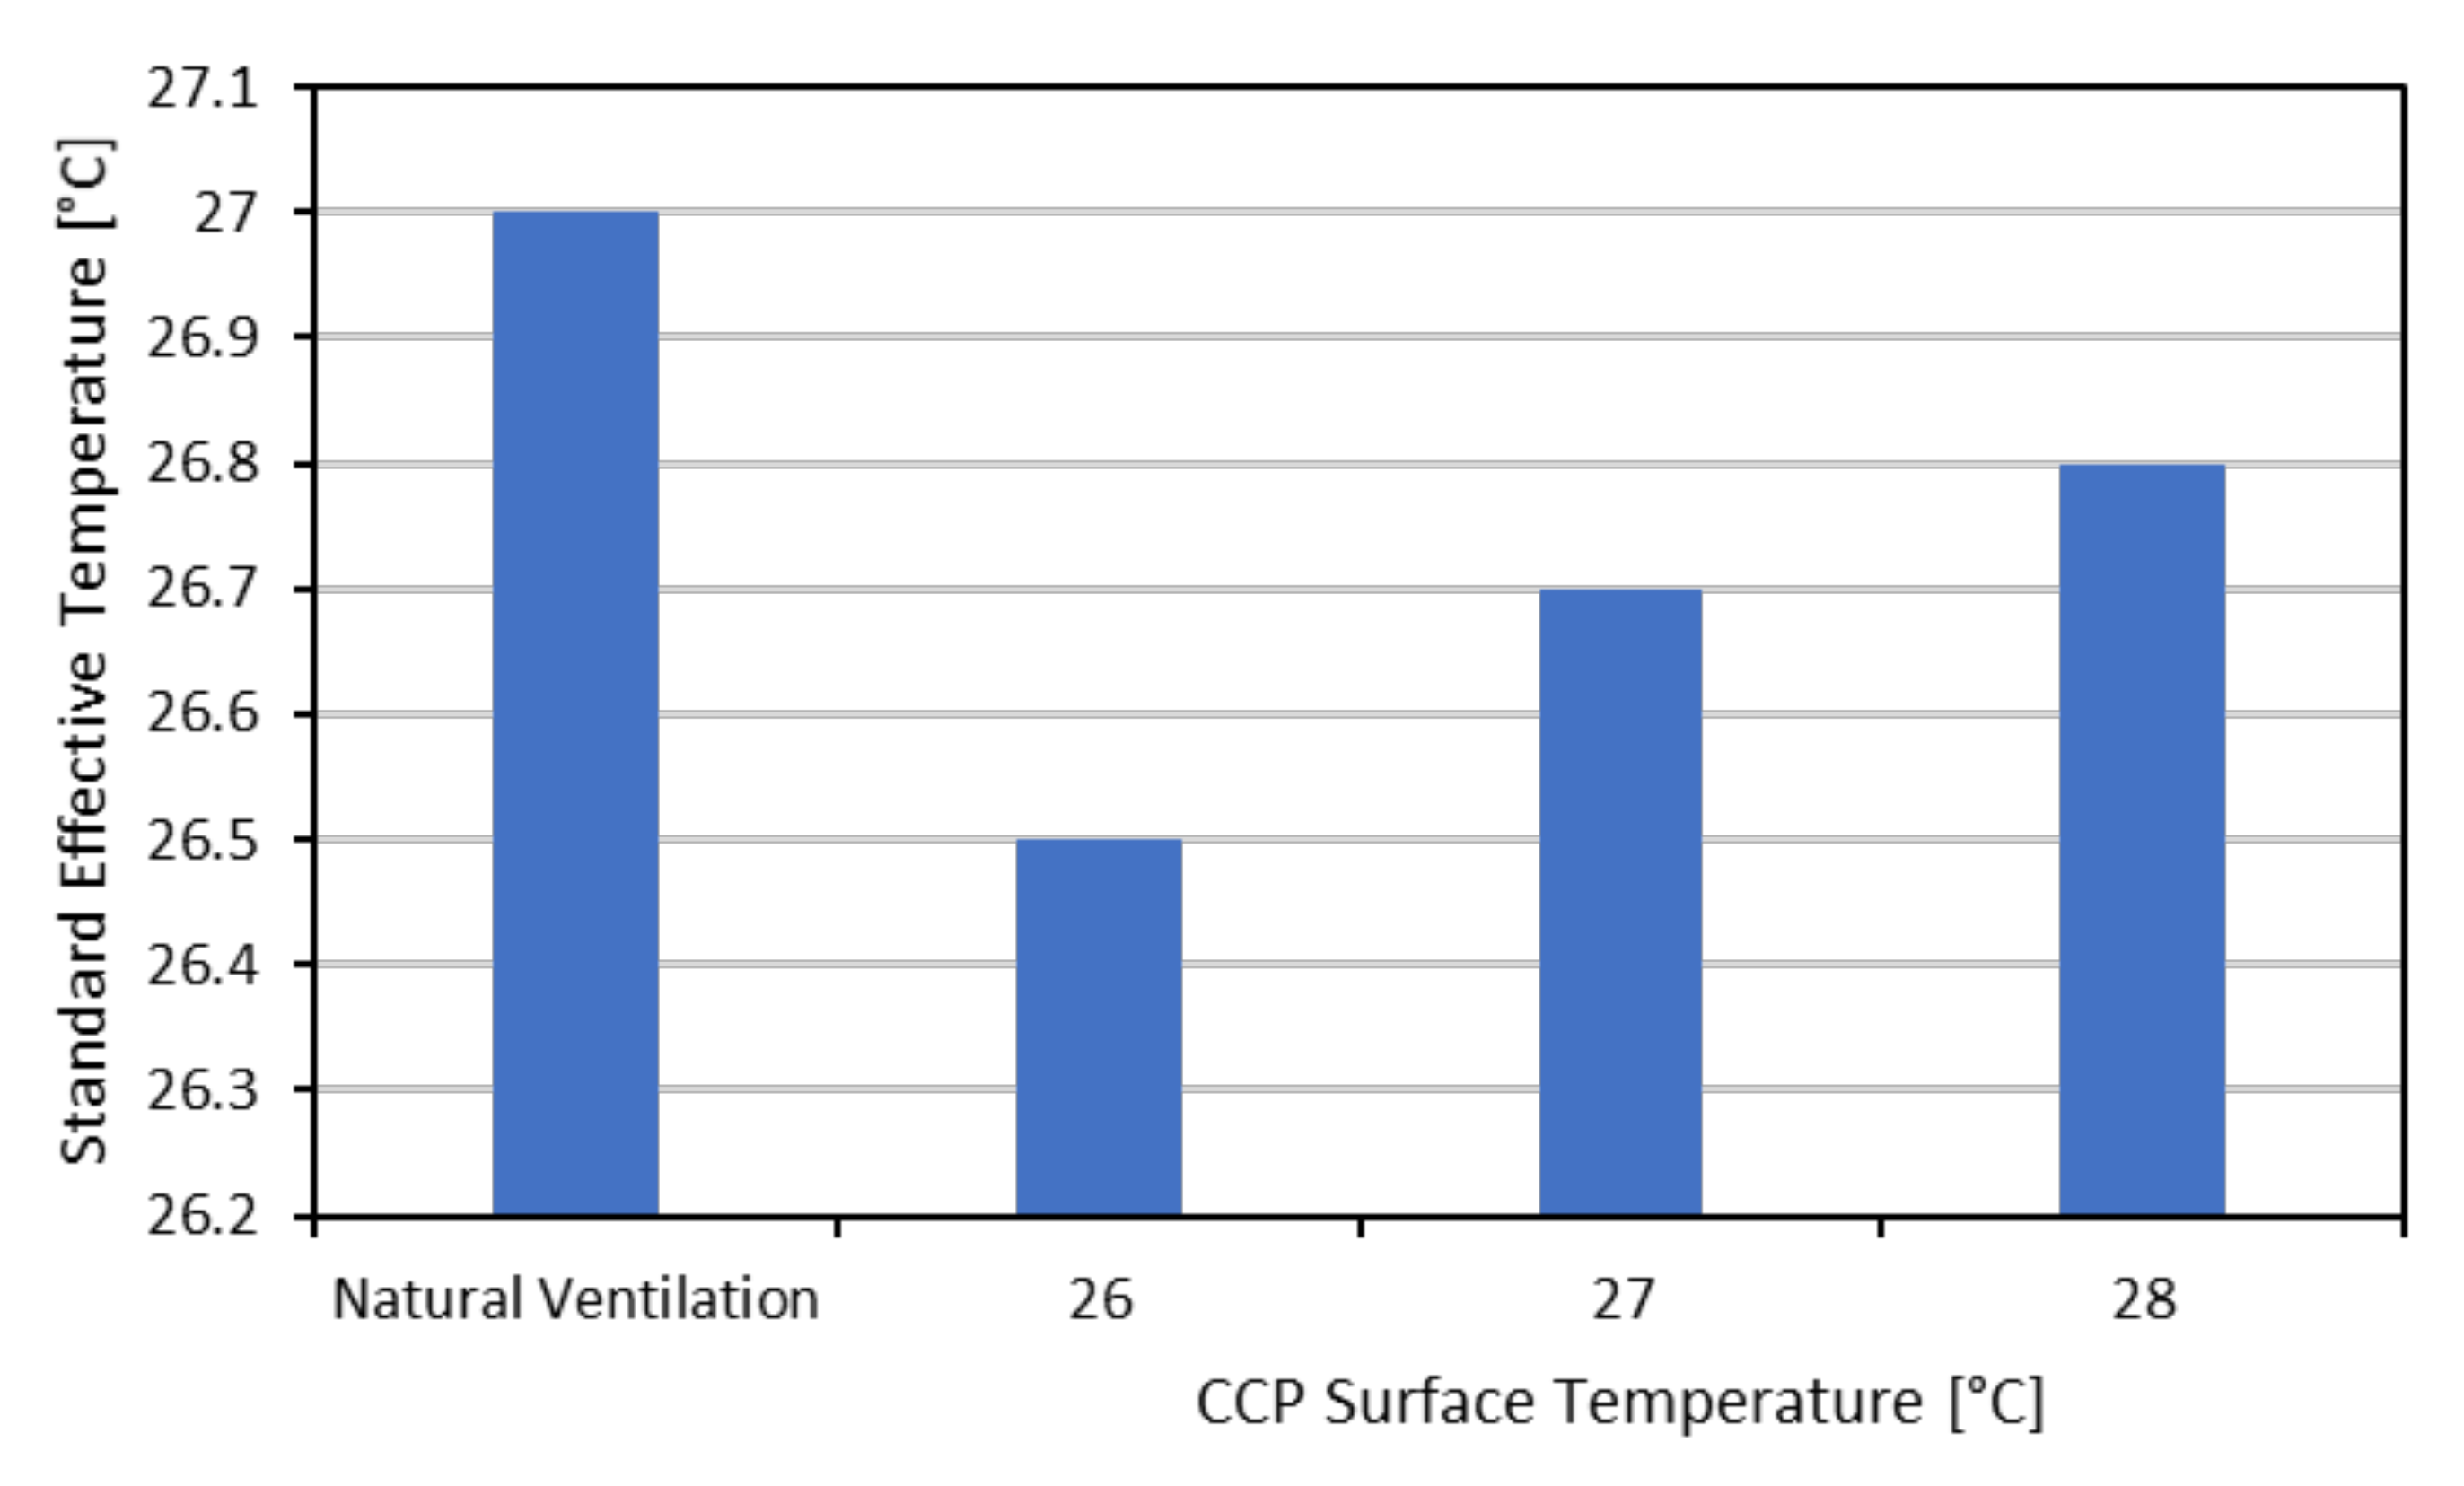
The standard effective temperature (SET) as a comprehensive metric of outdoor thermal comfort was introduced to quantify the thermal comfort enhancement by the developed hybrid system. The SET for the four cases is shown in Figure 4, wherein the SET of the natural ventilation system was reduced by 0.5 °C using the proposed hybrid system compared with a CCP surface temperature of 26 °C, and the SET increased almost linearly with respect to the increase in the CCP surface temperature.
Furthermore, together with proper assumptions of metabolic rate (1 met) and clothing level (0.5 clo), simulation results on air speed, air temperature, relative humidity, and MRT from Table 3 were fed into the PMV-PPD model to compare the thermal comfort of the four cases, which is shown in Table 4. Obviously, it was found that the thermal comfort of the pure natural ventilation system (Case 1) can be significantly enhanced by coupling with the radiant cooling and IEC. For the reference wind velocity of 2.9 m/s, the developed hybrid system with the CCP surface temperature below 28 °C can only satisfy the thermal comfort and cooling design of office space in the humid and hot climate of Singapore.
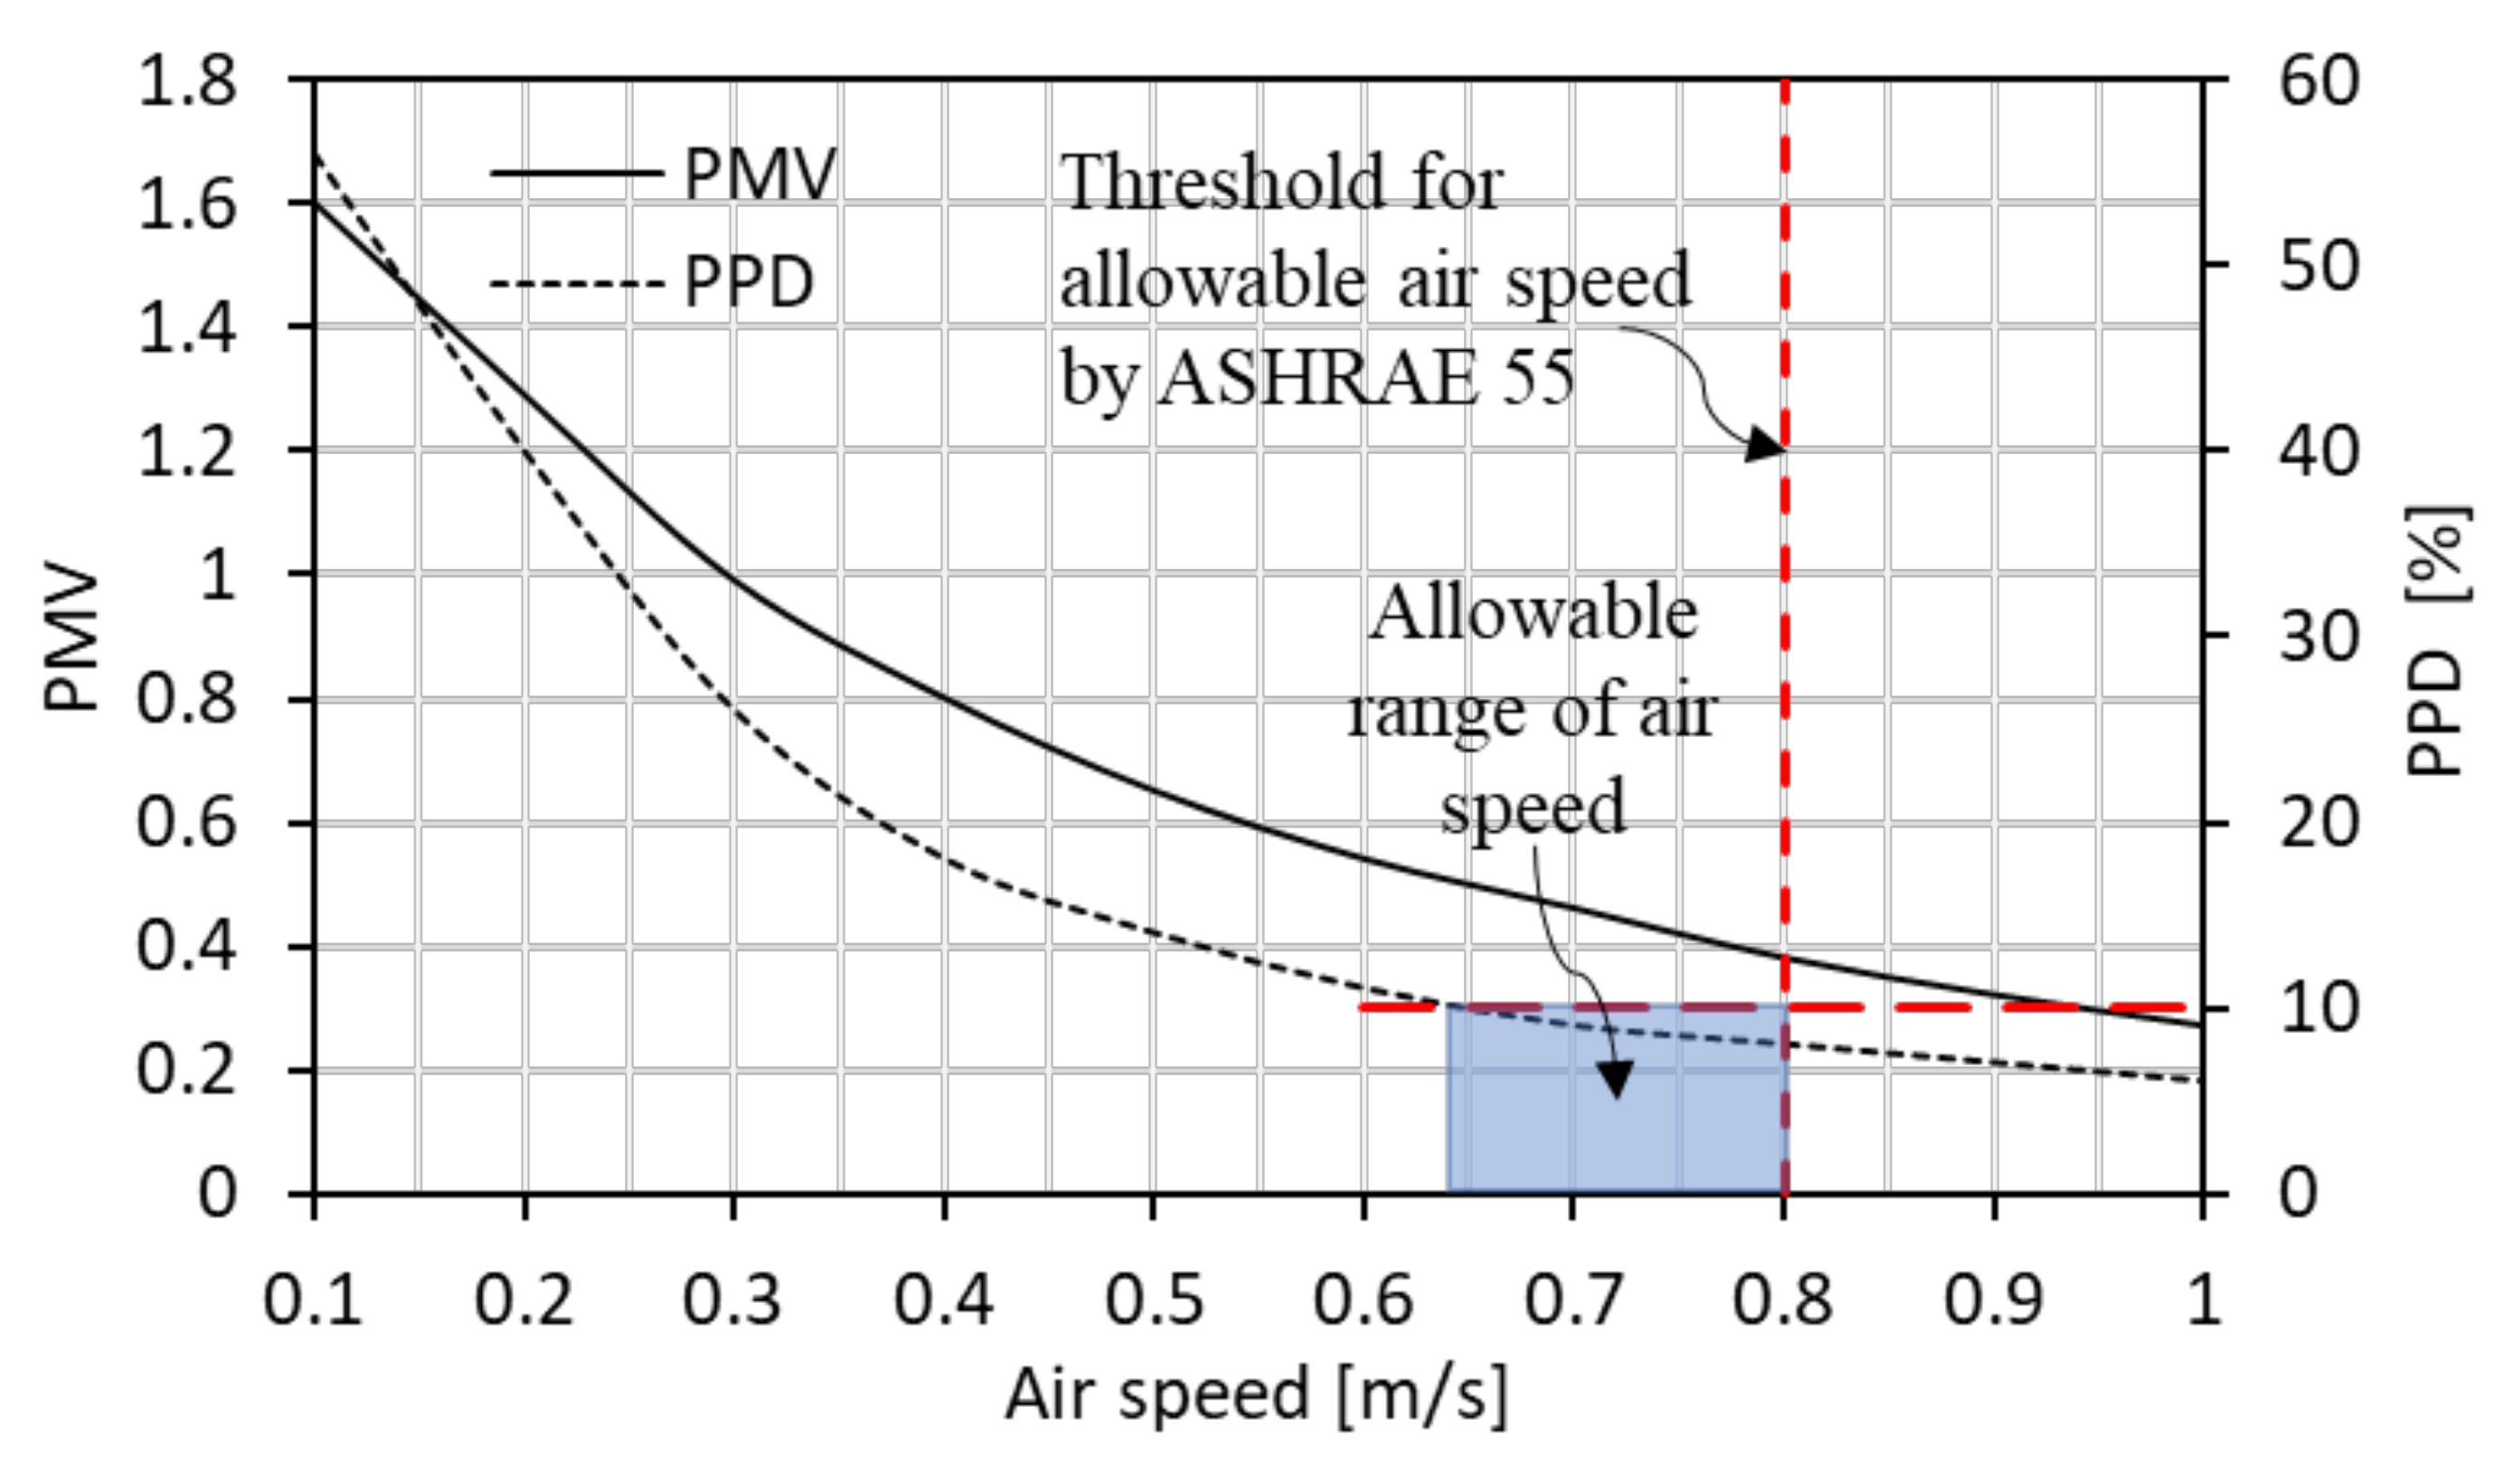
As the thermal comfort is dependent upon the prevalent wind speed outside the test room, the variation of PMV and PPD with respect to air speed in the test room was studied. As shown in Figure 5, the percentage dissatisfied was higher for lower air speeds. The allowable air speed for the outdoor air conditions selected was within the narrow range of 0.6–0.8 m/s. The upper threshold of 0.8 m/s is the allowable maximum air speed according to the ASHRAE 55 standard. According to the local weather station data, the prevalent wind condition in Singapore can vary from 0.2 to over 6 m/s [42]. This implies that there will be conditions, such as during rainfall when the outdoor humidity is high and ventilation might be limited, where the thermal comfort compliance will not be satisfied when the air speed in the room decreases below 0.6 m/s. Therefore, to meet the thermal comfort compliance for all climatic conditions in Singapore, a secondary fresh air delivery system, such as using a desiccant dehumidification system (DDS), is required. A DDS can be used for both fresh air supply and latent heat removal.
In a DDS, desiccants dry the air by adsorbing moisture without the requirement to cool the air below its dew point. Once the desiccants are saturated with moisture, heat is used to desorb the moisture and regenerate it back to its dry state. This means the electrical energy demand in a conventional dehumidification system can be replaced by thermal energy supplied using sustainable and clean energy sources such as solar thermal systems. In a hot and humid climate, such as in Singapore, where the solar energy is abundant, this kind of desiccant system is highly relevant. Therefore, during recent years, a desiccant dehumidification and cooling system has been considered for air-conditioning due to its energy saving and environmentally friendly features [34,44,45].

5.2. Energy Analysis

As the thermal comfort from the hybrid system including a CCP combined with natural ventilation alone was not always satisfactory, DDS was also integrated as the secondary source of fresh air supply. The issue with the hybrid system with DDS is that this system will require higher initial capital for installation. However, the energy savings from this kind of hybrid system may be substantial. In this section, the proposed hybrid system is compared with conventional all-air and radiant cooling systems for energy consumption. To achieve the same comfort level (PMV = 0.43, PPD = 9%) for the hybrid system with the CCP surface temperature of 26 °C, the designed indoor air conditions were a dry bulb temperature of 27 °C and a relative humidity of 50% for the all-air and radiant cooling systems.
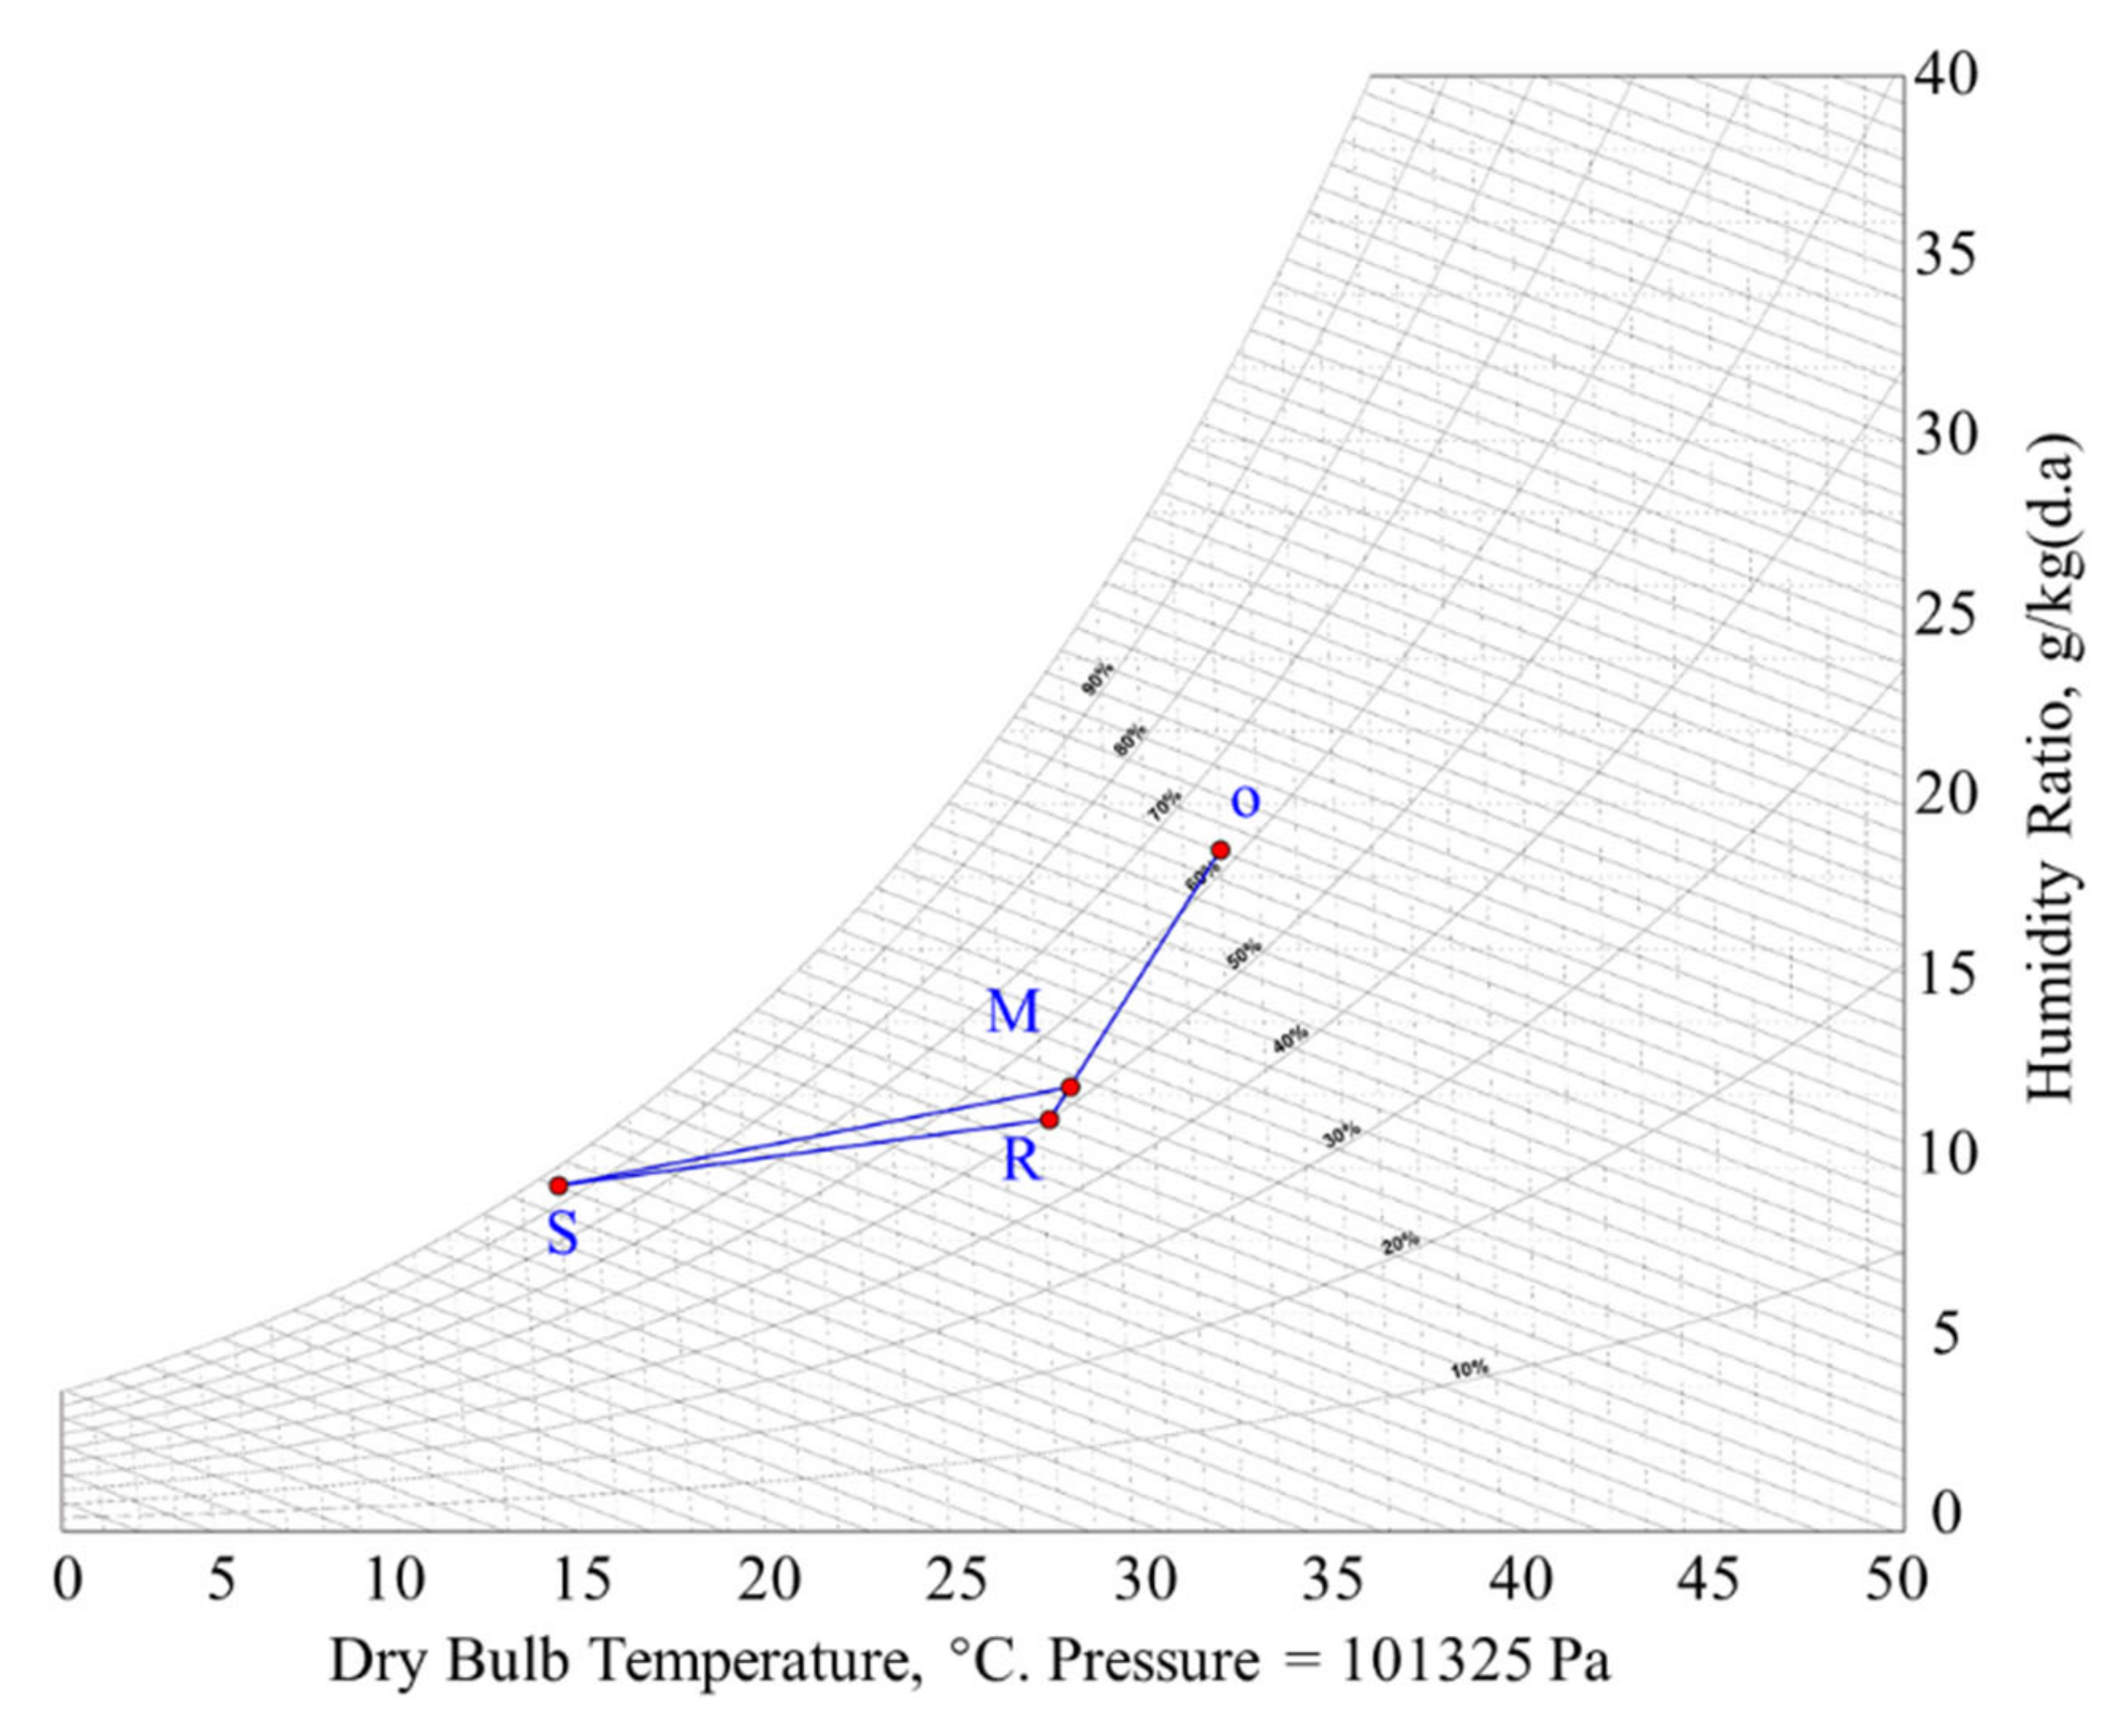
The air handling process of the conventional all-air system is shown in Figure 6 and corresponding air state parameters are shown in Table 5. In the all-air system, outdoor fresh air O is mixed with the return air R in the ratio of 1:6 to obtain the mixture at state M. The air at state M is then cooled and dehumidified by the cooling coil to the state S. The supply air S then absorbs the sensible and latent heat of the space and returns it as the air at state R. In the cooling coil, the chilled water supply and return temperature (CHWS/RT) was assumed at 5 °C and 12 °C, respectively. Based on the total heat load of 1244 W and Equation (6), the supply volume flow rates were computed as 207 m3/h and 0.179 m3/h for air and water, respectively.
For the radiant cooling system, the air handling process and corresponding air state parameters were similar to those in Figure 6 and Table 5, respectively. To maintain indoor air quality and remove the moisture load, the fresh air at O is cooled and dehumidified by a cooling coil to state S and is then transported by a fan to the office space to absorb the latent load and a small portion of the sensible load. Afterwards, the return air R is exhausted to the atmosphere. The main sensible load is treated by CCP. The CHWS/RT was assumed to be 15/17 °C and 5/12 °C for the chilled ceiling and air handling unit, respectively. By computation, the total supply volume flow rates were 28.2 m3/h and 0.4 m3/h for air and water, respectively.
For the hybrid system, the air state parameters in IEC corresponding to the air handling process in Figure 1b are shown in Table 6. Using the developed model of the test room, the sensible heat removed by CCP was computed as 1200 W. Based on the air state parameters, the volume flow rates were calculated as 248.8 m3/h and 0.36 m3/h for air and water, respectively.
In the case of the hybrid system, ventilation alone is not able to remove the latent heat, especially when the outdoor humidity is high during rainfall. Therefore, a desiccant dehumidification system (DDS) was proposed for latent heat removal and fresh air supply. The psychrometric process for the dehumidification part of DDS is presented in Figure 7 and Table 7. The fresh air at state ‘1’ is drawn through the desiccant wheel using a fan. This results in air to be heated and dehumidified to state ‘2’ [46]. An air–water heat exchanger, using the chilled water from IEC, is used to sensibly cool the air to state ‘3’. The supply air at state ‘3’ removes the latent heat and a small portion of sensible heat. The air state of the room is at state ‘R’. Based on the air state parameters provided in Table 7, the required air and water flowrates of 28.6 and 0.093 m3/h, respectively, were obtained. For the regeneration, the return air at air state ‘R’ will be passed to the solar thermal collectors. The air will then be heated up to temperature of 65 °C before passing through the desiccant wheel for regeneration. The total air flowrate required is approximately 28.6 m3/h. For the operation of CCP and IEC, the total air and water flowrates of 438.8 and 0.5 m3/h, respectively, were obtained.
Energy consumed by the primary equipment is computed with constant indices of performance [19,47,48]: (i) the COP of the chiller is 4.39 and 3.31 for evaporating temperatures of 15 °C and 5 °C, respectively; (ii) the pump and fan efficiencies are 0.6; (iii) the pressure drop (ΔP) of the fan is 1400 Pa, 1600 Pa, and 422 Pa, respectively, for conventional all-air, radiant, and hybrid cooling systems; and (iv) the ΔP of the pump is 0.3 bar, 0.5 bar, and 0.89 bar, respectively, for conventional all-air, radiant, and hybrid cooling systems. The fan electricity consumption was calculated assuming that the pressure drops across the airflow path to the desiccant wheel for both the dehumidification and regeneration are equal.
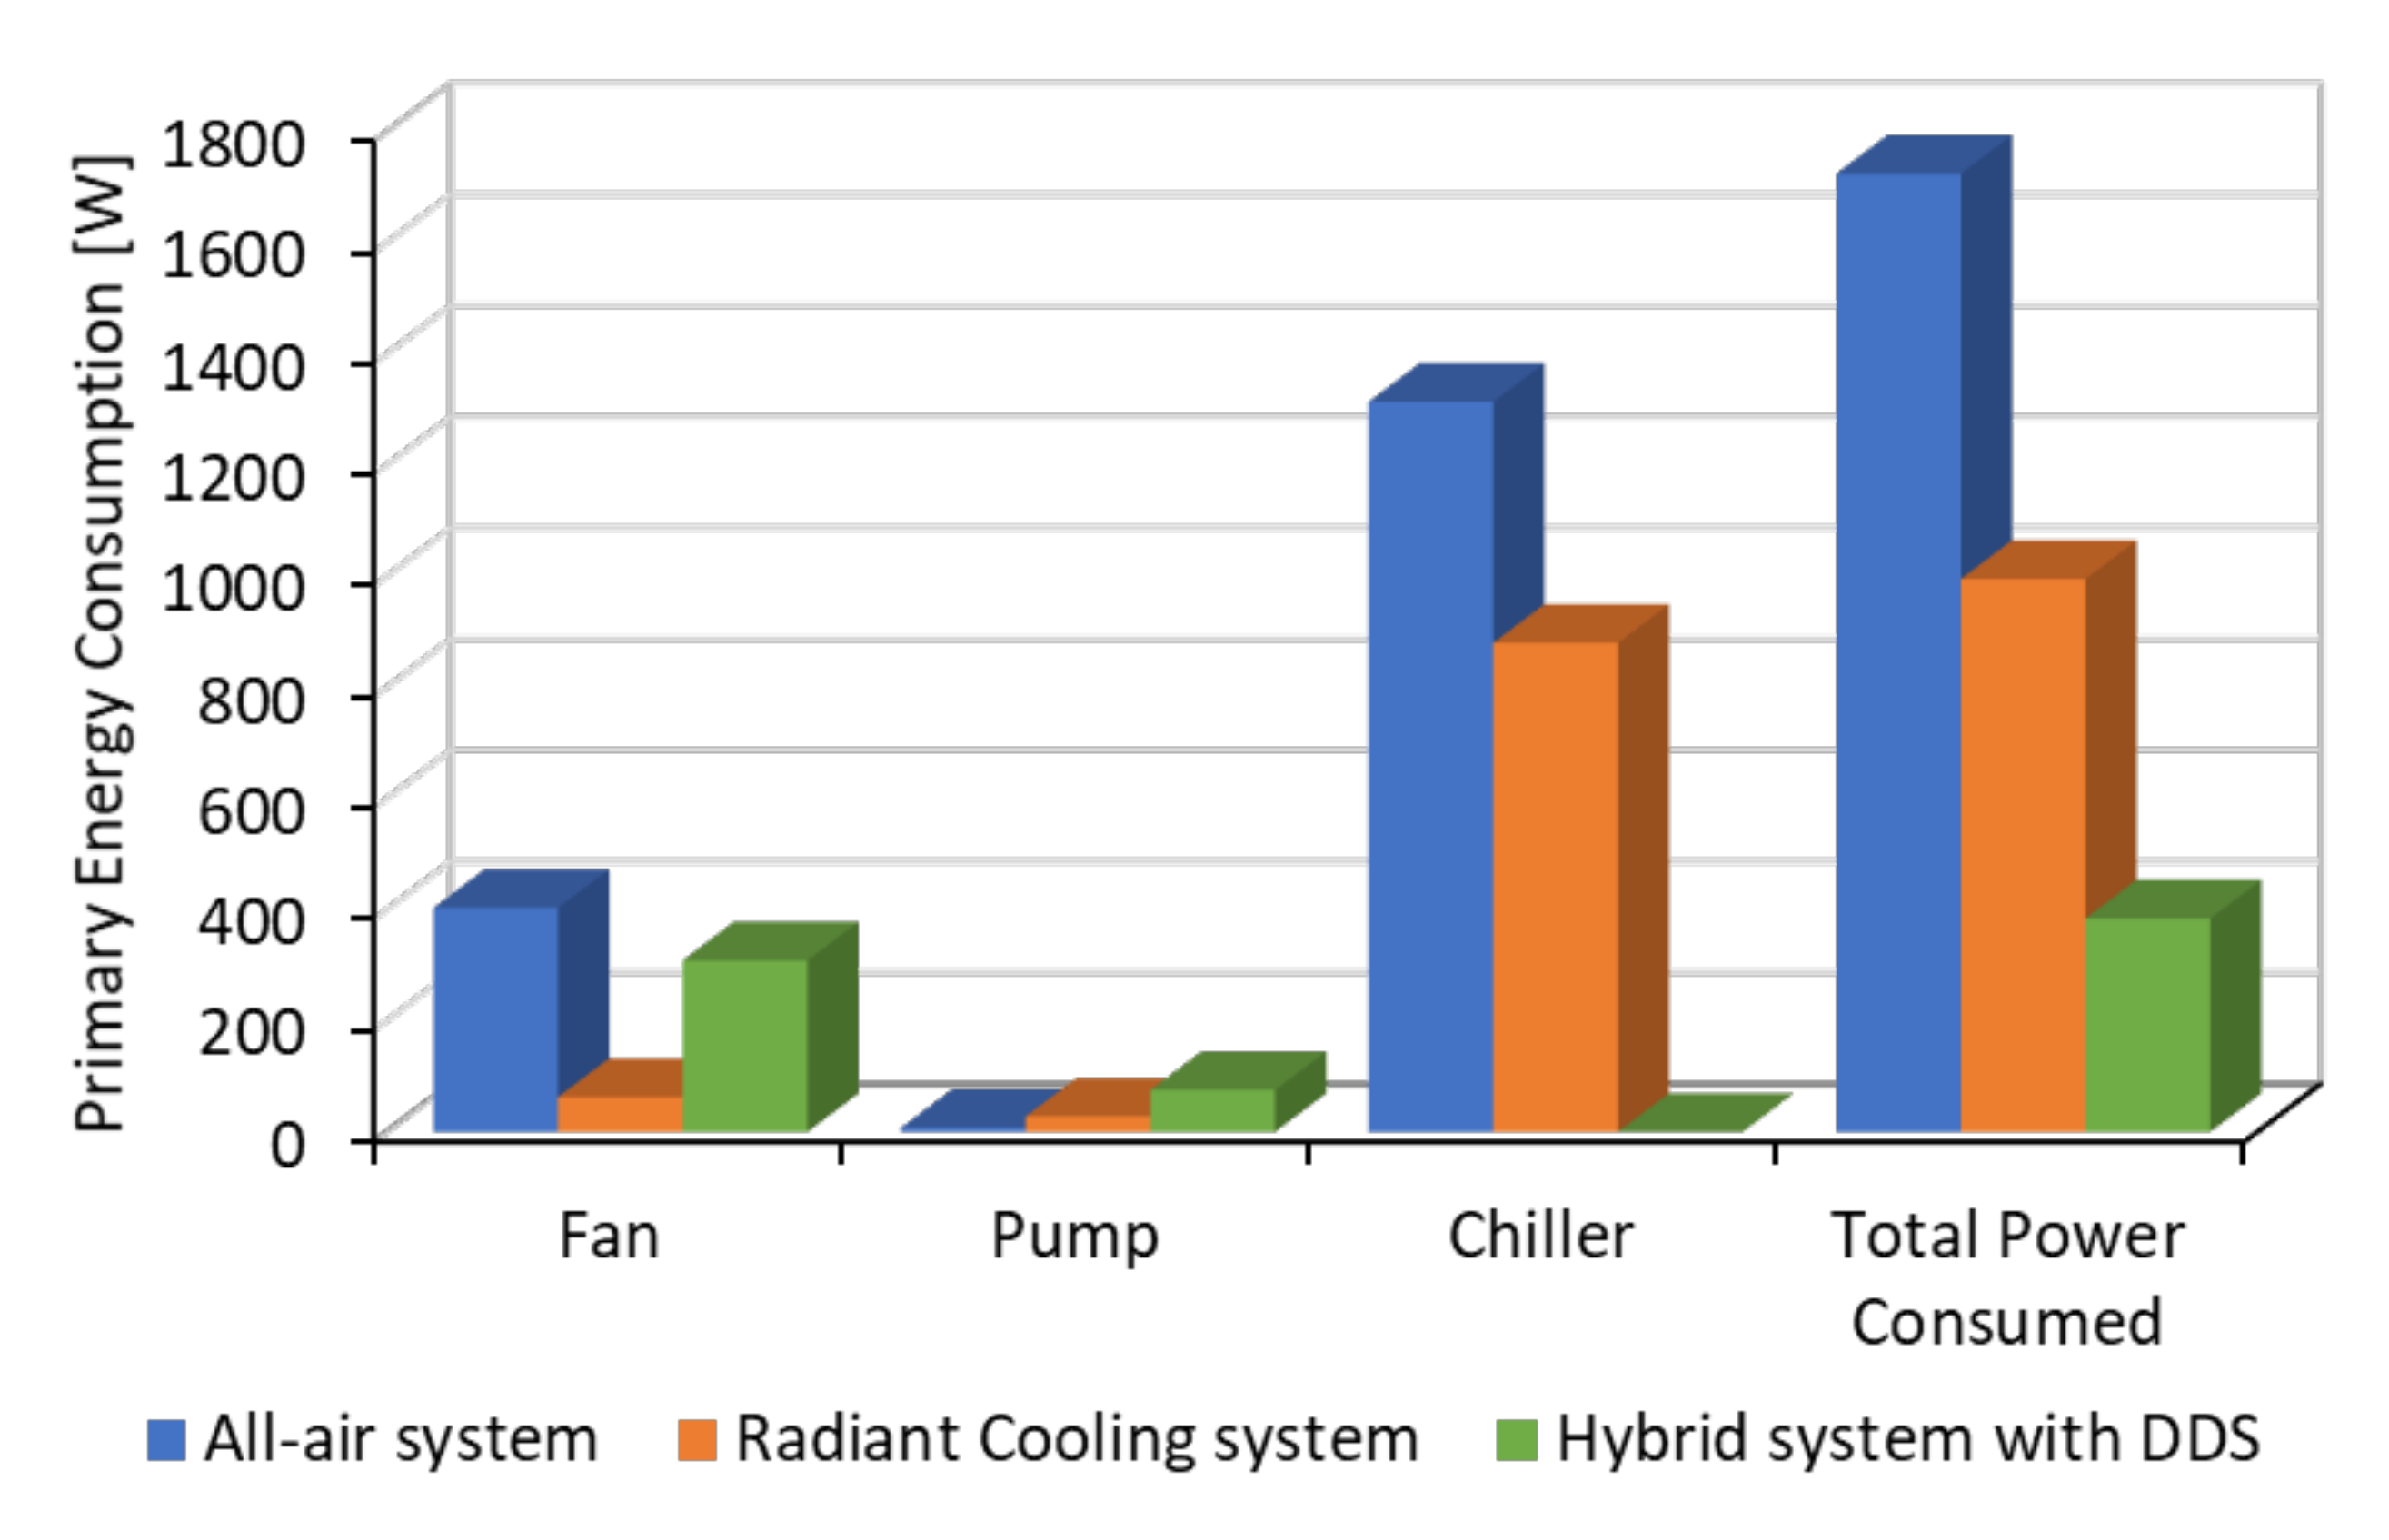
Using Equations (4) and (5), electricity consumptions were obtained and then converted into the equivalent primary energy by assuming a primary energy factor of 3 [49]. The resulting primary and total energy consumptions are illustrated in Figure 8 for the three systems. It can be seen from Figure 8 that, in terms of fan power, the radiant cooling system consumes the least amount of energy, followed by the hybrid and all-air systems, because most of the loads are treated by the chilled water in radiant cooling system. The all-air system consumes the least pump power among the three systems, followed by the radiant and hybrid systems. However, the chiller plant used to supply chilled water, which is the major source of energy consumption in all-air and radiant cooling systems, is replaced by IEC in the proposed hybrid system. As a result, when compared with conventional all-air and radiant cooling systems, total energy savings of 77% and 61%, respectively, can be achieved by the proposed hybrid system. Therefore, it is promising to couple natural ventilation with CCP, IEC, and DDS for thermal comfort and energy saving.

6. Conclusions

A hybrid cooling system which combines radiant cooling with natural ventilation was studied. CFD modelling was used to determine the parameters required for thermal comfort and energy analysis. Furthermore, energy consumptions of conventional all-air, radiant cooling, and hybrid systems were calculated and compared under similar thermal comfort. Finally, the results from this study were summarized to draw the following conclusions:
(1)
Compared to natural ventilation, cooling capacity and thermal comfort can be significantly enhanced by the proposed hybrid system with minimal energy increase due to the coupled high-temperature radiant cooling system.
(2)
While condensation issue can be avoided using the IEC to produce chilled water with a temperature slightly higher than dew point, in hot and humid climate countries such as Singapore, the hybrid system with natural ventilation alone cannot satisfy the thermal comfort requirement of heat-intensive office spaces in all climatic conditions, especially when the air supply from ventilation is low or when the outdoor dew point is higher than 24 °C. For a higher reliability of such a system, a secondary fresh air supply system such as DDS should be installed.
(3)
The proposed hybrid system with DDS can save up to 77% and 61% of primary energy in comparison with conventional all-air and radiant cooling systems, respectively.
(4)
The hybrid system by coupling natural ventilation with radiant cooling, IEC, and DDS is a feasible alternative to conventional air-conditioning systems for desired thermal comfort and minimal energy consumption in tropical areas with a hot and humid climate.
As for future work, realistic building designs will be included and an experimental approach to compare these cooling systems in the dynamic cooling load condition will be implemented.

Author Contributions

Conceptualization, X.Z., P.S. and Y.W.W.; methodology: X.Z., P.S. and G.N.; writing, X.Z. and P.S.; review and editing, P.S., S.D., Y.W.W. and S.Q.; software, G.N.; formal analysis, P.S.; supervision, S.D.; project administration, S.D. and S.Q.; funding acquisition, S.D. and S.Q. All authors have read and agreed to the published version of the manuscript.

Funding

This research is supported under RIE 2020 grant (Grant number: I1801E0020).

Data Availability Statement

The data presented in this study are available on request from the corresponding author.

Acknowledgments

This study is supported under the RIE2020 Industry Alignment Fund—Industry Collaboration Projects (IAF-ICP) Funding Initiative, as well as cash and in-kind contribution from Surbana Jurong Pte, Ltd.

Conflicts of Interest

The authors declare no conflict of interest.

Appendix A

Appendix A.1. Macro Simulation

The computational domain and boundary conditions are schematically shown in Figure A1 for the simulation of natural ventilation. As seen from Figure A1a, the office model, located in the center of the air domain, was sized 4 m × 4 m × 2.93 m (length × width × height) with two cross-ventilated openings on each wall. By taking the height of the office model as the reference length scale Hr, the upstream and downstream were both sized 7 Hr while the height was 5.5 Hr for the computational domain, to ensure the airflow was fully developed in the CFD model [33].
Figure A1. Design conditions for simulation of natural ventilation illustrating various domains: (a) Computational domain, (b) Boundary conditions: side view, and (c) Boundary conditions: top view.
Energies 14 07825 g0a1
The boundary conditions are shown in Figure A1b,c for side and top views, respectively. The inbound vertical wind profile as an inlet boundary condition is described by the logarithmic law and given by Equation (A1) [33]:
U z = u A B L * κ ln z + z 0 z 0
k z = u A B L * 2 C μ
ε z = u A B L * 3 κ z + z 0
u A B L * = U r e f κ ln h + z 0 z 0
where U(z) is the velocity at height z, u A B L * is the atmospheric boundary layer friction velocity, κ is the von Kármán constant (0.42), C μ is a constant (0.09), z0 is the aerodynamic roughness length, and Uref is the specified velocity at the reference height of 15 m. The standard k-ε model was employed as the turbulence model. Moreover, grid independence analysis was necessarily carried out to ensure that the obtained results were independent on the grid density. In this regard, the grid convergence index (GCI) for the different cell numbers (1.8 million, 3.2 million, 4.3 million) was evaluated using the Richardson extrapolation method [50]. The average wind speed through the upstream openings was adopted as the quantity of interest. The GCI decreased from 6.8% (1.8 million cells) to 0.7% (3.2 million cells), suggesting that the total cell number of 3.2 million can produce a grid independent solution.

Appendix A.2. Results

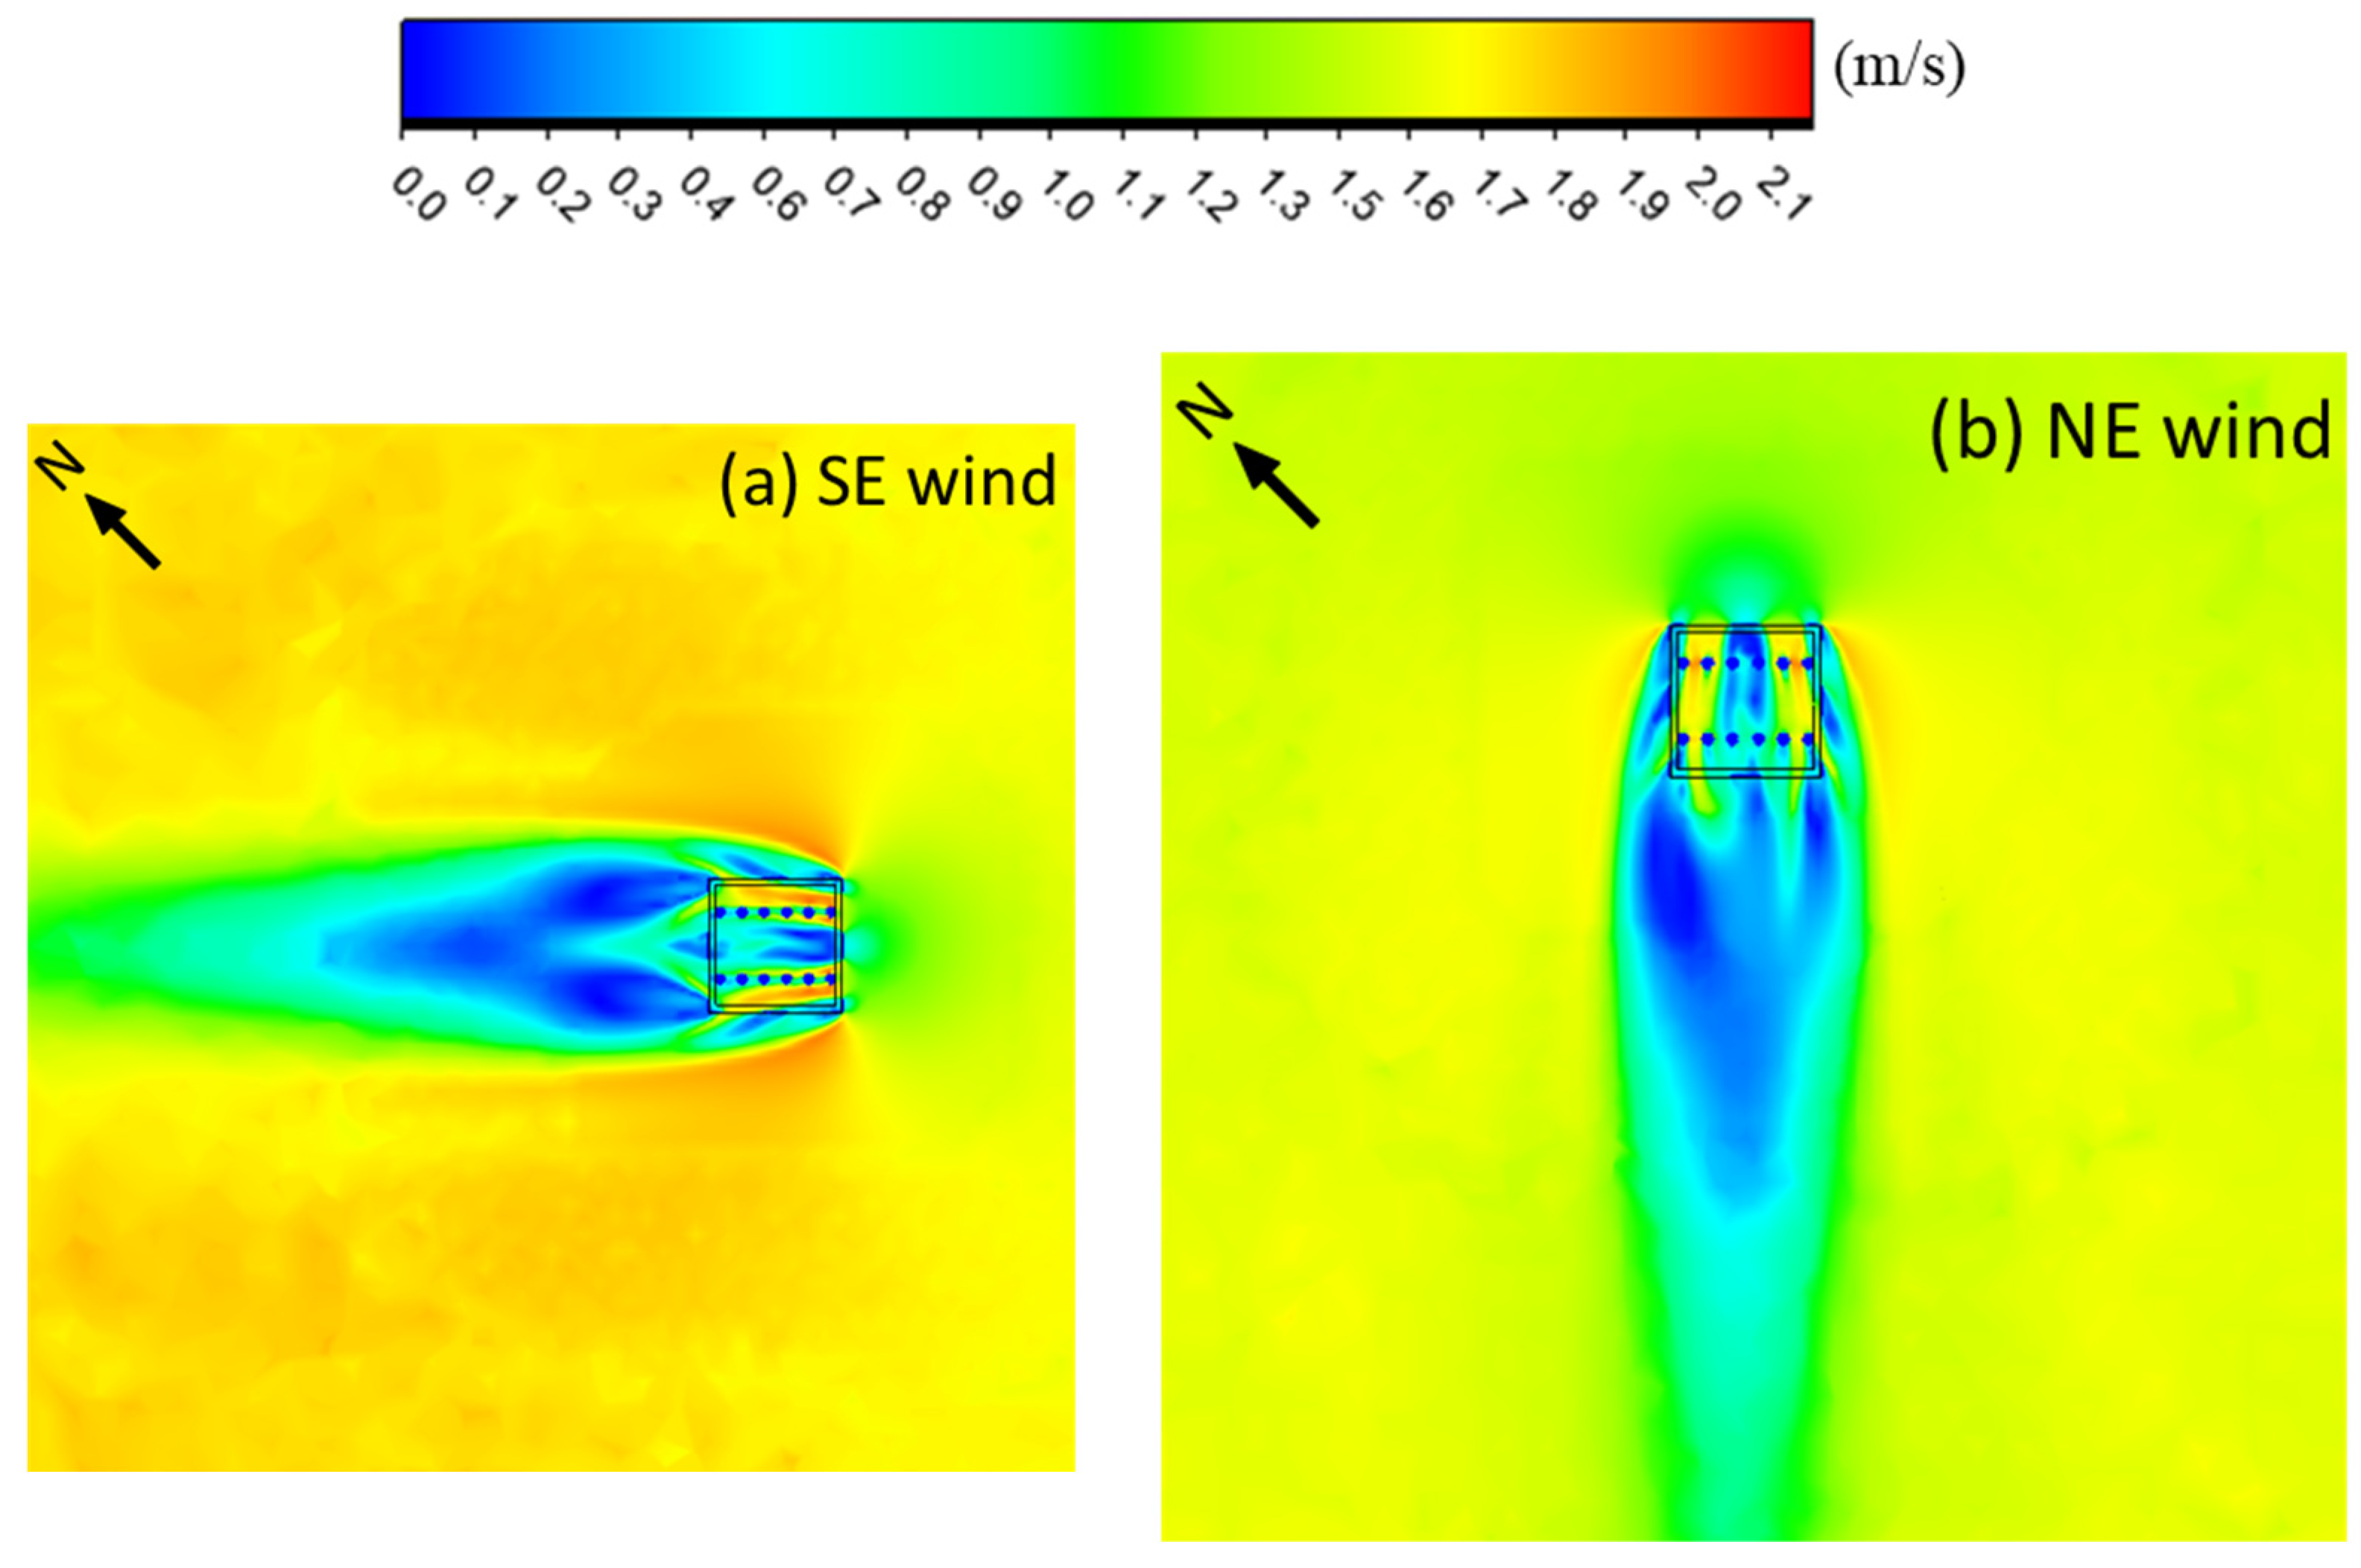
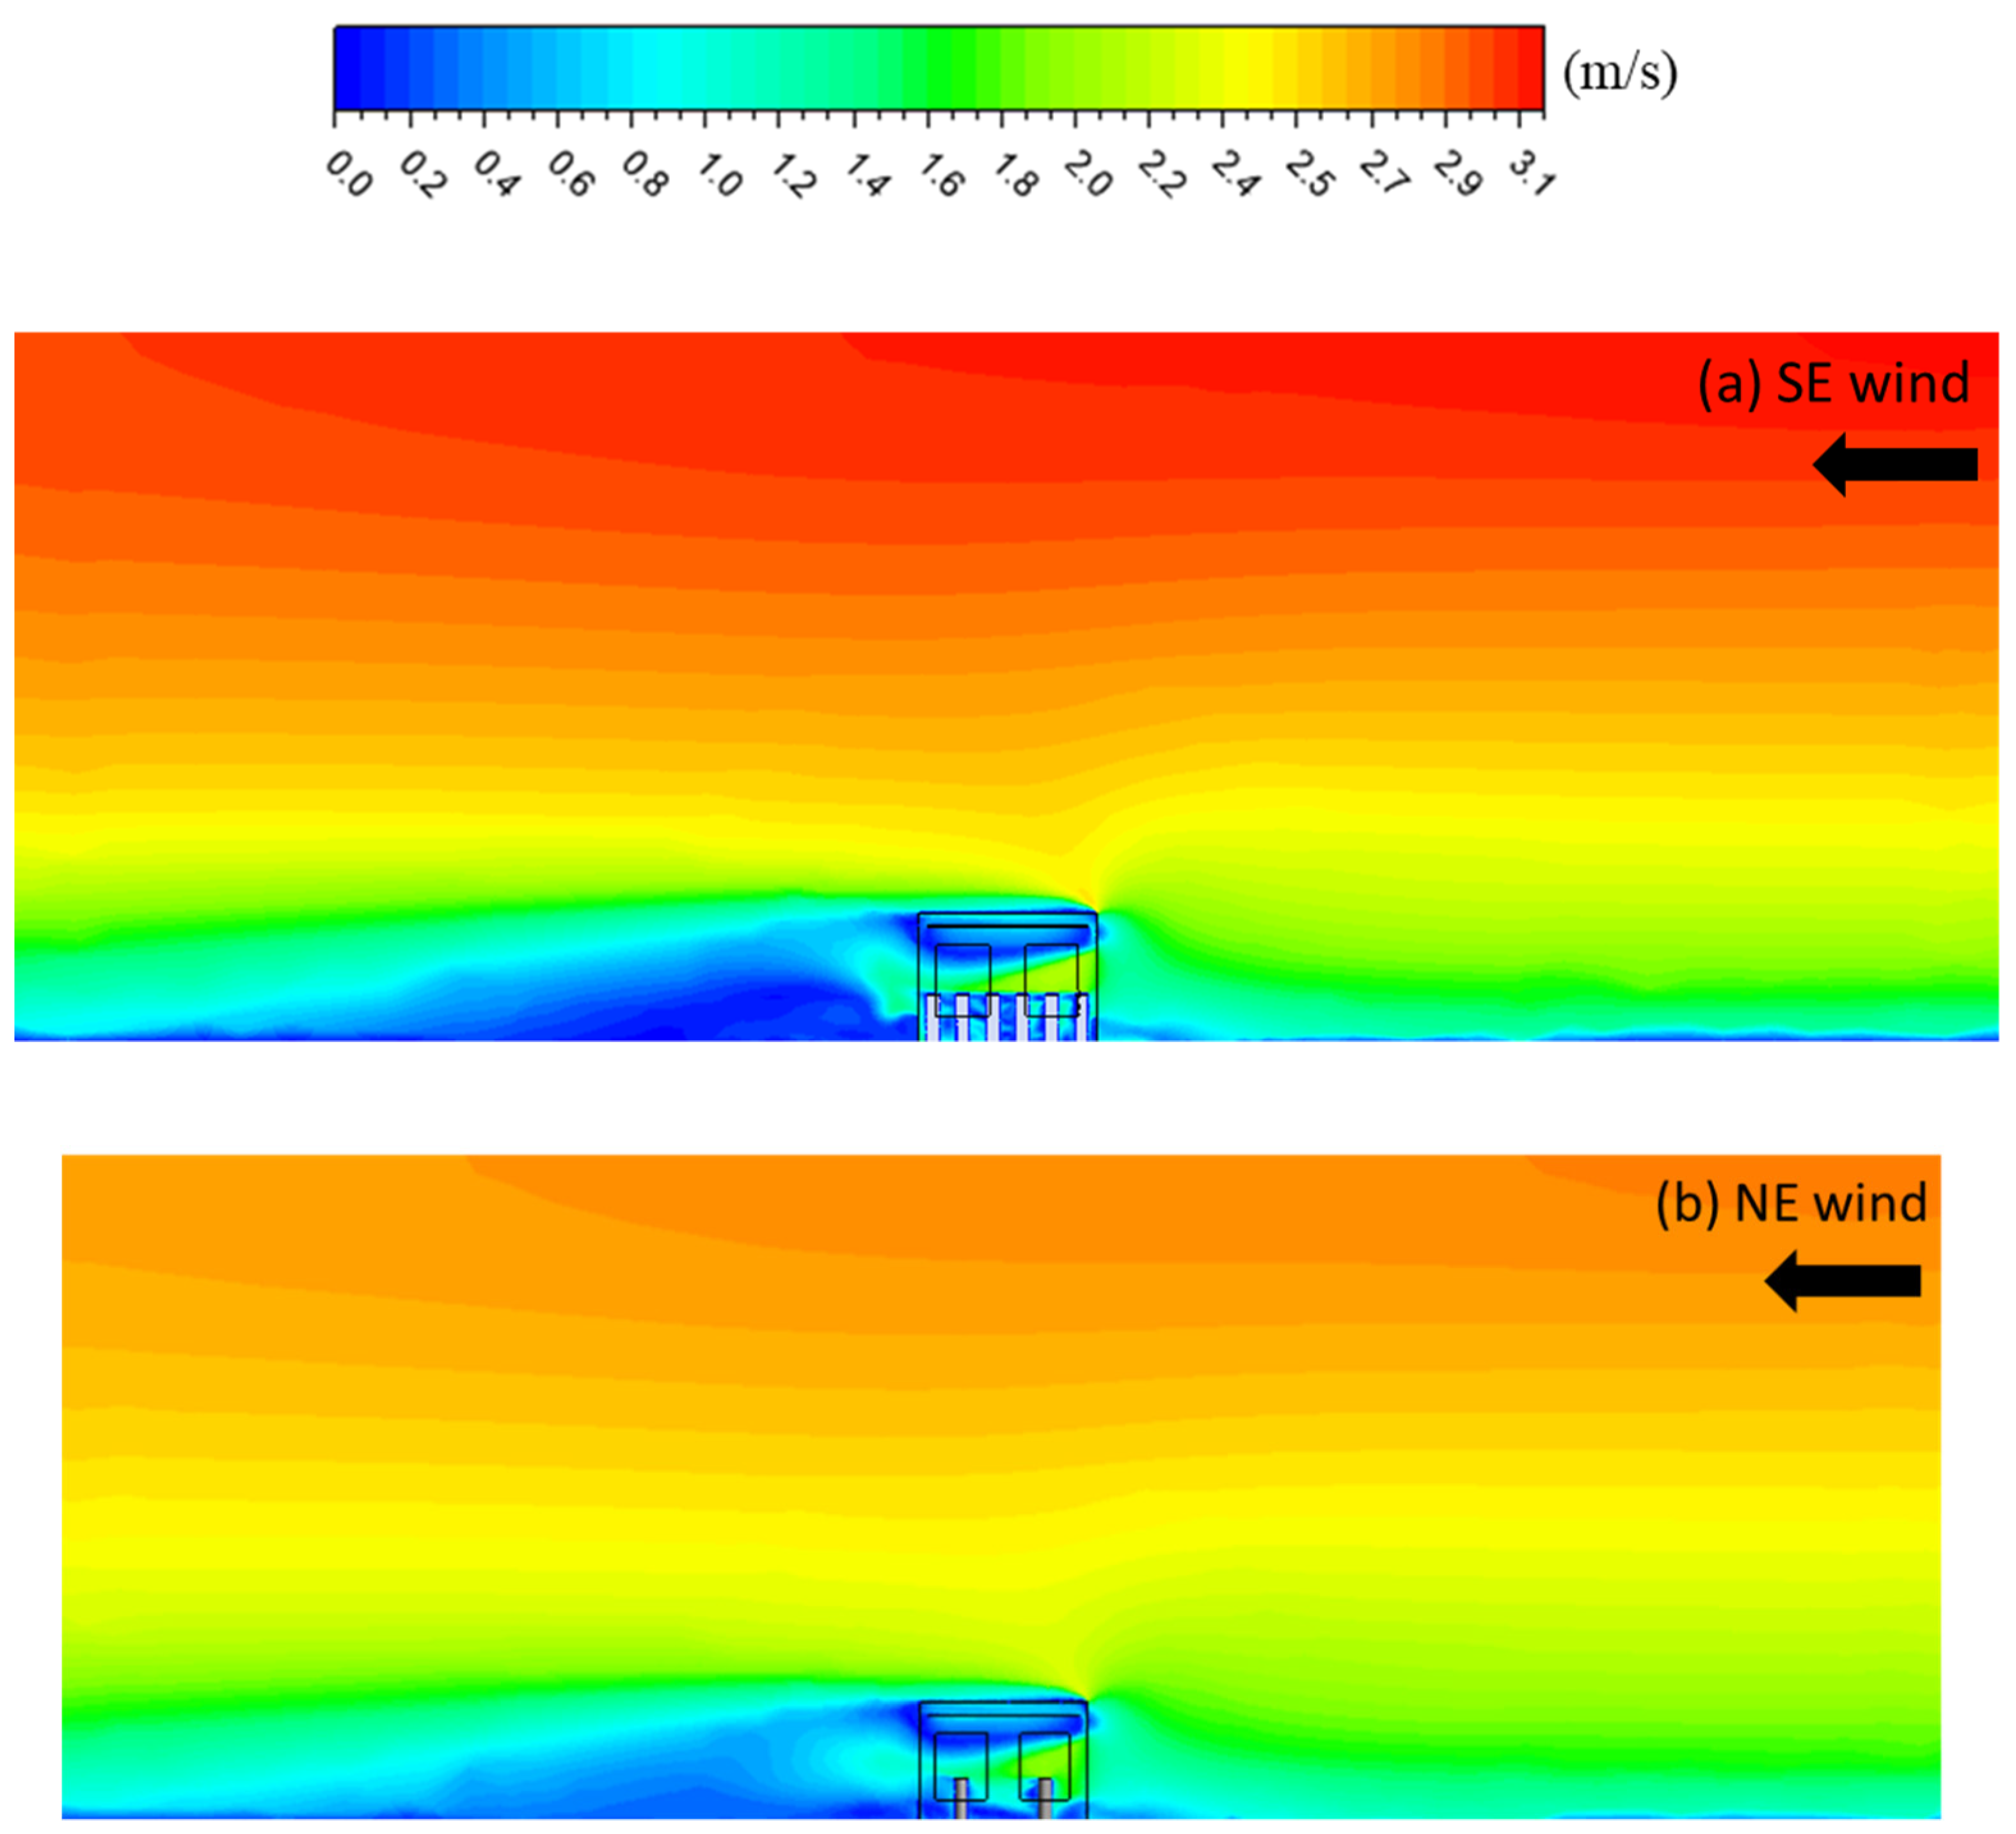
The prevailing wind conditions in Singapore are shown in Table A1. According to the relevant standard [33], the simulation can be conducted based on two best prevailing wind directions, which are NE and SE winds as adopted in the present study, to evaluate the performance of natural ventilation. By applying the selected wind profiles to the developed model of natural ventilation, the results are shown in Figure A2a,b and Figure A3a,b for the velocity contours on the horizontal and vertical planes, respectively. From the results, the average wind velocities through the openings of the office model were 1.5 m/s and 1.3 m/s, respectively, for SE and NE winds. To evaluate the thermal comfort of the office space with the hybrid cooling system, the lower average wind velocity of 1.3 m/s was adopted for the micro simulation.
Table A1. Prevailing wind conditions in Singapore [33].
Wind DirectionReference Velocity (Uref)
North2.0
North-East (NE)2.9
South2.8
South-East (SE)3.2
Figure A2. Velocity contours on the horizontal (x–y) plane: z = 1.1 m for (a) south-east wind, (b) north-east wind.
Energies 14 07825 g0a2
Figure A3. Velocity contours on the vertical plane through middle of window opening for (a) south-east wind and (b) north-east wind.
Energies 14 07825 g0a3

Appendix A.3. Model Validation

In this section, comparisons between simulation and experimental results are made to verify the macro and micro models separately.

Appendix A.4. Macro Simulation

In order to verify the standard k-ε turbulence model of natural ventilation, our geometry was reconfigured to replicate the cross-ventilation model in the experimental study of Ohba [51], as shown in Figure A4. Assuming the model height as the reference length scale Hr, the upstream and downstream were both sized as 7 Hr while the height was 5.5 Hr for the computational domain. Based on the measurement, the wind profile as the inlet velocity was described in the form of the power law as shown in Equation (A5) [52].
U z = 7 z 0.15 0.25
Figure A4. Cross-ventilation model [51].
Energies 14 07825 g0a4
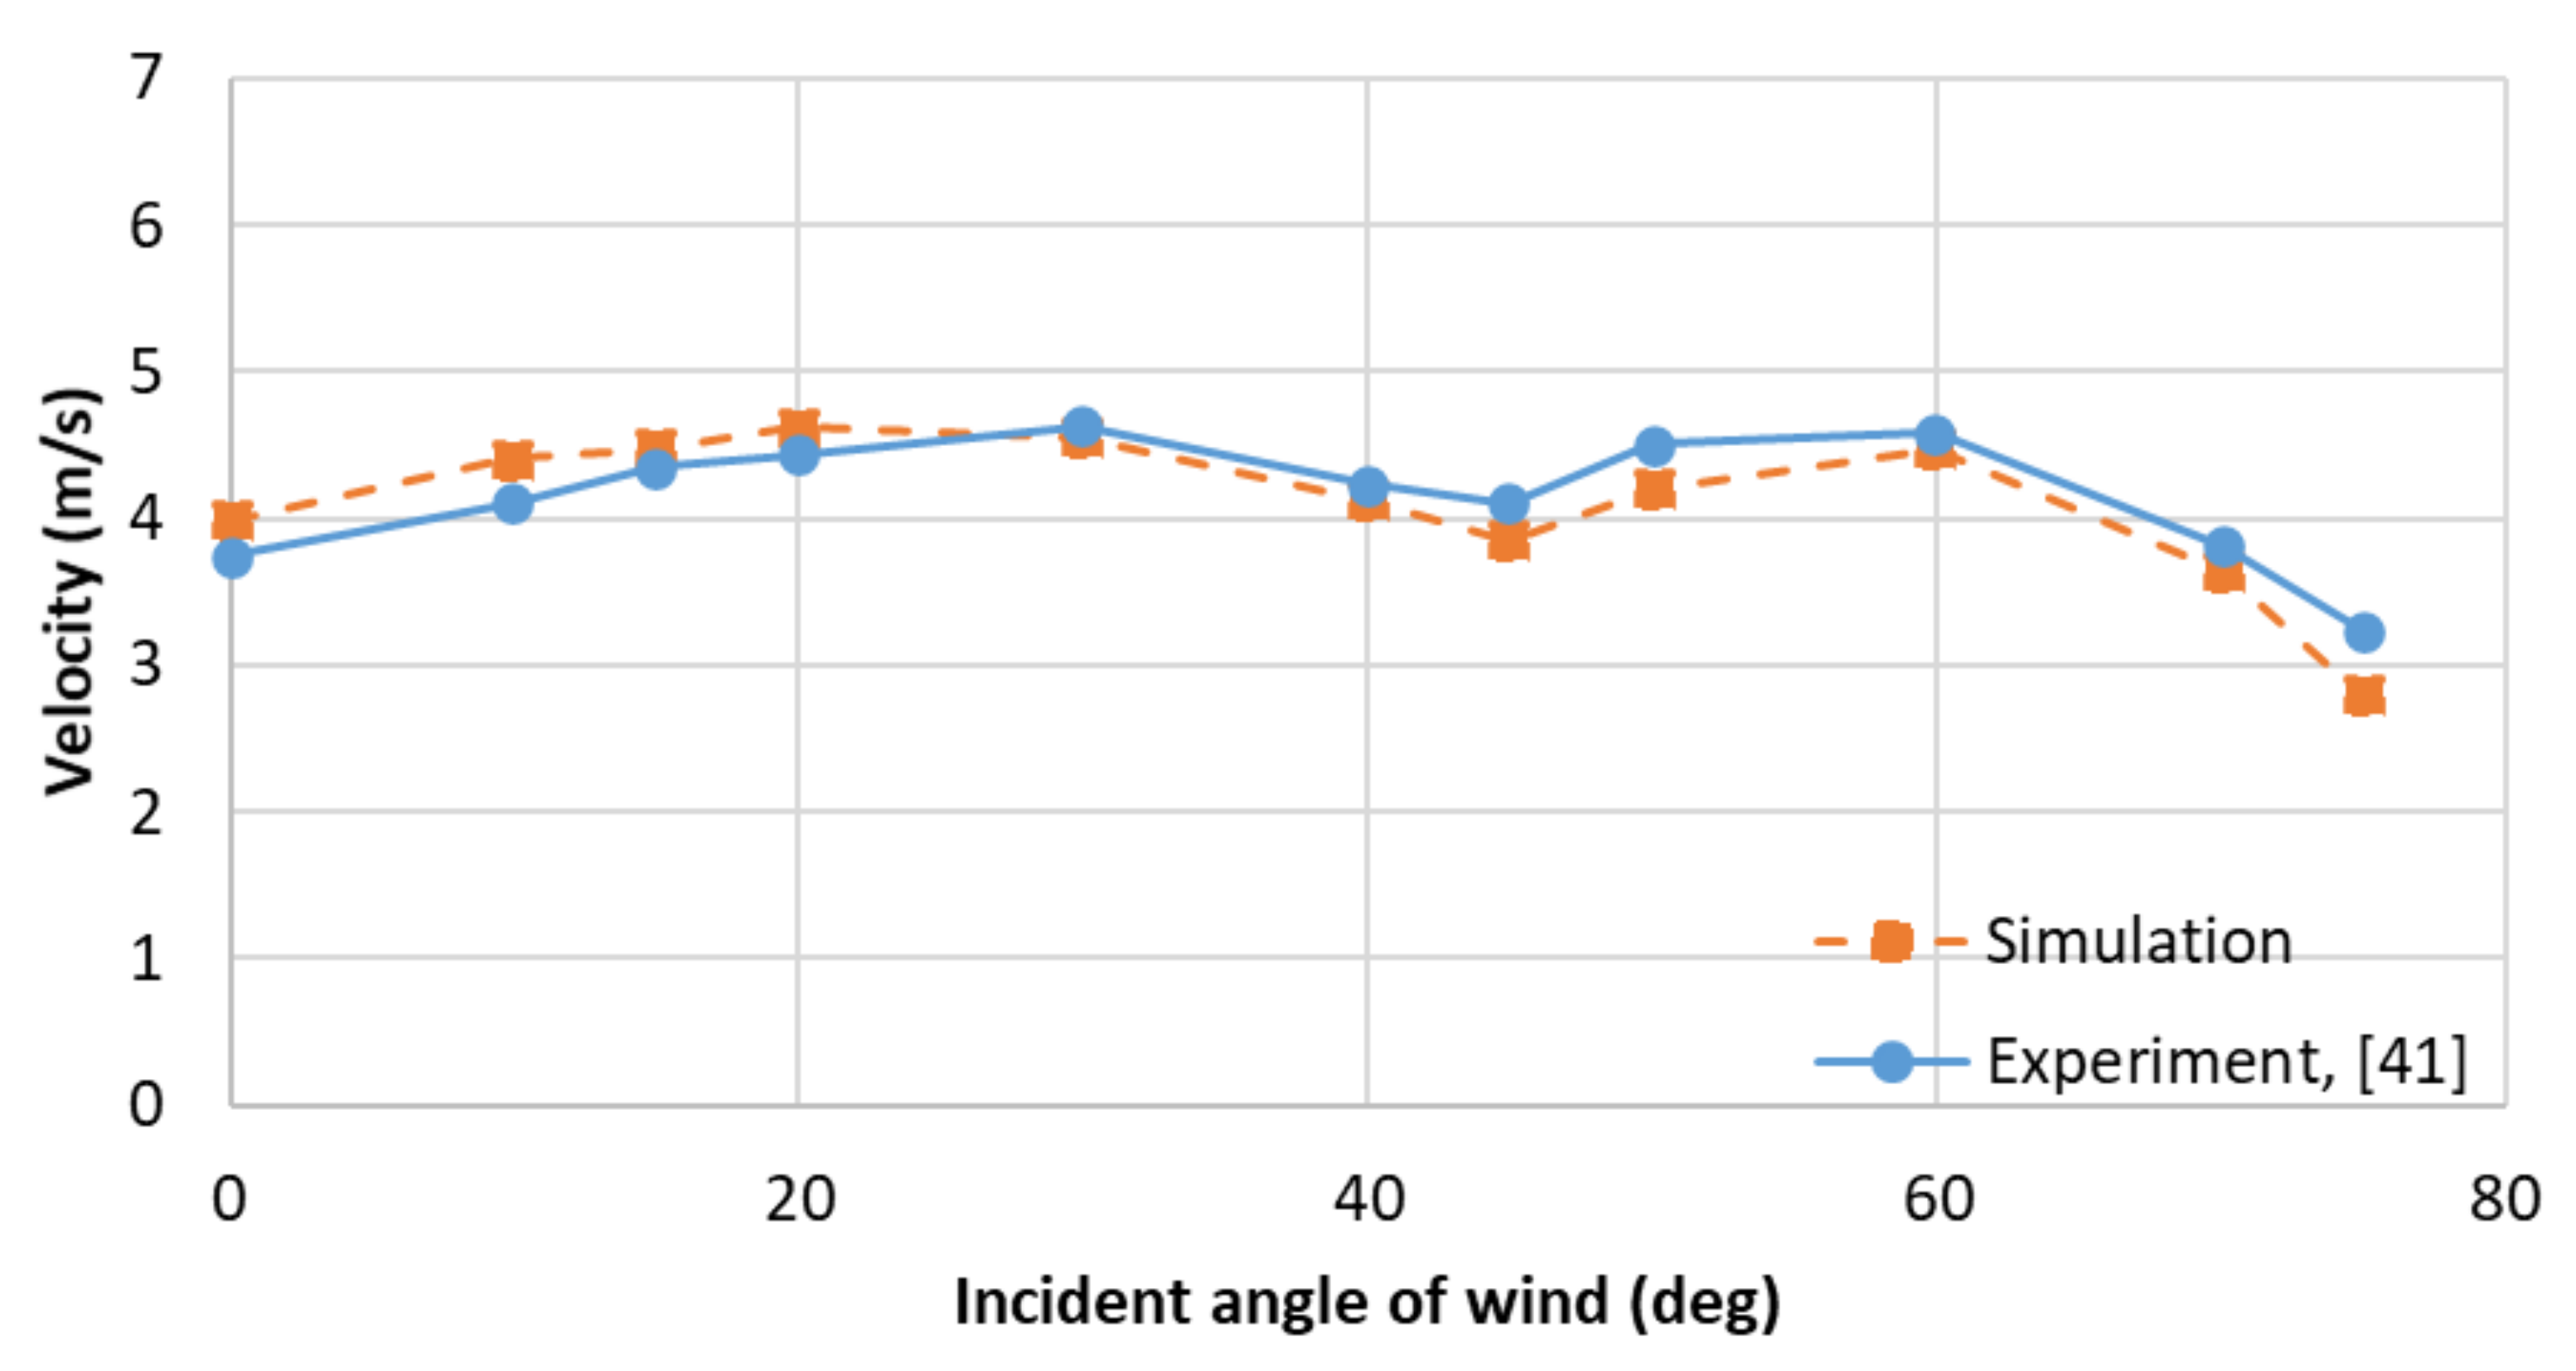
Figure A5 compares the simulated and measured air velocity through the opening in various wind directions. To quantitively evaluate the model accuracy, the cumulative variation of root mean square error (CVRMSE) was introduced and given by Equation (A6) [53].
C V R M S E = i = 1 j E i S i 2 / j i = 1 j E i / j
where Ei and Si are the ith experimental and simulated results, respectively. Using the equation, the calculated CVRMSE between the simulated and measured air velocity was equal to 1.3%, which is acceptably within engineering tolerance. Therefore, the developed model proved sufficiently accurate in assessing the natural ventilation performance.
Figure A5. Comparison of simulated and experimental results for air velocity through the opening.
Energies 14 07825 g0a5

Appendix A.5. Micro Simulation

To validate the test room model, the simulation results were compared accordingly with the mockup test conducted by Shin [32], as the simulation model and mockup test are constructed based on the same testing standard of chilled ceilings [31]. For model validation under various load conditions, two cases of experimental design are shown in Table A2 by adjusting the cooling load and supply water temperature.
Table A2. Case design of experiments for model validation [32].
No.Case 1Case 2
Heating capacity of dummy, W939.8469.9
Cooling water flow rate, lpm77
Cooling water flow rate, g/s117117
Supply water temperature, °C1517
The results are shown in Figure A6a,b for the two cases, by comparing the simulated and measured air temperature and cooling capacity. Using Equation (12), the CVRMSE for the air temperature was achieved as 2.55% and 2.08% for Cases 1 and 2, respectively. For the grid independence analysis, a poly-hexcore mesh was prepared using ANSYS Fluent meshing, where 797.759 cells were generated and the value of 0.5 was achieved for the minimum orthogonal quality. Moreover, the difference of the cooling capacity between the simulation and experiment was limited, indicating that good agreement was achieved between the proposed CFD model and the published experimental results.
Figure A6. Comparison of simulated and experimental results for air temperature and cooling capacity.
Energies 14 07825 g0a6

References

  1. Oh, S.J.; Ng, K.C.; Thu, K.; Chun, W.; Chua, K.J.E. Forecasting long-term electricity demand for cooling of Singapore’s buildings incorporating an innovative air-conditioning technology. Energy Build. 2016, 127, 183–193. [Google Scholar] [CrossRef]
  2. Emmerich, S.; Dols, W.; Axley, J. Natural Ventilation Review and Plan for Design and Analysis Tools; NIST Interagency/Internal Report (NISTIR); National Institute of Standards and Technology: Gaithersburg, MD, USA, 2001. Available online: https://tsapps.nist.gov/publication/get_pdf.cfm?pub_id=860854 (accessed on 8 August 2021).
  3. Omrani, S.; Garcia-Hansen, V.; Capra, B.; Drogemuller, R. Natural ventilation in multi-storey buildings: Design process and review of evaluation tools. Build. Environ. 2017, 116, 182–194. [Google Scholar] [CrossRef] [Green Version]
  4. Gil-Baez, M.; Barrios-Padura, Á.; Molina-Huelva, M.; Chacartegui, R. Natural ventilation systems to enhance sustainability in buildings: A review towards zero energy buildings in schools. E3S Web Conf. 2017, 22. [Google Scholar] [CrossRef] [Green Version]
  5. Escombe, A.R.; Oeser, C.C.; Gilman, R.H.; Navincopa, M.; Ticona, E.; Pan, W.; Martínez, C.; Chacaltana, J.; Rodríguez, R.; Moore, D.A.J.; et al. Natural Ventilation for the Prevention of Airborne Contagion. PLoS Med. 2007, 4, e68. [Google Scholar] [CrossRef] [Green Version]
  6. Etheridge, D. Natural Ventilation of Buildings: Theory, Measurement and Design; John Wiley & Sons: Hoboken, NJ, USA, 2011. [Google Scholar]
  7. Khanal, R.; Lei, C. Solar chimney—A passive strategy for natural ventilation. Energy Build. 2011, 43, 1811–1819. [Google Scholar] [CrossRef]
  8. Nomura, M.; Hiyama, K. A review: Natural ventilation performance of office buildings in Japan. Renew. Sustain. Energy Rev. 2017, 74, 746–754. [Google Scholar] [CrossRef]
  9. Mochida, A.; Yoshino, H.; Takeda, T.; Kakegawa, T.; Miyauchi, S. Methods for controlling airflow in and around a building under cross-ventilation to improve indoor thermal comfort. J. Wind Eng. Ind. Aerodyn. 2005, 93, 437–449. [Google Scholar] [CrossRef]
  10. Karava, P.; Stathopoulos, T.; Athienitis, A.K. Wind-induced natural ventilation analysis. Sol. Energy 2007, 81, 20–30. [Google Scholar] [CrossRef]
  11. Aldawoud, A.; Clark, R. Comparative analysis of energy performance between courtyard and atrium in buildings. Energy Build. 2008, 40, 209–214. [Google Scholar] [CrossRef]
  12. Khan, N.; Su, Y.; Riffat, S.B. A review on wind driven ventilation techniques. Energy Build. 2008, 40, 1586–1604. [Google Scholar] [CrossRef]
  13. Cheng, X.; Shi, L.; Dai, P.; Zhang, G.; Yang, H.; Li, J. Study on optimizing design of solar chimney for natural ventilation and smoke exhaustion. Energy Build. 2018, 170, 145–156. [Google Scholar] [CrossRef]
  14. Lei, Y.; Zhang, Y.; Wang, F.; Wang, X. Enhancement of natural ventilation of a novel roof solar chimney with perforated absorber plate for building energy conservation. Appl. Therm. Eng. 2016, 107, 653–661. [Google Scholar] [CrossRef]
  15. Deuble, M.P.; de Dear, R.J. Mixed-mode buildings: A double standard in occupants’ comfort expectations. Build. Environ. 2012, 54, 53–60. [Google Scholar] [CrossRef]
  16. ASHRAE Handbook. HVAC SYSTEMS and Equipment; American Society of Heating, Refrigerating and Air-Conditioning Engineers, Inc.: Atlanta, GA, USA, 1996; Volume 39. [Google Scholar]
  17. Rhee, K.N.; Olesen, B.W.; Kim, K.W. Ten questions about radiant heating and cooling systems. Build. Environ. 2017, 112, 367–381. [Google Scholar] [CrossRef] [Green Version]
  18. Kim, M.K.; Leibundgut, H. A case study on feasible performance of a system combining an airbox convector with a radiant panel for tropical climates. Build. Environ. 2014, 82, 687–692. [Google Scholar] [CrossRef]
  19. Jiang, Y.; Xie, X. Theoretical and testing performance of an innovative indirect evaporative chiller. Sol. Energy 2010, 84, 2041–2055. [Google Scholar] [CrossRef]
  20. Kim, M.K.; Liu, J.; Cao, S.-J. Energy analysis of a hybrid radiant cooling system under hot and humid climates: A case study at Shanghai in China. Build. Environ. 2018, 137, 208–214. [Google Scholar] [CrossRef]
  21. Lipczynska, A.; Kaczmarczyk, J.; Melikov, A.K. Thermal environment and air quality in office with personalized ventilation combined with chilled ceiling. Build. Environ. 2015, 92, 603–614. [Google Scholar] [CrossRef]
  22. Al Assaad, D.; Ghali, K.; Ghaddar, N. Effectiveness of intermittent personalized ventilation assisting a chilled ceiling for enhanced thermal comfort and acceptable indoor air quality. Build. Environ. 2018, 144, 9–22. [Google Scholar] [CrossRef]
  23. Fernández-Hernández, F.; Fernández-Gutiérrez, A.; Martínez-Almansa, J.J.; del Pino, C.; Parras, L. Flow patterns and heat transfer coefficients using a rotational diffuser coupled with a radiant floor cooling. Appl. Therm. Eng. 2020, 168, 114827. [Google Scholar] [CrossRef]
  24. Hao, X.; Zhang, G.; Chen, Y.; Zou, S.; Moschandreas, D.J. A combined system of chilled ceiling, displacement ventilation and desiccant dehumidification. Build. Environ. 2007, 42, 3298–3308. [Google Scholar] [CrossRef]
  25. Rees, S.J.; Haves, P. An experimental study of air flow and temperature distribution in a room with displacement ventilation and a chilled ceiling. Build. Environ. 2013, 59, 358–368. [Google Scholar] [CrossRef] [Green Version]
  26. Hernández, F.F.; López, J.M.C.; Gutiérrez, A.F.; Muñoz, F.D. A new terminal unit combining a radiant floor with an underfloor air system: Experimentation and numerical model. Energy Build. 2016, 133, 70–78. [Google Scholar] [CrossRef]
  27. Yu, T.; Heiselberg, P.; Lei, B.; Pomianowski, M.; Zhang, C.; Jensen, R. Experimental investigation of cooling performance of a novel HVAC system combining natural ventilation with diffuse ceiling inlet and TABS. Energy Build. 2015, 105, 165–177. [Google Scholar] [CrossRef]
  28. Yu, T.; Heiselberg, P.; Lei, B.; Zhang, C.; Pomianowski, M.; Jensen, R.L. Experimental study on the dynamic performance of a novel system combining natural ventilation with diffuse ceiling inlet and TABS. Appl. Energy 2016, 169, 218–229. [Google Scholar] [CrossRef]
  29. Meggers, F.; Guo, H.; Teitelbaum, E.; Aschwanden, G.; Read, J.; Houchois, N.; Pantelic, J.; Calabrò, E. The Thermoheliodome—‘Air conditioning’ without conditioning the air, using radiant cooling and indirect evaporation. Energy Build. 2017, 157, 11–19. [Google Scholar] [CrossRef]
  30. Vangtook, P.; Chirarattananon, S. Application of radiant cooling as a passive cooling option in hot humid climate. Build. Environ. 2007, 42, 543–556. [Google Scholar] [CrossRef]
  31. British Standard—Ventilation for Buildings—Chilled Ceilings—Testing and Rating; BS EN 14240; British Standards Institution: London, UK, 2004.
  32. Shin, M.S.; Rhee, K.N.; Park, S.H.; Yeo, M.S.; Kim, K.W. Enhancement of cooling capacity through open-type installation of cooling radiant ceiling panel systems. Build. Environ. 2019, 148, 417–432. [Google Scholar] [CrossRef]
  33. Building and Construction Authority (BCA). Green Mark for New Non-Residential Buildings: Technical Guide and Requirements. 2021. Available online: https://www1.bca.gov.sg/buildsg/sustainability/green-mark-certification-scheme (accessed on 2 September 2021).
  34. Janssen, J. Ventilation for acceptable indoor air quality. ASHRAE J. 1989, 31, 40–42. [Google Scholar]
  35. ASHRAE Standard 55-2004: Thermal Environmental Conditions for Human Occupancy; American Society of Heating, Refrigerating and Air-Conditioning Engineers, Inc.: Atlanta, GA, USA, 2004.
  36. Singapore Standard: Code of Practice for Air-Conditioning and Mechanical Ventilation in Buildings; SS 553: 2009; Enterprise: Singapore, 2009.
  37. Yang, L.; Yan, H.; Lam, J.C. Thermal comfort and building energy consumption implications—A review. Appl. Energy 2014, 115, 164–173. [Google Scholar] [CrossRef]
  38. Fanger, P.O. Thermal Comfort: Analysis and Applications in Environmental Engineering; McGraw-Hill: New York, NY, USA, 1970. [Google Scholar]
  39. Catalina, T.; Virgone, J.; Kuznik, F. Evaluation of thermal comfort using combined CFD and experimentation study in a test room equipped with a cooling ceiling. Build. Environ. 2009, 44, 1740–1750. [Google Scholar] [CrossRef]
  40. ASHRAE Handbook: Fundamentals; American Society of Heating, Refrigerating and Air-Conditioning Engineers, Inc.: Atlanta, GA, USA, 2009.
  41. Fanger, P.O. Thermal Comfort; Robert E. Krieger Publishing Company: Malabar, FL, USA, 1982. [Google Scholar]
  42. National University of Singapore, Singapore, Geography Weather Station. 2021. Available online: https://inetapps.nus.sg/fas/geog/ (accessed on 22 September 2021).
  43. ASHRAE Energy Standard for Buildings Except Low-Rise Residential Buildings; American Society of Heating, Refrigerating and Air-Conditioning Engineers, Inc.: Atlanta, GA, USA, 2004; Volume 90.
  44. Narayanan, R.; Saman, W.Y.; White, S.D.; Goldsworthy, M. Comparative study of different desiccant wheel designs. Appl. Therm. Eng. 2011, 31, 1613–1620. [Google Scholar] [CrossRef]
  45. Katejanekarn, T.; Chirarattananon, S.; Kumar, S. An experimental study of a solar-regenerated liquid desiccant ventilation pre-conditioning system. Sol. Energy 2009, 83, 920–933. [Google Scholar] [CrossRef]
  46. Xu, M.M.; Li, H. Solar Desiccant Cooling System BT—Handbook of Energy Systems in Green Buildings; Wang, R., Zhai, X., Eds.; Springer: Berlin/Heidelberg, Germany, 2018; pp. 301–323. [Google Scholar]
  47. Niu, J.L.; Zhang, L.Z.; Zuo, H.G. Energy savings potential of chilled-ceiling combined with desiccant cooling in hot and humid climates. Energy Build. 2002, 34, 487–495. [Google Scholar] [CrossRef]
  48. Porumb, B.; Bălan, M.; Porumb, R. Potential of Indirect Evaporative Cooling to Reduce the Energy Consumption in Fresh Air Conditioning Applications. Energy Procedia 2016, 85, 433–441. [Google Scholar] [CrossRef] [Green Version]
  49. Coz, T.D.; Kitanovski, A.; Poredos, A. Primary energy factor of a district cooling system/Faktor primarne energije sistema daljinskega hlajenja. Stroj. Vestn. J. Mech. Eng. 2016, 62, 717–731. Available online: https://link.gale.com/apps/doc/A474041498/AONE?u=tacoma_comm&sid=googleScholar&xid=45003155 (accessed on 17 November 2021). [CrossRef]
  50. Celik, I.B.; Ghia, U.; Roache, P.J.; Freitas, C.J. Procedure for Estimation and Reporting of Uncertainty Due to Discretization in CFD Applications. J. Fluids Eng. 2018, 130, 078001. [Google Scholar]
  51. Ohba, M.; Irie, K.; Kurabuchi, T. Study on airflow characteristics inside and outside a cross-ventilation model, and ventilation flow rates using wind tunnel experiments. J. Wind Eng. Ind. Aerodyn. 2001, 89, 1513–1524. [Google Scholar] [CrossRef]
  52. Cheung, J.O.P.; Liu, C.-H. CFD simulations of natural ventilation behaviour in high-rise buildings in regular and staggered arrangements at various spacings. Energy Build. 2011, 43, 1149–1158. [Google Scholar] [CrossRef]
  53. Measurement of energy, demand, and water savings. In ASHRAE Guideline14-2014; American Society of Heating, Refrigerating and Air-Conditioning Engineers, Inc.: Atlanta, GA, USA, 2014.
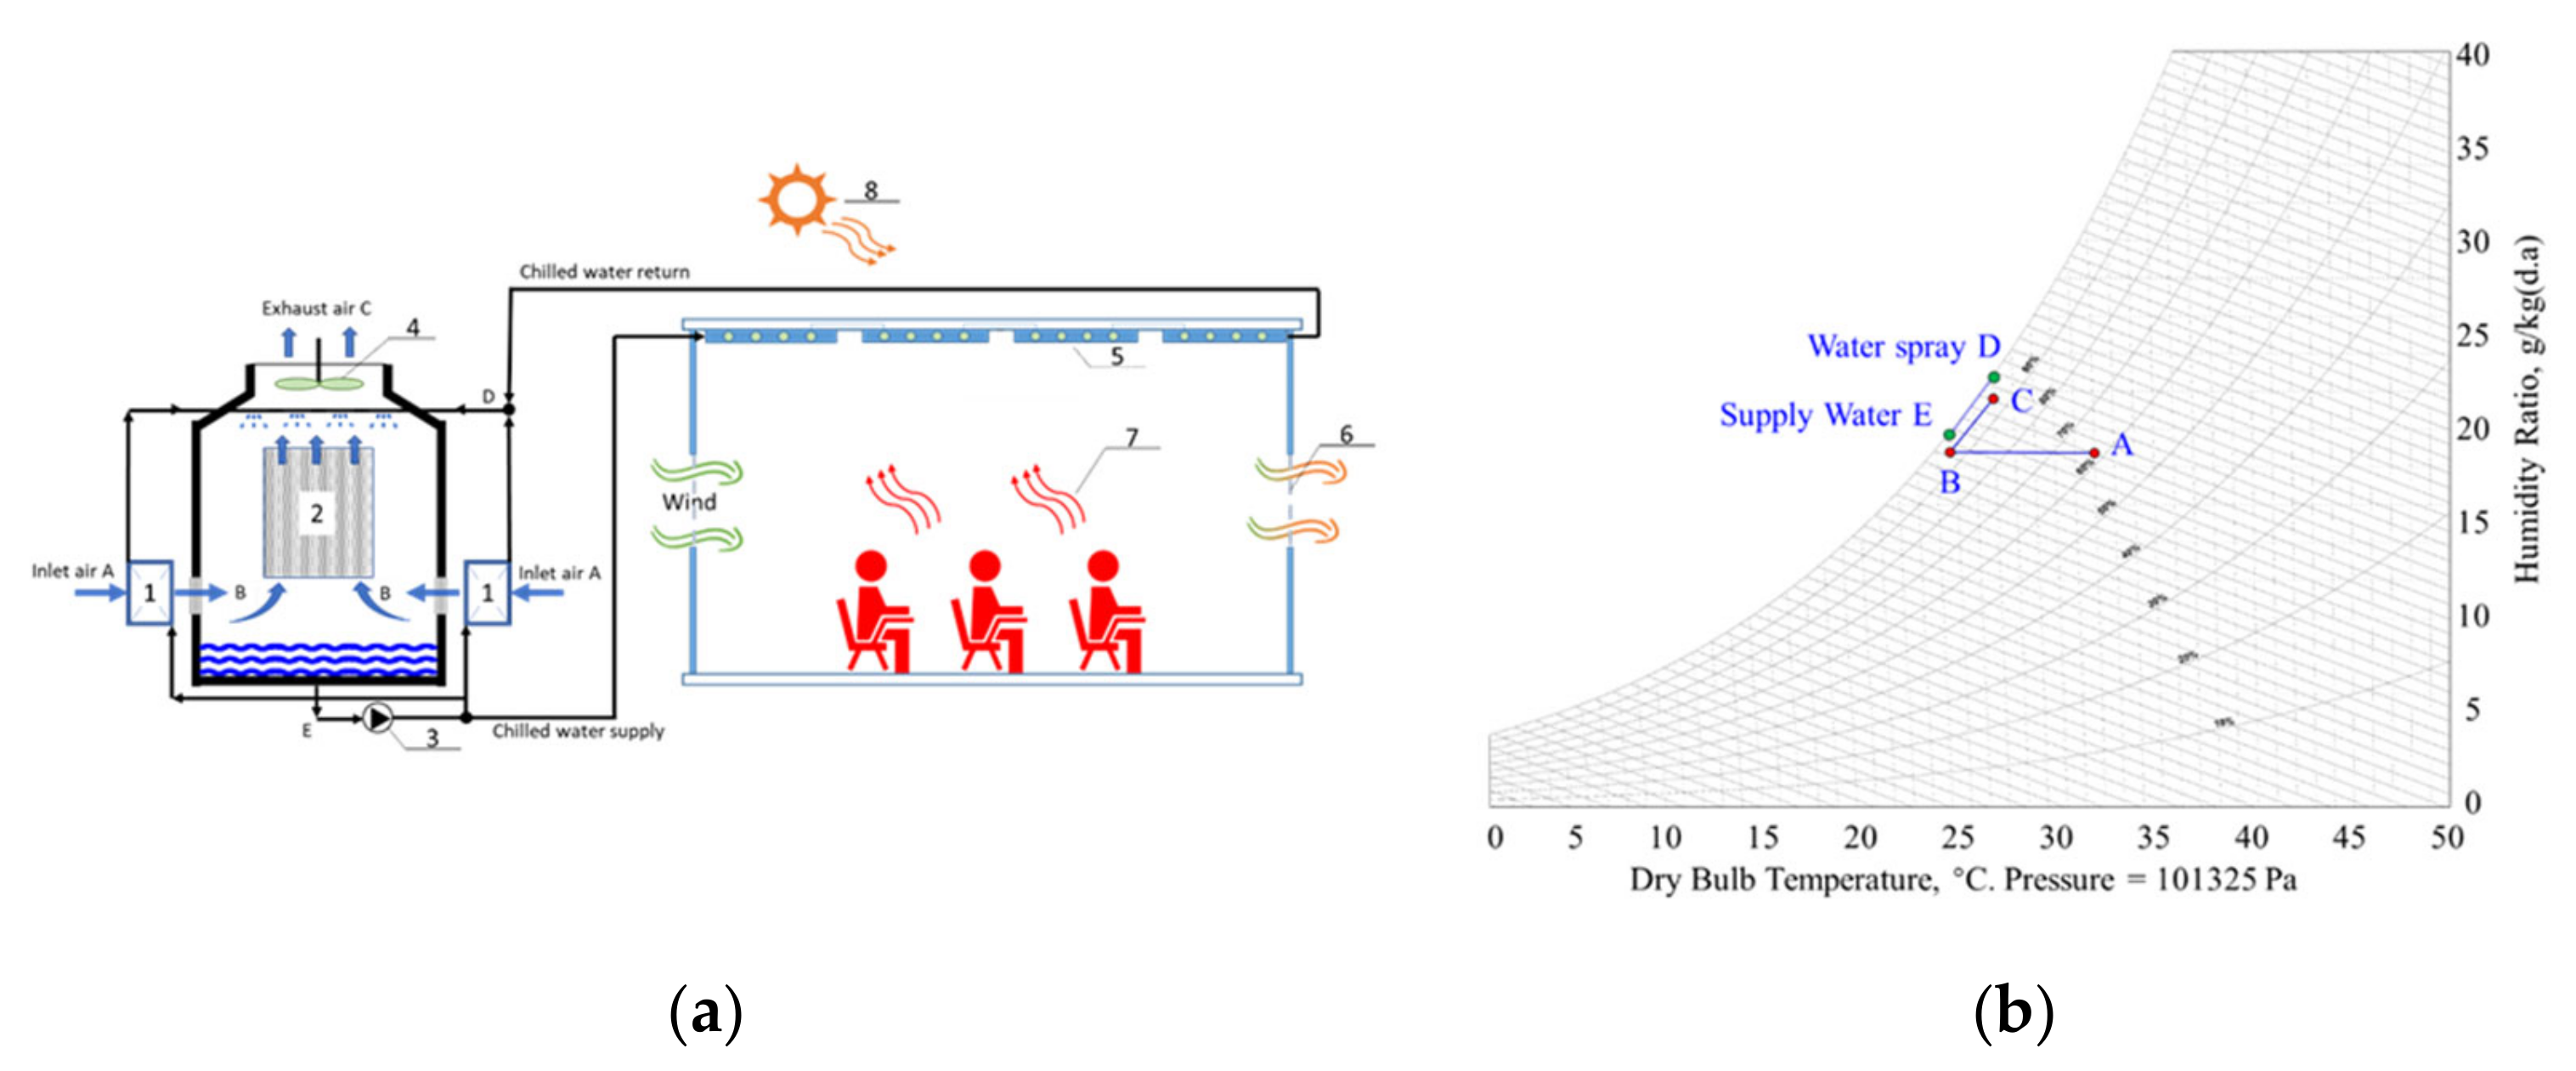
Figure 1. (a) Configuration of proposed hybrid cooling system: (1) air–water counterflow heat exchanger; (2) air–water counterflow padding tower; (3) water pump; (4) fan; (5) chilled ceiling; (6) window opening; (7) internal heat load; (8) solar flux. (b) Psychrometric process to produce chilled water in IEC.
Energies 14 07825 g001
Figure 2. (a) Computational domain and dimensions for office model; (b) exterior surface mesh; (c) interior surface mesh; and (d) volume mesh.
Energies 14 07825 g002
Figure 3. Temperature contours (1.6 m from the wall) for the four different scenarios: (a) natural ventilation with radiant cooling, (b) hybrid system with CCP surface temperature of 26 °C, (c) hybrid system with CCP surface temperature of 27 °C, and (d) hybrid system with CCP surface temperature of 28 °C.
Energies 14 07825 g003
Figure 4. Standard effective temperatures of the four cases.
Energies 14 07825 g004
Figure 5. Effect of air speed on PMV and PPD.
Energies 14 07825 g005
Figure 6. Psychrometric chart for air handling process.
Energies 14 07825 g006
Figure 7. Psychrometric chart for dehumidification in DDS.
Energies 14 07825 g007
Figure 8. Comparison of primary energy consumption.
Energies 14 07825 g008
Table 1. Heat loads and fresh air rate for the test room model.
Heat from Envelope [33],
W/m2
Internal Loads [34,35]Minimum Outdoor Supply Air [36], l/s/Person
Occupant Density,
/100 m2
Occupant Activity, W/PersonLighting, W/m2Equipment, W/m2
40575 (Sensible),
55 (Latent)
12168.5
Table 2. Test designs for thermal comfort evaluation of the hybrid system.
S. No.SystemHeat through Envelope (W/m2)Heat Output of Dummy (W/m2)Wind Temperature
(°C)
CCP Surface Temperature
(°C)
1Natural ventilation403829.5/
2The hybrid system26
327
428
Table 3. Simulation results for the various test cases.
S. No.SystemCCP Surface Temperature
(°C)
Simulation Results
Air Velocity (m/s)Air Temperature
(°C)
MRT (°C)
1Natural
ventilation
\0.6629.730.9
2The hybrid system260.6429.529.9
3270.6429.630.2
4280.6529.630.4
Table 4. Thermal comfort comparison between the four cases.
1234
Compliance to thermal comfortNoYesYesNo
PMV0.570.430.460.5
PPD12%9%9%10%
SensationSlightly warmNeutralNeutralSlightly warm
Table 5. Air state parameters of conventional all-air system.
State PointDry Bulb Temperature (°C)Humidity Ratio (g/kg)Specific Enthalpy (kJ/kg)Relative Humidity (%)
O3218.72980.11162
M27.812.359.452
R27.211.32456.23750
S149.50238.08895
Table 6. Air state parameters for the hybrid system.
State PointDry Bulb Temperature (°C)Humidity Ratio (g/kg)Specific Enthalpy (kJ/kg)Relative Humidity (%)
A3218.780.11163
B2518.772.8993.5
C2721.281.1693.5
Table 7. Air state parameters for dehumidification in DDS.
State PointDry Bulb Temperature (°C)Humidity Ratio (g/kg)Specific Enthalpy (kJ/kg)Relative Humidity (%)
13218.72980.11162
2459.569.73015.827
327.29.551.58542
R27.211.32456.23750
Publisher’s Note: MDPI stays neutral with regard to jurisdictional claims in published maps and institutional affiliations.