Abstract
The growth of renewable energy generation in the power grid brings attention to high-voltage direct current (HVDC) transmission as a valuable solution for stabilizing the system. Robust hybrid power system state estimation could enhance the resilience of the control of these systems. This paper proposes a two-stage, highly robust least-trimmed squares (LTS)-based estimator. The first step combines the supervisory control and data acquisition (SCADA) measurements using the robust LTS-based estimator. The second step merges the obtained state results with the available phasor measurement units (PMUs) measurements using a robust Huber M-estimator. The proposed robust LTS-based estimator shows good performance in the presence of Gaussian measurement noise. The proposed estimator is shown to resist and correct the effect of false data injection (FDI) attacks and random errors on the measurement vector and the Jacobian matrix. The state estimation (SE) is executed on a modified version of the CIGRE bipole LCC-HVDC benchmark model integrated into the IEEE 12-bus AC dynamic test system. The obtained simulation results confirm the effectiveness and robustness of the proposed two-stage LTS-based SE.
1. Introduction
Starting with the first commercial installation in 1954, HVDC technology has been introduced to the conventional AC power systems for long-distance transmission as well as joining asynchronous AC power systems [1]. Recently, HVDC technologies have made substantial advances enabling options such as enhancing system frequency regulation, increasing power flow, and the flexibility of the power grid, which results in improving the stability and resilience of the power system [1,2,3,4]. Failure or disruption of the power system can lead to enormous environmental and public safety risks. Load flow and SE analysis are essential for ensuring stable operating conditions, control, and planning. For the effective operation of modern power grids, an efficient, timely, and precise SE is a vital requirement. State estimation could be either static (SSE) or dynamic (DSE). In practice, the control center receives useful measurements from different Intelligent Electronic Devices (IEDs) [5] through SCADA and measurement devices at remote terminal units (RTUs) at certain regular time snapshots [6], and the SSE processes those measurements. SSE evaluates the voltage magnitudes and phase angles at different buses of interest which gives an idea about the system condition [7]. SSE is necessary for static security analysis (SSA), contingency analysis, load forecasting, and evaluating locational marginal prices (LMPs) for power markets, control, and other fundamental power applications. Conventional SSE is performed using a combination of measurements provided by the SCADA units and, if needed, pseudo-measurements to ensure observability [8]. SCADA units deliver measurements every 2 to 10 s, limiting the speed at which the SSE can be executed.
Recently, PMUs have been implemented to complement the conventional SCADA metering devices and bring additional monitoring measurements to the Energy Management System (EMS). PMUs provide GPS time-synchronized and high-resolution measurements at a rate of 30–60 samples per second [9]. These PMU measurements could be combined with the traditional SCADA measurements to execute the hybrid SSE [10,11,12]. The hybrid SSE can directly merge the PMU with SCADA measurements in the regression estimation [11,12] or it can be executed in two stages [10]. The first stage processes SCADA to estimate a first state estimate which is then refined with the PMU measurements to improve its accuracy. If PMUs are installed in large numbers, a linear PMU-based state estimator could be implemented to estimate the phase angles and voltage magnitudes [13]. Higher penetration of PMU sensors will also enable the practical implementation of dynamic state estimation (DSE). DSE is executed at much higher rates where consecutive states are related using model-based state-space representations, and filters are exploited for prediction, and correction [7,14,15]. Hence, a PMU-based DSE state estimator can follow the dynamic behavior of the power system and sanitize data quickly to support other applications. DSE will be an essential tool in future dynamic security analysis (DSA). All the measurements are communicated from substations and remote locations to the control center. This implies that communication technologies are necessary for proper operation, control, and monitoring of the power system.
Due to the high computing, expanded control capabilities, and richer sensing, the conventional power system is transformed into a Cyber-Physical System (CPS) [16,17]. Although this has improved the operational efficiency of the grid, this multi-communication and multi-function system also becomes more exposed to potential risks from vulnerabilities and cyber-threats. Measurements that are obtained in real time can be targeted by attackers that could degrade the performance of the power system, falsely trigger protection assets, cause financial losses, and even cause power outages. Therefore, system operators are concerned about the increased range of cyber-attack vulnerabilities. At the same time, modern power electronic devices such those in HVDC systems provide fast accurate control, improved performance, and can result in enhanced resilience [2,4], especially when combined with secure system state information.
FDI attacks, where a cyber-attack falsifies communicated measurements, could generate “bad” data present in certain meters that are coordinated to avoid detection. SSE was shown to be vulnerable to stealthy FDI attacks [18]. Improving cyber-security can be very challenging especially if attacks are generated by adversaries that have good knowledge of power systems operation. Attackers’ knowledge and degree of access determine the detectability and possible remedial actions against adverse disturbances [19].
Robust statistics could be an effective online solution against FDI attacks. Robust estimators are reliable even in the presence of outliers that do not follow the assumed model. Outliers could be due to cyber-attacks, random failures, or real-life data that departs from the system statistical model [20]. Cyber-attacks can be viewed as special cases of outliers whose treatment is complex and of great importance. For an estimator to suppress these measurements or outliers, observation redundancy is necessary and can be accomplished in practice by installing more sensors in the system. Several SE methods for identifying outliers have been proposed for both DSE [21,22,23] and SSE [10,19,24,25] . For example, the authors in [10] present a robust two-stage hybrid SSE method that was tested in an AC system. The methods used the Generalized Maximum likelihood GM-estimator for the first stage and an M-estimator for the second stage [26]. However, the effect of the FDI presence in HVDC/AC systems has not been thoroughly investigated. More specifically, few papers of HVDC/AC SE have explored FDI in the measurement vector. To the best of our knowledge, the investigation of the impact of FDI attacks or errors on the topology causing an erroneous Jacobian matrix is very limited in the literature.
Several researchers have incorporated the DC components into ac state estimators for different HVDC/AC systems [27,28,29,30,31,32,33]. Table 1 shows recent papers proposing HVAC/DC SE methods. The authors of [27,28] proposed a distributed two-step SE. The first step estimates the AC and DC states independently, and the second step uses boundary quantities to refine the first step results. The authors in [29] proposed a three-stage estimation algorithm to estimate DC/AC systems. The first and third stages estimate the states linearly, and the second stage computes a one-step nonlinear transform. A linear PMU-based state estimation using WLS for AC/DC systems was introduced in [30]. The authors in [31] have proposed new models of voltage source converters that can be implemented for STATCOM VSC-HVDC/AC power system state estimation. They used WLS to estimate their system’s state. The detection of bad measurements was evaluated. The authors in [32] presented more detailed modeling of the system and implemented the WLS for the SE. The authors in [33] proposed a new SE called improved sequential method to decouple the AC and DC WLS estimation in multiterminal DC systems (MTDC). In [34], a PMU-based state estimator using a WLS was proposed to estimate AC and DC states simultaneously in a VSC-HVDC system. The authors in [35] proposed to correct phasor angle bias for PMU measurements given the availability of redundant voltage and current measurements. The state estimation was formulated as an iterative least-squares problem. The authors in [36,37] proposed a robust least absolute value estimation for an AC/DC grid state estimator and tested its robustness against gross errors in the measurements. The authors in [38] proposed a bad data detection approach that offers better performance than the largest normalized rejection rule (LNR) after WLS state estimation.

Table 1.
Summary of HVDC/AC estimation methods.
The recent literature focuses on VSC converters due to their simple modeling and predictions of their widespread use for future HVDC transmission systems. On the other hand, many LCC converters are still in use in the field, especially for high-power transmission applications due to their high power rating. LCC-HVDC systems could also be more vulnerable to FDI cyber-attacks. This paper focuses on securing SE for LCC-HVDC systems. Furthermore, the proposed LTS-based SE algorithm offers the following advantages:
- A high breakdown estimator that can potentially resist a high percentage of outliers while giving reliable estimates.
- The ability to resist adverse effects of both corrupted measurements and regressor points or leverage points, i.e., the rows of the Jacobian matrix. The Jacobian will be corrupted if the communicated topology at the control center contains errors.
- High efficiency, which implies high estimation accuracy if the data are clean from outliers or cyber-attacks.
- Theoretical results permit a clear evaluation of its breakdown point in the case of a sparse regressor matrix, as is the case for power systems [39].
Leverage points cannot be treated when using WLS and checking its residuals by the classical bad data detectors (BDD) or implementing a robust Huber M- or least absolute estimator (estimator minimizing the L1 norm). These estimators are highly impacted by leverage points giving residuals that are not reliable to detect outliers. This is discussed in the literature in references such as [20,26,39,40].
This paper proposes a two-stage hybrid LTS-based SSE algorithm to improve the robustness of the estimation toward departures from the Gaussian noise assumption in both SCADA and PMU measurements. The proposed SE algorithm estimates the states reliably in the presence of random FDI attacks. The estimator can also resist errors in the SE Jacobian matrix for a hybrid HVAC/DC system.
The robust LTS estimation was considered for SSE on AC systems [24,40,41,42,43] and estimating line parameters [44]. The rest of the paper is organized as follows. Section 2 presents a detailed model of the AC/DC transmission system, which consists of a bipole version of the CIGRE LCC-HVDC benchmark model embedded in the IEEE 12-bus AC system. Section 3, describes the methodology and the equations of the robust SE technique. Section 4 shows the results for different scenarios. Moreover, the discussion and evaluation of the results are presented. Finally, Section 5 concludes the paper.
2. AC/DC System Modeling
2.1. AC System Configuration and Modeling
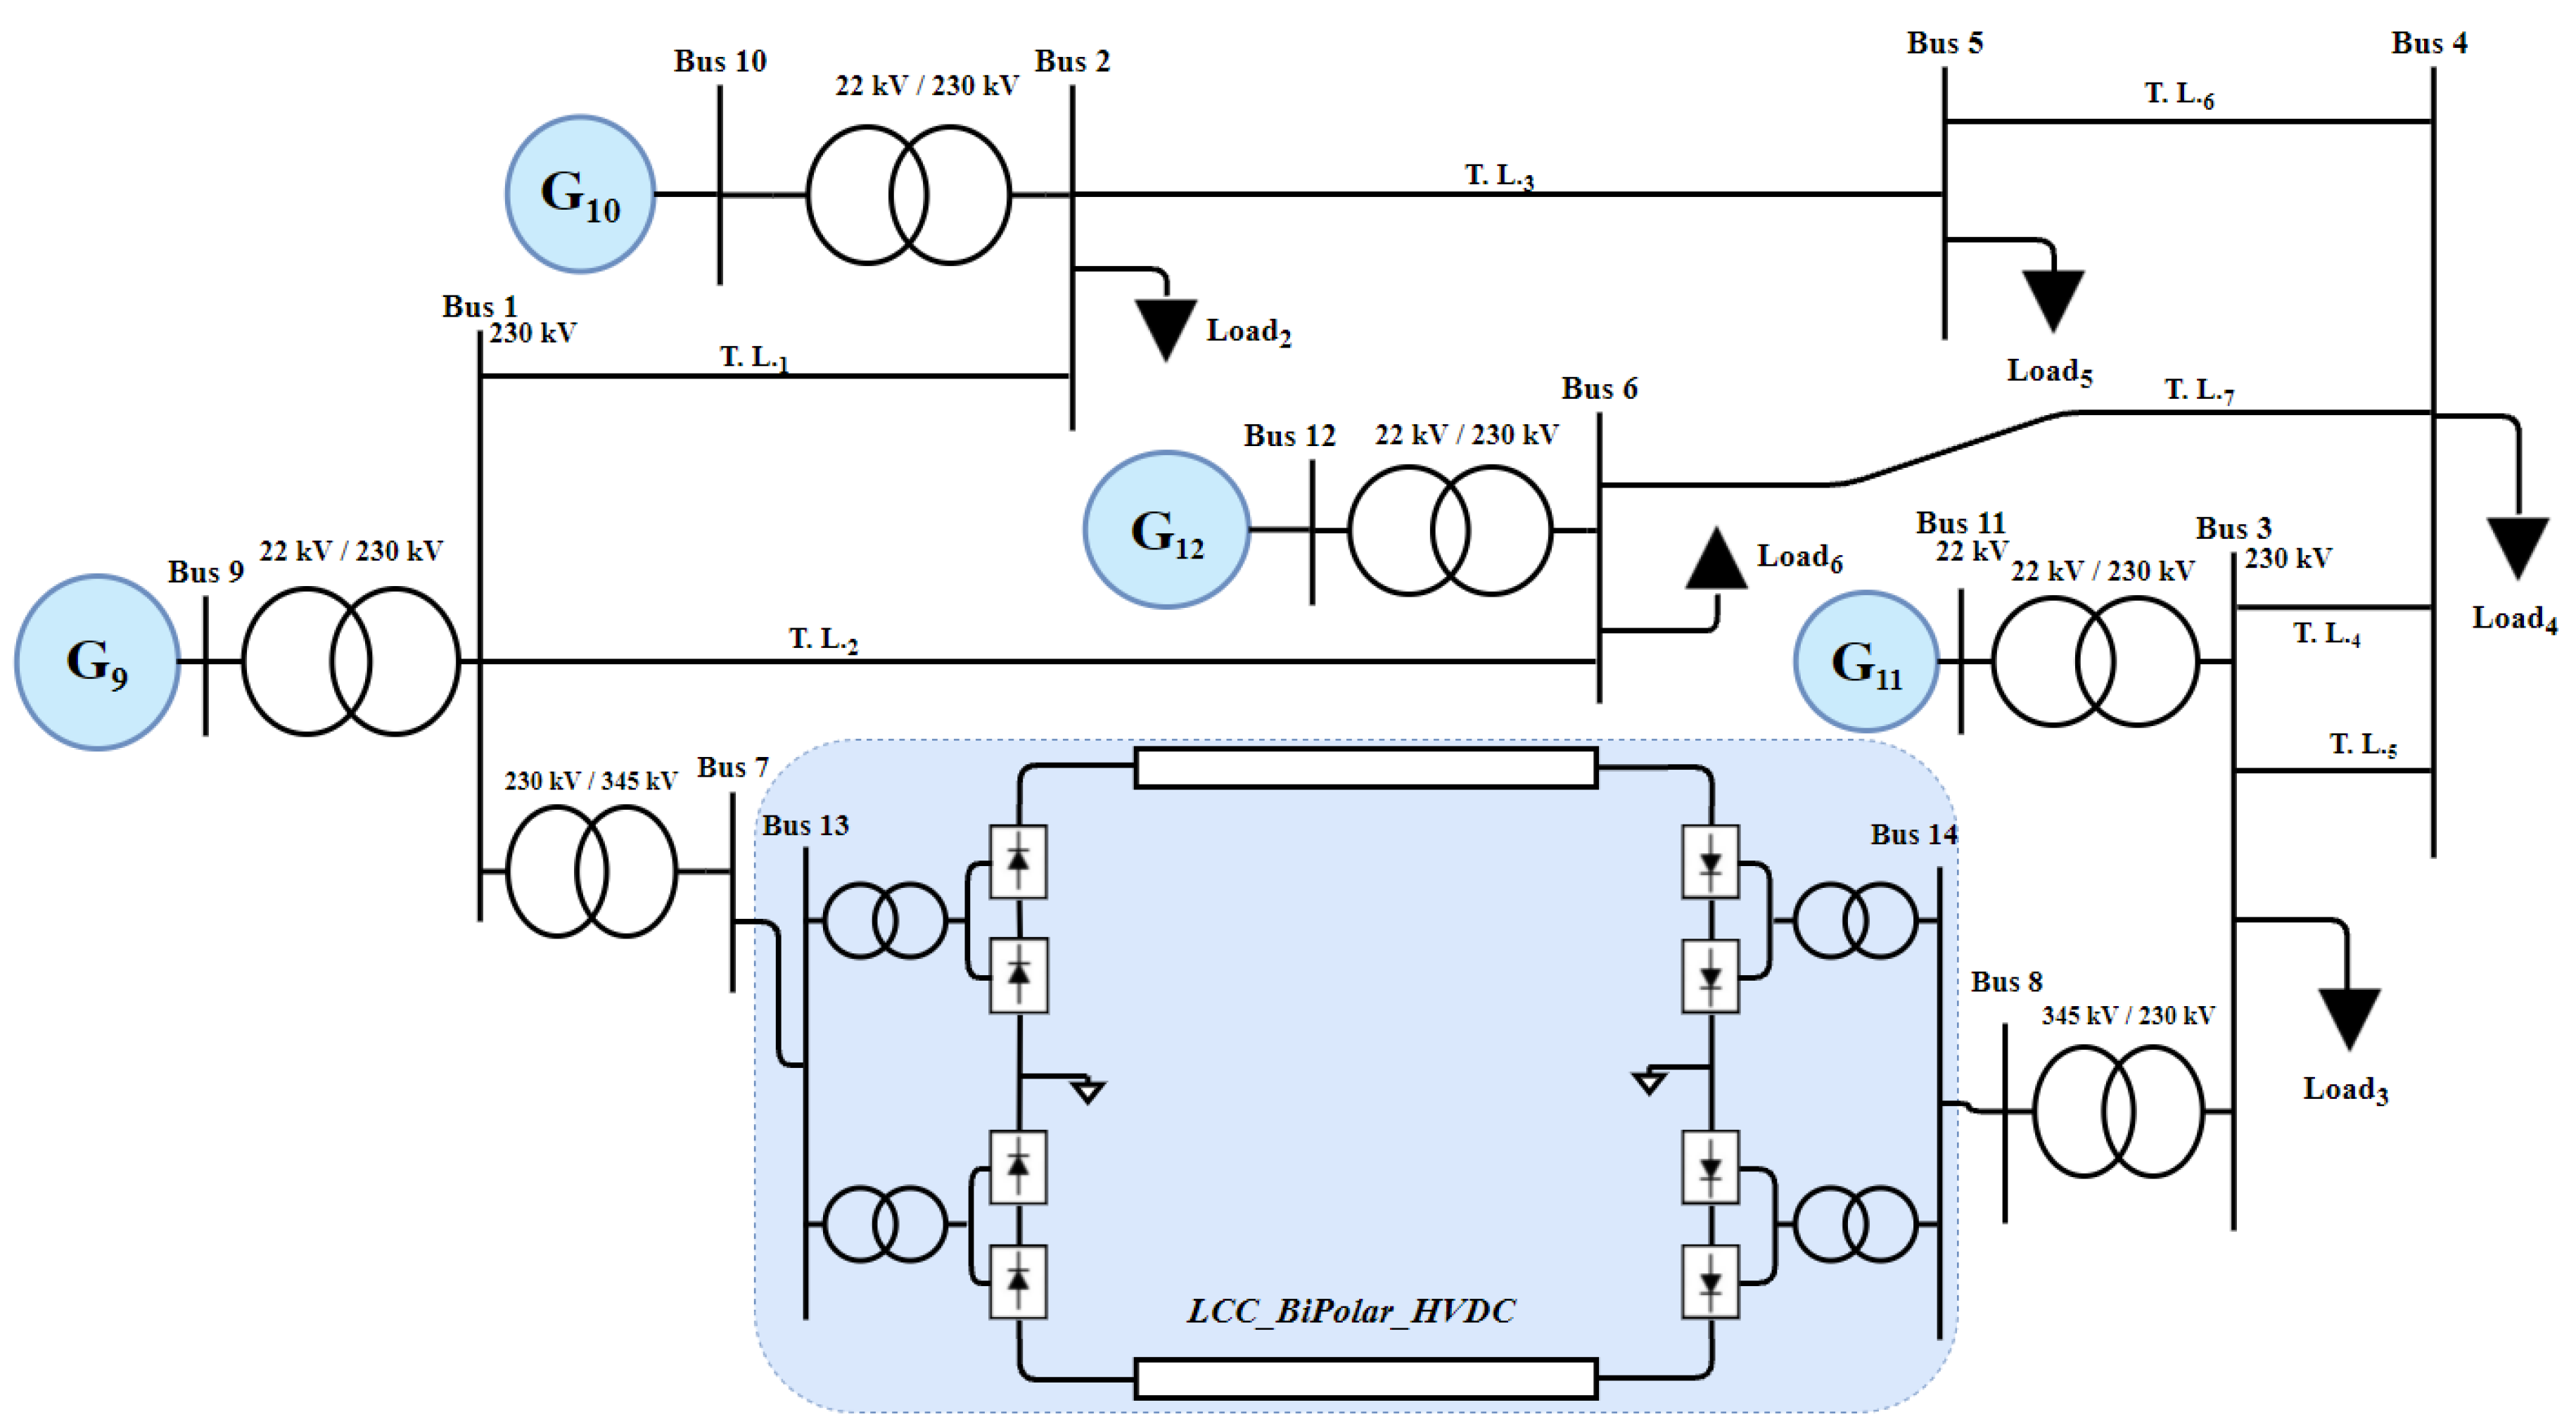
To model AC/DC system [45], the AC network model is comprised of a 12-bus system with multiple voltage levels and four synchronous generators, as depicted in Figure 1. The transmission lines are modeled using coupled models that represent positive and zero sequence behavior. The system model also includes low-frequency transformer models appropriate for frequencies of interest. These components are used to formulate the AC network model, which describes the relation between complex voltages on buses and complex currents flowing through the lines connected to these buses. Figure 2 displays the positive sequence equivalent structure of an AC transmission line. Taking the shunt admittances and the transformers admittances into consideration, the active power and reactive power injections at ith bus can be categorized as follows, where the subscript i denotes the ’from’ bus and j represents the ’to’ bus, is voltage magnitude and is voltage phase angle difference between buses.
where = ( − ), and , and ; () is the series complex admittance from bus i to j respectively and () is the ith shunt admittance in per unit. is a set of indices of all buses connected to bus i. The active and reactive power flow from bus i to j are respectively:
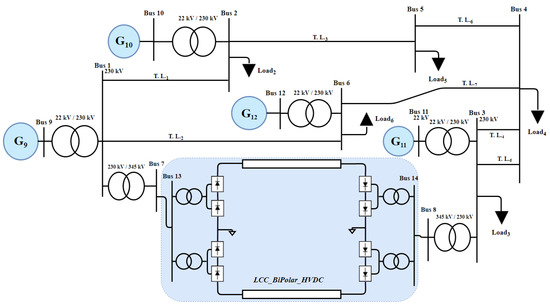
Figure 1.
Schematic diagram of a modified IEEE 12-bus AC/DC test system.
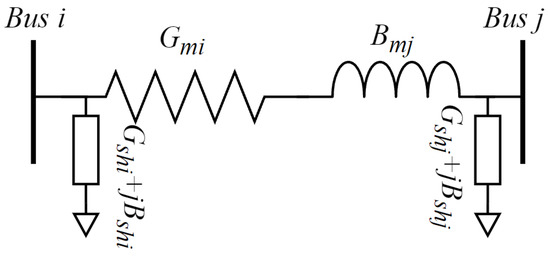
Figure 2.
Positive sequence equivalent circuit for a transmission line.
Considering the shunt admittance ().
2.2. LCC-HVDC Bipole Model
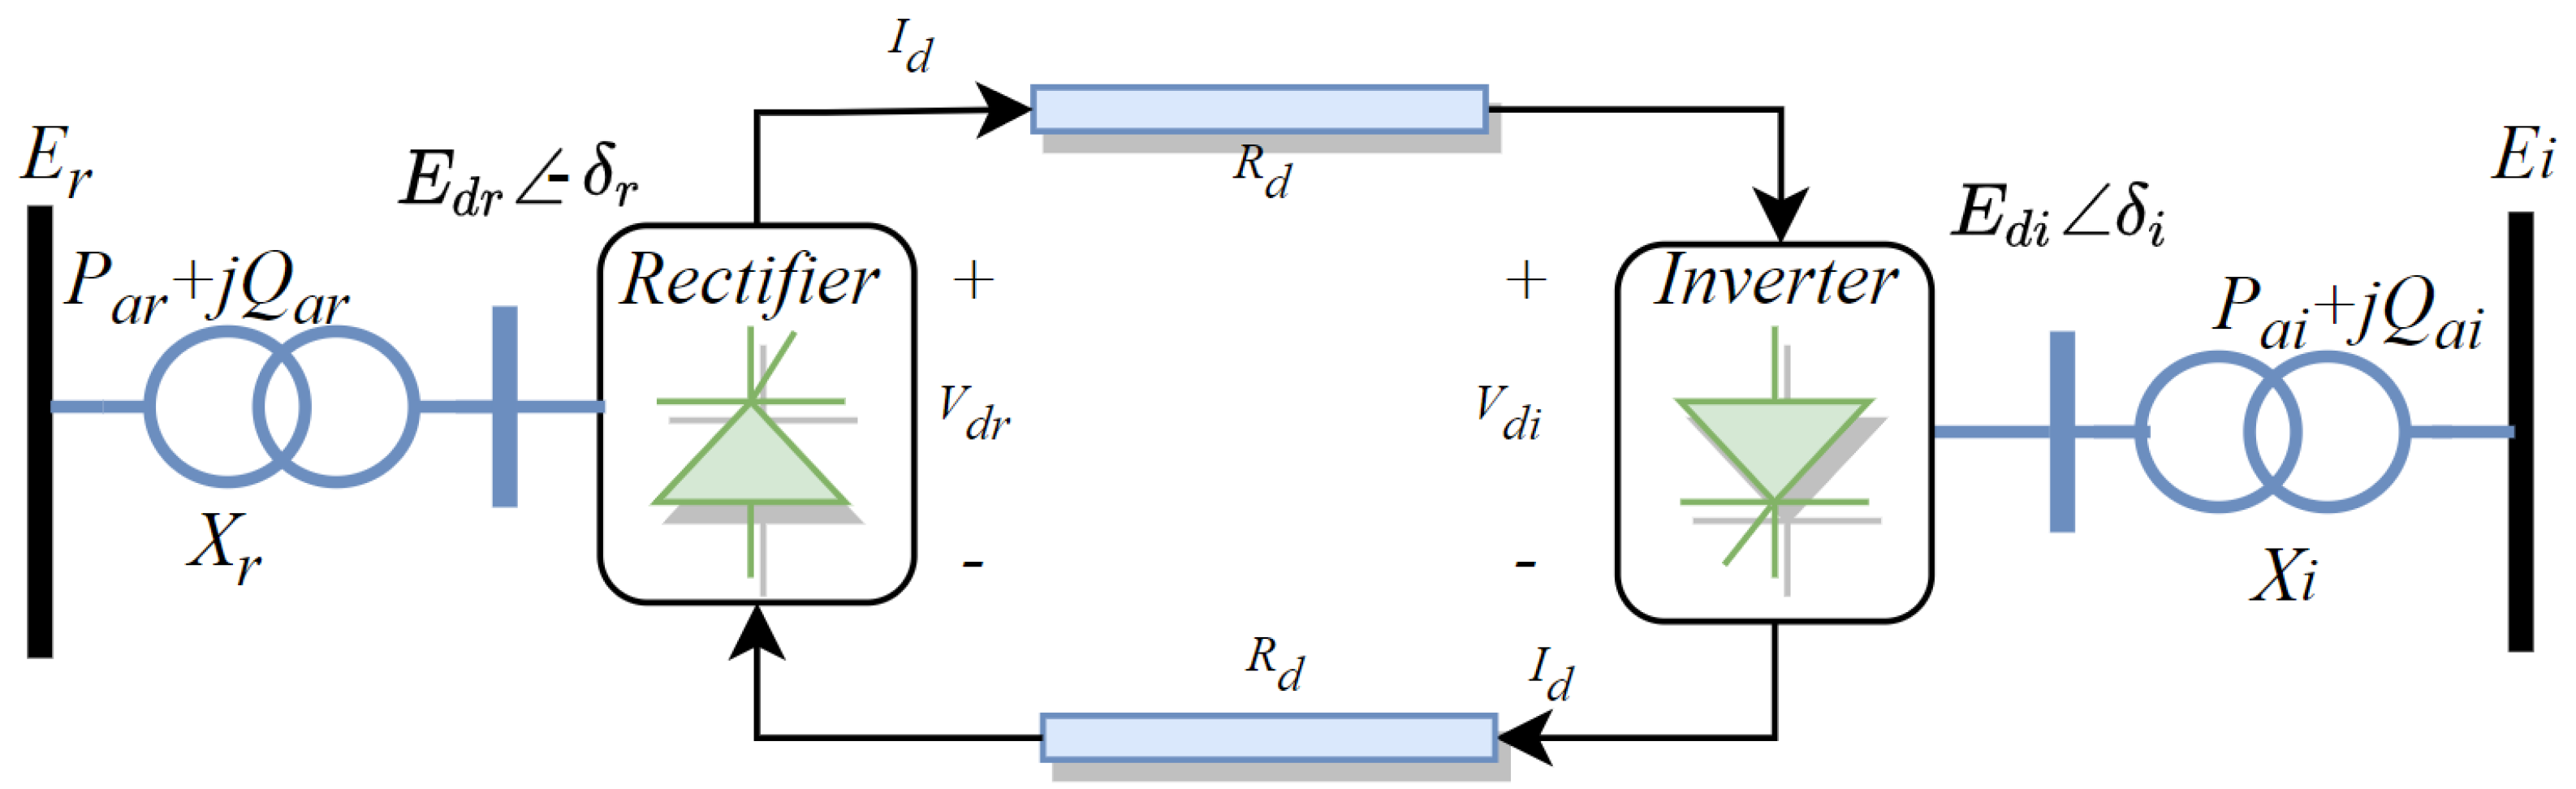
A simplified structure of an LCC-HVDC model is shown in Figure 3. The 12-pulse bipole configuration has four 6-pulse bridges at each end of the line, two connected in series between each of the poles and a grounded center point. The same DC current flows in the positive and negative poles. The majority of HVDC systems connect two asynchronous AC systems [46]. However, there are a growing number of applications to connect two points in the same AC system to transmit remotely located renewable generation to load regions.
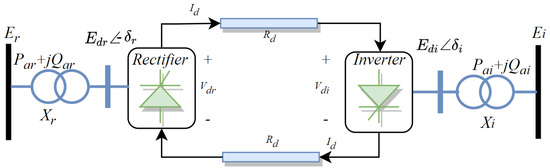
Figure 3.
Schematic diagram of the AC/DC system. It consists of two AC buses and the HVDC link.
Based on a quasi-steady state formulation, the mathematical model of the rectifier and inverter of the LCC-HVDC are expressed as described below. These models are included in the system model for the state estimation. In the formulation, the rectifier and the inverter terminals are indicated by the subscript r and i respectively. The DC voltage on the rectifier and the inverter sides is denoted by , , respectively. Where is the DC current, is the voltage magnitude of the AC buses on the converter side of the transformer, is the equivalent commutation reactance seen by the converter (normally the transformer leakage reactance and is the resistance of the DC transmission line. DC active power can be calculated as shown in Equation (5). Where is defined as shown in Equation (7).
3. Methodology of Robust State Estimation
In [10], the authors proposed a two-stage hybrid SSE to treat outliers on AC state estimation. The first stage consisted of merging SCADA measurements using the robust GM-estimator. The second stage merged the obtained estimates from the GM with available PMUs using a robust M-estimator. This paper implements a similar two stages SSE technique on an AC/DC system. The first stage merges the SCADA measurements using a high breakdown point robust estimator known as the LTS. The breakdown point is the maximum percentage of outliers an estimator can resist while giving reliable estimates [26]. The second stage combines the estimates obtained from the LTS with PMU measurements using a robust Huber M-estimator. The first stage estimates the voltage magnitudes and phase angles at each bus using SCADA measurements. This stage uses the conventional SE formulation, which is based on the nonlinear measurement model. The relationship between m-dimensional measurement vector z and n-dimensional state vector x in any power system can be described as Equation (8):
where IR is the measurement vector, IR is the state vector, is a nonlinear measurement vector function, e represents the error vector in the measurements which is a assumed to be independently, identically distributed Gaussian noise (i.i.d) with a zero mean value and a covariance matrix R. If the noise is Gaussian, the SSE is solved using the WLS in an iterative way, i.e.,
where . The Jacobian matrix of with respect to is . At each iteration, the WLS solves the linear regression to obtain the update :
The vector contains the update residuals at the kth iteration. The WLS is optimal under Gaussian noise but suffers from a degraded performance in the presence of outliers in either the measurements (i.e., ) or the Jacobian matrix called leverage points. To ensure robustness against measurement outliers and leverage points, we propose to use the LTS.
3.1. First Stage: Robust Nonlinear State Estimation Using SCADA Measurements
In this stage, the LTS is used. Unlike the conventional SE, the LTS can handle non-Gaussian noise or outliers in the measurements. The estimator can resist leverage points as well. The goal is to minimize Equation (11) for a given set of observations.
where and the trimming fraction is denoted by and is the floor function. The trimming is the disregarded percentage of data. The residuals are ordered from the smallest to the largest as follows . The asymptotic breakdown point corresponds with the trimming fraction [26] when the regressor matrix satisfies the general position property [39]. The general position is satisfied if any chosen n rows of the regressor or Jacobian matrix are linearly independent. This is not the case for power systems since the Jacobian matrix is sparse and the breakdown theoretical calculation is provided in [39]. We have adapted the LTS algorithm proposed in [47] to the power systems context. Furthermore, to improve the efficiency of the estimator, the LTS residuals are analyzed at each step, non-Gaussian data discarded and the WLS is re-run with the remaining data at each step. The iterative algorithm calculates at each iteration using the proposed LTS-based algorithm. The kth input to the LTS-based estimator is the measurement vector and the Jacobian . The convergence condition of the first stage AC SSE is
If this condition is not satisfied after 20 iterations, the SSE exits the update loop, and the final obtained state is used in stage 2. After convergence, the residuals are normalized by their standard deviations obtained from R, and a three-sigma rejection rule is applied to detect outliers.
3.2. Second Stage: Linear Robust SE Associated Using PMU Measurements
In this stage PMU measurements will be augmented with results from the first stage to enhance the accuracy of SE. PMUs deliver voltage magnitudes and phase angles at certain buses. To simultaneously process both the first stage results and PMU measurement, a robust covariance of the state estimates obtained in the first stage results need to be computed as:
where is the final Jacobian matrix obtained from the first stage with all detected outlying rows removed. The matrix is the measurement covariance matrix after removing the variance elements corresponding to the first stage detected outliers.
The following form illustrates the relationship between PMU measurements and first stage measurements:
where is the augmented measurement vector; is a constant matrix; I is the identity matrix; M is a constant matrix that represents the relationship between the PMU measurements and the state x ; is the vector of error in the measurements and the error covariance matrix where is the PMU noise covariance and S calculated through the Cholesky decomposition. Pre-whitening can be executed by multiplying both sides in Equation (14) by for.
where . In the presence of errors or cyber-attacks targeting both PMUs and SCADA units, a robust estimator is needed for the second stage [48]. However, in the first stage, outliers could be present in both the measurements and the Jacobian matrix. In the second stage, outliers are present only in the measurement vector since the Jacobian is sparse with entries of 1s corresponding to the states measured by PMU or stage-1 estimates. In the second stage, a Huber M-estimator would be enough to provide robustness and is executed. A Huber M estimator minimizes the following function [26,49]:
where the function is given by
where is the standardized residual; s is a robust scale estimate; is the ith residual; c is the threshold for Huber estimator, . The state could be calculated using the Iterative Re-weighted Least-Squares algorithm (IRLS) [26].
Notice that the LTS-based SE can resist outliers that are not critical. The attacks on critical measurements cannot be treated since removing those measurements creates an unobservable system. In this case, increasing measurements’ redundancy or adding pseudo-measurements could be one solution. This goes beyond the scope of this paper.
3.3. Measurement Function and Jacobian Matrix of the HVAC/DC State Estimator
This subsection presents the formulation of the nonlinear measurement function, and the Jacobian matrix, . Table 2 shows the details of the components of the nonlinear measurement function.
Table 2.
Formulation of the measurement function.
In this paper, the Jacobian matrix is given as follow
where is the AC Jacobian matrix which consists of the conventional AC measurement function set. The DC Jacobian matrix is denoted by and consists of the DC measurement function set. Lastly, the equality constraints are insured by the matrix .
4. Simulations Results and Discussion
Three SE algorithms, namely WLS, Huber, and LTS were implemented in MATLAB to estimate the state of the IEEE 12-bus AC/DC system shown in Figure 1. The system base is 100 MVA, frequency is 50 Hz, AC voltage base is 345 kV. The system is modeled in a commercial power flow program (PowerWorld simulator) [50]. As illustrated in Figure 1, the system has five loads varying between 100 MW and 440 MW [51]. The DC link bipole LCC-HVDC system is connected through two DC buses added between the two fictitious buses 13 and 14. The nominal DC voltage and current are 500 kV and 2 kA, respectively [52]. Transformers’ reactances are 0.18 pu, and the nominal angles are for the rectifier firing angle and the inverter extinction angle in the bipolar LCC-HVDC CIGRE Benchmark model.
The three estimators are:
- LTS-based hybrid estimator: in stage 1, LTS gives a robust estimated state and its covariance matrix . These are combined with the available PMUs in the second stage using a Huber M-estimator.
- Huber M-estimator: stage 1, Huber M-estimator is used in the iteration to obtain , at convergence, we obtain a state and its corresponding . The second stage combines these with PMUs using a Huber M-estimator as well.
- WLS: The SE is executed on the SCADA measurements using the WLS. In the second stage, the WLS combines the obtained states with PMU measurements.
The residuals of the three methods have been analyzed with the 3-sigma rejection rule to remove the bad data from H and calculate a robust after executing stage 1. The three hybrid SSE algorithms have been tested and evaluated using three scenarios: (1) occurrence of Gaussian noise in the measurements; (2) false data injection attack in the measurement vector; (3) FDI attacks or random errors impacting the Jacobian matrix.
- SCADA Measurements:Forty-one SCADA measurements were collected from the tested system. The measurement set of the AC/DC system includes the following vectors:
- (a)
- AC system measurements include the voltage magnitude and the angle at the slack bus, real power and reactive power injection at each bus, and one power and reactive power flow in each transmission line.
- (b)
- DC system measurements include the DC current flow, DC power flow; the AC/DC interface is considered lossless.
- PMU Measurements: Five PMUs were deployed on different buses:
- (a)
- AC system measurements include voltage magnitudes and phase angles at buses 1, 2, and 3.
- (b)
- DC system measurements include DC voltage magnitudes at the buses 13 and 14.
All measurements are considered from a single snapshot in this paper. In the field, the latest available PMU and SCADA measurements could be fed to the SE. The time-skew problem should be considered to improve the estimation further [53,54]. Notice that there are different approaches to merge those measurements in time, the state could be tracked at much higher rates if the state is reconstructed [55] or a buffer could be used for lower estimation rates [12]. The maximum iteration for the first stage SSE methods is set to 20. The convergence tolerance threshold for WLS, Huber, and LTS is . In the second stage, the factor c for the Huber and LTS estimators is set to be 1.5. As explained, we are using a three-sigma rejection rule after the convergence in the first stage. If any normalized residuals are larger than 3, their corresponding rows in the matrix H are removed to obtain and calculate using Equation (13).
4.1. Scenario A: Clean Measurements with Gaussian Noise
In this scenario, two cases have been implemented to check the effect of the LTS trimming factor . The SCADA measurements and PMUs measurements are assumed to have a standard deviation of and [10] for the Gaussian noise, respectively.
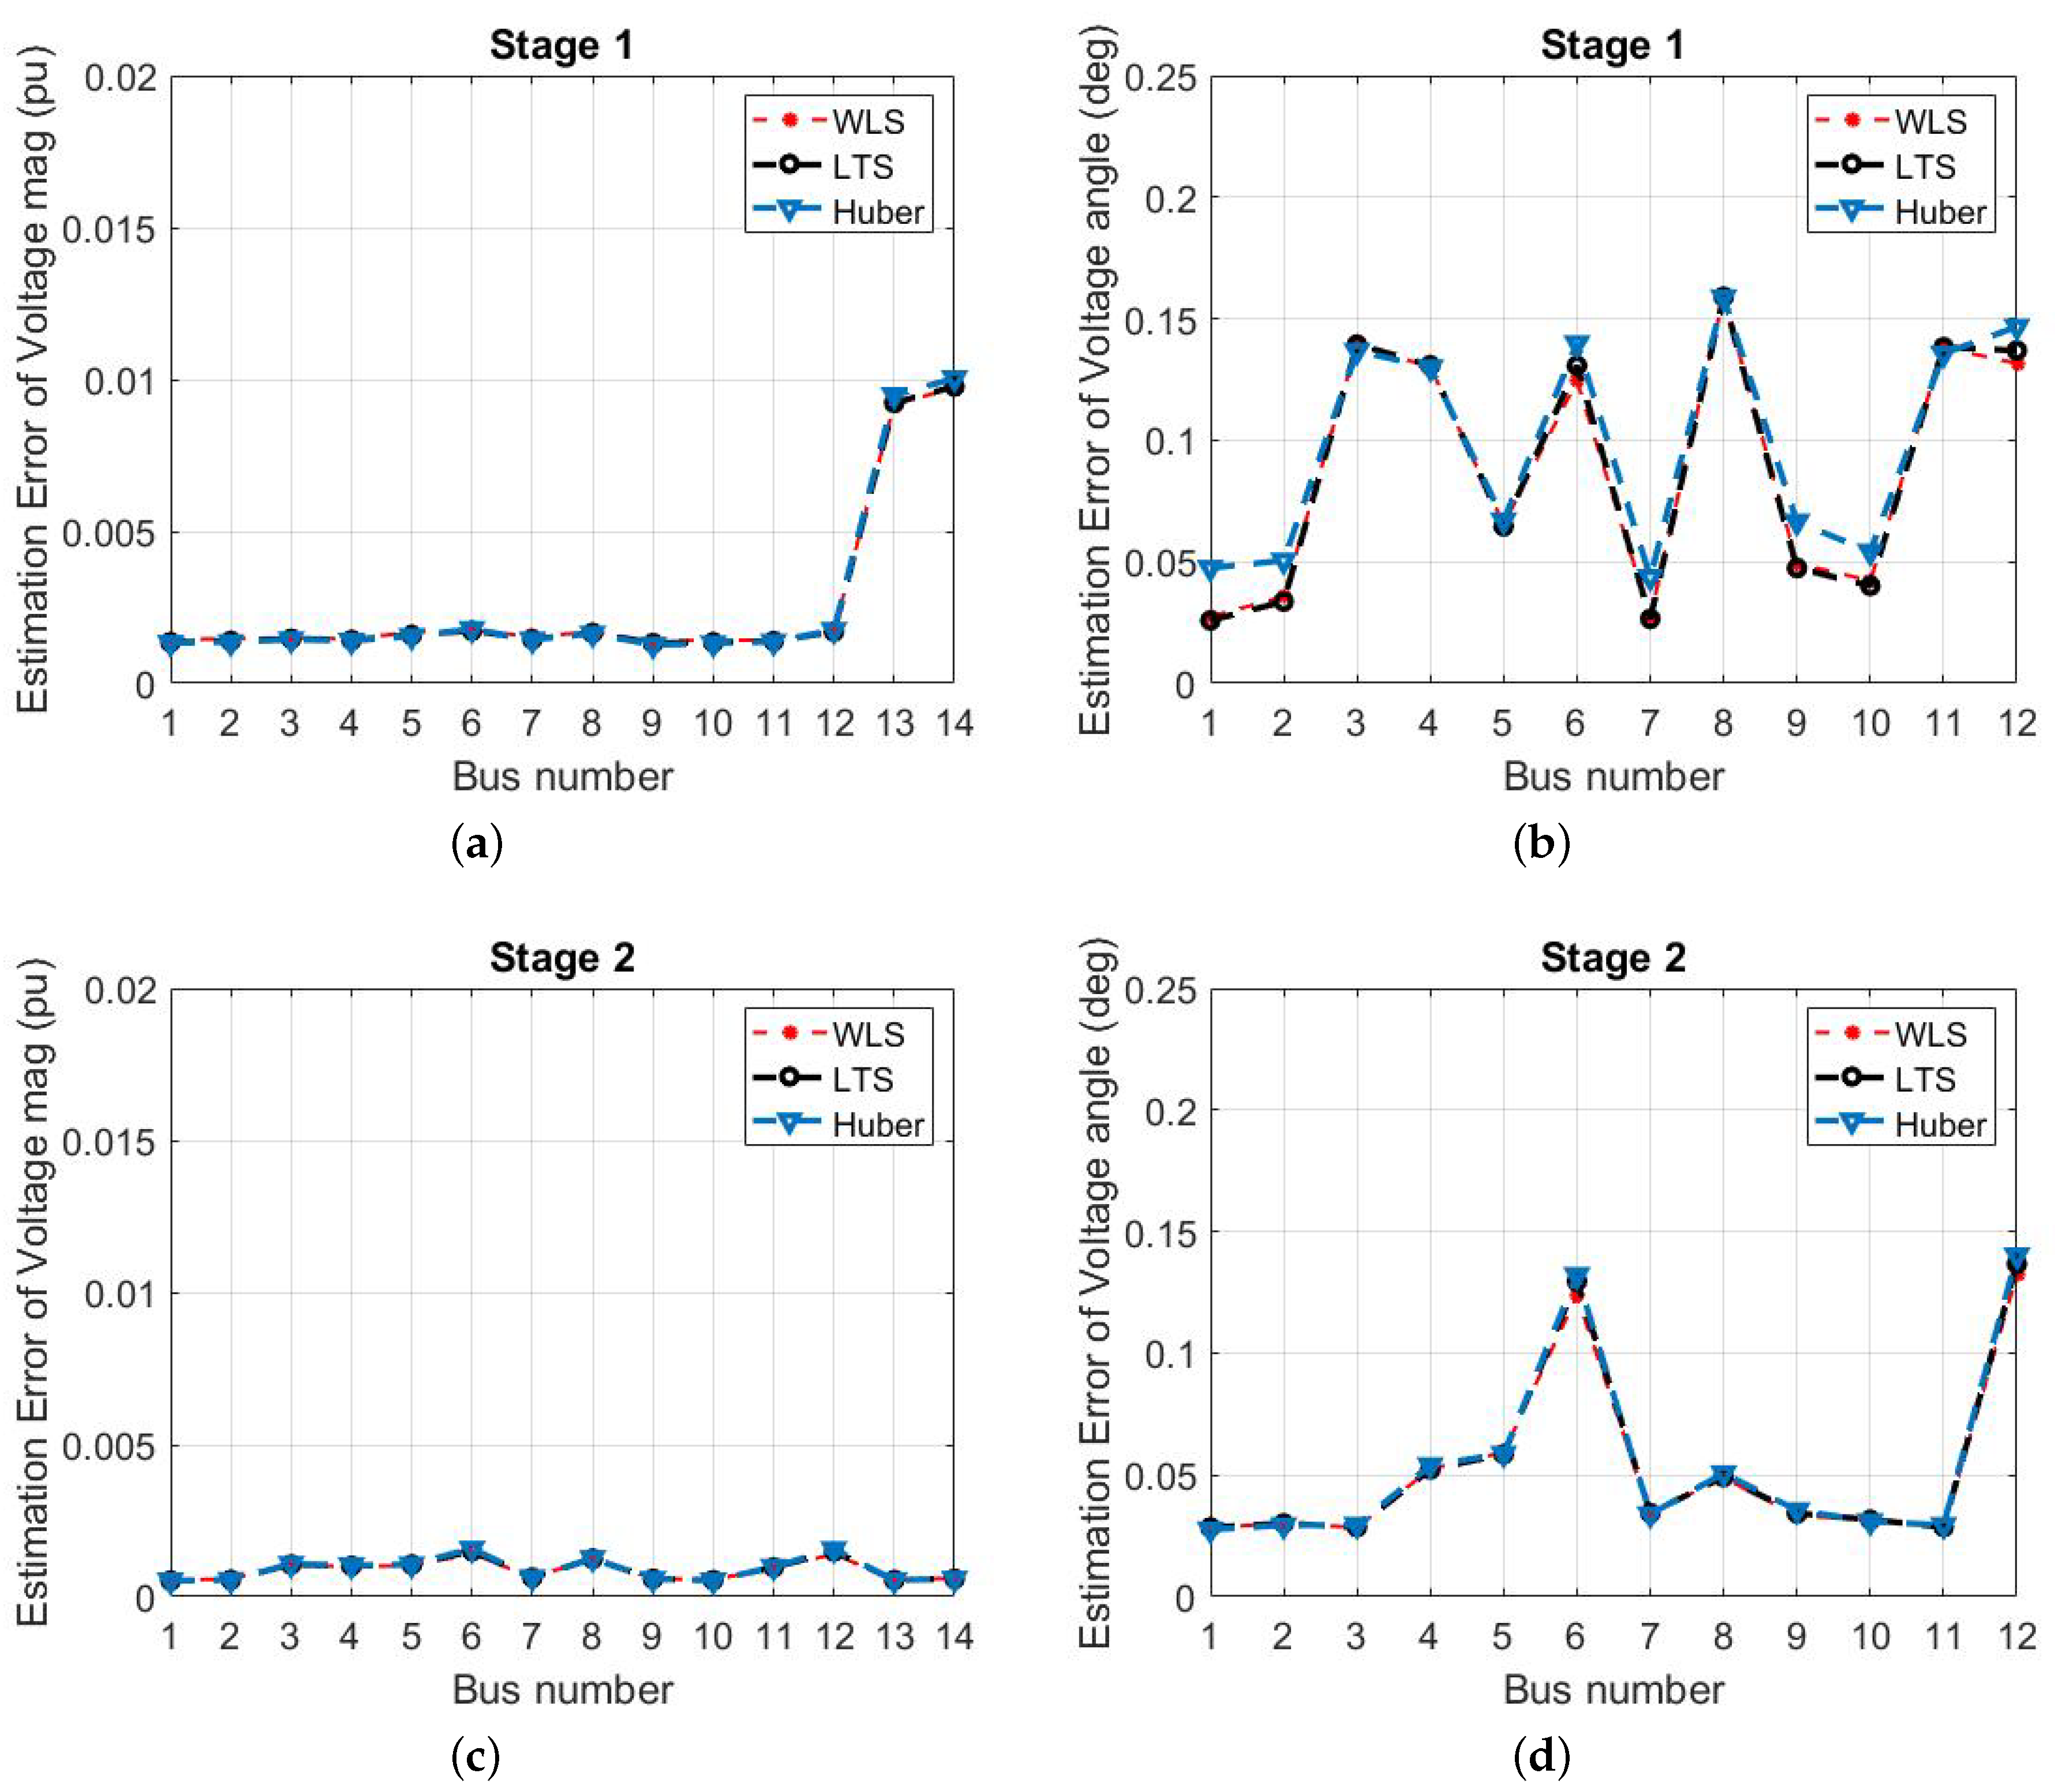
- Case 1: The trimming factor of the LTS is set to , and the tuning factor for the first stage of the Huber estimator is . Figure 4 shows the comparison results of the voltage magnitude and angles of each stage of the two-stage WLS, Huber, and LTS estimators. It can be found that the estimation results obtained by all estimator methods are close to each other. Generally, the state-estimation errors of all estimators are small.
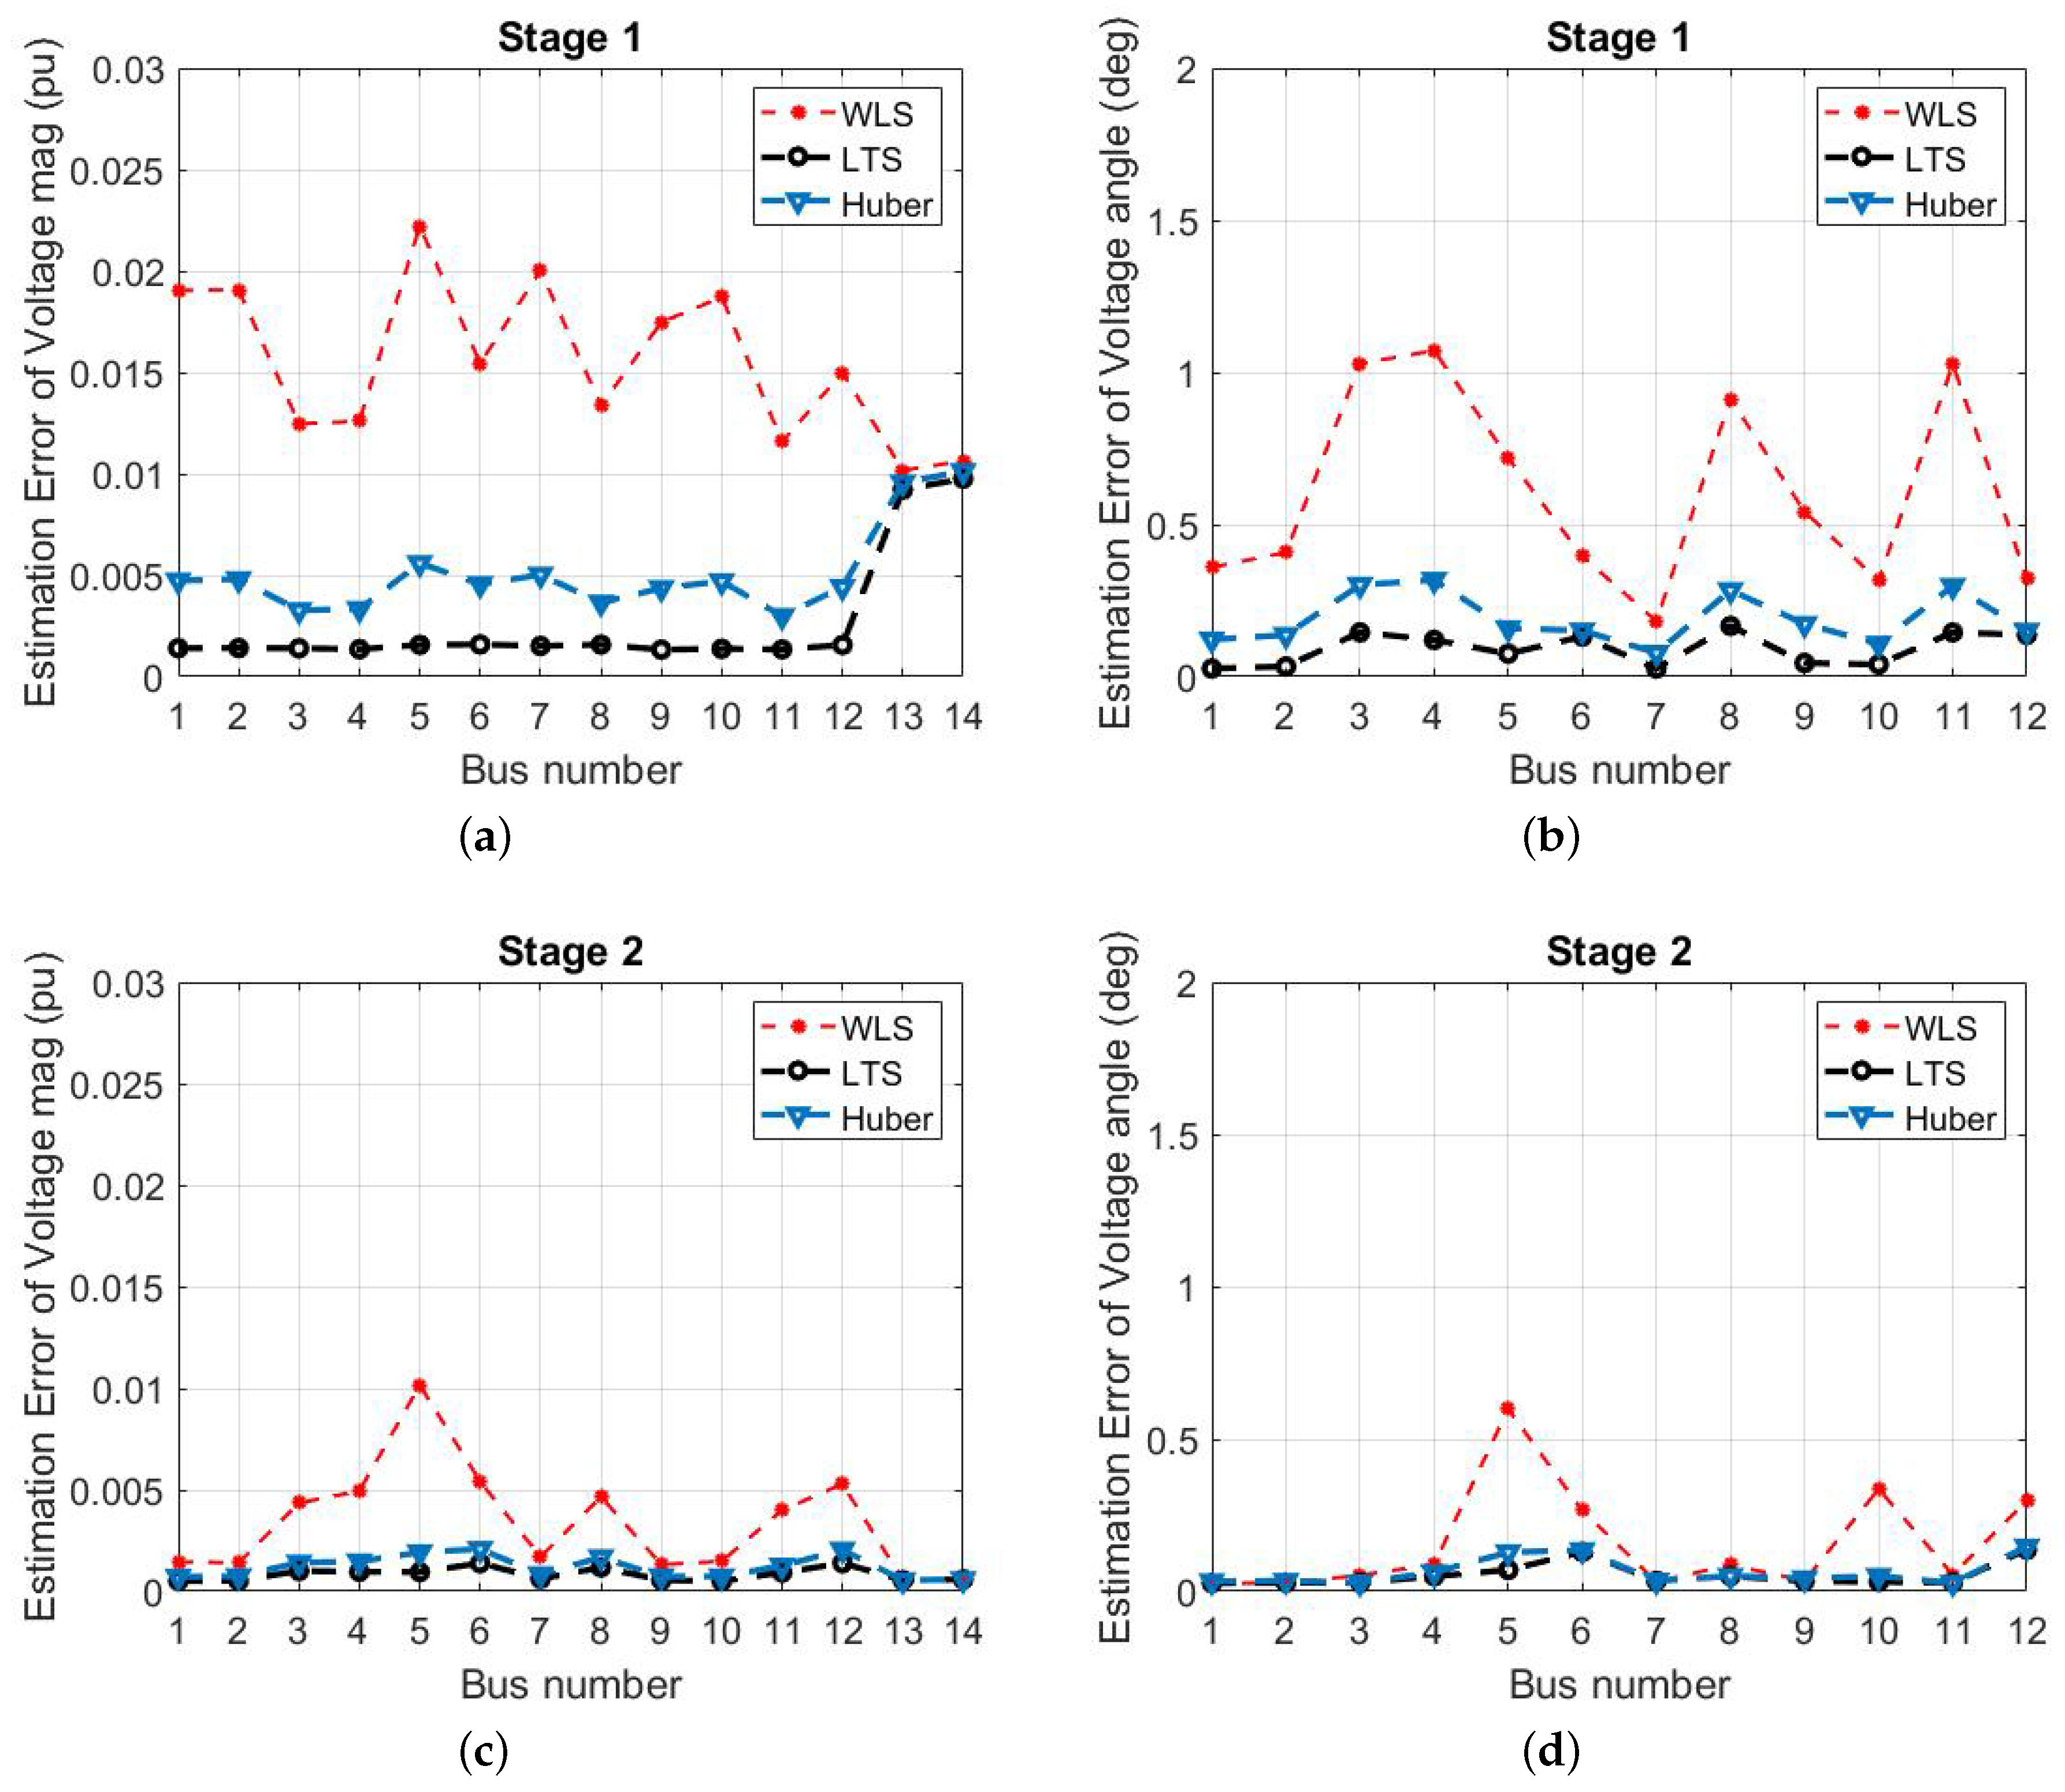
 Figure 4. A hundred Monte Carlo average estimation errors of (a) voltage magnitude, (b) voltage angle, (c) voltage magnitude, and (d) voltage angle with Gaussian measurement noise for stages 1 and 2, respectively. The LTS trimming factor is set to 0.
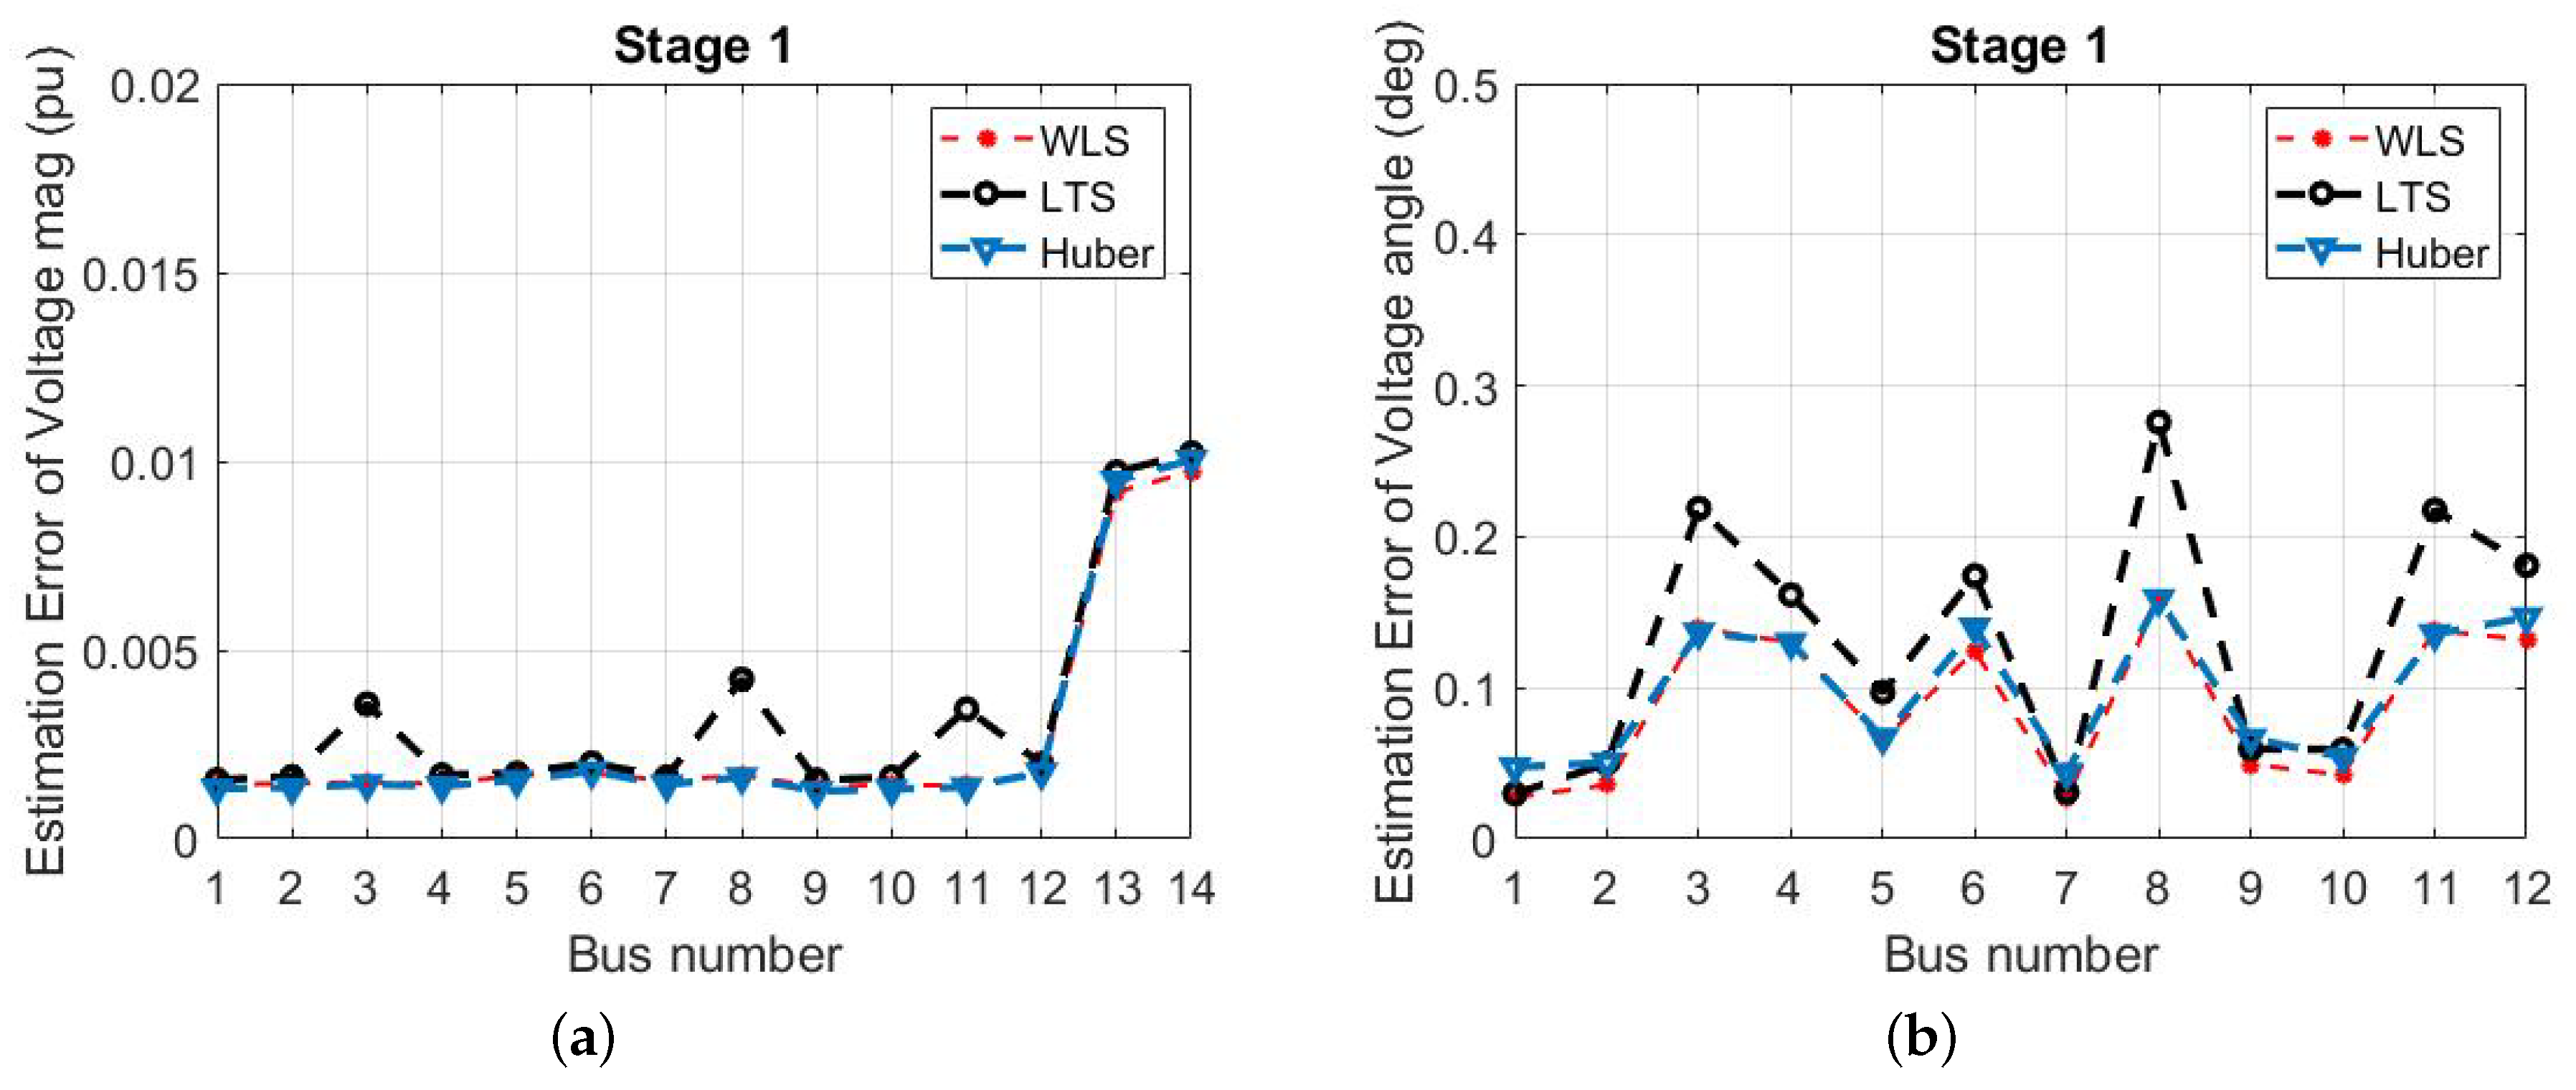
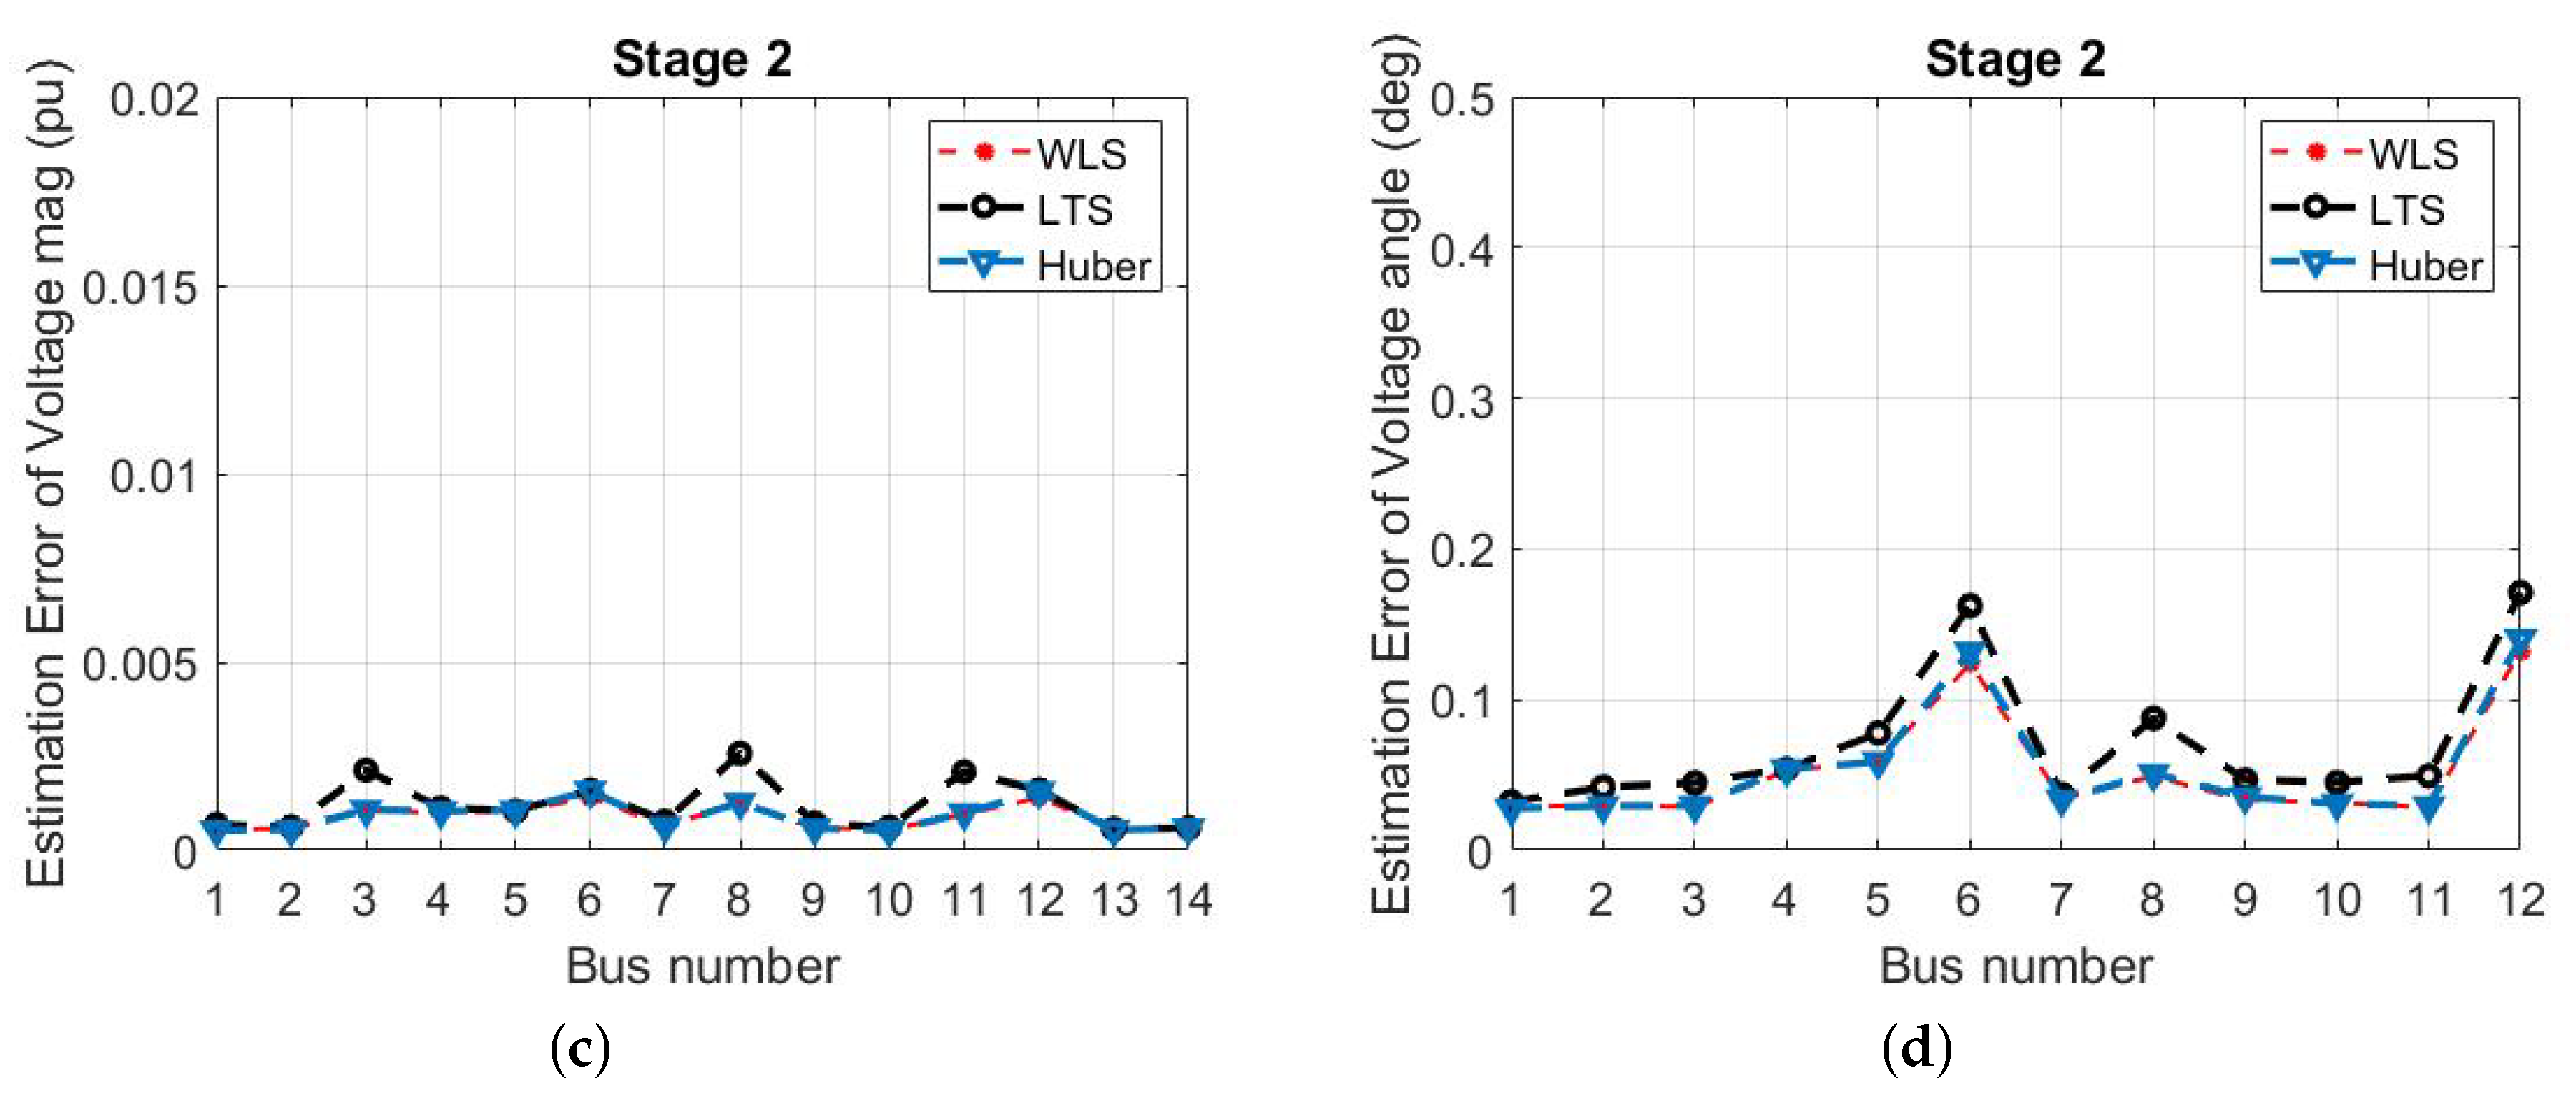
 - Case 2: The trimming factor for the LTS is . Figure 4 shows the comparison results of the voltage magnitude and angles of each stage of the two-stage WLS, Huber, and LTS estimators. As an effect of the LTS robustness, the LTS estimation error increases slightly in both voltage magnitude and angle when the data are Gaussian. It is important to mention that the LTS could have fewer measurements than the WLS and the Huber estimators due to setting the trimming factor to .
Figure 4 and Figure 5 show the difference in the mean absolute voltage magnitude and angle errors in the AC/DC SSE as defined in (19). In stage 1, the voltage magnitude at the DC buses 13 and 14 have slightly higher errors than the other buses. Having few DC SCADA measurements to estimate the DC voltage magnitudes can decrease the accuracy of the estimation. However, after adding PMU measurements, the error has reduced. Moreover, there is no representation for voltage angle error in buses 13 and 14 as those buses are DC buses. The use of has affected the LTS results as two measurements are trimmed. We can see in Figure 5 that the LTS performance has been slightly degraded, i.e., WLS and Huber estimators have better performance for the case where we remove two measurements with the LTS estimator. This is known as the efficiency under clean data, reducing when we increase robustness towards outliers. This is confirmed in the Monte Carlo simulation that has been performed with several replications equal to 100. The average of the mean absolute errors at voltage states and average of the mean absolute errors at phase angle states are considered to assess the performance of each estimator. Table 3a,b summarize the obtained RMSE results in the case of measurements with Gaussian noise. We can notice in Table 3a The LTS with trimming factor equal to 0; all estimators performed well and close to each other. The LTS, in this case, is equivalent to the WLS. The Huber M-estimator is offering a good performance. However, in Table 3b, when the trimming factor for the LTS has increased to 2, we can see the LTS performance has declined slightly.
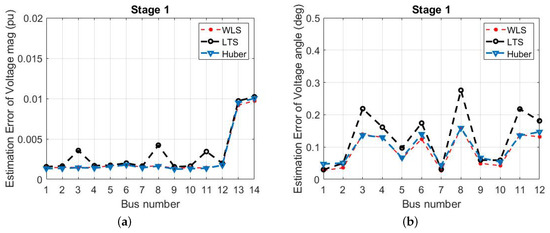
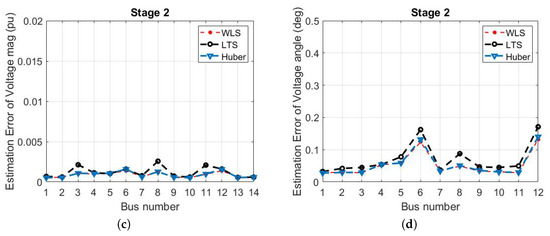
Figure 5.
A hundred Monte Carlo average estimation errors of (a) voltage magnitude, (b) voltage angle, (c) voltage magnitude, and (d) voltage angle with Gaussian measurement noise for stages 1 and 2, respectively. The LTS trimming factor is set to 2.
Table 3.
A hundred Monte Carlo average mean absolute error of the three estimators (a) Trimming factor of the LTS (b) Trimming factor of the LTS .
The mean absolute error (MAE) of the jth state is used as a metric to evaluate performance and is calculated as follows:
where is the number of Monte Carlo runs, which is selected to be 100, and are the jth true state variable obtained from the power flow analysis and its state estimate at the ith run. Please note that the voltage angles are in degree, and the voltage magnitudes are in p.u. The average mean absolute error is defined as , where is the number of estimated states.
4.2. Scenario B: Impact of FDI Attack on the Measurement Vector
The SCADA and PMU measurements are assumed to contain additive Gaussian noise with variance and , respectively. An increase of is added in the real power injection of buses 5 and 10. The trimmed factor for LTS was set to .
Figure 6 shows the simulation results of the estimators under FDI attacks on the measurement vector. The Huber M-estimator has better performance than the WLS while the LTS estimator has the best performance. Table 4 summarizes the average number of bad data detected and the probability of detecting the true bad data measurement for each estimator with 100 Monte Carlo iterations. WLS and Huber M-estimator have a higher probability of detecting non-attacked clean measurements as bad measurements. This has degraded the accuracy of both estimators even if both estimators detect FDI attacks as well. The LTS estimator has a probability of detection of 1 of detecting FDI cyber-attacks. No clean measurements were identified as outliers which improves the performance of the estimation.
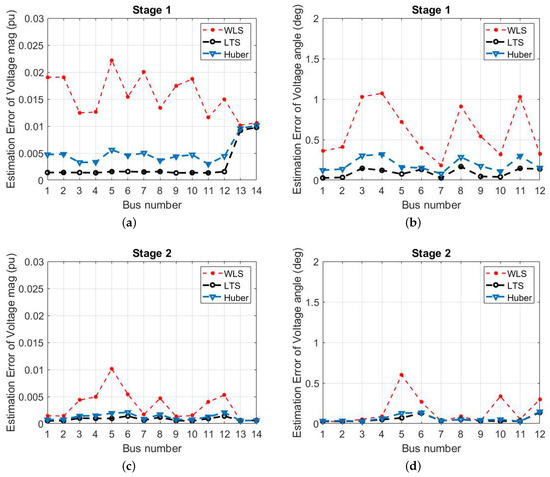
Figure 6.
A hundred Monte Carlo average estimation errors of (a) stage 1 voltage magnitude, (b) stage 1 voltage angle, (c) stage 2 voltage magnitude, and (d) stage 2 voltage angle in the presence of FDI attacks on the measurement vector.
Table 4.
A hundred Monte Carlo replications average number of bad data detected and probability of detecting the true bad data caused by attacks on the measurements (scenario B).
4.3. Scenario C: Attack on the Jacobian Matrix
FDI attacks were introduced in the 7th and 4th rows of H, which correspond to the real power injection of Bus 5 and 2.
Figure 7 shows the LTS-based proposed algorithm results in both stages for an attack on the Jacobian matrix. The WLS and Huber M-estimator results were not depicted due to their divergence. The RMSE values in Table 5 show that the WLS and Huber M-estimator have diverged. This is a big advantage of the LTS-based algorithm since it ensures robustness against leverage points which is not the case with the WLS and the Huber M-estimator.
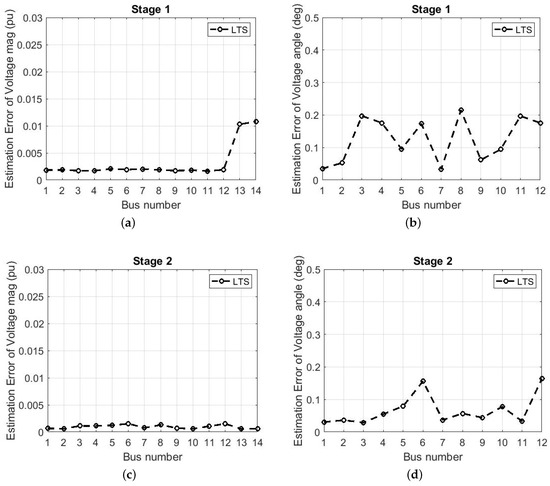
Figure 7.
A hundred Monte Carlo average estimation errors of (a) stage 1 voltage magnitude, (b) stage 1 voltage angle, (c) stage 2 voltage magnitude, and (d) stage 2 voltage angle with an attack on the Jacobian matrix.
Table 5.
A hundred Monte Carlo average mean absolute error of the three WLS, Huber M- and LTS estimator with trimming factor of 2 for (a) Scenario 2: FDI attack on the measurement vector (b) Scenario 3: Jacobian matrix attack.
5. Conclusions
The HVAC/DC inter-tie systems are adequate to enhance the grid stability and resiliency. Reliable state estimation is essential to ensure optimal situational awareness and controls of such systems. This paper proposes a hybrid robust LTS-based state estimator that can deliver reliable estimates in the presence of false data injection attacks targeting PMU or SCADA measurements. The proposed estimator also resists topology attacks that corrupt the SE Jacobian matrix and create leverage points. Simulations considering the CIGRE LCC-HVDC benchmark system with the IEEE 12-bus dynamic system show the superior robustness of the proposed estimator to two existing hybrid SSEs, i.e., WLS and Huber M-estimators with bad data detection modules. More specifically, while the LTS-based estimator gave similar estimation bias when measurements were corrupted, it was the only estimator capable of converging and providing good results when the Jacobian contained errors. The proposed estimator gives accurate estimates under clean non-attacked measurements and topology, which confirms its efficiency since its performance is comparable to the WLS.
Author Contributions
Conceptualization, A.A.A., A.A.S. and Y.C.; methodology, A.A.A. and A.A.S.; software, A.A.A., A.A.S. and Y.C.; validation, A.A.A., A.A.S., Y.C., B.K.J. and H.L.; formal analysis, A.A.A. and A.A.S.; investigation, A.A.A. and A.A.S.; resources, A.A.A., A.A.S., Y.C. and B.K.J.; data curation, A.A.A., A.A.S. and Y.C.; writing—original draft preparation, A.A.A. and A.A.S.; writing—review and editing, A.A.A., A.A.S., Y.C., B.K.J. and H.L.; visualization, A.A.S.; supervision, Y.C. and B.K.J.; project administration, Y.C. and B.K.J.; funding acquisition, Y.C., H.L. and B.K.J. All authors have read and agreed to the published version of the manuscript.
Funding
This work was supported in part by the Department of Electrical and Computer Engineering at the University of Idaho.
Institutional Review Board Statement
Not applicable.
Informed Consent Statement
Not applicable.
Data Availability Statement
Not applicable.
Conflicts of Interest
The authors declare no conflict of interest.
References
- Page, C.L.; Johnson, B.K.; Roberson, D.; Nuqui, R. Increasing Grid Resilience Via Cyber-Secure Series Multiterminal LCC HVDC Transmission Systems. In Proceedings of the 2020 52nd North American Power Symposium (NAPS), Tempe, AZ, USA, 11–14 April 2021; pp. 1–6. [Google Scholar]
- Roberson, D.; Kim, H.C.; Chen, B.; Page, C.; Nuqui, R.; Valdes, A.; Macwan, R.; Johnson, B.K. Improving Grid Resilience Using High-Voltage dc: Strengthening the Security of Power System Stability. IEEE Power Energy Mag. 2019, 17, 38–47. [Google Scholar] [CrossRef]
- Kahnamouei, A.S.; Bolandi, T.G.; Haghifam, M. The conceptual framework of resilience and its measurement approaches in electrical power systems. In Proceedings of the IET International Conference on Resilience of Transmission and Distribution Networks (RTDN 2017), Birmingham, UK, 26–28 September 2017; pp. 1–11. [Google Scholar]
- Callaviik, M. Grid Resilience by Power Electronics: Use Subtransmission HVDC Interties for Novel Emergency Power Control of Split Networks [Expert View]. IEEE Power Electron. Mag. 2018, 5, 54–56. [Google Scholar] [CrossRef]
- Kumar, S.; Abu-Siada, A.; Das, N.; Islam, S. Toward a Substation Automation System Based on IEC 61850. Electronics 2021, 10, 310. [Google Scholar] [CrossRef]
- Cai, N.; Wang, J.; Yu, X. SCADA System Security: Complexity, History and New Developments. In Proceedings of the 2008 6th IEEE International Conference on Industrial Informatics, Daejeon, Korea, 13–16 July 2008; pp. 569–574. [Google Scholar]
- Bretas, A.S.; Bretas, N.G.; London, J.B.A.; Carvalho, B.E.B. Cyber-Physical Power Systems State Estimation; Elsevier: Amsterdam, The Netherlands, 2021. [Google Scholar]
- Abur, A.; Exposito, A.G. Power System State Estimation: Theory and Implementation; CRC Press: Boca Raton, FL, USA, 2004. [Google Scholar]
- IEEE Standard for Synchrophasor Measurements for Power Systems; IEEE Std C37.118.1-2011 (Revision of IEEE Std C37.118-2005); IEEE: Piscataway, NJ, USA, 2011; pp. 1–61.
- Zhao, J.; Zhang, G.; La Scala, M. A two-stage robust power system state estimation method with unknown measurement noise. In Proceedings of the 2016 IEEE Power and Energy Society General Meeting (PESGM), Boston, MA, USA, 17–21 July 2016; pp. 1–5. [Google Scholar] [CrossRef]
- Chakhchoukh, Y.; Vittal, V.; Heydt, G.T. PMU Based State Estimation by Integrating Correlation. IEEE Trans. Power Syst. 2014, 29, 617–626. [Google Scholar] [CrossRef]
- Zhang, Q.; Chakhchoukh, Y.; Vittal, V.; Heydt, G.T.; Logic, N.; Sturgill, S. Impact of PMU Measurement Buffer Length on State Estimation and its Optimization. IEEE Trans. Power Syst. 2013, 28, 1657–1665. [Google Scholar] [CrossRef]
- Xu, C.; Abur, A. A Fast and Robust Linear State Estimator for Very Large Scale Interconnected Power Grids. IEEE Trans. Smart Grid 2018, 9, 4975–4982. [Google Scholar] [CrossRef]
- Zhao, J.; Netto, M.; Huang, Z.; Yu, S.S.; Gómez-Expósito, A.; Wang, S.; Kamwa, I.; Akhlaghi, S.; Mili, L.; Terzija, V.; et al. Roles of Dynamic State Estimation in Power System Modeling, Monitoring and Operation. IEEE Trans. Power Syst. 2021, 36, 2462–2472. [Google Scholar] [CrossRef]
- Singh, A.K.; Pal, B.C. Dynamic Estimation and Control of Power Systems; Academic Press: London, UK, 2019; p. 234. [Google Scholar]
- Griffor, E.R.; Greer, C.; Wollman, D.A.; Burns, M.J. Framework for Cyber-Physical Systems: Overview; National Institute of Standards and Technology: Gaithersburg, MD, USA, 2017; Volume 1. [Google Scholar]
- Smadi, A.A.; Ajao, B.T.; Johnson, B.K.; Lei, H.; Chakhchoukh, Y.; Al-Haija, Q.A. A Comprehensive Survey on Cyber-Physical Smart Grid Testbed Architectures: Requirements and Challenges. Electronics 2021, 10, 1043. [Google Scholar] [CrossRef]
- Liu, Y.; Ning, P.; Reiter, M.K. False data injection attacks against state estimation in electric power grids. ACM Trans. Inf. Syst. Secur. 2011, 14, 1–33. [Google Scholar] [CrossRef]
- Chakhchoukh, Y.; Ishii, H. Cyber security for power system state estimation. In Smart Grid Control; Springer: Berlin/Heidelberg, Germany, 2019; pp. 241–256. [Google Scholar]
- Zoubir, A.M.; Koivunen, V.; Chakhchoukh, Y.; Muma, M. Robust Estimation in Signal Processing: A Tutorial-Style Treatment of Fundamental Concepts. IEEE Signal Process. Mag. 2012, 29, 61–80. [Google Scholar] [CrossRef]
- Zhao, J.; Mili, L.; Abdelhadi, A. Robust dynamic state estimator to outliers and cyber attacks. In Proceedings of the 2017 IEEE Power & Energy Society General Meeting, Chicago, IL, USA, 16–20 July 2017; pp. 1–5. [Google Scholar]
- Chakhchoukh, Y.; Lei, H.; Johnson, B.K. Diagnosis of outliers and cyber attacks in dynamic PMU-based power state estimation. IEEE Trans. Power Syst. 2019, 35, 1188–1197. [Google Scholar] [CrossRef]
- Taha, A.F.; Qi, J.; Wang, J.; Panchal, J.H. Risk mitigation for dynamic state estimation against cyber attacks and unknown inputs. IEEE Trans. Smart Grid 2016, 9, 886–899. [Google Scholar] [CrossRef]
- Ahmadi, N.; Chakhchoukh, Y.; Ishii, H. Power Systems Decomposition for Robustifying State Estimation Under Cyber Attacks. IEEE Trans. Power Syst. 2021, 36, 1922–1933. [Google Scholar] [CrossRef]
- Zhao, J.; Mili, L. A framework for robust hybrid state estimation with unknown measurement noise statistics. IEEE Trans. Ind. Inform. 2017, 14, 1866–1875. [Google Scholar] [CrossRef]
- Maronna, R.A.; Martin, R.D.; Yohai, V.J. Robust Statistics: Theory and Methods; Wiley Series in Probability and Statistics; John Wiley & Sons Ltd.: Chichester, UK, 2006. [Google Scholar]
- Roy, G.K.; Pau, M.; Ponci, F.; Monti, A. A Two-Step State Estimation Algorithm for Hybrid AC-DC Distribution Grids. Energies 2021, 14, 1967. [Google Scholar] [CrossRef]
- Pau, M.; Sadu, A.; Pillai, S.; Ponci, F.; Monti, A. A state estimation algorithm for hybrid AC/DC networks with multi-terminal DC grid. In Proceedings of the 2016 IEEE PES Innovative Smart Grid Technologies Conference Europe (ISGT-Europe), Ljubljana, Slovenia, 9–12 October 2016; pp. 1–6. [Google Scholar] [CrossRef] [Green Version]
- Kong, X.; Yan, Z.; Guo, R.; Xu, X.; Fang, C. Three-Stage Distributed State Estimation for AC-DC Hybrid Distribution Network Under Mixed Measurement Environment. IEEE Access 2018, 6, 39027–39036. [Google Scholar] [CrossRef]
- Li, W.; Vanfretti, L. Inclusion of classic HVDC links in a PMU-based state estimator. In Proceedings of the 2014 IEEE PES General Meeting|Conference Exposition, National Harbor, MD, USA, 27–31 July 2014; pp. 1–5. [Google Scholar] [CrossRef] [Green Version]
- De la Villa Jaen, A.; Acha, E.; Exposito, A.G. Voltage Source Converter Modeling for Power System State Estimation: STATCOM and VSC-HVDC. IEEE Trans. Power Syst. 2008, 23, 1552–1559. [Google Scholar] [CrossRef]
- Ayiad, M.; Leite, H.; Martins, H. State Estimation for Hybrid VSC Based HVDC/AC Transmission Networks. Energies 2020, 13, 4932. [Google Scholar] [CrossRef]
- Ding, Q.; Chung, T.; Zhang, B. An improved sequential method for AC/MTDC power system state estimation. IEEE Trans. Power Syst. 2001, 16, 506–512. [Google Scholar] [CrossRef]
- Li, W.; Vanfretti, L. A PMU-based state estimator for networks containing VSC-HVDC links. In Proceedings of the 2015 IEEE Power & Energy Society General Meeting, Denver, CO, USA, 26–30 July 2015; pp. 1–5. [Google Scholar]
- Vanfretti, L.; Chow, J.H.; Sarawgi, S.; Fardanesh, B. A phasor-data-based state estimator incorporating phase bias correction. IEEE Trans. Power Syst. 2010, 26, 111–119. [Google Scholar] [CrossRef] [Green Version]
- Mouco, A.; Abur, A. A robust state estimator for power systems with HVDC components. In Proceedings of the 2017 North American Power Symposium (NAPS), Morgantown, WV, USA, 17–19 September 2017; pp. 1–5. [Google Scholar]
- Mouco, A.; Abur, A. Robust L 1 Estimators for Interconnected AC/DC Power Systems. In Proceedings of the 2019 IEEE Milan PowerTech, Milan, Italy, 23–27 June 2019; pp. 1–6. [Google Scholar]
- Ayiad, M.M.; Leite, H.; Martins, H. State Estimation for Hybrid VSC Based HVDC/AC: Unified Bad Data Detection Integrated With Gaussian Mixture Model. IEEE Access 2021, 9, 91730–91740. [Google Scholar] [CrossRef]
- Mili, L.; Coakley, C.W. Robust estimation in structured linear regression. Ann. Statist. 1996, 24, 2593–2607. [Google Scholar] [CrossRef]
- Mili, L.; Cheniae, M.; Rousseeuw, P. Robust state estimation of electric power systems. IEEE Trans. Circuits Syst. I Fundam. Theory Appl. 1994, 41, 349–358. [Google Scholar] [CrossRef]
- Chakhchoukh, Y.; Ishii, H. Coordinated cyber-attacks on the measurement function in hybrid state estimation. IEEE Trans. Power Syst. 2014, 30, 2487–2497. [Google Scholar] [CrossRef]
- Chakhchoukh, Y.; Vittal, V.; Heydt, G.T.; Ishii, H. LTS-based robust hybrid SE integrating correlation. IEEE Trans. Power Syst. 2016, 32, 3127–3135. [Google Scholar] [CrossRef]
- Weng, Y.; Negi, R.; Liu, Q.; Ilic, M.D. Robust state-estimation procedure using a Least Trimmed Squares pre-processor. In Proceedings of the IEEE PES Innovative Smart Grid Technologies (ISGT), Anaheim, CA, USA, 17–19 January 2011; pp. 1–6. [Google Scholar]
- Momen, A.; Chakhchoukh, Y.; Johnson, B.K. Series Compensated Line Parameters Estimation Using Synchrophasor Measurements. IEEE Trans. Power Deliv. 2019, 34, 2152–2162. [Google Scholar] [CrossRef]
- Jiang, S.; Annakkage, U.; Gole, A. A platform for validation of FACTS models. IEEE Trans. Power Deliv. 2005, 21, 484–491. [Google Scholar] [CrossRef]
- Sun, J.; Li, M.; Zhang, Z.; Xu, T.; He, J.; Wang, H.; Li, G. Renewable energy transmission by HVDC across the continent: System challenges and opportunities. CSEE J. Power Energy Syst. 2017, 3, 353–364. [Google Scholar] [CrossRef]
- Agullo, J.; Croux, C.; Van Aelst, S. The multivariate least-trimmed squares estimator. J. Multivar. Anal. 2008, 99, 311–338. Available online: https://feb.kuleuven.be/public/u0017833/Programs/mlts/mlts.txt (accessed on 1 November 2021). [CrossRef] [Green Version]
- Wang, S.; Zhao, J.; Huang, Z.; Diao, R. Assessing Gaussian assumption of PMU measurement error using field data. IEEE Trans. Power Deliv. 2017, 33, 3233–3236. [Google Scholar] [CrossRef]
- Mili, L.; Cheniae, M.G.; Vichare, N.S.; Rousseeuw, P.J. Robust state estimation based on projection statistics [of power systems]. IEEE Trans. Power Syst. 1996, 11, 1118–1127. [Google Scholar] [CrossRef]
- PowerWorld. Available online: https://www.powerworld.com (accessed on 27 October 2021).
- Beleed, H.; Johnson, B.K. Comparative study on IEEE12 bus system with D-FACTS devices in different simulation tools. In Proceedings of the 2017 North American Power Symposium (NAPS), Morgantown, WV, USA, 17–19 September 2017; pp. 1–6. [Google Scholar]
- Szechtman, M. First benchmark model for HVDC control studies. Electra 1991, 135, 55–73. [Google Scholar]
- Zhang, Q.; Vittal, V.; Heydt, G.; Chakhchoukh, Y.; Logic, N.; Sturgill, S. The time skew problem in PMU measurements. In Proceedings of the 2012 IEEE Power and Energy Society General Meeting, San Diego, CA, USA, 22–26 July 2012; pp. 1–6. [Google Scholar] [CrossRef]
- Ma, X.; Liu, C.; Wu, J.; Long, C. On-demand state estimation with sampling time skew in power systems. In Proceedings of the 2015 IEEE 28th Canadian Conference on Electrical and Computer Engineering (CCECE), Halifax, NS, Canada, 3–6 May 2015; pp. 259–264. [Google Scholar] [CrossRef]
- Glavic, M.; Van Cutsem, T. Tracking network state from combined SCADA and synchronized phasor measurements. In Proceedings of the 2013 IREP Symposium Bulk Power System Dynamics and Control—IX Optimization, Security and Control of the Emerging Power Grid, Rethymno, Greece, 25–30 August 2013; pp. 1–10. [Google Scholar]


Publisher’s Note: MDPI stays neutral with regard to jurisdictional claims in published maps and institutional affiliations. |
© 2021 by the authors. Licensee MDPI, Basel, Switzerland. This article is an open access article distributed under the terms and conditions of the Creative Commons Attribution (CC BY) license (https://creativecommons.org/licenses/by/4.0/).