
Real-Time Monitoring of the Vacuum Degree Based on the Partial Discharge and an Insulation Supplement Design for a Distribution Class Vacuum Interrupter


Abstract
:1. Introduction
2. Vacuum Holding Experiment and Dielectric Experiment According to the Vacuum Degree in VI
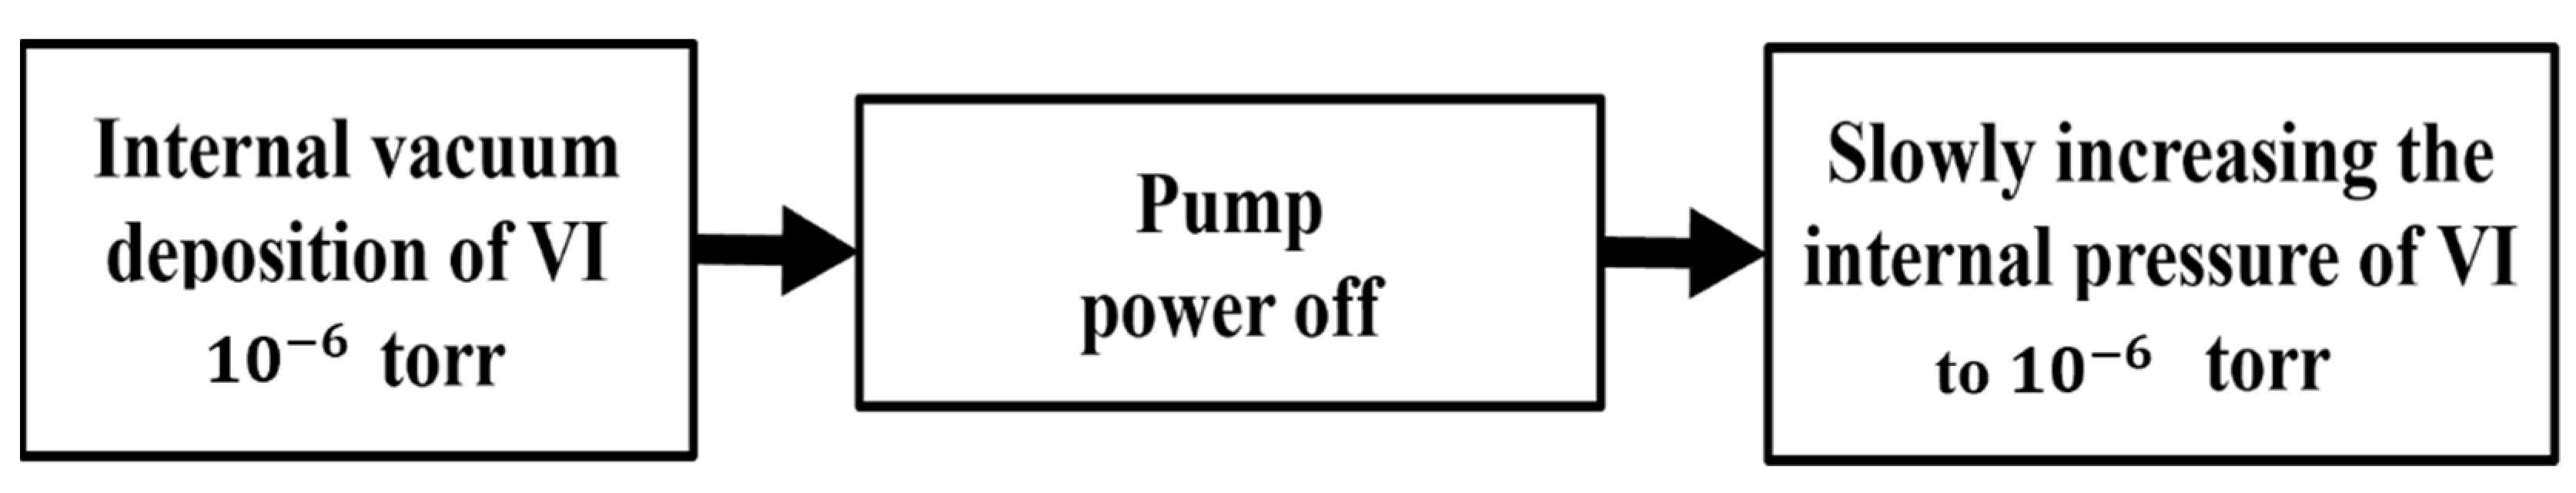
2.1. Vacuum Holding Experiment
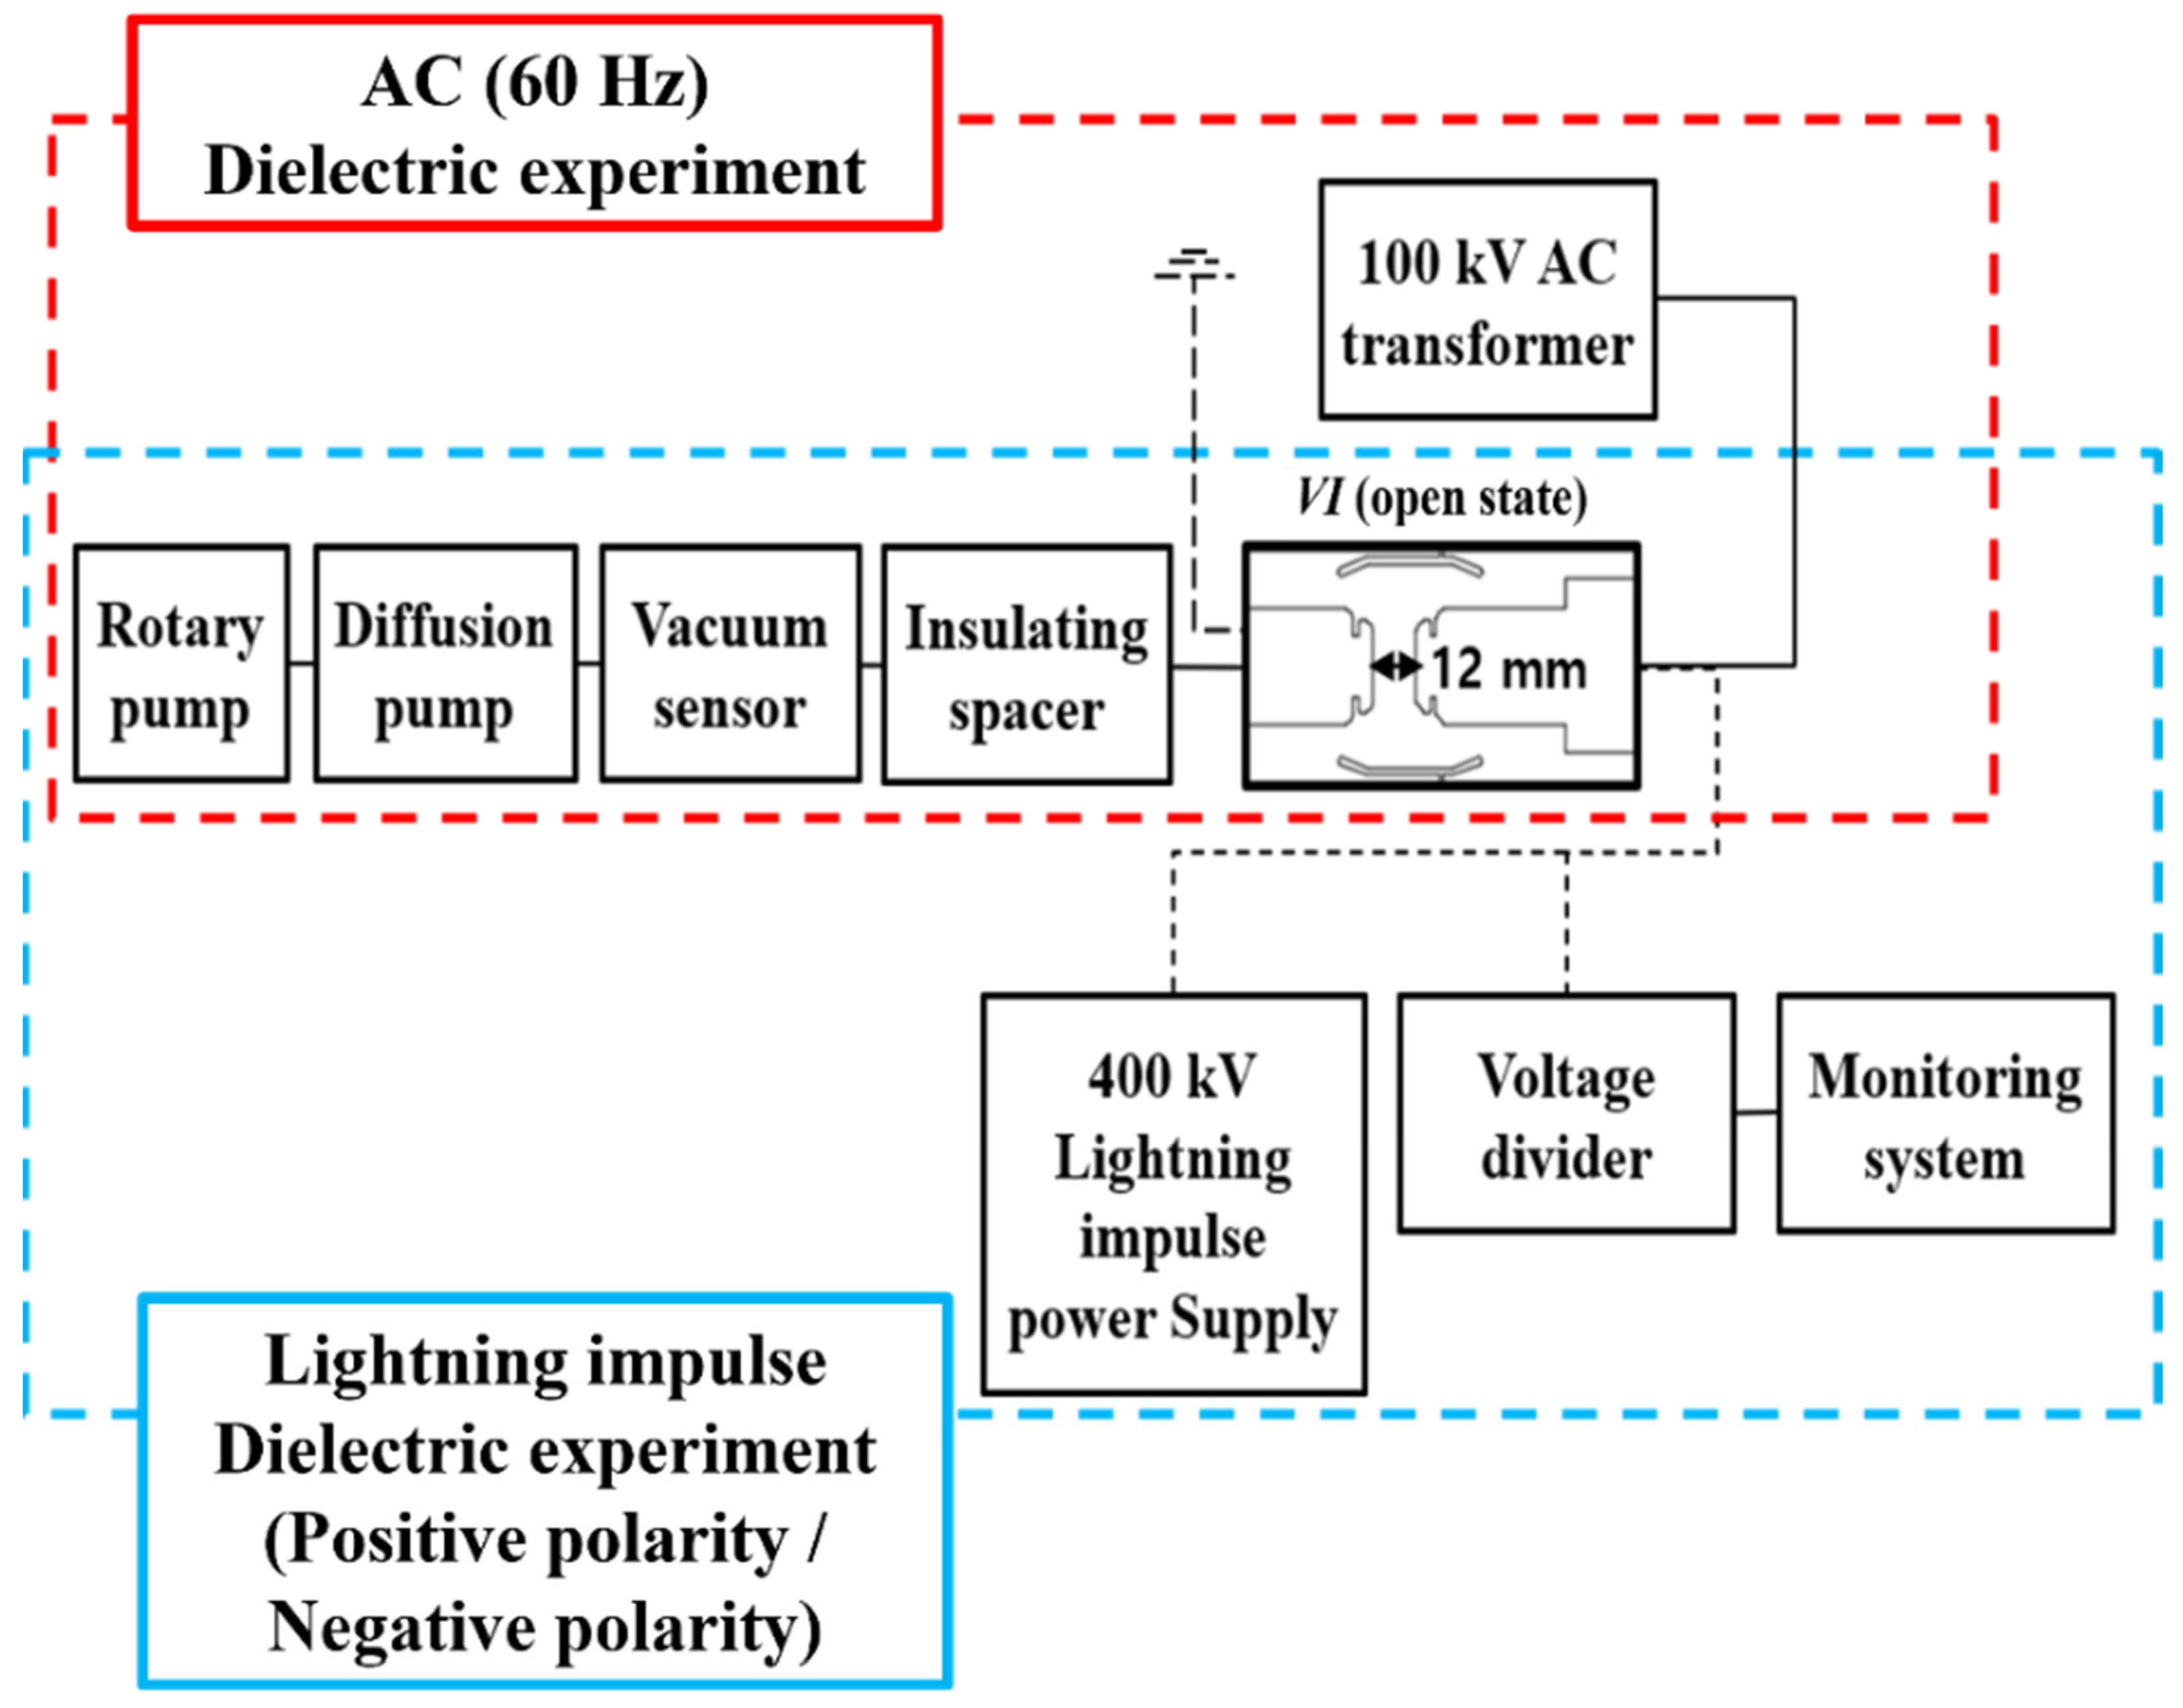
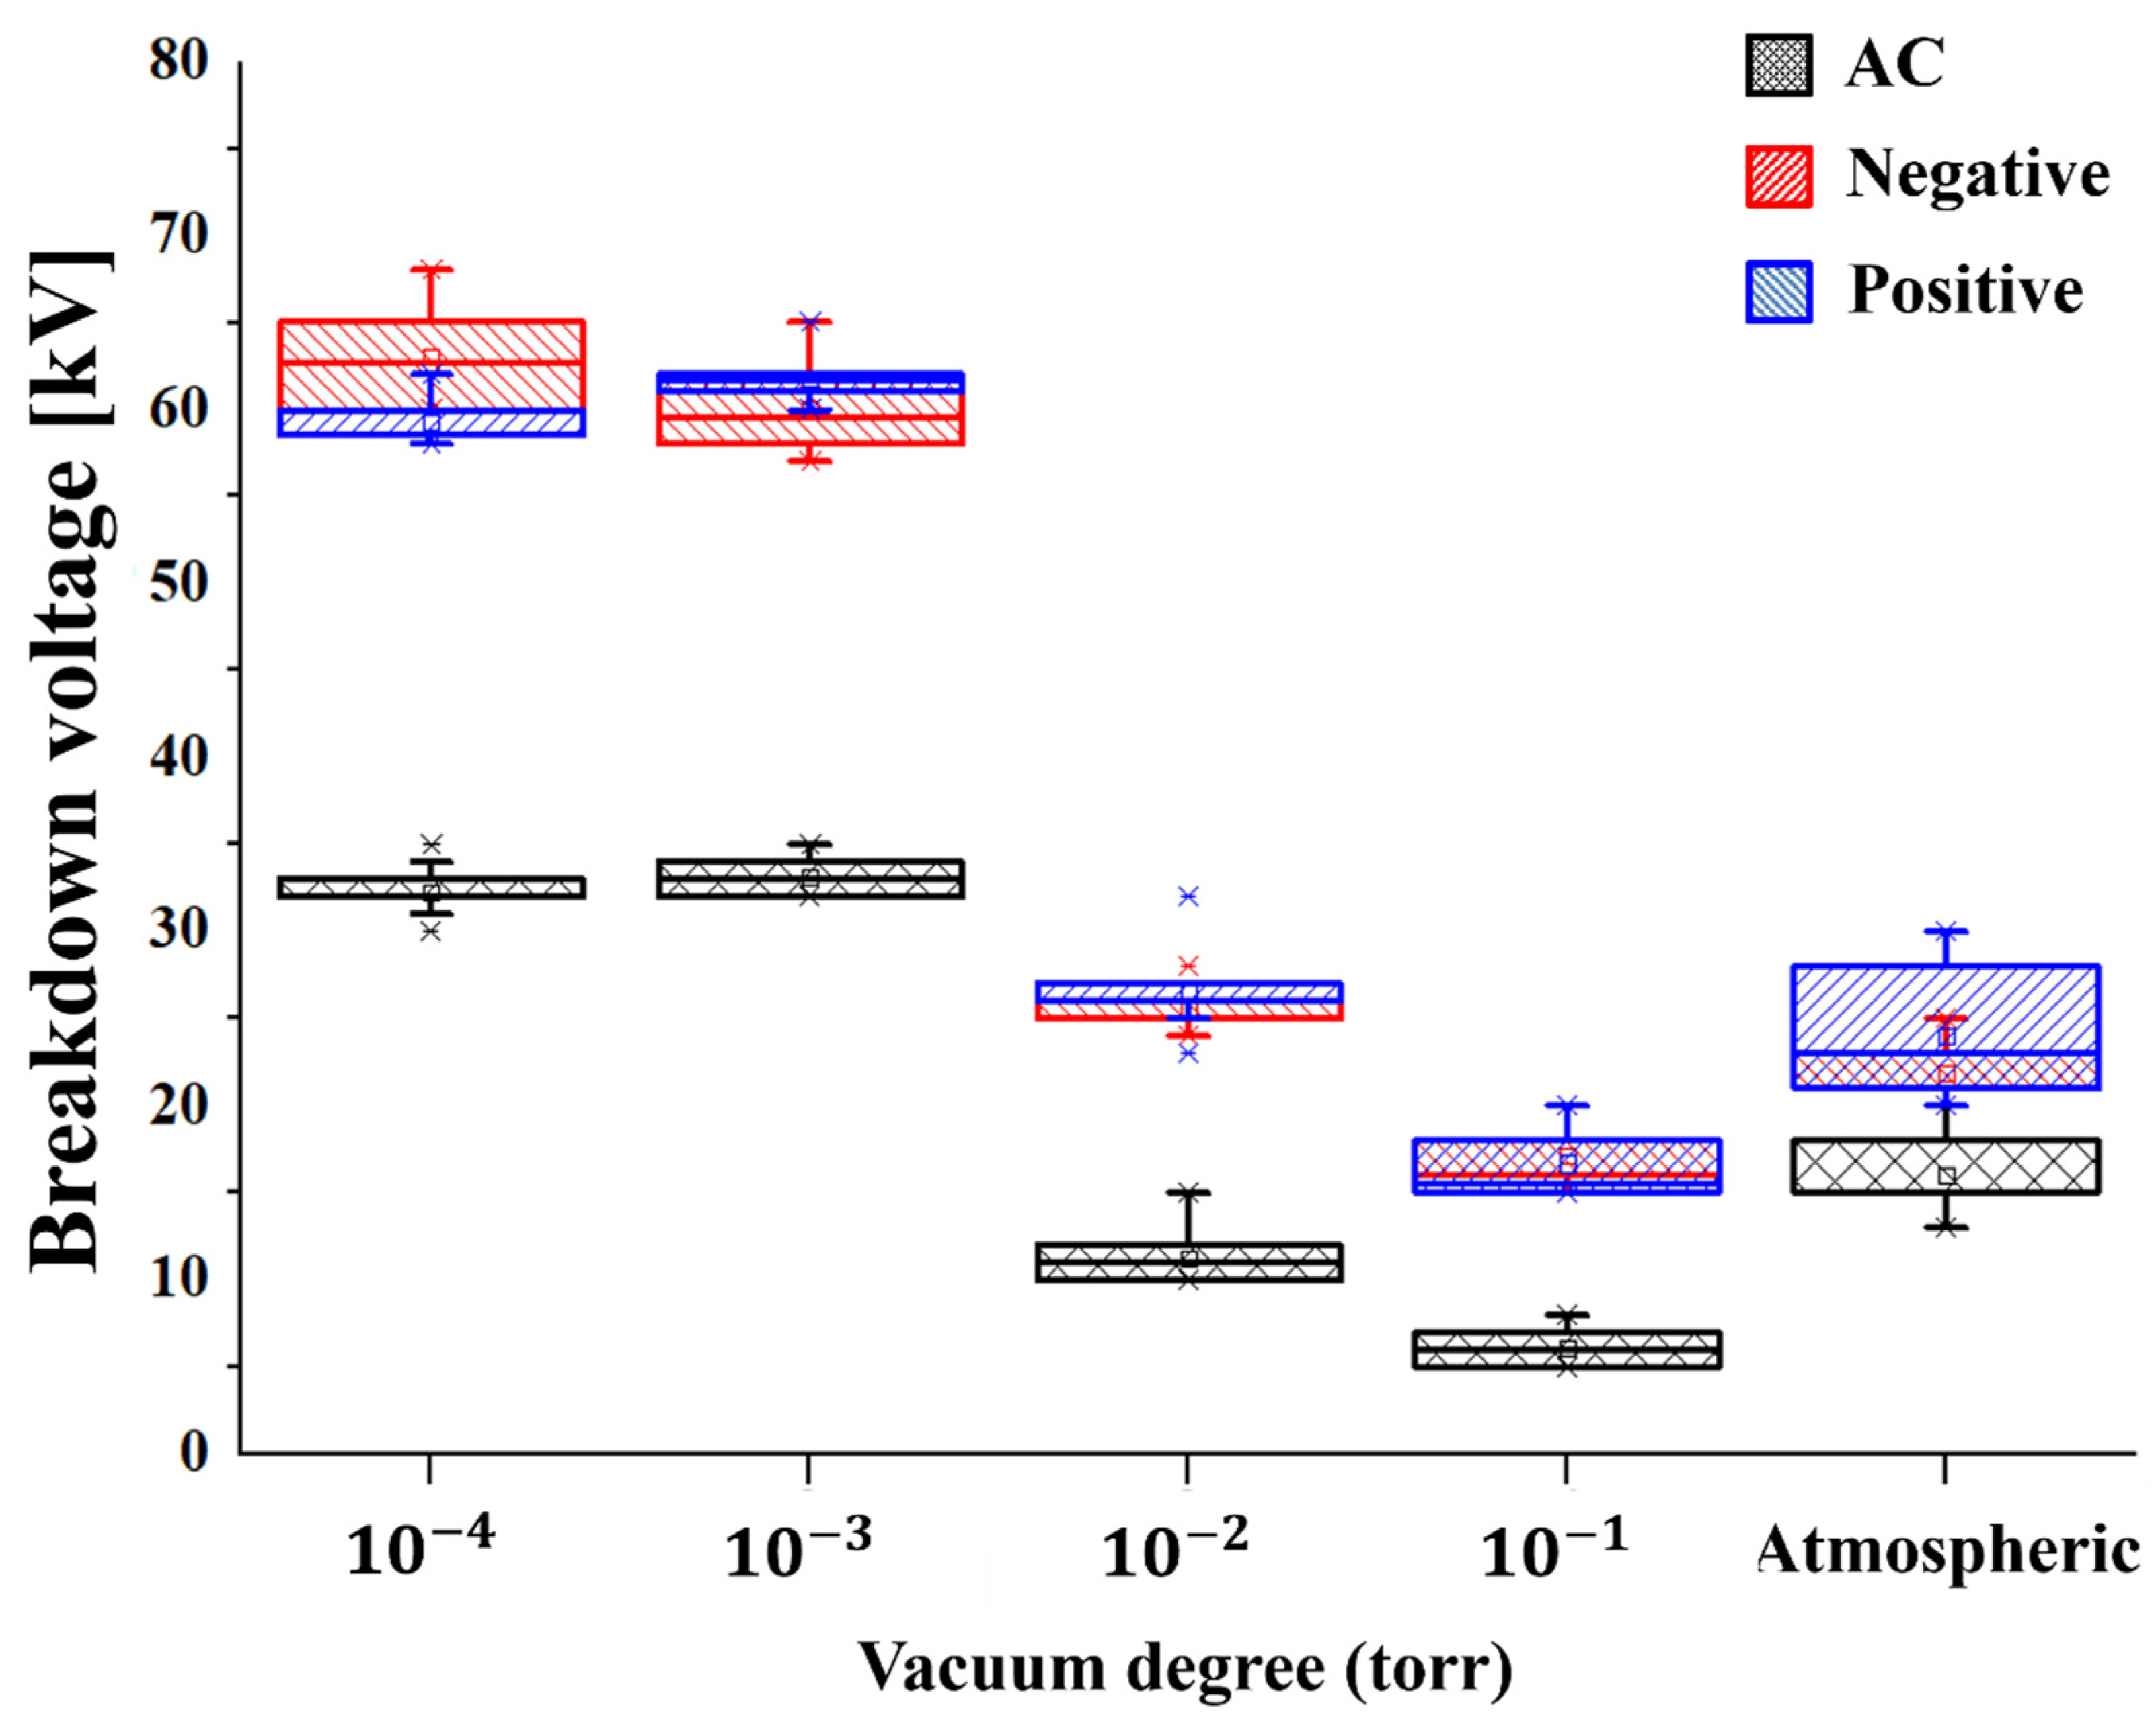
2.2. Dielectric Experiment of VI According to Vacuum Degree
3. Partial Discharge Experiment of VI According to the Vacuum Degree
3.1. Capacity Calculation of the Coupling Capacitor
3.2. Partial Discharge and Induced Voltage Experiments of VI According to the Vacuum Degree
4. Insulation Supplement Design Method for the Real-Time Monitoring Technology
5. Conclusions
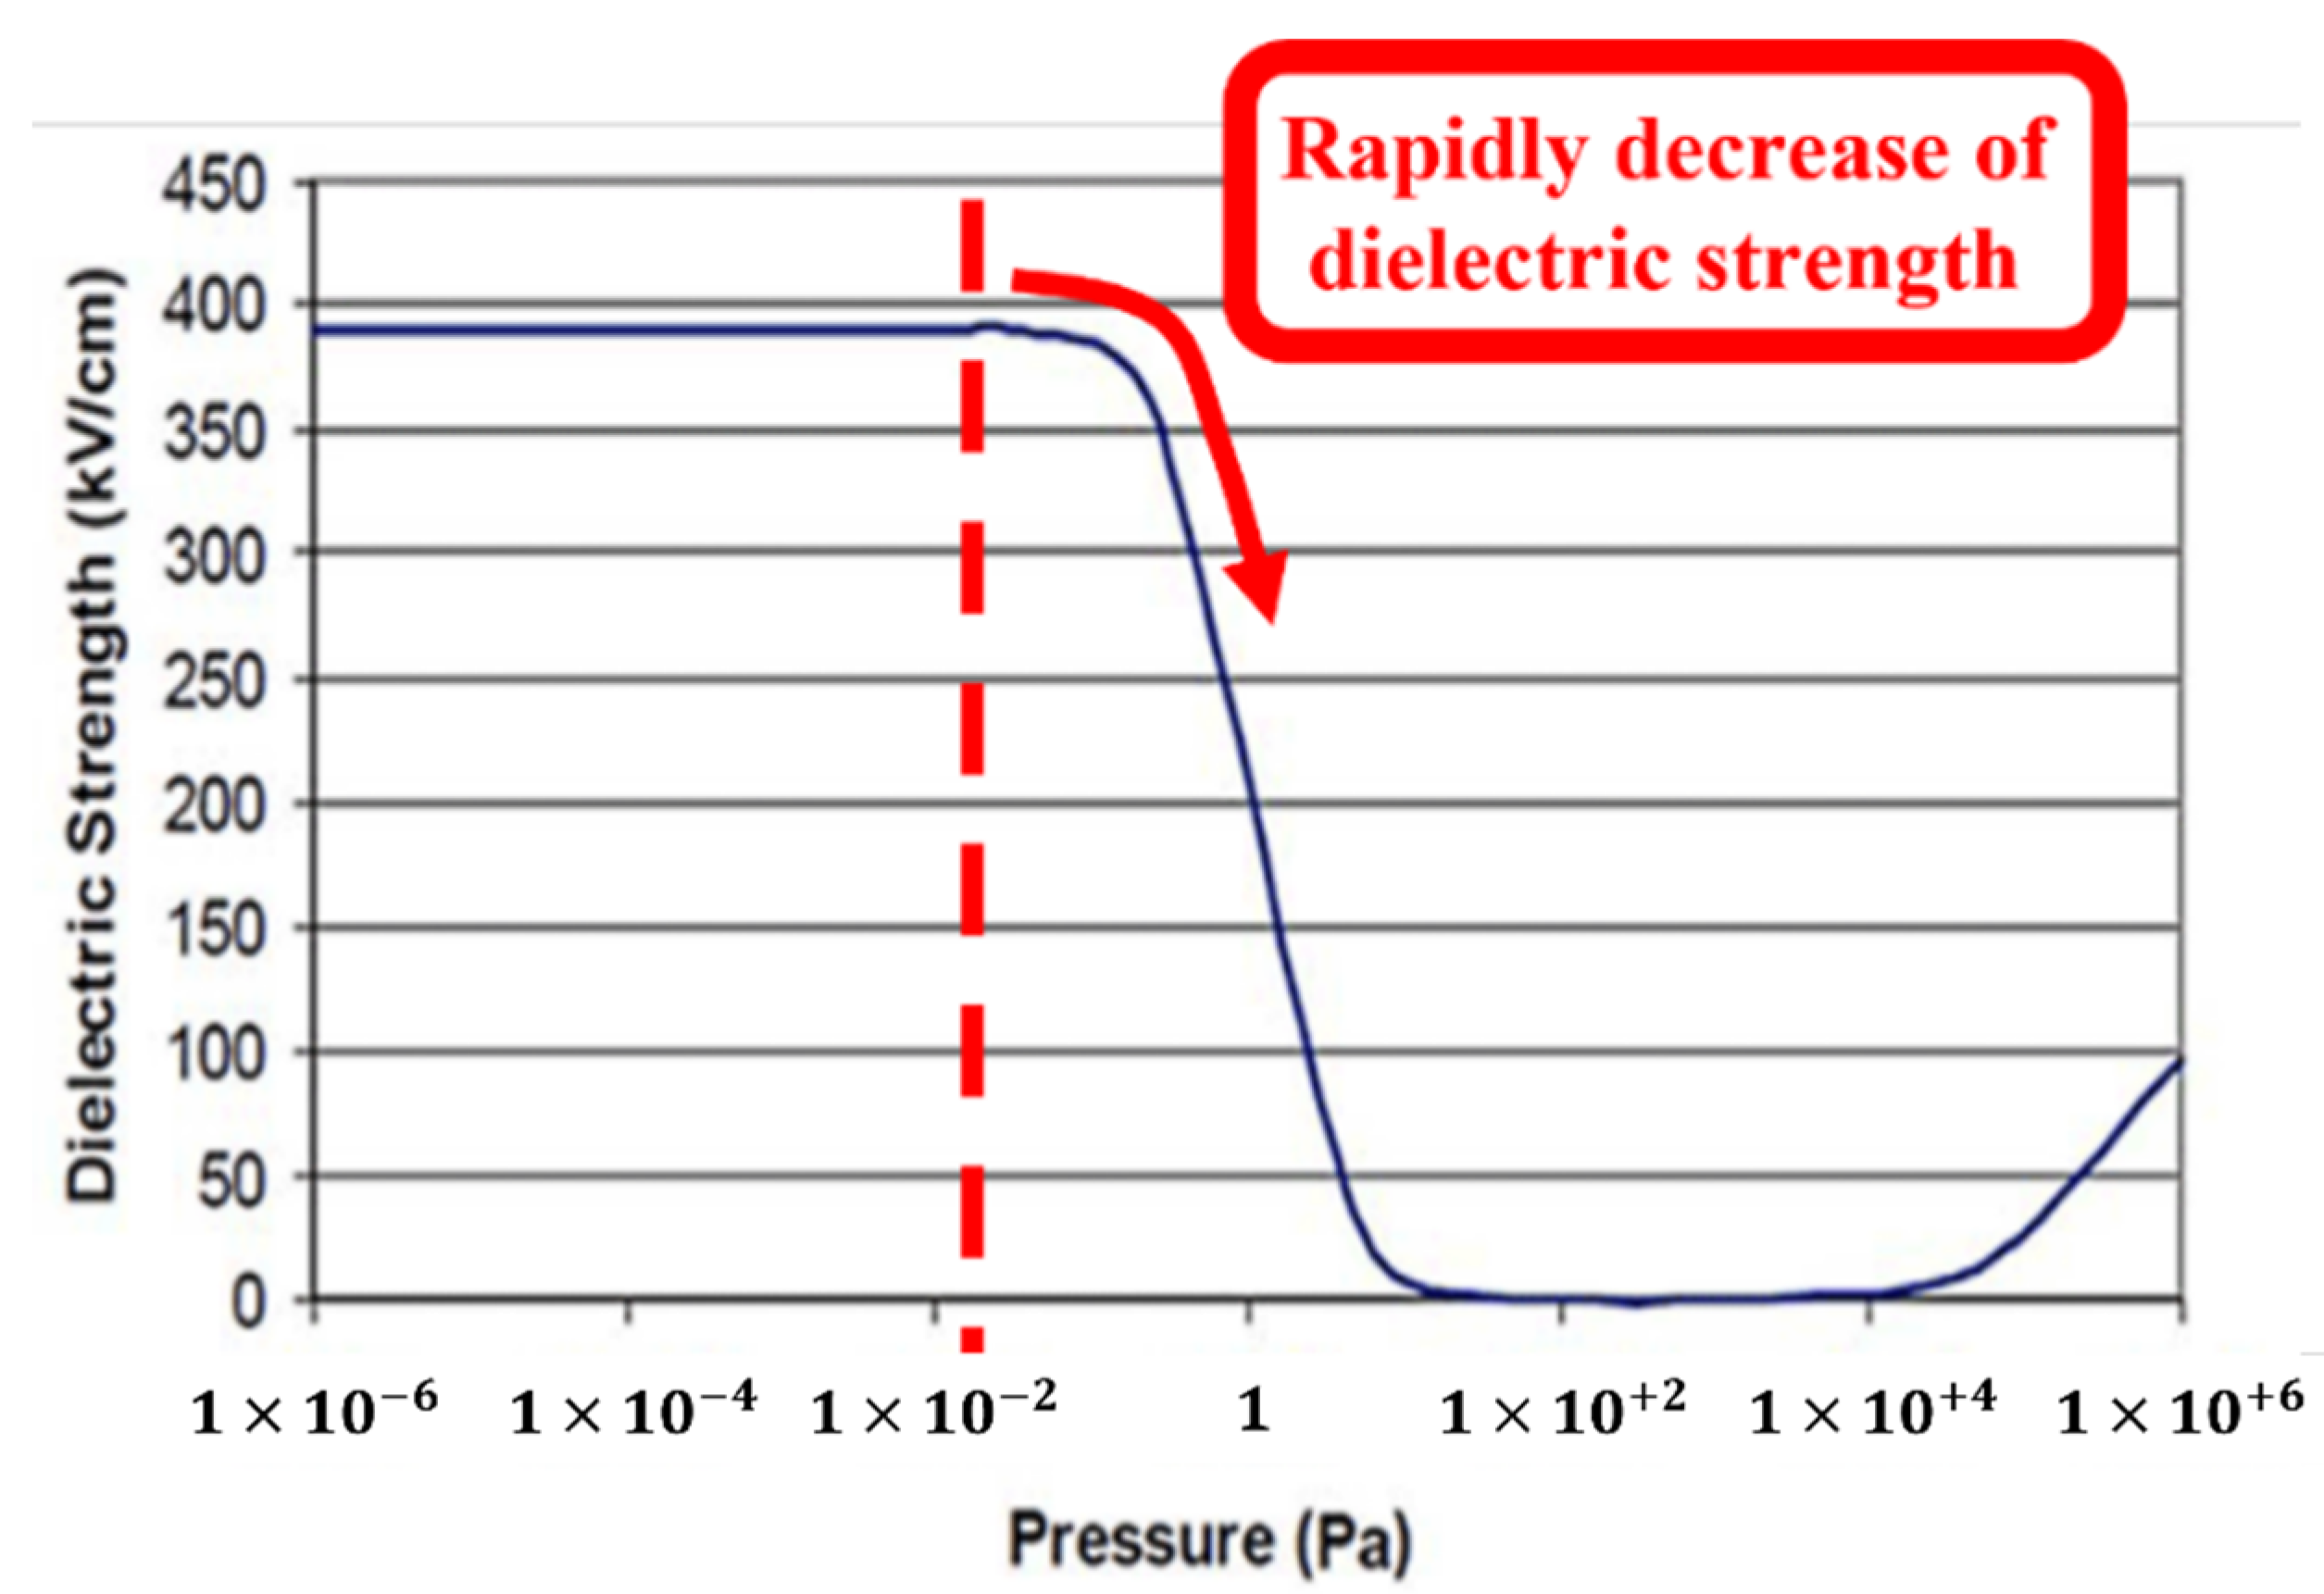
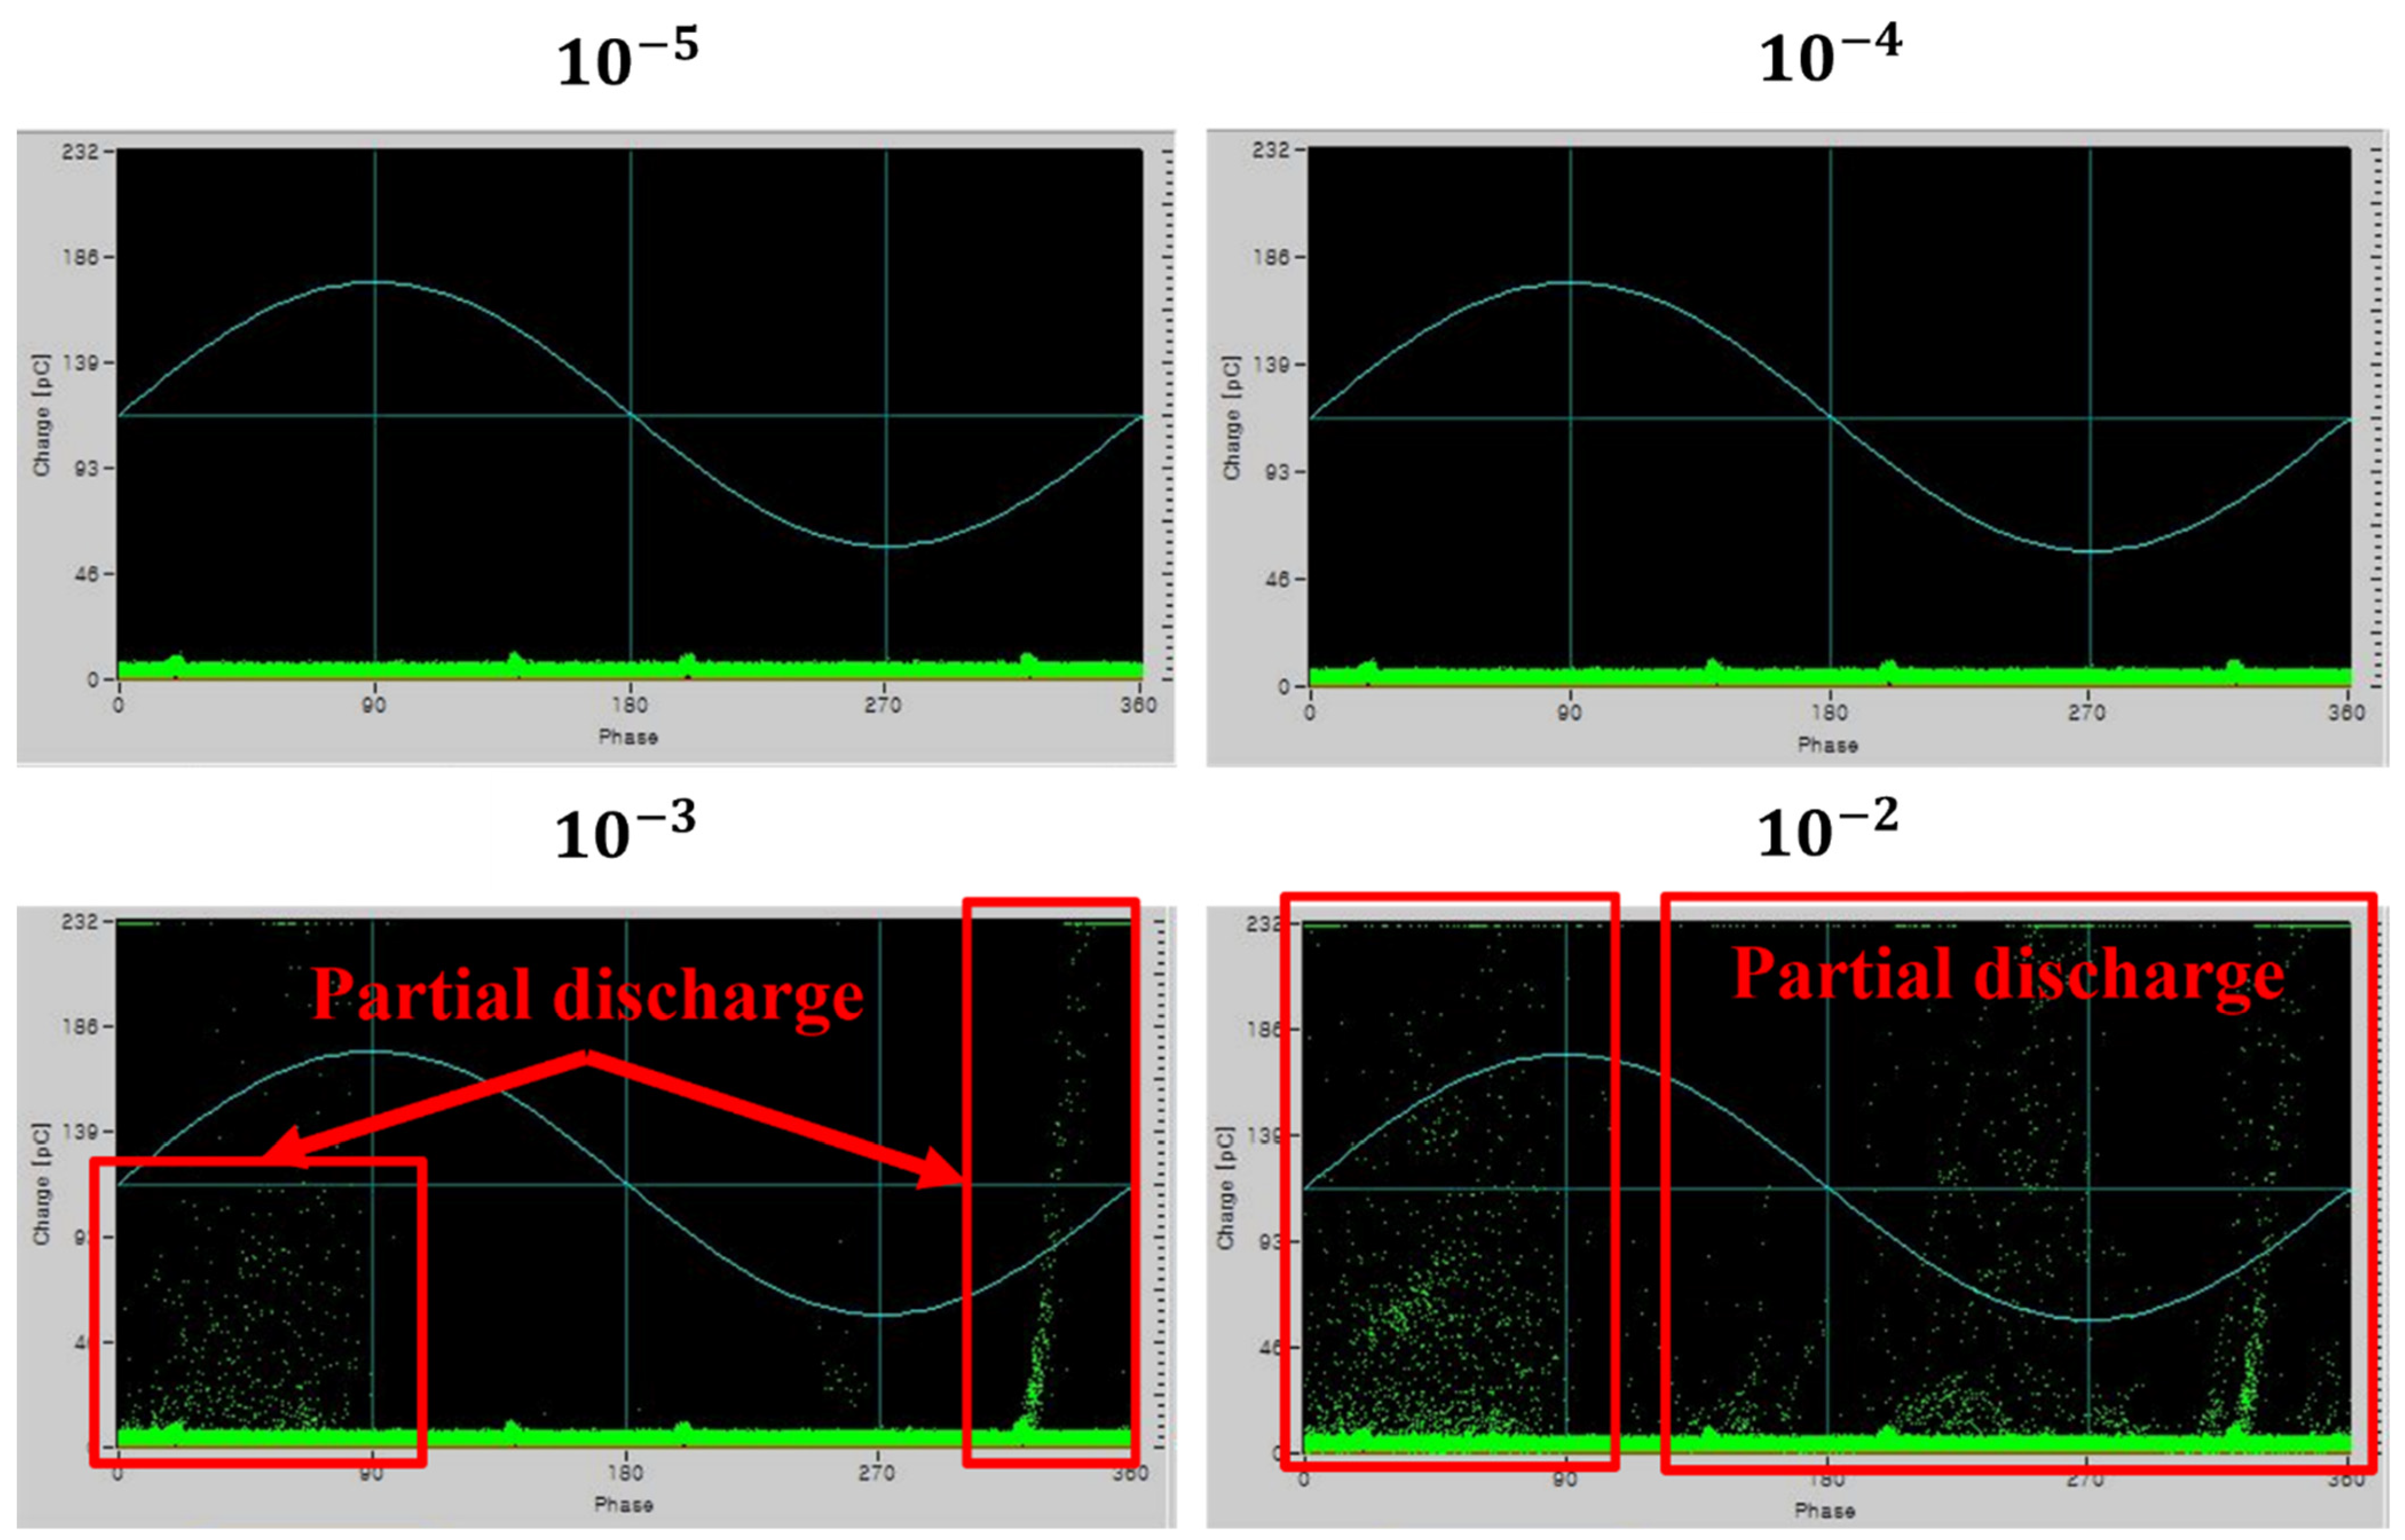
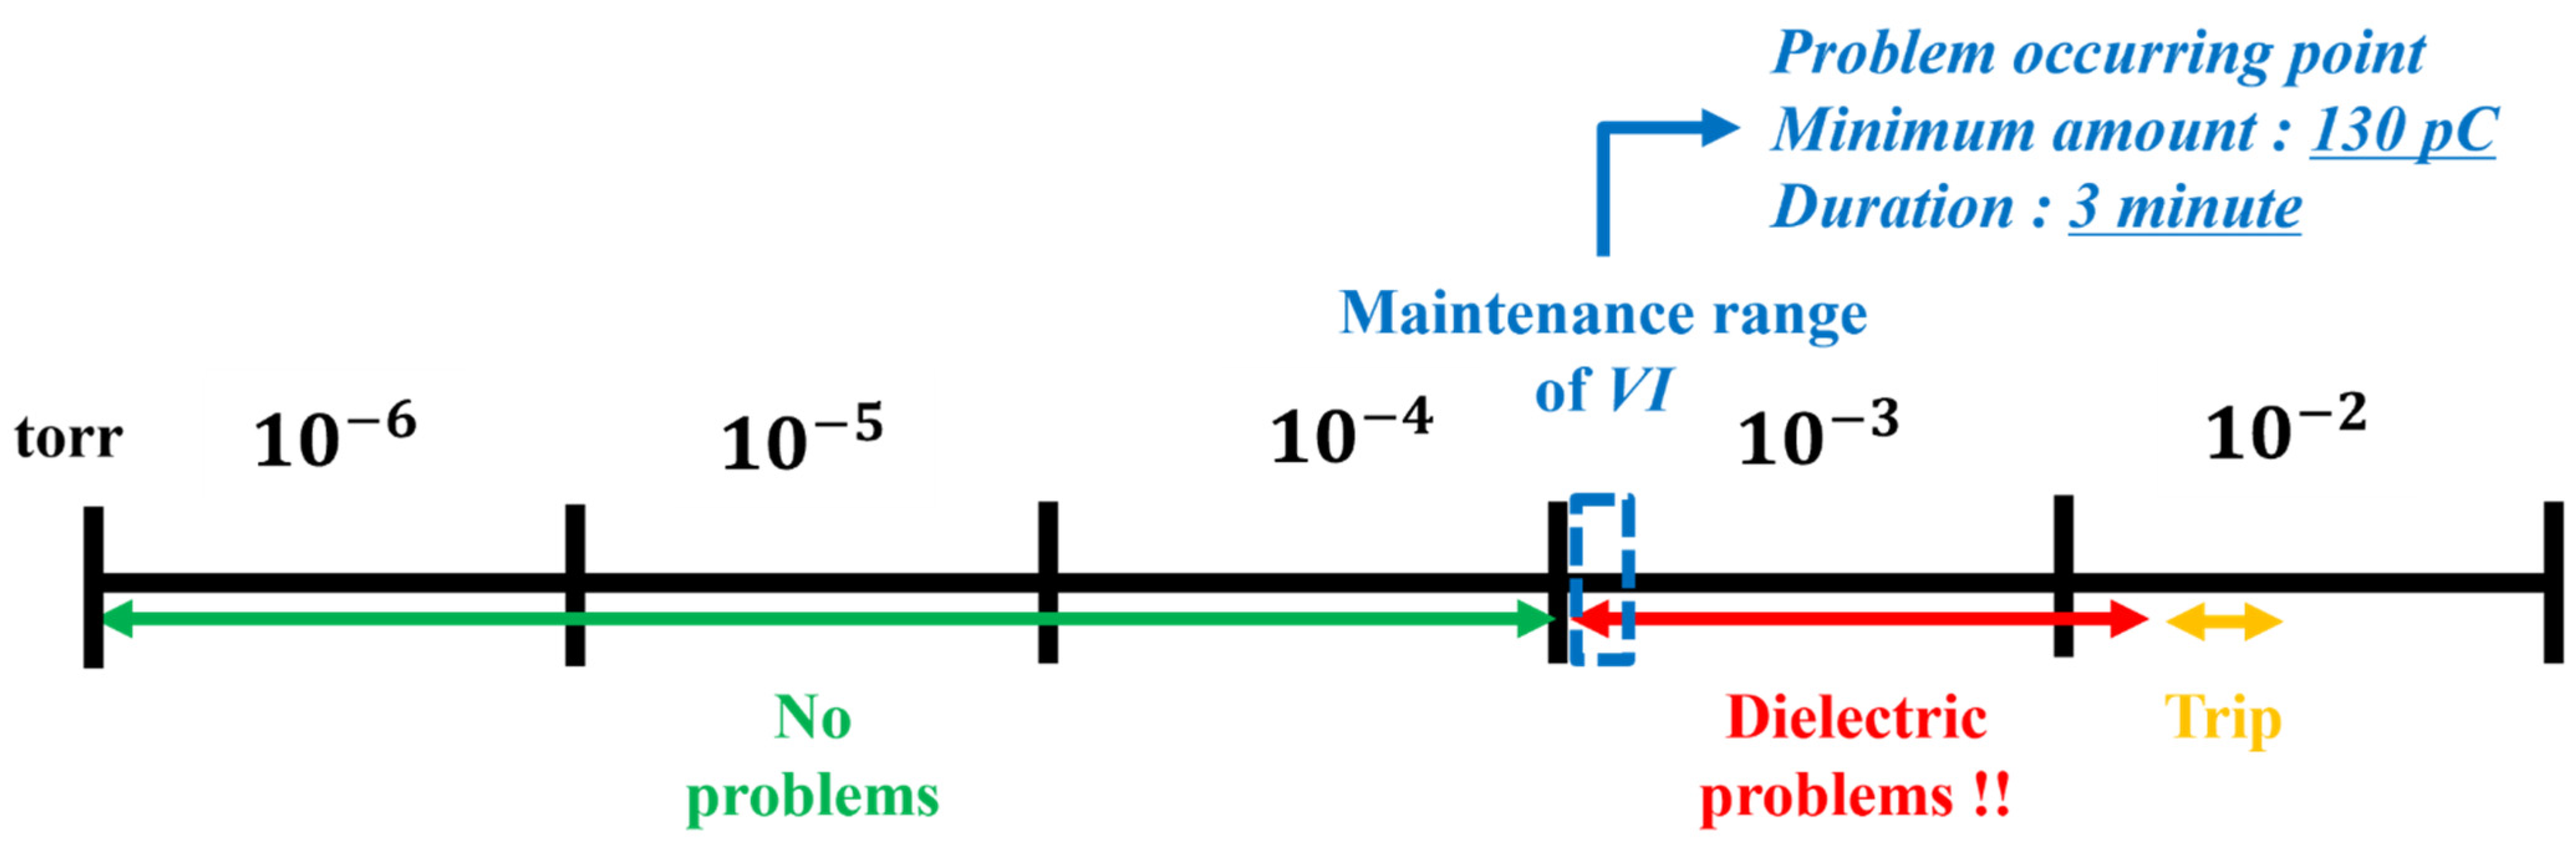
- The dielectric strength of the vacuum rapidly decreased at 10−3 torr. To maintain high reliability and efficient maintenance, it is found that the VI should be replaced when the vacuum degree of the VI is 10−3 torr.
- The pattern and amount of partial discharge were different for each experiment, even for VIs with the same mechanical structure and electrical characteristics. The induced voltage was constant with a magnitude of about 30~35 V.
- To monitor the vacuum degree of the VI, it is important to continuously check the minimum amount of partial discharge and duration along with a certain magnitude of induced voltage rather than monitoring the peak amount of partial discharge.
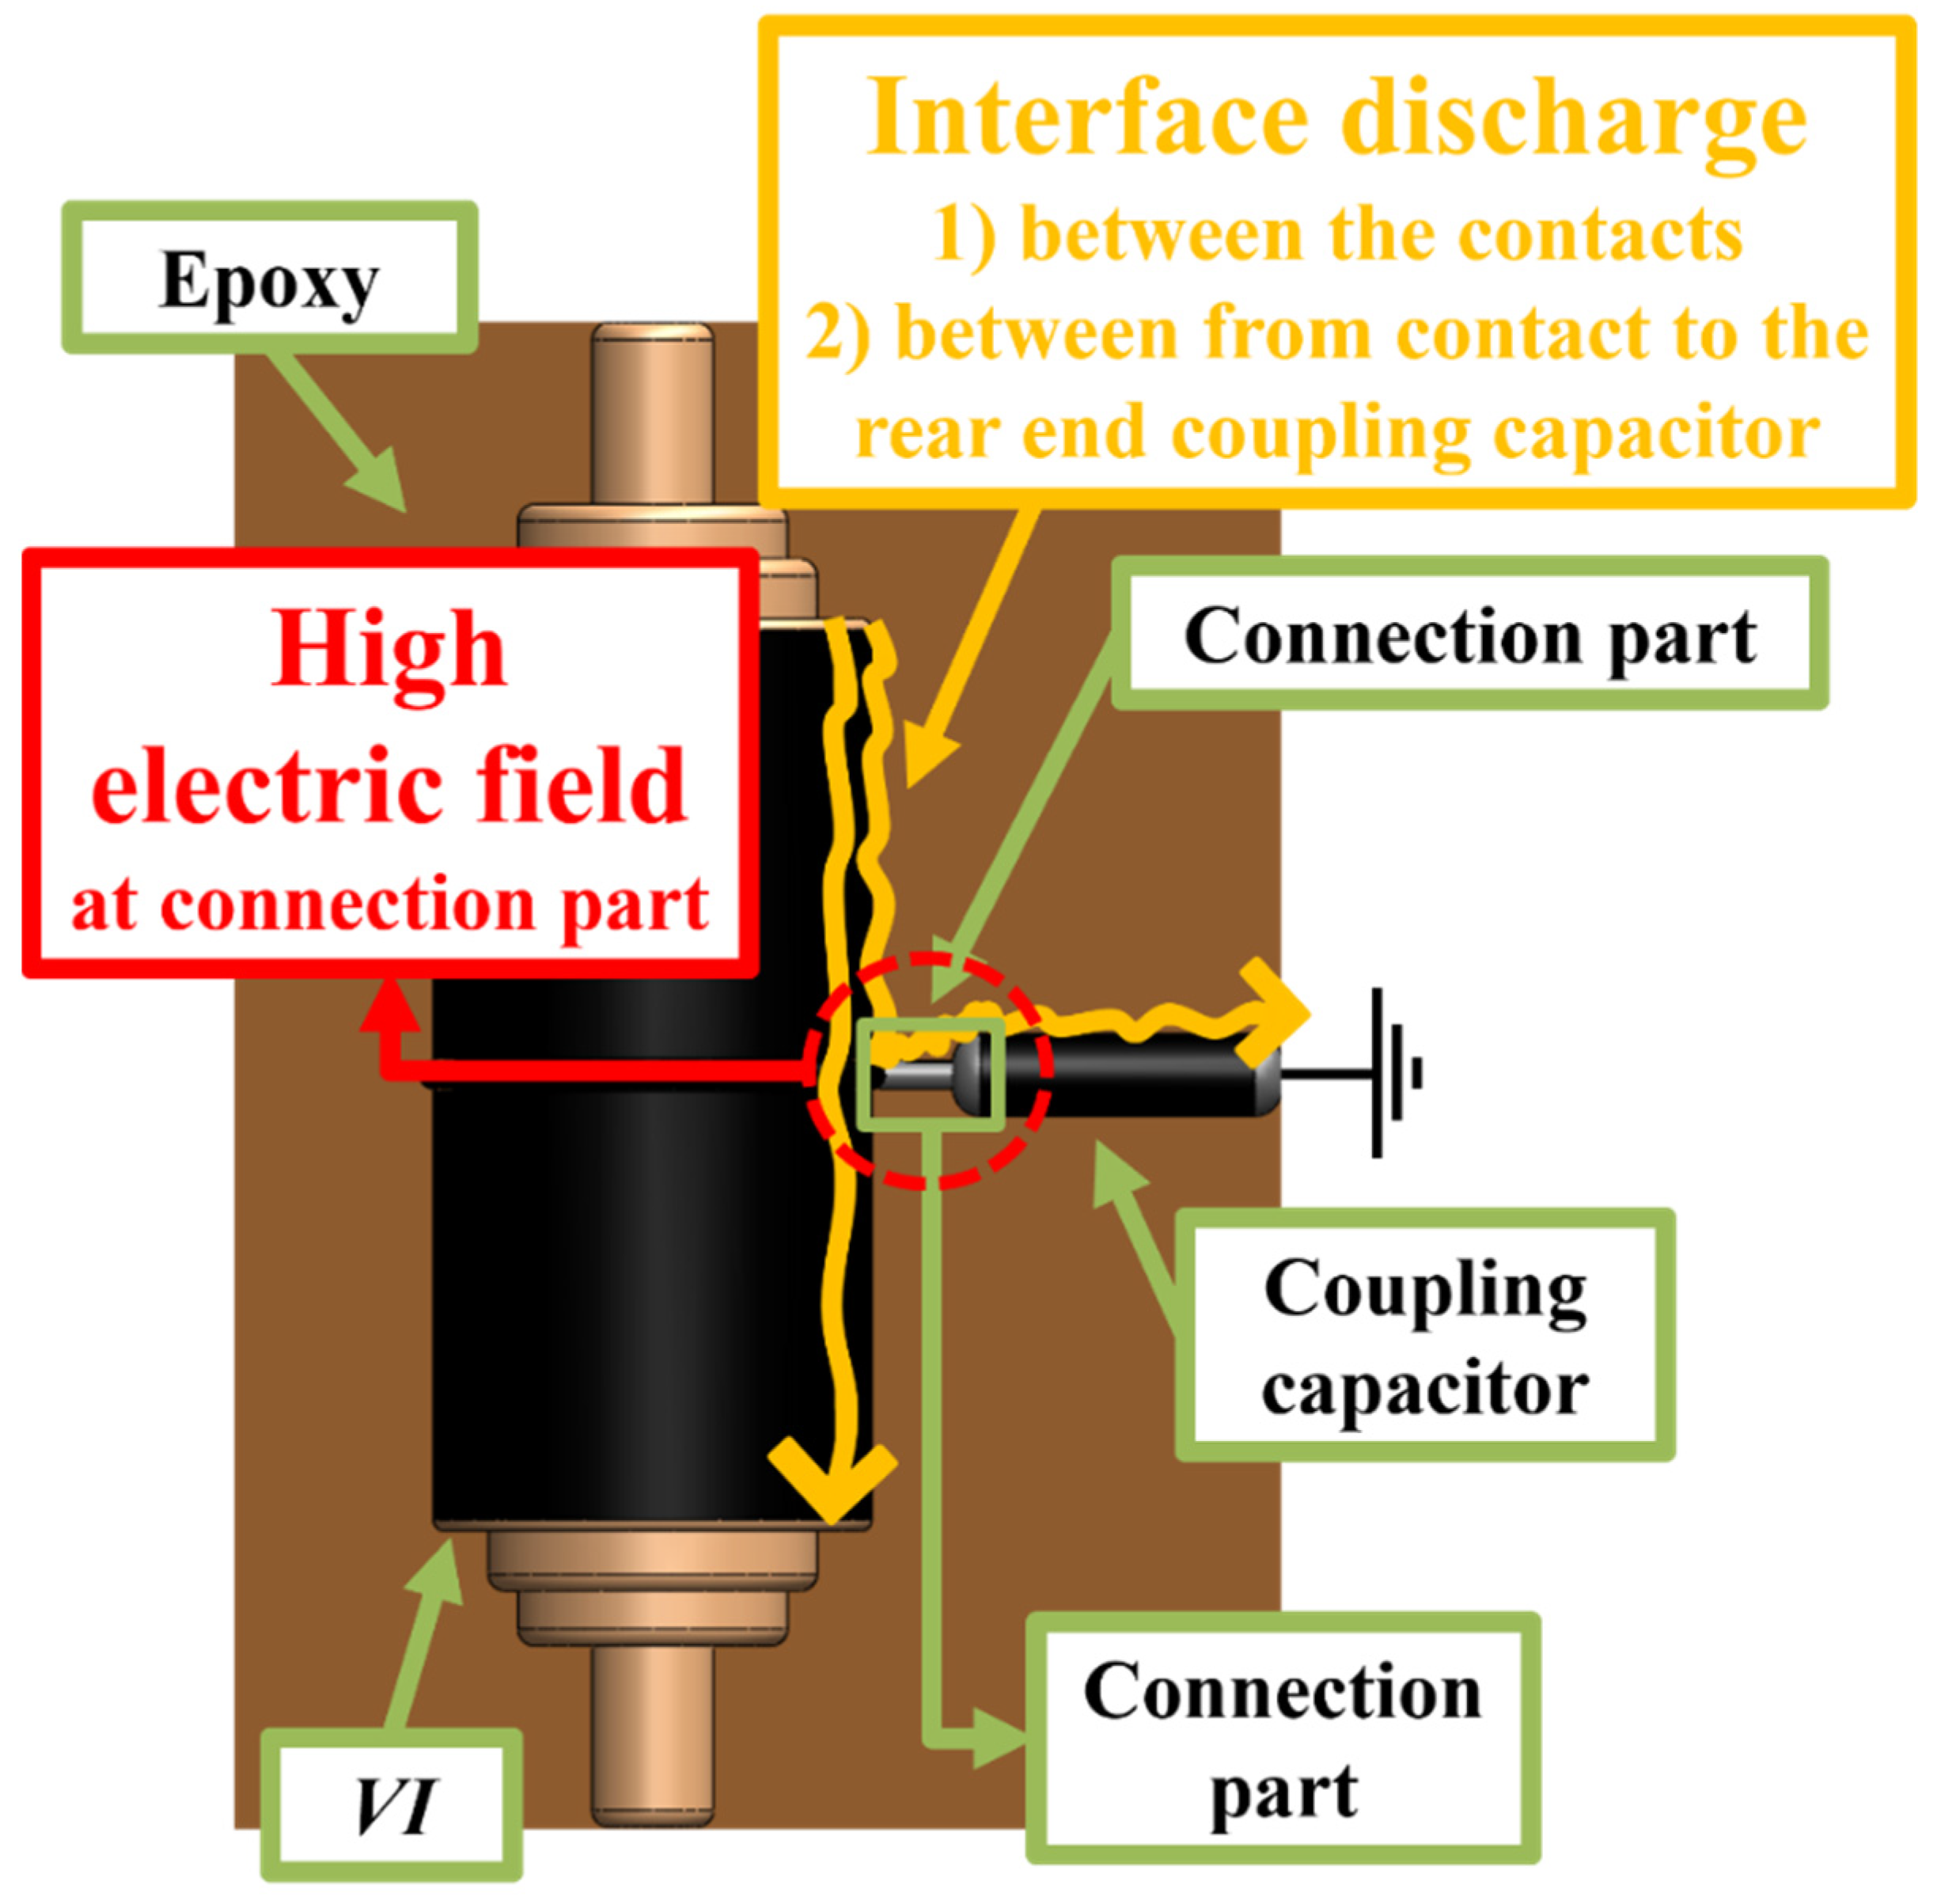
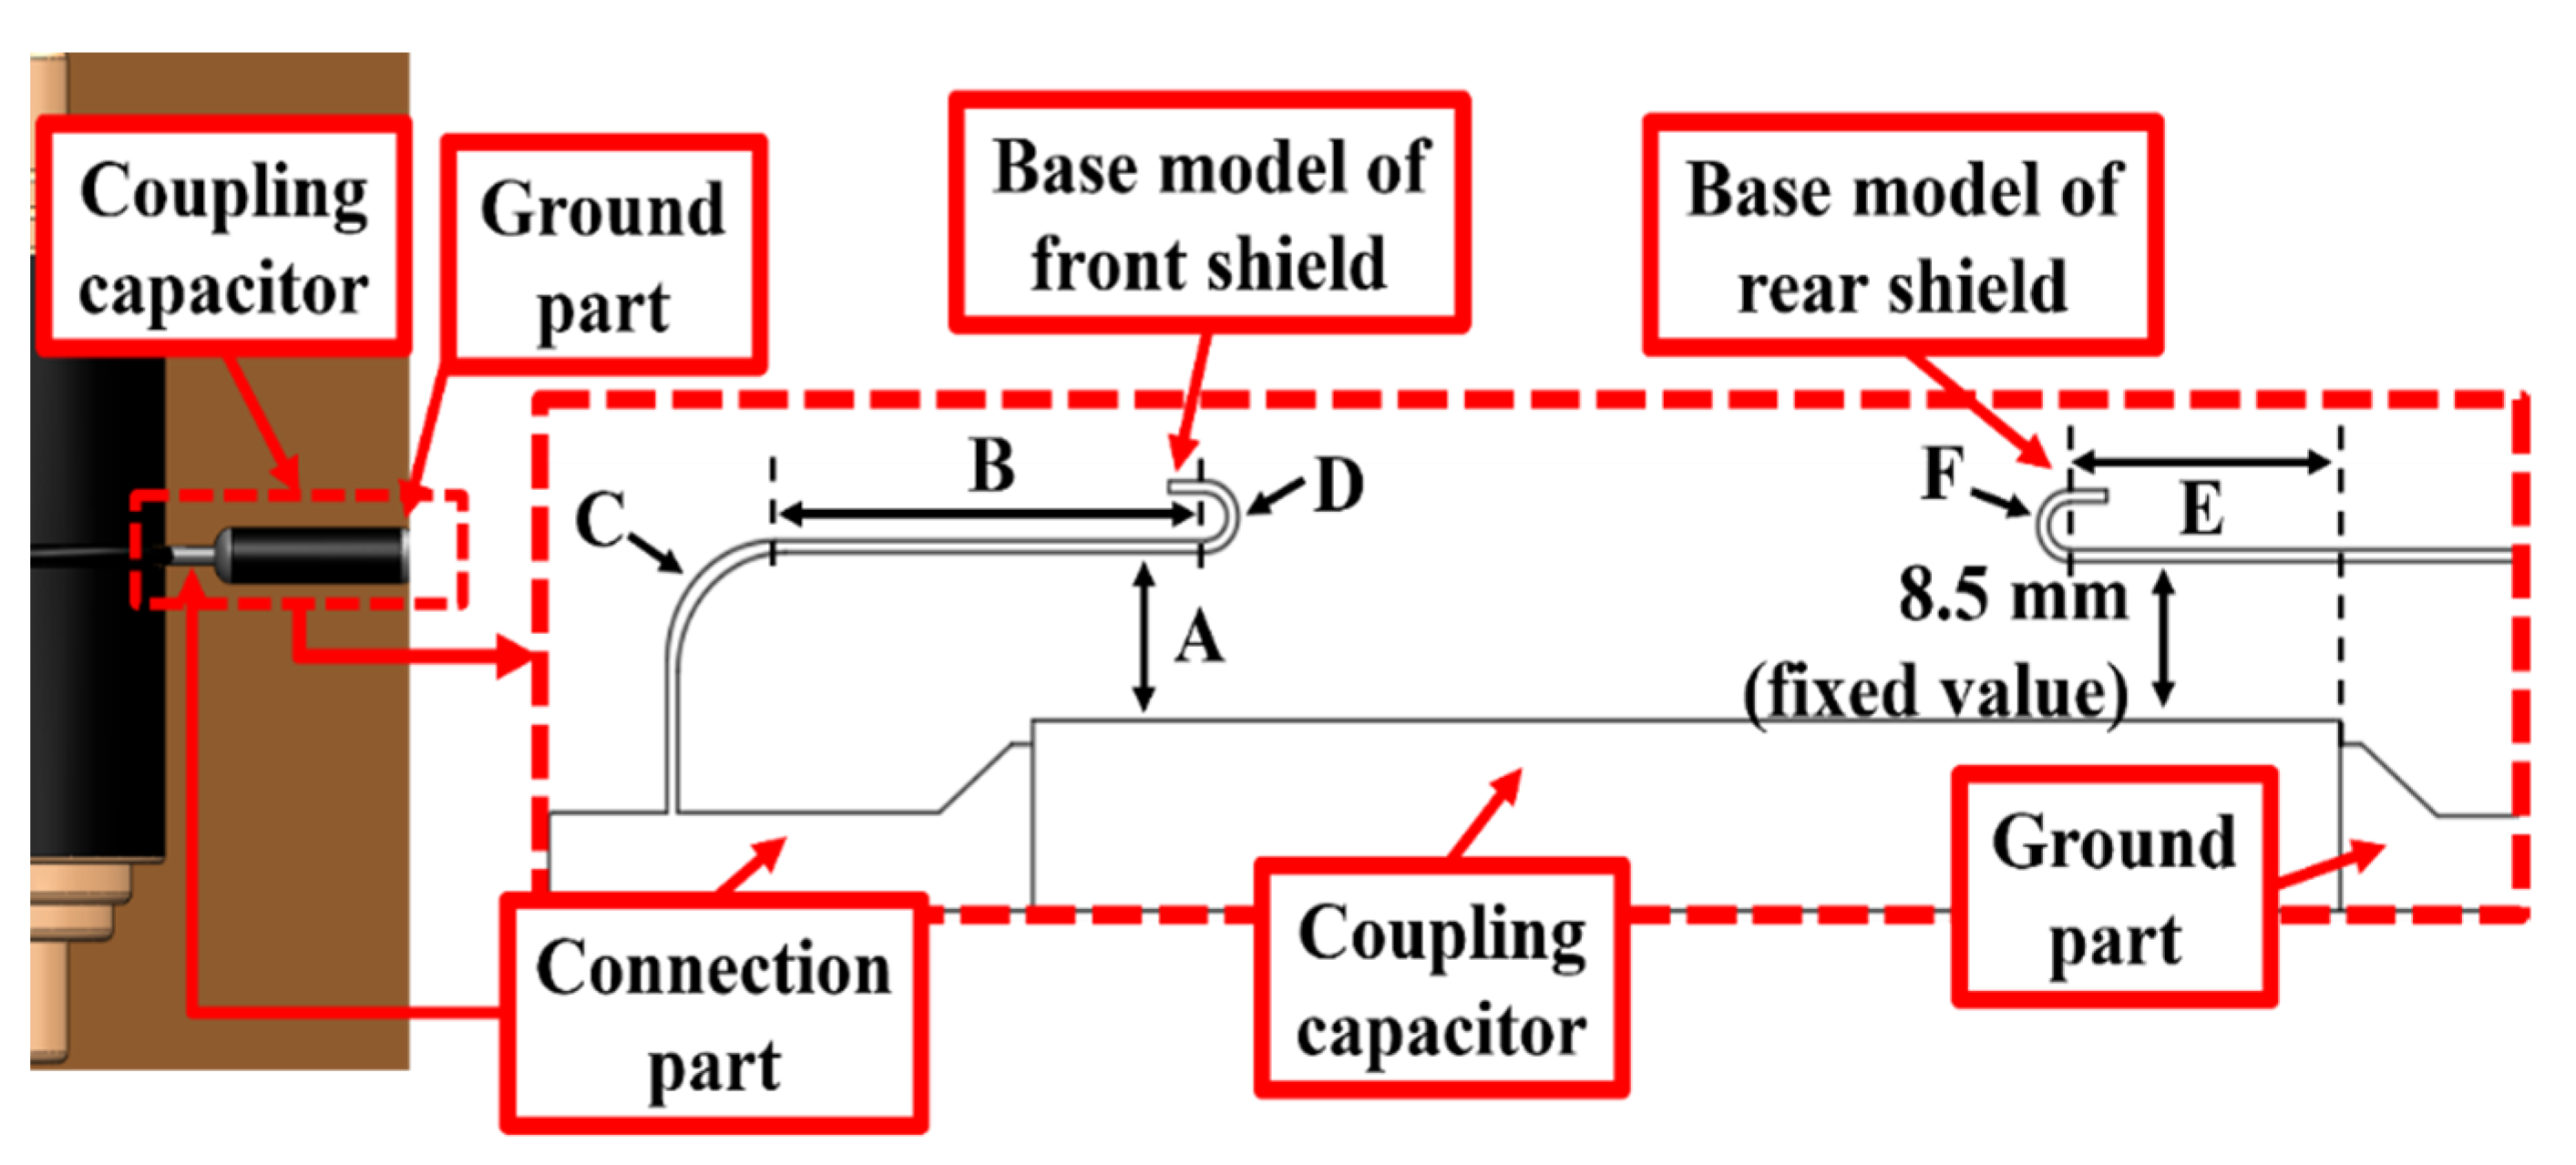
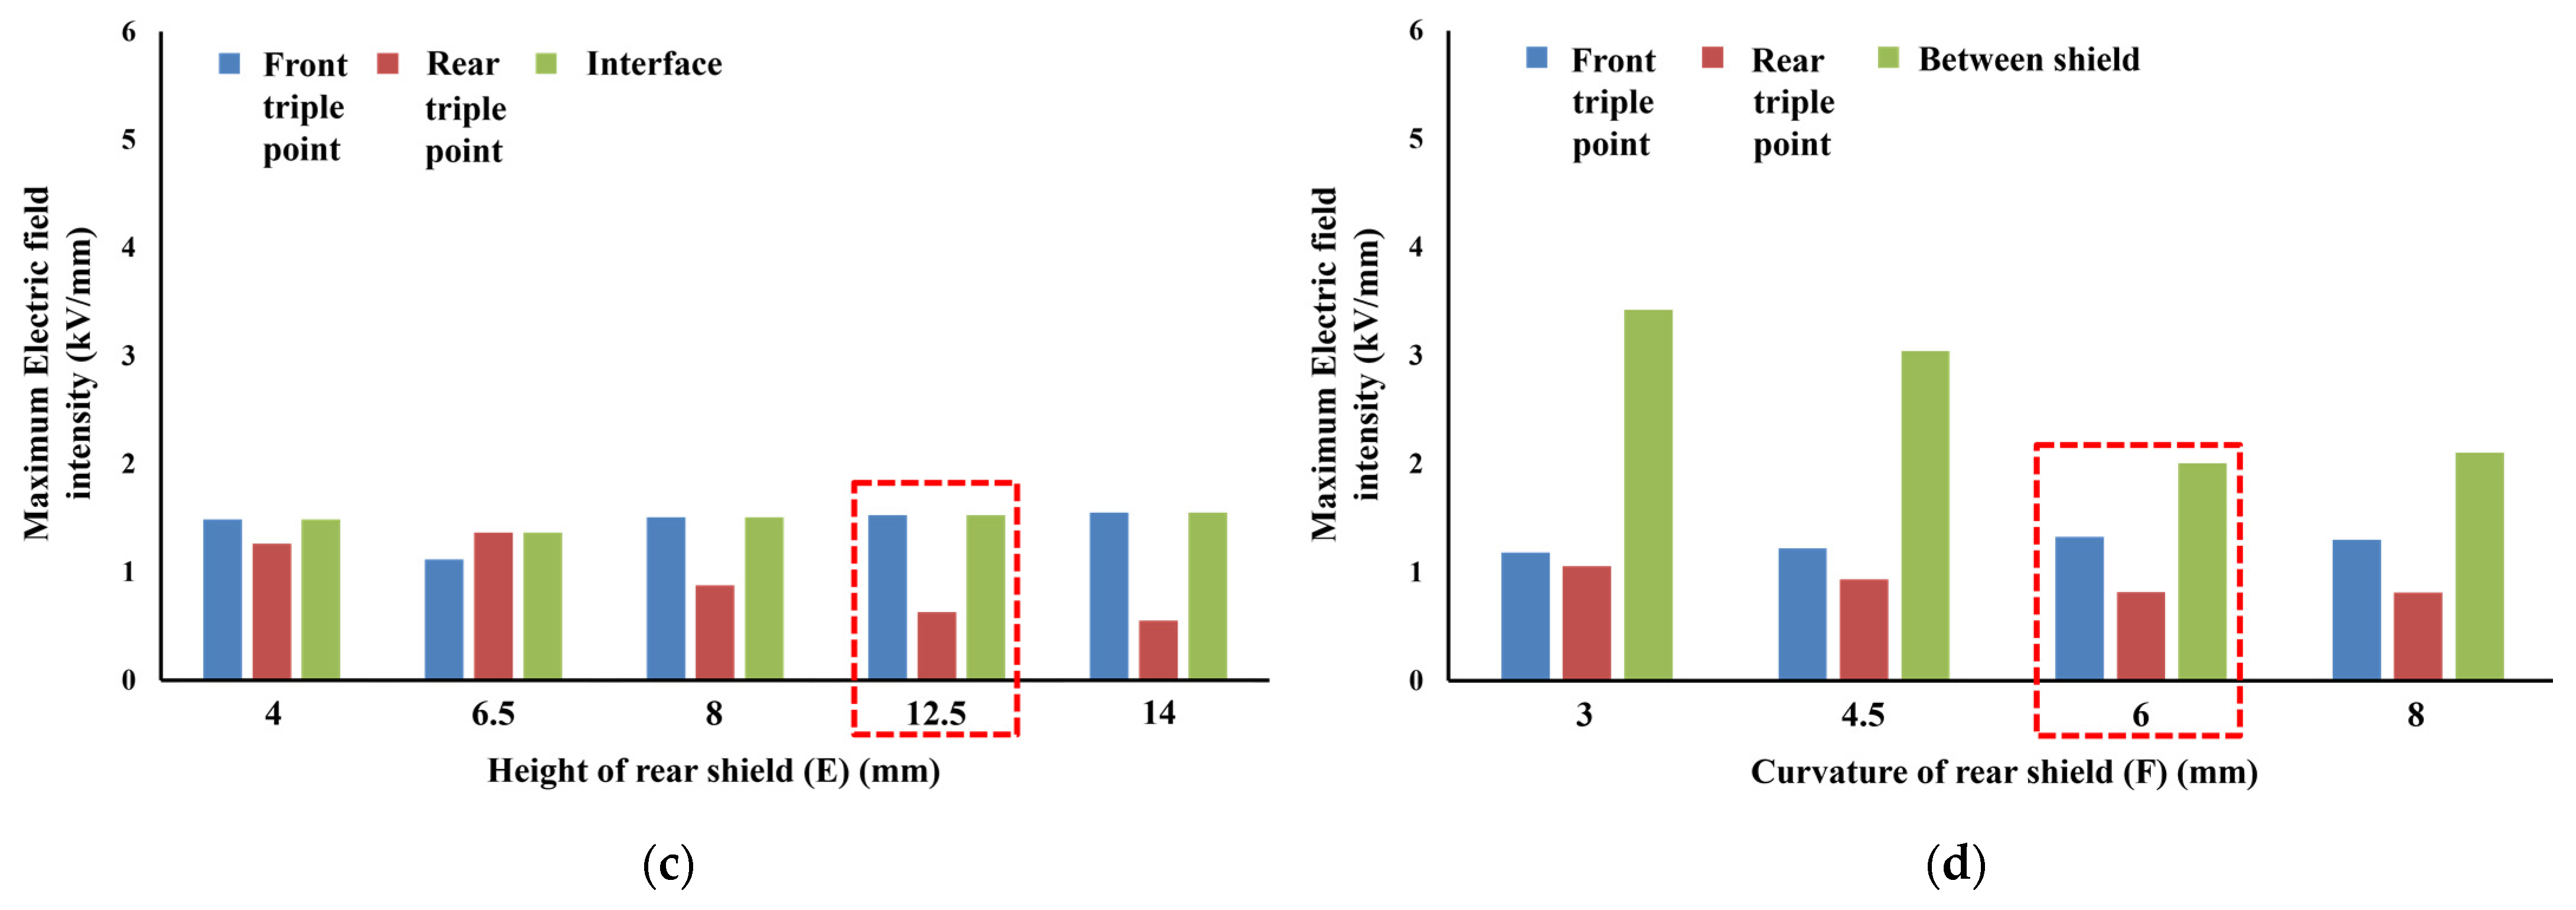
- The electric field intensity generated at the interface of the coupling capacitor could be reduced by 73.5% through the insulation supplement design of the real-time monitoring technology.
- Solid insulation high-voltage apparatus to which real-time monitoring technology is applied can improve the reliability of power transmission and the efficiency of maintenance.
Author Contributions
Funding
Institutional Review Board Statement
Informed Consent Statement
Data Availability Statement
Acknowledgments
Conflicts of Interest
References
- Zhang, Y.; Zhou, Q.; Zhao, L.; Ma, Y.; Lv, Q.; Gao, P. Dynamic reactive power configuration of high penetration renewable energy grid based on transient stability probability assessment. In Proceedings of the 4th Conference on Energy Internet and Energy System Integration (EI2), Wuhan, China, 30 October–1 November 2020; pp. 3801–3805. [Google Scholar]
- Lamnadi, M.; Trihi, M.; Boulezhar, A. Study of a hybrid renewable energy system for a rural school in Tagzirt, Morocco. In Proceedings of the 2016 International Renewable and Sustainable Energy Conference (IRSEC 2016), Marrakech, Morocco, 14–17 November 2016. [Google Scholar]
- Harrouz, A.; Belatrachem, D.; Boulal, K.; Colak, I.; Kayisli, K. Social acceptance of renewable energy dedicated to electric production. In Proceedings of the 2020 9th International Conference on Renewable Energy Research and Application (ICRERA), Glasgow, UK, 27–30 September 2020; pp. 283–288. [Google Scholar]
- Guzhov, S.; Krolin, A. Use of big data technologies for the implementation of energy-saving measures and renewable energy sources in buildings. In Proceedings of the 2018 Renewable Energies, Power Systems & Green Inclusive Economy (REPS-GIE), Casablanca, Morocco, 23–24 April 2019; pp. 1–5. [Google Scholar]
- Schellekens, H.; Devismes, M.F.; Nicolle, C. Vacuum interrupters: Design optimisation requires reliable experimental data. In Proceedings of the 2011 1st International Conference on Electric Power Equipment-Switching Technology, Xi’an, China, 23–27 October 2011; pp. 56–59. [Google Scholar]
- Yokomichi, S.; Kozako, M.; Hikita, M.; Sato, K.; Moriyama, T.; Urai, H.; Nakaoka, T.; Tsuchiya, K. Development of Diagnostic Methods for Vacuum Leakage from Vacuum Interrupter by Partial Discharge Detection. In Proceedings of the 2016 27th International Symposium on Discharges and Electrical Insulation in Vacuum (ISDEIV), Suzhou, China, 18–23 September 2016; Volume 2, pp. 1–4. [Google Scholar]
- Mei, Y.; Yuan, H.; Wang, X.; Sha, K.; Wang, P.; Guo, J.; Xu, W.; Rong, M.; Wang, W. Study on the change tendency of electro-magnetic signal under different vacuum degree for 10 kV vacuum chamber. In Proceedings of the TENCON 2015—2015 IEEE Region 10 Conference, Macao, China, 1–4 November 2015; pp. 1–6. [Google Scholar]
- Duan, X.; Li, F.; Dong, E.; Liao, M.; Guo, Y.; Zou, J. Study on inner vacuum pressure measurement system of vacuum circuit breakers. In Proceedings of the 2017 4th International Conference on Electric Power Equipment-Switching Technology (ICEPE-ST), Xi’an, China, 22–25 October 2017; pp. 880–884. [Google Scholar]
- Nakano, Y.; Kozako, M.; Hikita, M.; Tanaka, T.; Kobayashi, M. Estimation of Internal Pressure of Vacuum Interrupter by Measuring Partial Discharge Current. In Proceedings of the 28th International Symposium on Discharges and Electrical Insulation in Vacuum (ISDEIV), Greifswald, Germany, 23–28 September 2018; pp. 611–614. [Google Scholar]
- Abe, J.; Tanabe, T.; Yano, T.; Yoshida, S.; Inoue, N. The Electric Discharge Detection Method in the Low Vacuum Region of Vacuum Interrupter. Electron. Commun. Jpn. 2016, 100, 59–66. [Google Scholar] [CrossRef] [Green Version]
- Deng, X.; Li, W.; Liu, B. Discharge Properties and Diagnosis of Gas Pressure in Vacuum Interrupter. In Proceedings of the 2011 IEEE Power Engineering and Automation Conference, Wuhan, China, 8–9 September 2011; pp. 314–317. [Google Scholar]
- Saito, H.; Matsui, Y.; Sakaki, M. Discharge Properties in Low Vacuum and Vacuum Monitoring Method for Vacuum Circuit Breakers. In Proceedings of the 2006 International Symposium on Discharges and Electrical Insulation in Vacuum (ISDEIV’06), Matsue, Japan, 25–29 September 2006; pp. 181–184. [Google Scholar]
- Kamarol, M.; Ohtsuka, S.; Hikita, M.; Saitou, H.; Sakaki, M. Determination of gas pressure in vacuum interrupter based on partial discharge. IEEE Trans. Dielectr. Electr. Insul. 2007, 14, 593–599. [Google Scholar] [CrossRef]
- Zhang, K.; Kuo, L.; Sun, Y. Study on the Relationship between Partial Discharge and Vacuum Degree in Arc Extinguish Chamber. Mod. Electr. Power 2012, 4, 46–50. [Google Scholar]
- Wang, C.; Shu, N. Research on Acoustic Monitor of Vacuum of Vacuum Breakers. J. Univ. Hydraul. Electr. Eng. Yichang 2003, 512–515. [Google Scholar]
- Youn, Y.W.; Hwang, D.H.; Sun, J.H.; Song, K.D.; Koh, H.; Kim, Y. Development of measuring and analysis method for monitoring the vacuum degree in VI. KIEE 2013, 2013, 1370–1371. [Google Scholar]
- Zhang, X.; Liu, X.; Fan, X.; Huang, Z.; Fan, J.; Liang, C.; Shi, W. A high accurate sensor research and its application for VCB’s internal pressure on-line condition monitor. In Proceedings of the 25th International Symposium on Discharges and Electrical Insulation in Vacuum (ISDEIV), Tomsk, Russia, 2–7 September 2012. [Google Scholar]
- Nakano, Y.; Kozako, M.; Hikita, M.; Tanaka, T.; Kobayashi, M. Estimation method of degraded vacuum in vacuum interrupter based on partial discharge measurement. IEEE Tran. Dielectr. Electr. Insul. 2019, 26, 1520–1526. [Google Scholar] [CrossRef]
- Seunghee, O.; Eliana, B.; Ratri, D.; Park, Y.; Kang, H. A study on the creepage e discharge characteristics to design a stop joint box for a superconducting cable. KIEE 2021, 35, 42–47. [Google Scholar]
- Hong, J.; Heo, J.I.; Nam, S.; Kang, H. Study on the Dielectric characteristics of gaseous, liquid, and solid insulation materials for a high voltage superconducting apparatus. IEEE Trans. Appl. Supercond. 2013, 23, 7700604. [Google Scholar] [CrossRef]
- Bang, S.; Kim, H.S.; Koo, J.H.; Lee, B.W. Consideration of the insulation design method on a ± 200 kV converter valve unit in an HVDC converter hall. Energies 2021, 14, 2296. [Google Scholar] [CrossRef]


| Vacuum Degree | 10−6 | 10−5 | 10−4 | 10−3 | 10−2 | Total |
|---|---|---|---|---|---|---|
| Holding time (m) | 5 | 35 | 35 | 35 | 35 | 145 |
| No. | First | Second | Third | Fourth | Fifth | |
|---|---|---|---|---|---|---|
| Measures | ||||||
| Peak value (pC) | 7000 | 7000 | 3500 | 10,000 | 4944 | |
| Minimum value (pC) | 136 | 1000 | 250 | 605 | 1600 | |
| Induced voltage (V) | 30~35 | |||||
| Materials | Relative Permittivity |
|---|---|
| Vacuum | 1 |
| Contact, floating shield, and connection part (conductor) | 1 |
| Epoxy resin | 3.5 |
| Chamber (ceramic) | 9.8 |
| Coupling capacitor (ceramic) | 9.9 |
| Cover of VI and coupling capacitor (silicone) | 12 |
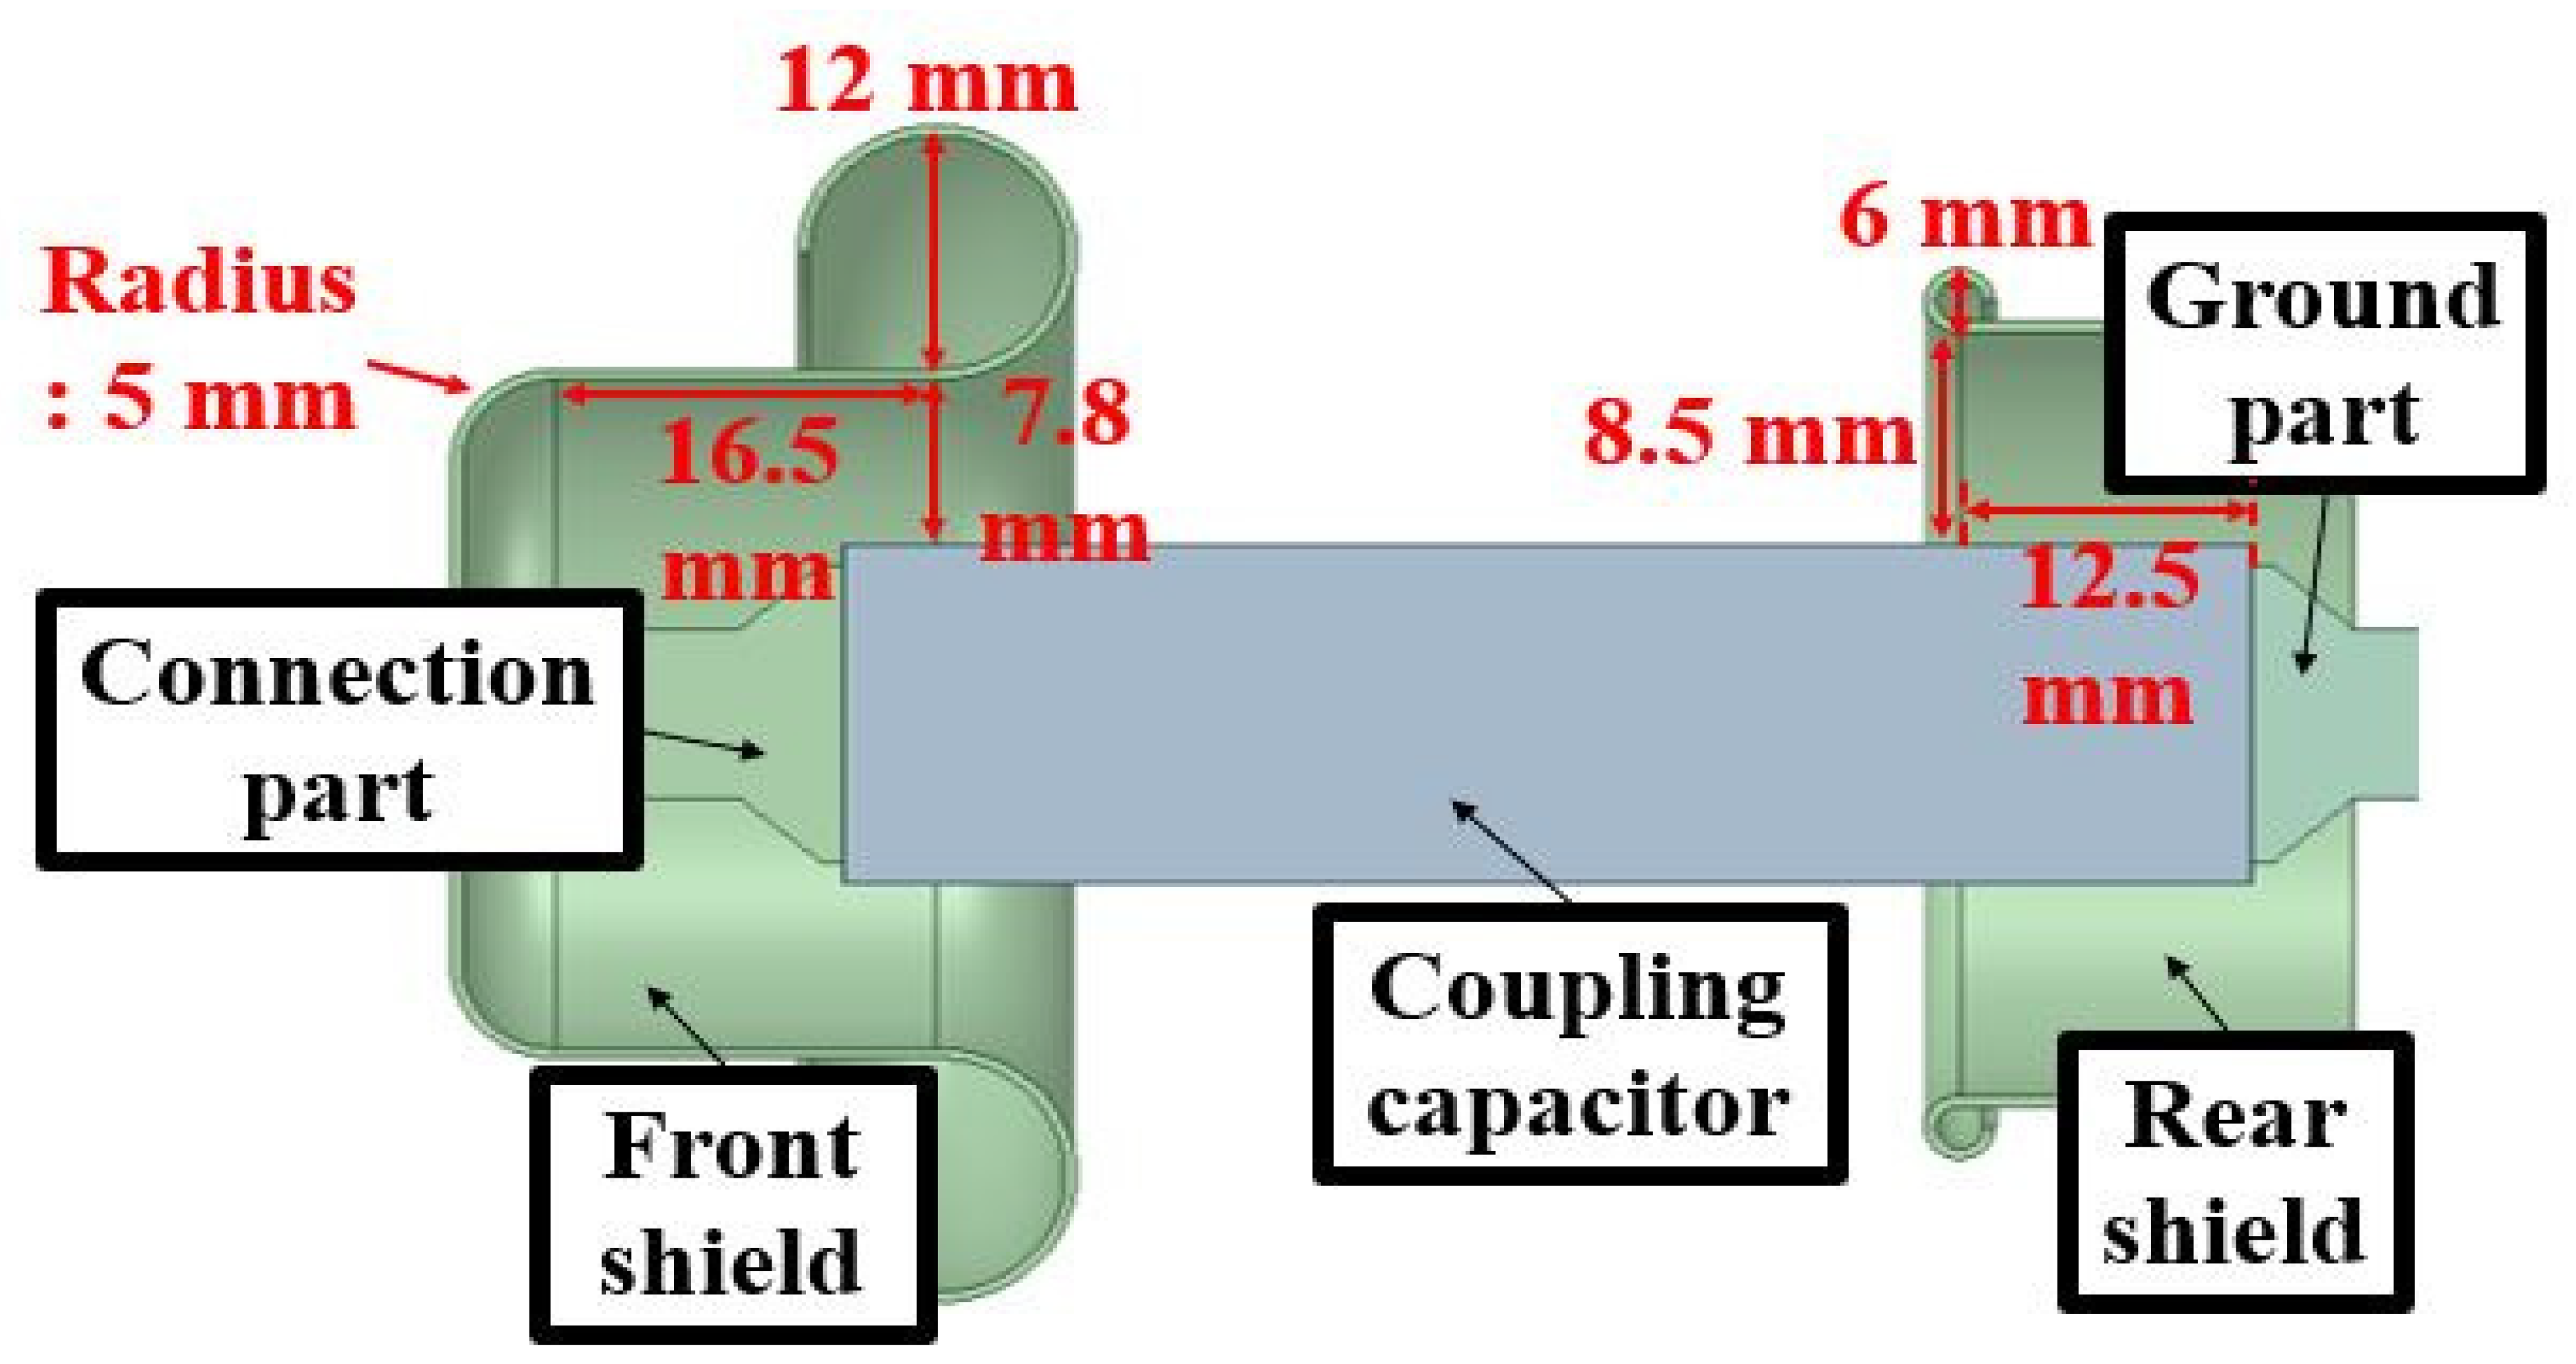
| A | B | C | D | E | F |
|---|---|---|---|---|---|
| 7.8 mm | 16.5 mm | 5 mm | 6 mm | 12.5 mm | 6 mm |
| Component | Front Shield | Rear Shield | Interface | |
|---|---|---|---|---|
| Measures | ||||
| (kV/mm) | 2.1 | 2.2 | ||
| (kV/mm) | 2.01 | 2.09 | 1.12 | |
| 1.04 | 1.00 | 2.50 | ||
Publisher’s Note: MDPI stays neutral with regard to jurisdictional claims in published maps and institutional affiliations. |
© 2021 by the authors. Licensee MDPI, Basel, Switzerland. This article is an open access article distributed under the terms and conditions of the Creative Commons Attribution (CC BY) license (https://creativecommons.org/licenses/by/4.0/).
Share and Cite
Bang, S.; Lee, H.-W.; Lee, B.-W. Real-Time Monitoring of the Vacuum Degree Based on the Partial Discharge and an Insulation Supplement Design for a Distribution Class Vacuum Interrupter. Energies 2021, 14, 7891. https://doi.org/10.3390/en14237891
Bang S, Lee H-W, Lee B-W. Real-Time Monitoring of the Vacuum Degree Based on the Partial Discharge and an Insulation Supplement Design for a Distribution Class Vacuum Interrupter. Energies. 2021; 14(23):7891. https://doi.org/10.3390/en14237891
Chicago/Turabian StyleBang, Seungmin, Hyun-Woo Lee, and Bang-Wook Lee. 2021. "Real-Time Monitoring of the Vacuum Degree Based on the Partial Discharge and an Insulation Supplement Design for a Distribution Class Vacuum Interrupter" Energies 14, no. 23: 7891. https://doi.org/10.3390/en14237891