Article

Numerical Investigation of Transient Flow Characteristics in a Centrifugal Compressor Stage with Variable Inlet Guide Vanes at Low Mass Flow Rates

1
School of Energy and Power Engineering, Dalian University of Technology, Dalian 116024, China
2
School of Mechanical Engineering, Dalian University of Technology, Dalian 116024, China
*
Author to whom correspondence should be addressed.
Energies 2021, 14(23), 7906; https://doi.org/10.3390/en14237906
Submission received: 30 September 2021 / Revised: 13 November 2021 / Accepted: 23 November 2021 / Published: 25 November 2021

Abstract

:
This study numerically investigates the beneficial effects of positive pre-swirl on the aerodynamic performance and internal flow field in a centrifugal compressor stage with variable inlet guide vanes (VIGVs) at low mass flow rates. Four positions of VIGV are considered, including 0°, 30°, 45°, and 60° angle. The latter three positions of VIGV induce positive pre-swirl. Numerical results show that as positive pre-swirl increases, the aerodynamic performance curve of the stage moves in the low mass flow rate direction. In the three cases of positive pre-swirl, there was an improvement of approximately 9.95% of stall/surge margin greater than in conditions with no pre-swirl. The regulation of IGV can effectively improve the unstable flow of the compressor stage at low mass flow rates. A low frequency that has a great influence on the internal flow of the compressor stage is found, and the unstable flow caused by low frequency is analyzed by the combination of streamline distribution, spectrum analysis, vector, entropy increase, and modal decomposition method. Meanwhile, the modal decomposition method and flow field reconstruction techniques are used to investigate the coherent flow structures caused by low frequency under different guide vane openings.

1. Introduction

The mass flow rate of centrifugal compressors needs to be regularly adjusted in actual operation to adapt to operational requirements and density change caused by temperature changes. Variable inlet guide vanes (VIGVs) are an effective way to meet this demand [1]. VIGVs can change the impeller inflow pre-swirl for a variable mass flow rate at a constant rotational speed. When the inflow direction alters, the velocity triangle at the inlet of the impeller also changes. According to the Euler work calculation formula, the aerodynamic performance of a compressor is determined by the flow state at the impeller inlet and changes of input work. When the inflow at the impeller inlet changes from negative pre-swirl to positive pre-swirl, the incidence angle of the impeller blade increases, and the operation curve of the compressor moves in the low mass flow rate direction, which further changes the aerodynamic performance and operating range of the compressor [2,3].
Numerous experimental and numerical studies have been conducted to reveal the influence of IGVs on the aerodynamic performance and internal flow of centrifugal compressors. Experimental measurement of a centrifugal compressor with the VIGVs was accomplished by Rodgers [4]. Their results showed that the surge margin was widened by regulating the IGVs, even though the vaned diffuser was stalled. The work of Coppinger et al. [5] showed that variable inlet guide vanes could effectively improve the stable operating range of an industrial centrifugal compressor. Mohseni et al. [6] also carried out experimental and numerical studies on a centrifugal compressor with three different types of IGVs. Their results showed that the compressor with tandem and S-cambered guide vanes had better aerodynamic performance and a wider operating range than symmetrical guide vanes. Meanwhile, the tandem guide vane was superior to the S-cambered guide vane under negative pre-swirl conditions, but the S-cambered guide vane had the best performance under positive pre-swirl conditions. The interaction between IGV-impeller and the wake effect of IGV was investigated by Zhou et al. [7]. They observed that there was periodic unsteady flow in the impeller under negative pre-swirl conditions. Experimental investigations of Biela et al. [8] of a 1.5 stage compressor showed that the IGV wake strength affected compressor stability and that the IGV opening influenced the tip leakage vortex structures. Xu et al. [9] numerically studied a two-stage centrifugal compressor with a VIGV. The results showed that the evolution of jet and wake downstream of the VIGV was related to the VIGV solidity. Other experimental and numerical studies in the literature [10,11] pointed out that the compressor stage efficiency was decreased due to positive pre-swirl, but it was within the acceptance range.
At present, the most challenging problems are off-design conditions, especially at low mass flow rate conditions, which causes flow instability in partial components of a compressor and induces considerable fluctuating stress, leading to periodic fatigue of the impeller blades [12,13,14]. To investigate the mechanism of the unstable flow, a significant number of numerical and experimental studies have been conducted [15,16,17]. However, the spatial distribution characteristics and the degree of flow instability temporal variation cannot be well identified by conventional unsteady flow field analyses such as vector, contour plots, and vortex identification methods. Moreover, turbulence is a random and complex flow phenomenon with a high degree of freedom, limiting in-depth flow field analysis by traditional methods [18,19].
Consequently, an analyzing technique is needed to identify turbulent, specific, and coherent flow structures in compressors to separate them from the rest of the chaotic and irregular flow structures in the turbulent flow field. The feature extraction methods of coherent flow structure have been proposed in the literature. One of the widely used fluid machinery approaches [20,21] is the proper orthogonal decomposition (POD) method, which can help visualize large-scale high-energy flow structures in the flow field. Sharma et al. [22] applied the POD technique to investigate the localization of the energetic noise sources in an impeller. Rochuon et al. [23] used the POD method to study the velocity field in the rotor-stator inter-row region of a centrifugal compressor. The results show that the rotor-stator interaction and the rotor wake are of the same magnitude in terms of energetic contribution. Zhang et al. [24] optimized a centrifugal compressor based on the POD method. The normalized isentropic efficiency increased by 3.7% and 3.0% in the maximum speed and cruise state, respectively, and the processing costs were reduced by about 30% after optimization. Ji et al. [25] extracted the flow field from the impeller by the POD method to construct a prediction model, in which the prediction error is reduced by 29.7% compared with the single hidden layer artificial neural network. However, the POD method cannot identify the flow phenomenon corresponding to specific frequencies. In contrast, the dynamic modal decomposition (DMD) method can recognize non-orthogonal global flow structures at particular frequencies. These single-frequency flow patterns help to understand the flow mechanism and supplement the POD method [18]. Sundström et al. [26] carried out a Large Eddy Simulation (LES) for a centrifugal compressor. They applied the DMD method to study the coherent flow structure in the compressor under near-surge conditions. Li et al. [27] have analyzed the flow dynamic characteristics of a centrifugal compressor by the DMD method. They found that the tip leakage flow, secondary flow, and wake vortex are related to the rotor frequency of the impeller. Moreover, the flow in a diffuser is more stable than in an impeller at near stall conditions. Hu et al. [28] applied the DMD approach to investigate a centrifugal compressor with volute. The results show that the compressed DMD approach can save 88.4% of the calculation time, and it is found that the origin of the diffuser stall lies at the hub surface with a fixed circumferential position near the diffuser outlet. To visually show the influence of impeller clearance vortex and separation vortex on the internal flow of vaned diffuser, the flow mechanism in the compressor was studied by the POD and DMD method [29]. Previous studies have successfully placed and characterized the coherent flow structures in the compressor stage under the stall condition by using the POD and DMD method [30]. Therefore, the POD and DMD methods investigate the flow within the centrifugal compressor at low mass flow rates.
Due to the high cost of unsteady simulations, it is impossible to calculate each operating point. However, to reveal the internal flow mechanism of the compressor, it is necessary to adopt the unsteady simulation approaches. Especially, for the unstable flow that affects the entire flow of the compressor, it is essential to employ accurate unsteady simulations. Although many works on IGV have been carried out worldwide, the flow mechanism of the IGV regulation in the compressor has still not yet been clarified at low mass flow rates, and especially the coherent flow patterns caused by low frequencies in the compressor stage have not been evaluated. Understanding the flow patterns would be helpful to improve methods and means for delaying flow separation, and broaden the range of stable operating conditions of the compressor. Therefore, this paper utilizes a combination of traditional methods and modal decomposition methods to describe the flow patterns caused by low frequency in a centrifugal compressor stage at low mass flow rates.

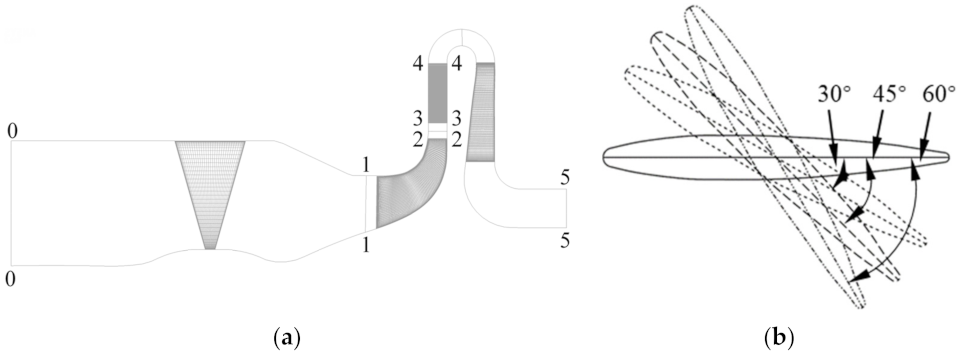
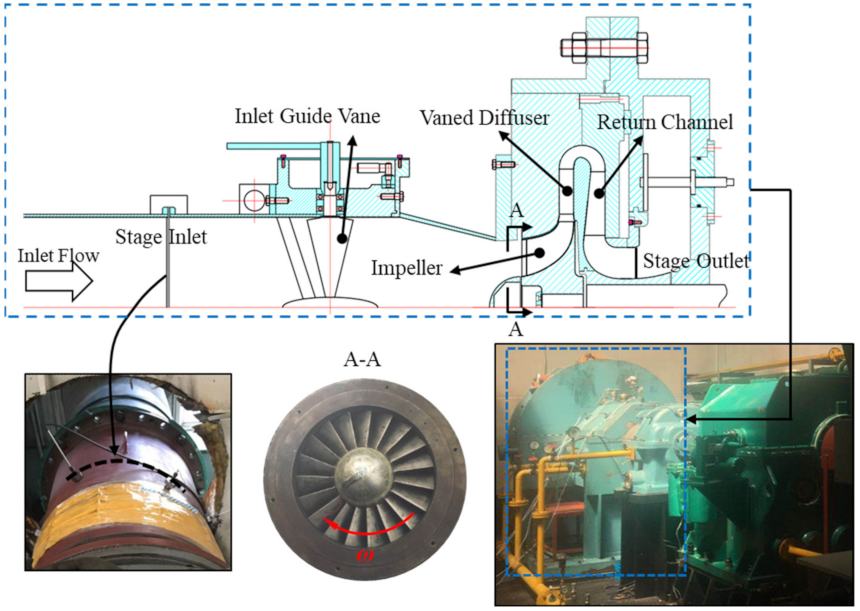
2. Centrifugal Compressor Stage Geometry Investigated

The meridional flow path of the compressor stage investigated in the paper is shown in Figure 1a. The compressor stage includes VIGVs, an unshrouded impeller, a vaned diffuser, and a return channel. The VIGVs system has 11 symmetrically straight blades. The impeller is backswept and includes 19 blades, and the impeller inlet and exit blade angles are 35° and 67.5°, respectively. The diffuser consists of 20 equal-width airfoil vanes, and the inlet and exit vane angles are 26.5° and 33.5°, respectively. Primary geometric parameters of the centrifugal compressor stage are shown in Table 1 [31].
The IGVs can be adjusted freely to provide a governable pre-swirl and thus regulate mass flow rates. At the design condition, the opening of IGV is 0° (the centerline of the vane profile is parallel to the axial inflow, see Figure 1b) which corresponds to the full opening. Three stagger angles of IGV 30°, IGV 45°, and IGV 60°, as shown in Figure 1b, are also considered to provide a positive pre-swirl at the inlet of the impeller, which represents a small pre-swirl, medium pre-swirl, and a sizeable pre-swirl condition, respectively.

3. Numerical Method

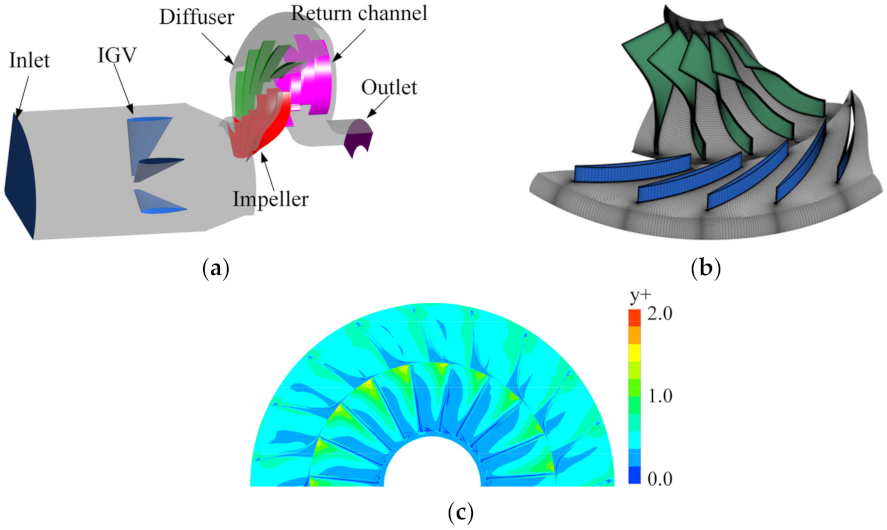
3.1. Numerical Model and Grid

The 3D numerical model for the compressor stage is shown in Figure 2. The same method was adopted in this study as references [32,33,34], considering the efficiency and reliability of simulations. Namely, the multi-passage numerical model, which includes three guide vanes, five impeller blades, five diffuser vanes, and five return channel passages to achieve the rotor-stator pitch ratio being close to one (IGV-impeller pitch ratio is 0.965 and impeller diffuser pitch ratio is 0.95 in this paper), as shown in Figure 2a.
All computational domains meshed with the structured grid generated by the NUMECA code Autogrid V5. The grid corresponding to the multi-passages model of the impeller and diffuser is shown in Figure 2b. The number of grid points in each direction of different blocks is adjusted to improve the grid quality. High precision and meticulous care were exerted to preserve the boundary layer effect by adjusting the first layer grid height close to the solid surfaces to ensure enough resolution near the solid walls and blade/vane boundary layers. Therefore, as shown in Figure 2c, the value of y plus is less than 2 (the minimum grid spacing near walls was 2 × 10⁻⁶ m). Compared with IGV0, grids for IGV30, IGV45, and IGV60 are different only at the IGV, and the rest of the compressor components adopt the same grid.
To ensure the accuracy of the numerical results, a grid independence study was conducted using different grid resolutions to compare with the experimental data. The grid resolutions include coarse (68,260,000 nodes), medium (135,200,000 nodes), and fine (300,200,000 nodes) for IGV0 case (at the design operation point) to study the influence of the number of grids. The total pressure ratio and total-total efficiency of the compressor stage are compared with the experimental data, as shown in Table 2. The results show that the medium grid is in good agreement with the experimental data, and there is no significant difference with the increase in the number of grids. The numerical uncertainty estimation was conducted using the Grid Convergence Index Method (GCI) [35]. Therefore, the medium grid is used in subsequent simulations considering the simulation accuracy and computing time.

3.2. Numerical Scheme

Numerical simulations were conducted by the CFD solver ANSYS CFX 17.0. The perfect gas, air, was applied for the working medium. The turbulence model of shear stress transport (SST) was used to close governing equations. Solid walls were treated as adiabatic and non-slip conditions. Considering the consistency with the experimental measurement, the stage inlet was specified as total pressure (98,000 Pa) and total temperature (267 K). The mass flow rate was set at the stage exit.
Due to the difference in the pitch ratio between the IGV-impeller and impeller-diffuser passages in the multi-passages, the stage model [36] is adopted for the interfaces in the steady calculations. In unsteady calculations, the transient rotor-stator model was utilized to the rotor-stator interfaces considering all transient flow characteristics.
Considering the solution accuracy and computational efficiency, the time step of 1° (Δt = 2.976722 × 10⁻⁵ s) was selected (the maximum value of the Courant number in the simulations is 4.05). A loop of each time step was set to 20 inner iterations to ensure numerical convergence and precision. Moreover, to obtain precise and stable calculation data, once the monitoring parameters during the transient simulations become regular, 10 rotating cycles of the impeller were further made to make the analysis. Numerical calculations were conducted using a high-performance workstation with 64 cores (2.8 GHz), and each unsteady simulation took about 2500 CPU hours.

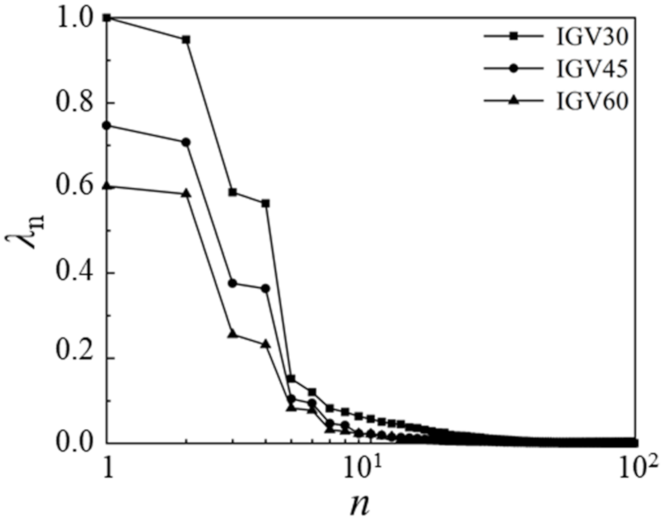
3.3. Modal Decomposition Method

To determine the flow patterns caused by low frequency in the compressor stage, the POD method and DMD method are used to recognize coherent flow structures from unsteady computational data to investigate unsteady behaviors in the centrifugal compressor stage. The goal of the POD method is to describe the high-dimensional dynamic process in a low-dimensional approximation and thus effectively reduce the amount of data stored in relevant dynamic information. The application of the snapshot-POD method [37] significantly simplifies the calculation in dealing with the complex flow and promotes the study of the coherent structure of turbulence. The fundamental principle can be found in the studies of Hutchinson [38] and Sirovich et al. [39]. The snapshot-POD method provides a more effective way to describe the dynamic physical process, which can be characterized accurately through a sequence of expressions that are optimal in the mean square sense and are only space-related functions and time-related functions. Therefore, only the first few items in the expression can accurately describe the whole dynamic process. The spectrum analysis of the eigenvector (only time-related) can be used to identify the frequencies of each POD mode that provide the spatial distribution in the flow field. The results show that this spatial-temporal information can be used to determine the dynamic behavior of different flow structures in a complex unsteady flow environment [40]. The disadvantage of the POD method is that it cannot recognize the patterns at particular frequencies. However, the DMD method provides a pattern related to individual frequencies and complements the POD analysis. The algorithm procedures can be found in the studies of Schmid [41].

4. Numerical Results and Analysis

This section includes the following parts: firstly, the steady and unsteady simulation results are presented, as well as the numerical method validation, the comparison of performance, and the effect of guide vane openings on the internal flow of the compressor stage at low mass flow rates. Finally, to investigate the unstable flow mechanism of the stage, the POD method and DMD method are used to recognize the coherent flow structures at low mass flow rates.

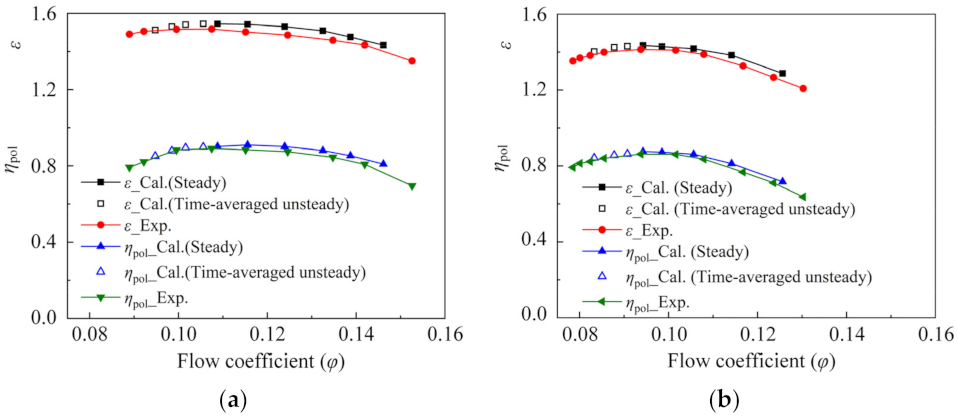
4.1. Validation of the Numerical Methods

The experiments were performed in the Shenyang Blower Works Group Corporation. The structure of the experimental platform is represented in Figure 3. Experimental apparatuses and accuracy, data acquisition, and other measurement details can be found in the previous work of our research group [31,42].
The accuracy of the numerical method is verified by comparing the stage aerodynamic performance curves obtained by the steady and time-averaged unsteady numerical calculation with the experimental measurement data. The comparison between the numerical results and the experimental data for the IGV0 and IGV60 cases is shown in Figure 4. The abscissa is the flow coefficient (φ) defined by Equation (1), and the ordinate is the total pressure ratio ε05 and polytropic efficiency η05, respectively. The ε05 and η05 are given in Equation (2).
φ = Q m 1 4 π D 2 2 ρ U 2 ,
ε 05 = P t 5 P t 0 η 05 = κ 1 κ ln P t 5 P t 0 ln T t 5 T t 0 ,
where Qm is the mass flow rate and the isentropic exponent κ equals to 1.4.
To further verify the accuracy of the numerical method, the spectrum analysis of the static pressure fluctuation at the inlet of the diffuser is shown in Figure 5. This figure compares the transient results and measurement data of IGV45 at low mass flow rate condition (φ = 0.0833). As is shown in the figure, although the predicted amplitude is higher than the experimental data, the expected low frequency, blade passing frequency (BPF), and double blade passing frequency (2BPF) are in good agreement with the experimentally measured value.
It can be seen from Figure 4 and Figure 5 that the URANS and SST turbulence model with high-precision grid resolution can better simulate the complicated flow within the compressor stage.

4.2. Effects of Positive Pre-Swirls on Aerodynamic Performance of the Stage

The performance curves of the stage under four IGV openings and different operating conditions are shown in Figure 6. As pointed out before, IGV30, IGV45, and IGV60 produce positive pre-swirl of 30, 45, and 60 degrees, respectively. It should be mentioned that the calculation for the IGV0 case did not converge below φ = 0.0943, while the compressor stage can operate normally below φ = 0.0943 in other instances (IGV30, IGV45, and IGV60). The results show that the IGVs’ positive pre-swirl regulation can enlarge the operation region of the low flow coefficient and shift the operating condition in the direction of the low mass flow coefficient for the compressor stage. For the IGV30, if the mass flow rate continues to decrease, there will be non-convergence. Compared with the IGV0 case, the IGV30, IGV45, and IGV60 improve by approximately 9.95% of stall/surge margin.

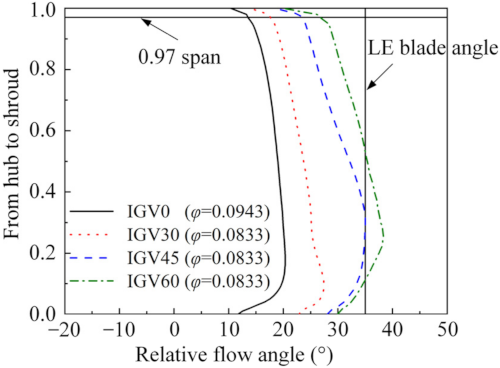
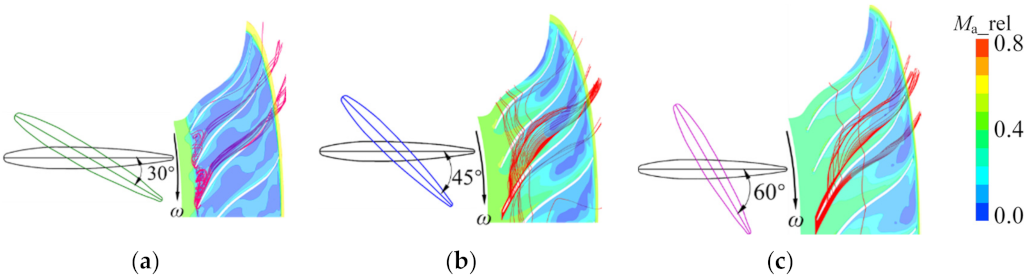
4.3. Effects of Guide Vane Opening on the Internal Flow of the Impeller

The span-wise distribution of relative flow angles at the impeller inlet (5 mm from the leading-edge of the impeller) for four configurations of IGVs is shown in Figure 7. The flow coefficient for IGV0 in the figure is 0.0943 (this is the minimum flow coefficient when calculating IGV0), while that for IGV30, IGV45, and IGV60 is 0.0833 (the minimum flow coefficient of the performance curve in Figure 6). It is observed that the global relative flow angle at the impeller inlet is increased with the increase of IGV openings. It should be noted that the relative flow angle of IGV0 is significantly lower than that of the other three configurations, although the IGV0 has a larger flow coefficient. This phenomenon also indicates that the adjustment of the IGV positive pre-swirl changes the flow situation at the impeller inlet and widens the operating range of the compressor stage at low mass flow conditions. The incidence angle of the impeller inlet (the difference between the blade angle and the relative flow angle) under the four IGV configurations at 97% span is approximately 21.45°, 17.37°, 11.7°, and 8.2°, respectively. A large incidence angle will cause the flow of the impeller inlet to be more tangential, resulting in the flow at the impeller inlet being complicated.
The relative Mach number and streamline distributions at 97% span of the impeller at φ = 0.0833 are compared in Figure 8. For the IGV30, due to the small relative flow angle of the impeller inlet (see Figure 7), the flow at the impeller inlet is almost tangential. The interaction between the incoming flow and the tip clearance flow strengthens the flow separation on the suction surface of the impeller, making the tip clearance flow overflow at the impeller inlet. Furthermore, the overflow phenomenon influences the relative flow angle of the impeller inlet. As the fluid flows downstream, the flow separation formed at the suction surface of the blade extends to the impeller outlet. With the increase of the opening of the guide vane, there is no overflow phenomenon at the impeller inlet due to the low positive incidence angle for IGV45 and IGV60 cases. However, the interaction between the tip clearance flow in the middle part of the suction surface and the low-velocity mainstream forms an apparent low momentum region in the rear region of the impeller passage. The results show that the increase of IGV opening reduces the area of suction surface flow separation and delays the formation of the tip clearance leakage flow in the impeller passage. Moreover, the overflow phenomenon will appear at the impeller’s leading-edge when the impeller inlet’s incident angle is greater than 11.7°.
To further investigate the flow at the impeller inlet when the guide openings were deflected from 30° to 60°, the fast Fourier transform (FFT) method was utilized to perform spectrum analysis of the monitoring point at the impeller inlet. The location of the monitoring point (97% span), and the spectrum analysis results are shown in Figure 9. For the IGV30 case (Figure 9b), larger amplitudes of pressure fluctuations appear at 23.394 Hz, 11 IPF, and 20 IPF (11 and 20 are the number of IGV and vaned diffuser, see Table 1), (IPF = n/60 = 93.33 Hz is machine shaft frequency). The maximum fluctuation amplitude appears at 23.394 Hz, indicating that the unstable flow at the leading-edge of the impeller was related to this frequency at φ = 0.0833. It is worth noting that under this mass flow rate condition (φ = 0.0833), the seriously unstable flow phenomenon corresponding to the low frequency in the IGV30 impeller does not occur in the IGV45 and IGV60 impeller. As can be seen from Figure 10b, in IGV45 and IGV60 the unstable flow at the impeller inlet was mainly affected by the guide vane wake effect and the impeller-diffuser interaction.
Figure 10 shows the instantaneous relative velocity vector distributions and entropy contours at impeller 97% span for IGV30. The relative velocity vector in Figure 10a shows that the incoming flow enters the passages on the left side of blade 1 along the tangential direction, which increases the flow incidence angle. Due to the nonuniformity of the incoming flow entering the blade passages, the flow separation region appears in the passages between impeller blades 1–2 and blades 2–3, and thus the effective flow area decreases. Meanwhile, in the flow passages between blades 3 and 4, the incidence angle of flow decreases. This reduction improves the flow situation in this passage and then moves the separation region in the passage to the opposite direction of the impeller rotation.
Entropy increase can be used to characterize the flow at the impeller inlet. The overflow is formed by the tip leakage flow and the incoming flow mixing at the impeller inlet, forming a higher entropy gradient. Therefore, the flow separation at the impeller inlet has a great influence on the internal flow of the impeller, so that the incoming flow cannot flow into the impeller passages and result in a large flow loss.
To further explore the phenomenon of unstable flow in the IGV30 impeller, the static entropy contours extracted at the 97% span for three different moments are shown in Figure 11. At the instant t1 = 0.11135 s, a high entropy increase zone appears at the leading-edge of blades 3 and 4. After some time, at t2 = 0.11338 s, the high entropy region moves to the front of the leading-edge of blades 2 and 3. At t3 = 0.11734 s, the high entropy region shifts into the adjacent passage between blades 1 and 2. The evolution of this phenomenon can also be obtained from the spectral analysis of the monitoring points in Figure 9b. The unstable flow in the impeller for IGV30 spreads in the impeller’s leading-edge against the impeller’s rotation direction, and its speed is about 25.07% of the impeller rotation speed.
Based on the above analysis, the unstable flow caused by the low frequency significantly influences the flow near the shroud of the impeller for the IGV30 case. The DMD method is used in the pressure field to extract the specific flow patterns corresponding to low frequency and investigate the large-scale coherent structures inside the impeller. In the unsteady simulation, a total ensemble of 2160 (during six revolutions) instantaneous static pressure field data are extracted for the DMD analysis. The pressure field for DMD mode of the low frequency at 97% span is shown in Figure 12. As can be seen from Figure 12, the large-scale vortex structures caused by the low frequency propagate in the impeller passages, and block part of the impeller passages so that the fluid cannot flow normally from the passages to the downstream. These vortex structures will propagate in the impeller passages and form large-scale flow separation, which may be one of the main reasons why the compressor stage cannot operate normally below φ = 0.0833 in the IGV30 case.

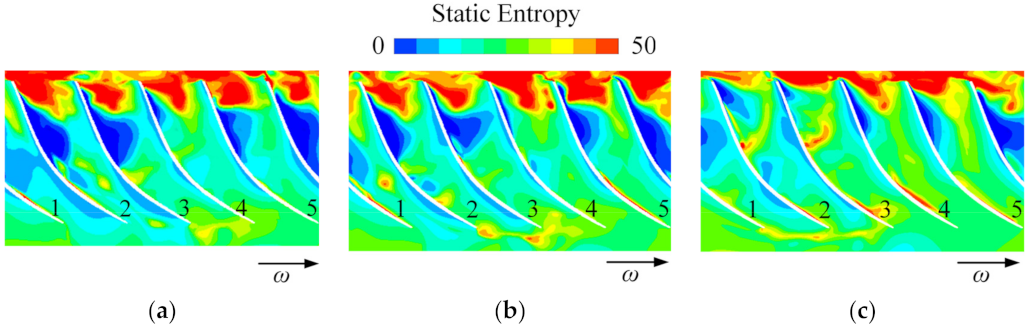
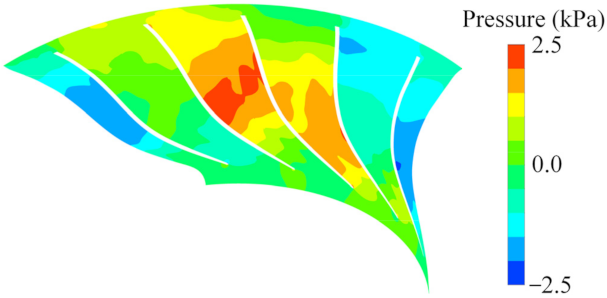
4.4. Effects of Guide Vane Openings on the Flow Field of the Vaned Diffuser

Static pressure signals are recorded by three numerical probes positioned at the 97% span of a vaned diffuser passage to explore the effect of IGV opening on the unsteady flow characteristics in the vaned diffuser, as shown in Figure 13a. The M1, M2, and M3 monitoring points are located at the middle of two vane leading-edges, flow passage, and trailing-edge, respectively. The FFT method carries out the spectral analysis of M1 to M3 in the vaned diffuser, and the results are shown in Figure 13b–d. The results show that there are three isolated discrete frequencies at 23.394 Hz, blade passing frequency (BPF) and 2BPF. However, there are some differences in the amplitude of discrete frequencies between the two different IGV openings.
As can be seen in Figure 13b–d, the unstable flow in the diffuser is mainly caused by the low frequency (23.394 Hz) and impeller-diffuser interaction, with three kinds of the IGV’s opening at φ = 0.0833. The amplitude of the low frequency (23.394 Hz) increases slightly from the diffuser inlet to the outlet under the three guide vane openings, which indicates that the unstable flow caused by the low frequency moves downstream along the diffuser passages, and interaction with other secondary flow makes the unstable flow strengthen slightly. For the IGV30 case, the unstable flow in the diffuser is dominated by the low frequency (23.394 Hz). With the increase of the guide vane openings (for the IGV45 and IGV60), the unstable flow at the diffuser inlet is dominated by the impeller-diffuser interaction and the low frequency (23.394 Hz) dominates the unstable flow in the diffuser as the fluid flows downstream. It is worth noting that with the increase of the guide vane opening, the pressure fluctuation caused by the unstable flow in the diffuser passages gradually decreases, which indicates that increasing positive pre-swirl can effectively weaken the strength of the unstable flow in the diffuser.
Two flow decomposition methods (POD and DMD method) are utilized to analyze the unsteady flow data under three diffuser openings to distinguish and characterize the coherent flow patterns of the unstable flow in the diffuser passages. The POD method helps to fully understand the influence of IGV openings on the flow field inside the compressor at low mass flow rates. The DMD method identifies the flow pattern at a specific frequency to supplement the POD method.
The resolution of the spectra is essential when studying the unstable flow phenomenon. Therefore, the snapshot number used in this paper was 2160 instants of the transient pressure field with a time step of 8.90541 × 10⁻⁵ s. The cross-section studied was the diffuser 97% span to maintain the consistency of the investigation. Figure 14 displays the eigenvalues of the first 100 POD modes (normalized by the first POD eigenvalues of IGV30) under three guide vane openings, which represent the relative contribution of the POD mode to the flow field energy. With the increase of the POD mode, the eigenvalues of the first several POD eigenmodes dropped rapidly and then decreased slowly, which indicated that the first several POD modes could well represent the pressure fluctuation of the whole flow field. As shown in Figure 14, the pressure fluctuation energy in the flow field decreases with the guide vane opening, which was consistent with the spectrum analysis at the above monitoring point (see Figure 13). The curves of the three cases in Figure 14 show that the first four order POD modes have the highest pressure fluctuation energy, which is related to the vortex structures in the flow field. Hence, the first four order POD modes were chosen for analysis and flow field reconstruction. The corresponding time information of the coherent flow structures as shown in Figure 15 and the corresponding spatial distribution of the first four order POD modes as shown in Figure 16 were obtained.
Based on the spectrum analysis mentioned above (Figure 13) and spectrum analysis of the POD modes coefficients, the unstable flow phenomenon caused by the low frequency (23.394 Hz) appears in diffuser passages for three configurations. From the detailed view for the corresponding spectrum of the first two POD modes in IGV30 and IGV45 cases (Figure 15a,b), the low frequency dominates the flow of the 97% span of the diffuser. With the increase of the guide vane opening, the low frequency and the BPF jointly dominate the unstable flow in the diffuser. However, the BPF has higher energy under the IGV60 case (Figure 15c), which also reflects that a large-positive pre-swirl of the guide vane improves the flow at the diffuser inlet, and then effectively reduces the unstable flow effect caused by low frequency on the compressor stage.
From the spatial distribution of the first two POD modes for the IGV30 case in Figure 16a, the large-scale pressure fluctuations mainly appear in the throat and passages of the diffuser and then block the diffuser passages. Combined with the spectrum analysis in Figure 15a, the first two POD modes can be interpreted as unstable flow patterns caused by low frequency. Under the interaction of low frequency and BPF, it can be seen from the spatial distribution of the first two POD modes of the IGV45 and IGV60 (Figure 16b,c) that the main large-scale pressure fluctuation region appears at the diffuser inlet. The vortex structures originate from the suction surface at the diffuser vane inlet and extend to the leading-edge of the next vane, thereby blocking the diffuser passages. Compared with the IGV30 case, the region and strength of the large-scale flow structures are reduced for the IGV45 and IGV60 cases. With the increase of the POD modes, the large-scale flow structures corresponding to the third and fourth POD modes still show slight blockage in some diffuser passages under the action of the low frequency. In contrast, the large-scale pressure fluctuation mainly appears near the diffuser inlet under the act of BPF.
According to the above POD analysis, the unstable flow patterns caused by low frequency significantly influence the diffuser. The coherent flow structures for DMD mode of the low frequency at 97% span of the diffuser are shown in Figure 17. The coherent flow structures caused by the low frequency appear in diffuser passages as a positive and negative pressure fluctuation region, resulting in blockage of the diffuser passages, as well as the blockage degree decreasing with the increase of the guide vane openings. It is worth noting that, compared with the IGV30 and IGV45, the coherent flow structures caused by low frequency weaken and appear at the diffuser inlet of the IGV60. This phenomenon indicates that the vortex structures caused by the low frequency are mainly located at the inlet and throat of the diffuser, blocking the fluid normal flow into the diffuser passages, resulting in the flow inside the diffuser being more complex. Moreover, the change of the coherent structures within the diffuser from IGV30 to IGV60 also reflects the attenuation/release process of the unstable flow caused by low frequency.

5. Conclusions

Steady and unsteady numerical calculations have been applied to study the internal flow of a compressor stage with VIGVs. Conventional research methods and modal decomposition methods have been performed to study three IGV configurations producing positive pre-swirls, including IGV30, IGV45, and IGV60 at low mass flow rate conditions. The main conclusions are summarized as follows:
(1)
With increasing positive pre-swirl, the minimum mass flow rate at which the compressor can operate becomes smaller. Therefore, a stall margin gets larger when coupled with a decreased pressure ratio. Compared with the IGV0 case, the IGV30, IGV45, and IGV60 improve approximately 9.95% of stall (surge) margin;
(2)
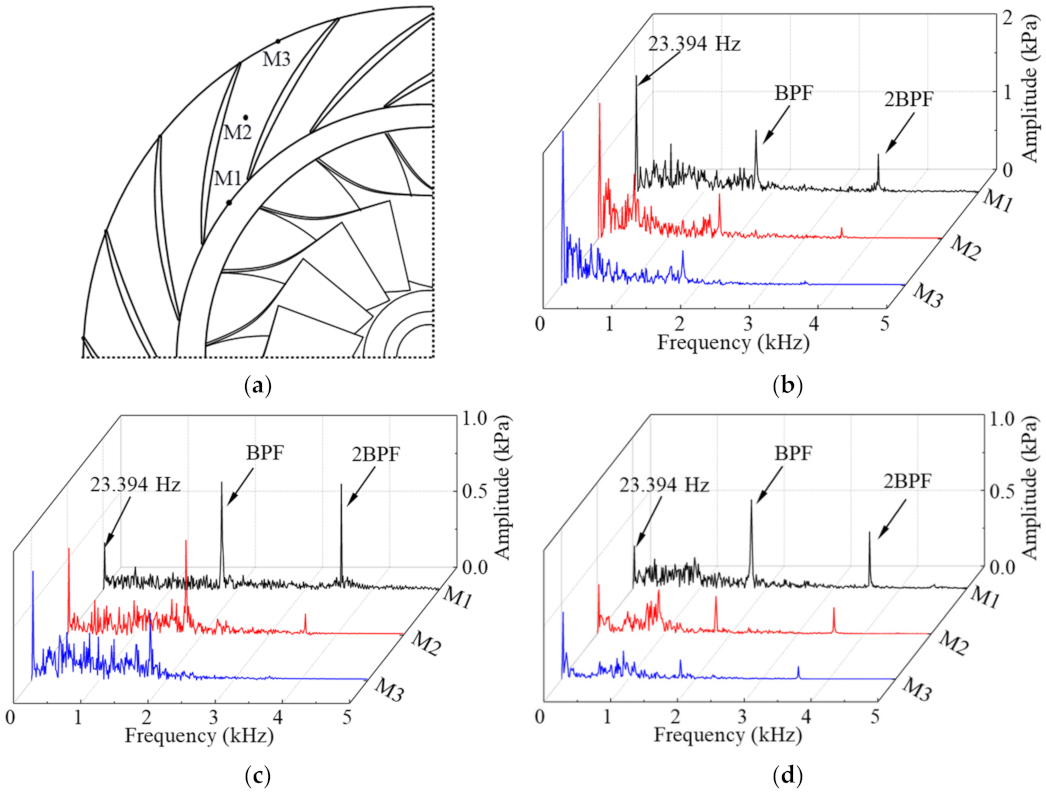
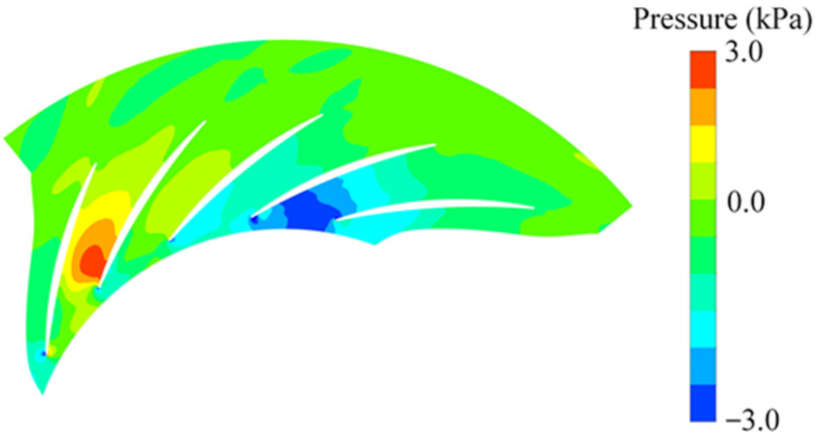
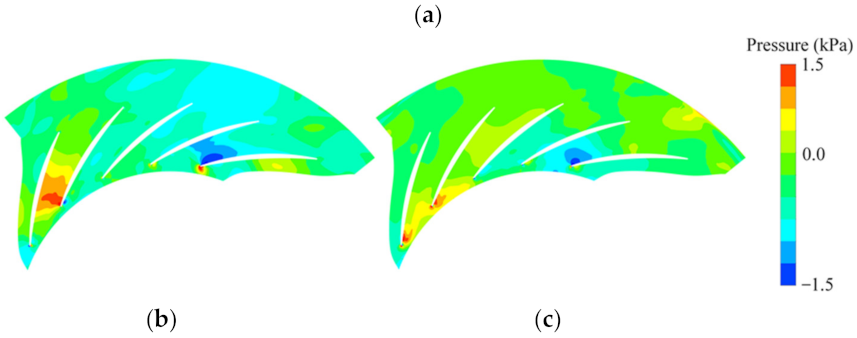
The unstable flow phenomenon caused by the low frequency (23.394 Hz) in the impeller of the IGV30 case at φ = 0.0833 (72.9% design flow point) was determined by the methods of streamline distribution, spectrum analysis, vector, entropy increase, and modal decomposition, and the unstable flow structure propagates in the impeller at a speed of nearly 25.07% of the machine shaft frequency along the reverse direction of the impeller rotation. However, there was no similar unstable flow phenomenon by the low frequency in the impeller under the other two guide vane openings. The regulation of IGV improves the flow inside the impeller and then broadens the stable operating range of the compressor stage;
(3)
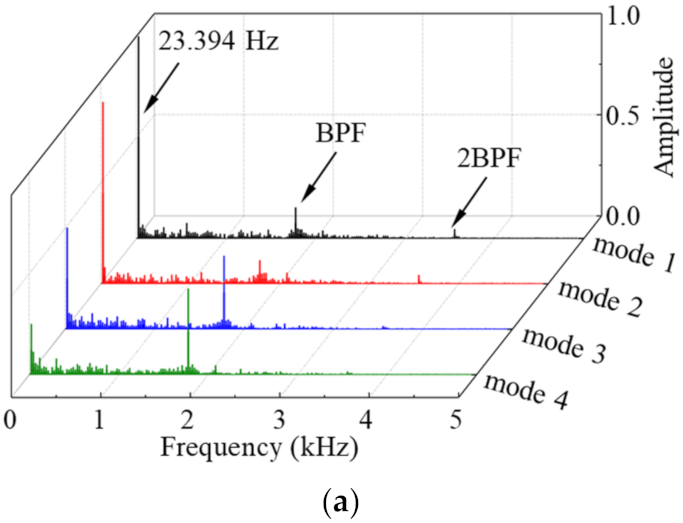
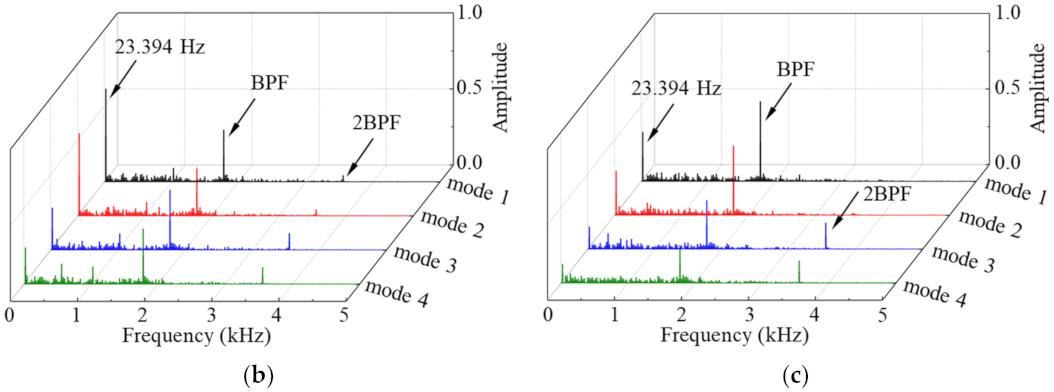
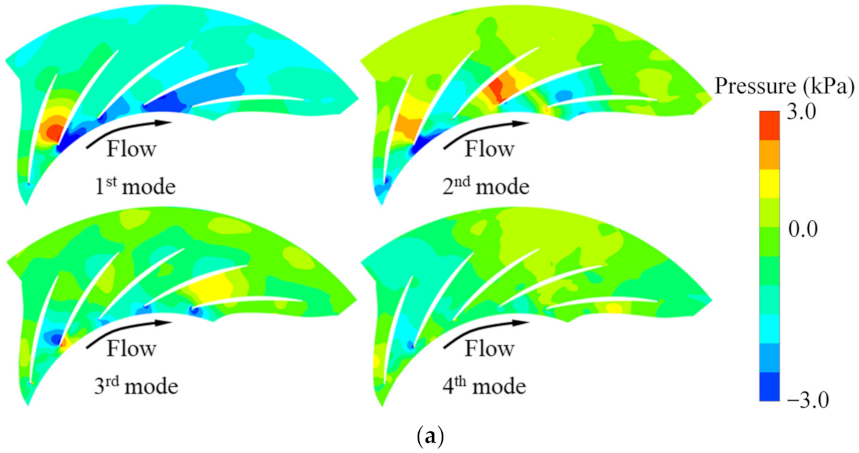
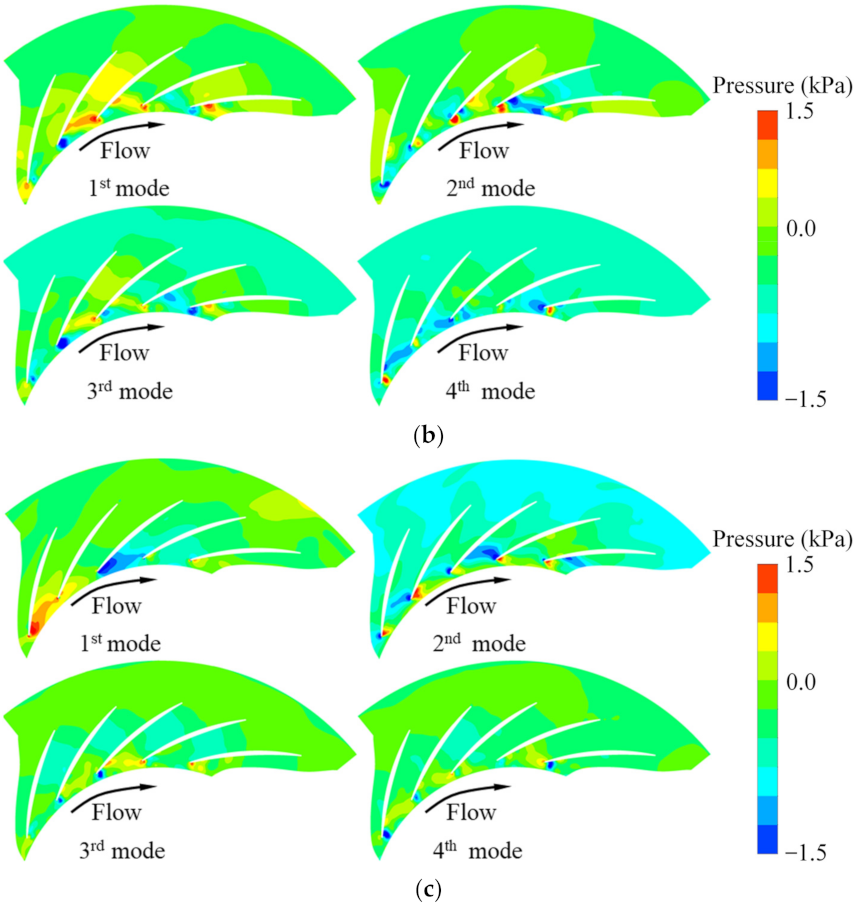
Combined with the monitoring point spectrum analysis and modal decomposition method, it is determined that the unstable flow phenomenon caused by the low frequency appears in the diffuser with three guide vane’s openings at φ = 0.0833. The unstable flow in the diffuser is mainly caused by the low frequency and impeller-diffuser interaction. When the positive pre-swirl of the guide vanes is small, the unstable flow caused by low frequency dominates the flow inside the diffuser, while the positive pre-swirl of the guide vane increases, the flow inside the diffuser is dominated by low frequency and the impeller-diffuser interaction, and the strength of the unstable flow is significantly weakened. As a result, the risk of the diffuser passages blockage is reduced, which is also a fundamental reason for the guide vane’s regulation to broaden the operating range of the compressor. Moreover, the unstable flow caused by the low frequency attenuation/release process of the diffuser can be predicted with the DMD method.

Author Contributions

The contribution of all the authors can be subdivided on an equal basis. Conceptualization, validation, writing original draft, visualization, S.L.; validation, resources, writing—review and editing, supervision, Y.L.; validation, writing—review and editing, M.O. and C.Z.; project administration, funding acquisition, H.L. All authors have read and agreed to the published version of the manuscript.

Funding

This research was funded by the National Natural Science Foundation of China under Grant No. U1808214.

Institutional Review Board Statement

Not applicate.

Informed Consent Statement

Not applicate.

Data Availability Statement

Not applicate.

Acknowledgments

The authors thanks Shenyang Blower Works Group Corporation for providing the CAD geometry and experimental data for this centrifugal compressor stage. The authors greatly acknowledge the experimental support as well as the helpful technical discussion and the permission to publish.

Conflicts of Interest

The authors declare no conflict of interest.

Nomenclature

VIGVvariable inlet guide vane
IGVinlet guide vane
PODproper orthogonal decomposition
DMDdynamic modal decomposition
kadiabatic exponent
Pttotal pressure (Pa)
Tttotal temperature (K)
Qmmass flow rate (kg/s)
Ddiameter
BPFblade passing frequency
IPFimpeller passing frequency
FFTfast Fourier transform
ttime
Δttime step
0centrifugal compressor stage inlet
1impeller inlet
2impeller outlet
3diffuser inlet
4diffuser outlet
5centrifugal compressor stage outlet
λPOD eigenvalue
nnumber
φmass flow coefficient
εtotal pressure ratio
ηpoltotal–total polytropic efficiency
ωdirection of impeller rotation

References

  1. Sun, Q.; Ji, C.J.; Fang, J.Y.; Li, C.Y.; Zhang, X.L. Optimization design of IGV profile in centrifugal compressor. Math. Probl. Eng. 2017, 2017, 8437325. [Google Scholar] [CrossRef] [Green Version]
  2. Cui, M.M. Effect of Suction Elbow and Inlet Guide Vanes on Flow Field in a Centrifugal Compressor Stage. In ASME Paper No. GT2002-30376; American Society of Mechanical Engineers: New York, NY, USA, 2002. [Google Scholar] [CrossRef]
  3. Becciani, M.; Bianchini, A.; Checcucci, M.; Ferrara, G.; Deluca, M.; Marmorini, L.; Arnone, A.; Ferrara, G. A pre-design model to estimate the effect of variable inlet guide vanes on the performance map of a centrifugal compressor for automotive applications. In Proceedings of the SAE 13th International Conference on Engines and Vehicles, Capri, Italy, 10–14 September 2017; Volume 24. [Google Scholar] [CrossRef]
  4. Rodgers, C. Centrifugal compressor inlet guide vanes for increased surge margin. J. Turbomach. 1991, 113, 696–702. [Google Scholar] [CrossRef]
  5. Coppinger, M.; Swain, E. Performance prediction of an industrial centrifugal compressor inlet guide vane system. Proc. Inst. Mech. Eng. Part A J. Power Energy 2000, 214, 153–164. [Google Scholar] [CrossRef]
  6. Mohseni, A.; Goldhahn, E.; Braembussche, R.A.V.D.; Van den Braembussche, R.A.; Seume, J.R. Novel IGV designs for centrifugal compressors and their interaction with the impeller. J. Turbomach. 2012, 134, 021006. [Google Scholar] [CrossRef]
  7. Zhou, L.; Xi, G.; Cai, Y. Numerical investigation of unsteady IGV-impeller-diffuser interaction in a centrifugal compressor. J. Northwest. Polytech. Univ. 2010, 22, 1715–1721. [Google Scholar] [CrossRef]
  8. Biela, C.; Brandstetter, C.; Holzinger, F.; Schiffer, H. Influence of inlet guide vane wakes on performance and stability of a transonic compressor. In Proceedings of the 20th International Symposium on Air Breathing Engines, Gothenburg, Sweden, 12–16 September 2011; 2011. Article ID: ISABE-2011-1209. [Google Scholar]
  9. Xu, C.; Fan, C.; Zhang, Z.P.; Mao, Y.J. Numerical study of wake and potential interactions in a two-stage centrifugal refrigeration compressor. Eng. Appl. Comput. Fluid Mech. 2021, 15, 313–327. [Google Scholar] [CrossRef]
  10. Galindo, J.; Serrano, J.R.; Margot, X.; Tiseira, A.; Schorn, N.; Kindl, H. Potential of flow pre-whirl at the compressor inlet of automotive engine turbochargers to enlarge surge margin and overcome packaging limitations. Int. J. Heat Fluid Flow 2007, 28, 374–387. [Google Scholar] [CrossRef]
  11. Zhang, X.; Huang, Q. Potential of the range extension of compressors with a variable inlet pre-whirl for automotive turbocharged engines with an ultra-high-power density. Proc. Inst. Mech. Eng. Part D J. Automob. Eng. 2015, 229, 1959–1968. [Google Scholar] [CrossRef]
  12. Zhao, Y.; Zhao, J.; Wang, Z.; Xi, G. Numerical investigation of diffuser. In ASME Paper No. GT2017-63913; American Society of Mechanical Engineers: New York, NY, USA, 2017. [Google Scholar] [CrossRef]
  13. Grondin, J.; Trébinjac, I.; Rochuon, N. Rotating instabilities versus rotating stall in a high-speed centrifugal compressor. In ASME Paper No. GT2018-76916; American Society of Mechanical Engineers: New York, NY, USA, 2018. [Google Scholar] [CrossRef]
  14. Zhao, J.; Xi, G.; Wang, Z.; Zhao, Y. The unsteady pre-stall behaviour of the spike-type rotating stall within an airfoil vaned-diffuser. In ASME Paper GT2018-76145; American Society of Mechanical Engineers: New York, NY, USA, 2018. [Google Scholar] [CrossRef]
  15. Day, I.J. Stall, surge, and 75 years of research. J. Turbomach. 2015, 138, 011001. [Google Scholar] [CrossRef]
  16. Giovanni, F.; Lorenzo, F.; Leonardo, B. Rotating stall in centrifugal compressor vaneless diffuser: Experimental analysis of geometrical parameters influence on phenomenon evolution. Int. J. Rotating Mach. 2004, 10, 576764. [Google Scholar] [CrossRef] [Green Version]
  17. Fujisawa, N.; Hara, S.; Ohta, Y. Unsteady behavior of leading-edge vortex and diffuser stall in a centrifugal compressor with vaned diffuser. J. Therm. Sci. 2016, 25, 13–21. [Google Scholar] [CrossRef]
  18. Semlitsch, B.; Mihăescu, M. Flow phenomena leading to surge in a centrifugal compressor. Energy 2016, 103, 572–587. [Google Scholar] [CrossRef]
  19. Witte, M.; Torner, B.; Wurm, F.H. Analysis of unsteady flow structures in a radial turbomachine by using proper orthogonal decomposition. In ASME Paper No. GT2018-76596; American Society of Mechanical Engineers: New York, NY, USA, 2018. [Google Scholar] [CrossRef]
  20. Sharma, S.; Broatch, A.; García, T.J.; Allport, J.M.; Nickson, A.K. Acoustic characteristics of a ported shroud turbocompressor operating at design conditions. Inter. J. Engine Res. 2018, 21, 1454–1468. [Google Scholar] [CrossRef]
  21. Sajadmanesh, S.M.; Mojaddam, M.; Mohseni, A.; Nikparto, A. Numerical identification of separation bubble in an ultra-high-lift turbine cascade using URANS simulation and proper orthogonal decomposition. Aerosp. Sci. Technol. 2019, 93, 105329. [Google Scholar] [CrossRef]
  22. Sharma, S.; Broatch, A.; García, T.J.; Nickson, A.K.; Allport, J.M. Acoustic and pressure characteristics of a ported shroud turbocompressor operating at near surge conditions. Appl. Acoust. 2019, 148, 434–447. [Google Scholar] [CrossRef] [Green Version]
  23. Rochuon, N.; Trébinjac, I.; Billonnet, G. An extraction of the dominant rotor-stator interaction modes by the use of Proper Orthogonal Decomposition (POD). J. Therm. Sci. 2006, 15, 109–114. [Google Scholar] [CrossRef]
  24. Zhang, L.; Mi, D.; Yan, C.; Tang, F. Multidisciplinary Design Optimization for a Centrifugal Compressor Based on Proper Orthogonal Decomposition and an Adaptive Sampling Method. Appl. Sci. 2018, 8, 2608. [Google Scholar] [CrossRef] [Green Version]
  25. Ji, C.; Wang, Z.; Tang, Y.; Xi, G. A Flow Information-Based Prediction Model Applied to the Nonaxisymmetric Hub Optimization of a Centrifugal Impeller. J. Mech. Des. 2021, 143, 103502. [Google Scholar] [CrossRef]
  26. Sundström, E.; Mihaescu, M. Centrifugal compressor: The sound of surge. In Proceedings of the 21st AIAA/CEAS Aeroacoustics Conference, Dallas, TX, USA, 22–26 June 2015. [Google Scholar] [CrossRef]
  27. Li, X.; Zhao, Y.; Liu, Z.; Zhao, M. Dynamic mode decomposition analysis of the flow characteristics in a centrifugal compressor with vaned diffuser. Pro. Inst. Mech. Eng. Part A J. Power Energy 2021, 235, 154–168. [Google Scholar] [CrossRef]
  28. Hu, C.; Yang, C.; Yi, W.; Hadzic, K.; Xie, L.; Zou, R.; Zhou, M. Numerical investigation of centrifugal compressor stall with compressed dynamic mode decomposition. Aerosp. Sci. Technol. 2020, 106, 106153. [Google Scholar] [CrossRef]
  29. Xue, X.; Wang, T.; Shao, Y.; Yang, B.; Gu, C. Experimental and numerical analysis of unsteady flow structure in a centrifugal compressor with variable vaned diffuser. In ASME Paper GT2018-76597; American Society of Mechanical Engineers: New York, NY, USA, 2018. [Google Scholar] [CrossRef]
  30. Li, S.; Liu, Y.; Omidi, M.; Li, H. Numerical study of the improvement in stability and performance by use of a partial vaned diffuser for a centrifugal compressor stage. Appl. Sci. 2021, 11, 6980. [Google Scholar] [CrossRef]
  31. Zhao, P.F.; Liu, Y.; Li, H.K.; Wang, X.F.; Yang, J.G. The effect of impeller–diffuser interactions on diffuser performance in a centrifugal compressor. Eng. Appl. Comput. Fluid Mech. 2016, 10, 565–577. [Google Scholar] [CrossRef] [Green Version]
  32. Crevel, F.; Gourdain, N.; Moreau, S. Numerical simulation of aerodynamic instabilities in a multistage high-speed high-pressure compressor on its test-rig—part I: Rotating stall. J. Turbomach. 2014, 136, 101003. [Google Scholar] [CrossRef]
  33. Zamiri, A.; Lee, B.J.; Chung, J.T. Numerical evaluation of transient flow characteristics in a transonic centrifugal compressor with vaned diffuser. Aerosp. Sci. Technol. 2017, 70, 244–256. [Google Scholar] [CrossRef]
  34. Chen, S.; Zuo, S.; Wei, K. Numerical investigation of the centrifugal compressor stability improvement by half vaned low solidity diffusers. J. Therm. Sci. 2021, 30, 696–706. [Google Scholar] [CrossRef]
  35. Celik, I.B.; Ghia, U.; Roache, P.J.; Freitas, C.J.; Coleman, H.; Raad, P.E. Procedure for estimation and reporting of uncertainty due to discretization in CFD applications. J. Fluids Eng. Trans. ASME 2008, 130, 07800. [Google Scholar]
  36. ANSYS. ANSYS CFX Version 17.0. 2015. Available online: http://www.ansys.com/ (accessed on 16 July 2021).
  37. Sirovich, L. Turbulence and the dynamics of coherent structures. I. Coherent structures. Q. Appl. Math. 1987, 45, 561–571. [Google Scholar] [CrossRef] [Green Version]
  38. Hutchinson, P. Stochastic tools in turbulence. Phy. Bull. 1971, 22, 161. [Google Scholar] [CrossRef]
  39. Sirovich, L.; Rodriguez, J.D. Coherent structures and chaos: A model problem. Phy. Lett. A 1987, 120, 211–214. [Google Scholar] [CrossRef]
  40. Lengani, D.; Simoni, D.; Pichler, R.; Sandberg, R.D.; Michelassi, V.; Bertini, F. On the identification and decomposition of the unsteady losses in a turbine cascade. J. Turbomach. 2019, 141, 031005. [Google Scholar] [CrossRef]
  41. Schmid, P.J. Dynamic mode decomposition of numerical and experimental data. J. Fluid Mech. 2010, 656, 5–28. [Google Scholar] [CrossRef] [Green Version]
  42. Zhao, X.; Zhou, Q.; Yang, S.; Li, H. Rotating stall induced non-synchronous blade vibration analysis for an unshrouded industrial centrifugal compressor. Sensors 2019, 19, 4995. [Google Scholar] [CrossRef] [PubMed] [Green Version]
Figure 1. Centrifugal compressor stage: (a) meridional view; (b) four different guide vane deflection angles.
Energies 14 07906 g001
Figure 2. Schematic diagram of the computational domain and computational grid: (a) all computational domain; (b) computational grid; (c) y plus.
Energies 14 07906 g002
Figure 3. Schematic sketch of the experimental platform.
Energies 14 07906 g003
Figure 4. Comparison of numerical results with experimental data for the stage: (a) IGV0; (b) IGV60.
Energies 14 07906 g004
Figure 5. Spectrum analysis of the pressure fluctuations at the inlet of the diffuser: (a) the location of monitoring point (b) IGV45 (φ = 0.0833).
Energies 14 07906 g005
Figure 6. The performance map under different IGVs openings: (a) total pressure ratio; (b) polytropic efficiency.
Energies 14 07906 g006
Figure 7. Relative flow angle distributions at the impeller inlet.
Energies 14 07906 g007
Figure 8. Relative Mach number and streamlines distribution at 97% span (φ = 0.0833): (a) IGV30; (b) IGV45; (c) IGV60.
Energies 14 07906 g008
Figure 9. Spectrum analysis of the pressure fluctuations at the impeller inlet: (a) the location of monitoring point; (b) three types of guide vane openings (φ = 0.0833).
Energies 14 07906 g009
Figure 10. Contours of the instantaneous relative velocity vector and corresponding entropy increase in the impeller passages (IGV30, 97% span, φ = 0.0833): (a) relative velocity vector; (b) static entropy.
Energies 14 07906 g010
Figure 11. Contours of instantaneous static entropy in the impeller passages (97% span, IGV30, φ = 0.0833): (a) t1 = 0.11135 s; (b) t2 = 0.11338 s; (c) t3 = 0.11734 s.
Energies 14 07906 g011
Figure 12. The pressure field for DMD mode of 23.394 Hz at 97% span of the impeller (IGV30, φ = 0.0833).
Energies 14 07906 g012
Figure 13. Spectrum analysis of pressure fluctuations at the monitor points in the diffuser passage (φ = 0.0833): (a) the location of monitoring point, (b) IGV30, (c) IGV45, (d) IGV60.
Energies 14 07906 g013
Figure 14. Normalized eigenvalues of the first 100 POD eigenmodes.
Energies 14 07906 g014
Figure 15. Spectrum analysis of modal coefficients for the POD modes of pressure fields in the diffuser (97% span, φ = 0.0833), (a) IGV30, (b) IGV45, (c) IGV60.
Energies 14 07906 g015aEnergies 14 07906 g015b
Figure 16. Spatial distribution of the pressure field for the first four POD eigenmodes in the diffuser (97% span, φ = 0.0833): (a) IGV30, (b) IGV45, (c) IGV60.
Energies 14 07906 g016aEnergies 14 07906 g016b
Figure 17. Spatial distribution of the pressure field for DMD modes of the low frequency (97% span, φ = 0.0833): (a) IGV30; (b) IGV45; (c) IGV60.
Energies 14 07906 g017aEnergies 14 07906 g017b
Table 1. Primary geometric parameters of the centrifugal compressor stage.
Parameters Value
Impeller outlet diameterD2810 mm
Diffuser inlet diameterD3900 mm
Diffuser outlet diameterD41240 mm
Return channel diameterDret620 mm
Impeller exit widthb257.5 mm
Tip clearanceτ3.5 mm
Number of guide vanesZgui11
Number of impellersZimp19
Number of diffuser vanesZdif20
Number of return channelsZret18
Rotational speedω5600 rpm
Table 2. Research on grid independence for different grid resolutions.
CoarseMediumFineGCIExperimental
Total pressure ratio1.49481.54261.54661.07%1.5322
Total-total efficiency90.13%90.88%90.92%0.86%89.39%
Publisher’s Note: MDPI stays neutral with regard to jurisdictional claims in published maps and institutional affiliations.

