Abstract
Power cycles on offshore oil and gas installations are expected to operate more at varied load conditions, especially when rapid growth in renewable energies puts them in a load-following operation. Part-load efficiency enhancement is advantageous since heat to power cycles suffer poor efficiency at part loads. The overall purpose of this article is to improve part-load efficiency in offshore combined cycles. Here, the organic Rankine bottoming cycle with a control strategy based on variable geometry turbine technology is studied to boost part-load efficiency. The Variable Area Nozzle turbine is selected to control cycle mass flow rate and pressure ratio independently. The design and performance of the proposed working strategy are assessed by an in-house developed tool. With the suggested solution, the part-load organic Rankine cycle efficiency is kept close to design value outperforming the other control strategies with sliding pressure, partial admission turbine, and throttling valve control operation. The combined cycle efficiency showed a clear improvement compared to the other strategies, resulting in 2.5 kilotons of annual carbon dioxide emission reduction per gas turbine unit. Compactness, autonomous operation, and acceptable technology readiness level for variable area nozzle turbines facilitate their application in offshore oil and gas installations.
1. Introduction
Decreasing the global warming rate is a necessity of time. It has been resulted in setting targets to reduce carbon dioxide (CO2) emission in the oil and gas industry. An offshore CO2 tax is introduced in Norway to achieve this target [1]. About a quarter of Norway’s total emission comes from the Norwegian continental shelf (NCS), where 85% of this CO2 emission is originated from gas turbines (GT) generating electricity or shaft power on the platforms [2]. Lifetime efficiency improvement of turbine-based power generation systems is a potential solution to reduce CO2 emitted per MW and to reduce the fuel consumption in offshore oil and gas installations. It will also reduce fuel consumption. It is expected that future carbon-neutral fuels will be more costly to be supplied than today’s fossil fuels. As an example, the average hydrogen production cost in 2030 is estimated to be in the range of 2–5 USD/kg in Europe [3].
Organic Rankine cycle (ORC) is one of several options for gas turbine waste heat recovery in offshore oil platforms [4]. Pierobon et al. conducted a case study in [5] on an offshore platform in the North Sea to find the optimum bottoming cycle solution based on yearly CO2 emissions, weight, and economic revenue. It is observed in [5] that organic Rankine cycle technology outperforms steam Rankine cycle and air bottoming cycle. Bacci et al. showed in [6] that reduced plant footprint and the absence of a water treatment system make ORC a competitive choice based on investment cost (capital expenditure bottoming cycle price). Moreover, ORC is compact, can operate autonomously, and its design is not limited to a specific working fluid. This can provide design flexibility to cover a wide range of needs in variable circumstances of offshore installations.
Offshore gas turbines operate mostly in part-load. Thus, lifetime performance has been prioritized over on-design point performance. In many cases, the power load demand from a gas turbine is typically 50% on the offshore platform and may fall to 20% in some conditions [7,8]. The primary reason is to assure reliability in the power generation process. The power supplied to the platform must not be cut in case of one gas turbine trip. The other reason is the availability of renewable energies such as offshore wind parks and carbon-neutral power from shore. Wind power or photovoltaic energy are not available all the time. A wind turbine may spend up to 67% of its lifetime producing less than 50% of the full power capacity [9]. Barnhart et al. showed in [10] that in a case study the average capacity of a wind turbine during a month may be in the range of 35–60%. It is expected that gas turbines and the bottoming cycle work in intermittent operation as a backup load.
ORCs show poor performance regarding thermal efficiency in part-load. With lower power demand from the gas turbine, less heat is available to the bottoming cycle. It can, for example, be 70% of on-design exhaust heat at 50% load for a gas turbine [11], or 50% of on-design exhaust heat at 20% load for other gas turbine types [12]. The value depends on the gas turbine type and how it is controlled, but it typically falls near mentioned values. With less heat available from the gas turbine, ORC mass flow rate and evaporation pressure must be reduced. As the cycle operates at lower pressures, poor ORC efficiency is seen in part loads.
Due to the variation of gas turbine exhaust heat, finding an efficient control strategy for the bottoming cycle is essential to avoid poor off-design performance [13]. Efforts have been made by researchers to improve ORC part-load efficiency, but few studies consider ORC as a bottoming cycle in offshore applications. Sliding pressure (SP) and superheating are common solutions proposed in the literature [14]. However, controlling the degree of superheating as a part-load strategy is not practical offshore as increased heat transfer area is needed for the superheater. Sliding pressure leads to decreasing efficiency at part-load. Fu et al. showed in [15] the significance of the efficiency drop with sliding pressure during part-load operation with a hot water heat source. Casartelli et al. proposed a partial admission turbine in [16] to adjust the turbine capacity in a solar heat-driven ORC independent of suction pressure. However, it is not an efficient way to reduce turbine capacity and it brings considerable pressure losses in the turbine throughflow passage. Cao and Dai used variable area nozzle (VAN) turbine technology in [14] to keep turbine inlet pressure constant and improved ORC part-load efficiency. However, a fixed pressure strategy may not necessarily give the best efficiency possible with different gas turbine off-design control logics. Muñoz De Escalona et al. designed a constant efficiency part-load strategy in [17] by putting turbine suction temperature far away from its optimum value in the design point. Acceptable part-load performance is achieved in their work while getting a large on-design performance penalty. A considerable power generation potential is left unused at full load and a higher exergy loss is detected in the design point. This logic is helpful but ends up in an overdesigned, heavy system for the same power demand. It may be beneficial onshore, but space is limited in the offshore installations, and therefore does not suit offshore applications.
Very few works have considered gas turbines waste heat as the ORC heat source. Cao et al. designed a GT-ORC coupled with recuperators to increase the design point efficiency in [18]. Chacartegui et al. studied ORC application as a bottoming cycle to low exhaust temperature heavy-duty gas turbines in [19]. Carcasci et al. conducted a study in [20] on GT-ORC design with four different working fluids for the bottoming cycle. They included an oil circuit for transferring the heat between the gas turbine and the bottoming cycle. Khaljani et al. considered the design and optimization of GT-ORC from a thermoeconomic point of view in [21]. However, all of the works in [18,19,20,21] have considered the design and analysis of the GT-ORC combination at design point conditions. Limited studies have focused on the part-load operation of the GT-ORC combination. For instance, Cao and Dai studied the off-design performance of a GT-ORC design with constant pressure and sliding pressure control strategy for the bottoming cycle [14]. The research cases available in the literature on GT-ORC off-design operation are based on a single control scenario of the gas turbine. Furthermore, few works have considered offshore requirements, such as, footprint. Thus, there is a knowledge gap in the development and assessment of potential solutions for offshore GT-ORC part-load operation. It is not studied in the literature how different gas turbine off-design control scenarios, such as constant or decreasing gas turbine exhaust temperature can affect the optimal ORC control logic. This paper proposes and evaluates an operational strategy based on Variable Area Nozzle (VAN) turbine technology to improve the part-load efficiency of ORC in offshore oil and gas installations. The novelty of the work is that four ORC control logics are investigated in two different gas turbine part-load strategies. VAN turbine as the proposed solution here can keep the ORC thermal efficiency close to the design point value in a wide range of power loads. It is compact, autonomous, and will help to reduce CO2 emission as offshore gas turbines are expected to spend most of their operational lifetime at part-load.
2. Mathematical Models and Method
The methodology to design the bottoming cycle and development of the control strategy is described in this section. It is explained how the cycle performance is simulated and how each component is modelled. The developed tool for design and analysis is described in this section.
2.1. System Configuration Selection
A Cascade architecture is used in this work to harvest gas turbine exhaust heat (Figure 1a). Nami et al. conducted a study in [22] on cascade and series configuration layout in ORC bottoming cycles. it is concluded that changing heat demand while keeping the heat source temperature constant does not affect the produced power in a cascade configuration. This comes from the fact that heat absorption/rejection takes place in a constant temperature process [22]. The process heat required to the platform is extracted at gas turbine discharge and before entering a non-recuperated ORC. It is crucial to guarantee process heat availability in an oil platform. Whit this, the requested amount of heat is always available at all gas turbine loads. Heat transfer is carried out within an internal loop to reduce the risk of fire in case of organic fluid leakage. A 15 °C pinch point limit is considered for heat exchangers in this internal loop to assure effective heat transfer between oil-air and oil-organic fluid. The ORC turbine is a fixed-speed radial inflow expander. Turbine stators are pivoted to provide a variable area between vanes in the VAN case. Cooling water is assumed to always be available from the sea at 30 °C or lower in the condensation section. The bottoming cycle works with a variable-speed centrifugal pump. Figure 1a illustrates the selected system configuration and some design point thermodynamic states.
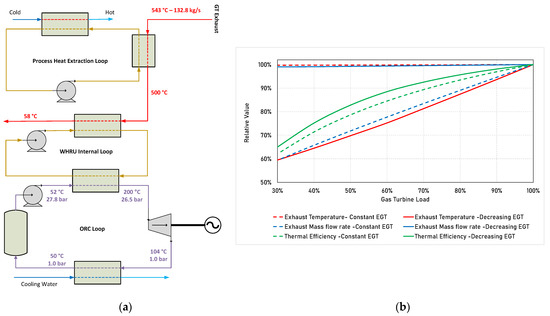
Figure 1.
System characteristics: (a) Cycle flow diagram; (b) Gas turbine part-load performance.
SGT800-47 gas turbine is selected as the topping cycle. A single shaft gas turbine can operate with both constant and decreasing exhaust temperature at part loads. Two gas turbine control logics are considered to cover different types of gas turbine off-design scenarios. Case A is a non-IGV operation that has decreasing exhaust temperature at part loads. Case B is an IGV-operated control logic that has an almost constant exhaust temperature (Figure 1b).
A variable area nozzle radial inflow turbine is used to extract work in the VAN turbine control strategy, while a conventional non-variable geometry radial inflow turbine is used in the baseline plant. A turbine with partial arc admission is used as a third part-load strategy. The only different component between sliding pressure and the VAN turbine system is the radial turbine.
2.2. Component Modelling
The first step to develop a control strategy is selecting appropriate models for performance simulation of the components. The models used for the analysis of the system are presented here.
2.2.1. Gas Turbine
Gas turbine performance data is calculated with GT MASTER 29 commercial software from Thermoflow Inc., Southborough, MA, USA [23]. The software can provide gas turbine performance data in a wide range of design and off-design operation conditions. The comprehensive database covers almost all gas turbines available in the market. Gas turbines thermal efficiency, exhaust mass flow rate and exhaust temperature are calculated in a range of power demands. The gas turbine is simulated in steady-state operation and standard ISO conditions for the ambient air, i.e., 15 °C and 1.013 bar. Thermal efficiency is considered in the lower heating value (LHV) format. As SGT-800 is a single shaft gas turbine equipped with variable geometry compressor vanes, it can operate with either constant or reduced exhaust temperature at part loads. Two operational strategies are considered in this work, so that influence of different gas turbine control logic on the efficiency of the presented ORC solution can be investigated. In case A, gas turbine exhaust temperature decreases in part loads, while in case B gas turbine compressor vanes setting is manipulated to keep the exhaust temperature close to design value. The Selection of gas turbine part-load strategy depends on plant requirements.
2.2.2. Pump
The pump pressurizes the working fluid before entering the preheater and is a multi-stage variable speed centrifugal pump. Hu, Li, et al. reported in [24] a correlation between the head rise and efficiency with volume flow rate for a multistage centrifugal pump in a power plant application. The model is used in this work as it is generalized by using relative-to-design values. It calculates head rise and isentropic efficiency based on the flow rate in off-design conditions. The following equation can be used to calculate pump power consumption in each working condition.
In which, is power consumption in the pump, is pump mass flow rate, is pump isentropic head rise and is the pump isentropic efficiency. Pump speed is governed by the ORC controller. Mass flow rate and head rise of a variable frequency drive (VFD) centrifugal pump at different speeds is calculated by the general model presented by [25].
Here, is pump mass flow rate, dp denotes for design speed, is the fluid density, is the pump rotational speed, and is pump head rise. A VFD pump performance is illustrated in Figure 2a as a function of relative flow rate and rotational speed.
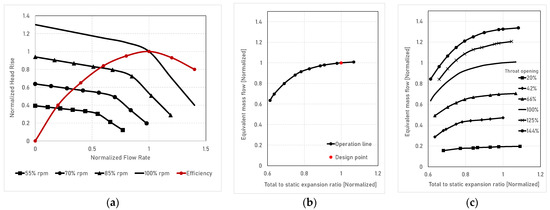
Figure 2.
Performance map: (a) VFD pump; (b) Radial inflow turbine; (c) VAN turbine.
2.2.3. Radial Inflow Turbine
The selected ORC turbine is a radial inflow expander working at a fixed speed. The pressure ratio across the turbine is calculated according to the corrected mass flow rate passing the turbine in each working condition [26]. Turbine corrected mass flow rate is defined in the following equation.
Equation (3) defines which is the corrected mass flow rate relative to the design value. Here dp denotes for design point values, and are turbine inlet total temperature and total pressure, respectively. It is a design choice where to locate the design point in the turbine performance curve. It is seen by a simple mission analysis on the GT-ORC combination that the design point should have maximum swallow capacity in the operational range. The reason is that off-design operation is limited to part loads where the capacity is lower than the design value. However, it should be noted that if the turbine design point is in the choked region, then no control functionality could be retracted from the turbine, i.e., ORC mass flow rate could not be manipulated at part loads. Therefore, the turbine design point is located out of the choked region, but as close as possible to the choking line (Figure 2b). This is very close to the turbine’s optimal efficiency and enables the widest turbine operation range possible at part-load. Turbine efficiency is calculated in off-design conditions by the model reported in [27]. In this method, turbine efficiency is estimated based on the well-known velocity ratio parameter (Figure 3a). The velocity ratio parameter is defined as:
where is turbine impeller tip speed, is turbine isentropic speed and is isentropic enthalpy drop in the turbine. As the calculations are relative to design values at this early design stage, there is no need to know the exact number for the tip speed. Then velocity ratio parameter for a fixed speed turbine is used in a relative form.
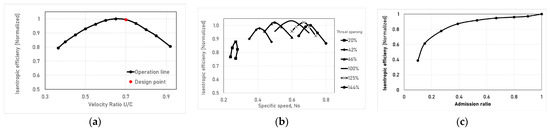
Figure 3.
Turbine isentropic efficiency: (a) Fixed geometry; (b) VAN; (c) Partial admission.
Here is turbine impeller tip speed, is turbine isentropic speed, dp denotes for design point, and is isentropic enthalpy drop in the turbine.
2.2.4. Variable Area Nozzle Turbine
A reliable and accurate model for variable area nozzle turbine performance prediction is necessary. The off-design performance of a radial inflow turbine is modelled in [26] and is used here. Their model includes a wide range of throat openings in pivoted stator VAN turbine (from 20% to 144% opening). It is inferred that the capacity of a radial inflow turbine can be widened to 20–130% of the design point mass flow rate. Moreover, the pressure ratio of a VAN turbine can be extended to 75–115% of the design value [26]. The setting angle for turbine throat opening is calculated based on turbine mass flow rate and expansion ratio at each working condition (Figure 2c). Knowing the turbine opening angle, turbine efficiency is estimated based on turbine specific speed and according to Figure 3b suggested in [26]. The specific speed is defined as:
where Ns is specific speed, is turbine rotational speed, is volumetric flow rate and is isentropic enthalpy drop across the turbine. Since rotational speed is kept constant through the off-design operation, specific speed in its normalized form can be calculated by
Here Ns is specific speed, dp denotes for design point value, is turbine mass flow rate, is the fluid density, and is isentropic enthalpy drop across the turbine.
2.2.5. Partial Admission Turbine
Partial admission (PA) turbine is a solution to regulate turbine swallowing capacity in changing operating conditions. It lets the turbine operate in a wider range of swallowing capacity than common full admission turbines. However, off-design turbine efficiency degrades in partial admission operation. Turbine efficiency should be calculated in each flow rate and pressure ratio. A most recent performance modelling of partial admission turbine is carried out in [28]. Their results were in good agreement with more than ten PA turbine models available in the literature. Normalized turbine efficiency is calculated based on the admission ratio as presented in Figure 3c.
2.2.6. Heat Exchangers
Heat transfer takes place in a two-phase process within the evaporator while it undergoes a single-phase process in the condenser, economizer, and oil heat exchangers. The amount of heat transferred in each heat exchanger unit and pressure loss in the off-design conditions is needed in the simulations. As few details are available in the early design stage and system simulation phase, a generic counter-current heat exchanger performance model developed for Rankine cycle analysis in [29] is used. A minimum amount of generic input geometry data is needed to calculate the performance of the heat exchanger in this model. Assuming mean constant fluid and flow parameters through the heat exchangers, Equations (8) and (9) are employed to relate fluid temperature entering and discharging a heat exchanger [30].
where subscript denotes for heat exchanger hot side, denotes for heat exchanger cold side, denotes for inlet, and denotes for the outlet of the heat exchanger. T and h are the temperature and the enthalpy of the fluid, respectively. A is heat exchanger effective area, is heat exchanger overall heat-transfer coefficient, is the mass flow rate through the heat exchanger, and is heat capacity of the fluids. For a single-phase counter flow heat exchanger, effectiveness and overall heat transfer coefficient are related as the following equations [30].
In these equations, A is heat exchanger effective area, is heat exchanger overall heat-transfer coefficient, is the heat capacity ratio of heat exchanger fluids, is the heat exchanger effectiveness, and are the lower and higher value of heat capacity between two cold and hot flow streams, respectively. For a two-phase heat exchanger -in this case, the evaporator- equations could still be used by setting , hence . It is suggested in [31] that the heat transfer coefficient can be calculated relative to the design value in off-design conditions.
where is heat exchanger overall heat-transfer coefficient, dp denotes for design point value, and is off-design heat transfer coefficient ratio, is Nusselt number, is fluid conductivity, subscript denotes for heat exchanger hot side, and denotes for heat exchanger cold side. Hagen et al. suggested in [29] to use the empirical Equation (14) for estimation of heat transfer coefficient in turbulent pipe flow for the parameter range of and .
Re, Pr, and Nu are well-known dimensionless numbers Reynolds number, Prandtl number and Nusselt number, respectively. Subscript D shows that Reynolds number is calculated based on the pipe diameter and is the friction factor in the heat exchanger. Pressure drop per unit length in a pipe flow is calculated by Equation (15). Then, heat exchanger pressure loss change in part loads is estimated as in the Equation (16).
is pressure drop per unit length, f is fanning friction factor, is the fluid density, is fluid velocity averaged on the cross-section area, is the hydraulic diameter, is the mass flow rate through the pipe, is the pressure drop across the heat exchanger pipe, and dp denotes for design point condition. The following equation presented in [32] is used here for estimating the Fanning friction factor required for both heat transfer and pressure drop calculations.
Here f is the fanning friction factor, is relative surface roughness based on pipe hydraulic diameter, and is the Reynolds number calculated based on hydraulic diameter. The change in pressure loss and heat transfer coefficient in the organic fluid side of the evaporator is neglected as it usually is a kettle type boiler in ORC applications.
2.3. Cycle Design Point
The bottoming cycle design point is selected with a parametric study on evaporation temperatures, condensing temperature and mass flow rate. In a Rankine cycle with negligible superheating, selecting evaporating and condensing temperatures specifies all pressure values in the cycle. Afterwards, the mass flow rate is selected such that heat exchangers pinch point temperature differences are kept within the allowed range. Design choices are made to attain best values for the key performance indicators (higher thermal efficiency and higher specific power) while considering the constraints (cycle pressure ratio and heat exchangers pinch point ). These constraints come from the requirements in offshore applications such as minimizing footprint and weight. Table 1 shows the input to the design process of the bottoming cycle. A parametric study on design variables is conducted to find the optimal set of design choices. An in-house tool is developed in a MATLAB framework as a design tool and off-design simulator. Cycle performance is simulated with a zero-dimensional approach in which thermodynamic properties at a component exhaust is calculated based on inlet conditions and a generalized performance correlation available in the open literature. Combined cycle efficiency (key performance indicator) is defined as the ratio of net power output from the gas turbine and ORC to heat energy added to the topping cycle. The thermodynamic properties library is established by linking the CoolProp database to the developed tool. CoolProp is a thermodynamic calculator coupling with Python and is openly available [33]. Heat exchangers are designed by assuming a maximum of 95% effectiveness for single-phase heat exchangers and 60% effectiveness for the two-phase heat exchanger.

Table 1.
Design point performance and conditions.
2.4. Part-Load Strategy Development
A part-load control logic based on variable area nozzle turbine was designed and assessed for offshore gas turbine bottoming cycle. The performance of the design strategy is then compared with three other well-known control logics, sliding pressure (SP), valve throttling (VT), and partial admission (PA) turbine. The improvement made by the proposed VAN logic can be compared to them.
2.4.1. Sliding Pressure
The sliding pressure controller manipulates the speed of the ORC pump and cooling water pump to control evaporation and condensing temperatures according to waste heat available from the gas turbine (Figure 4a). The expander speed is controlled by the electrical load imposed by the electrical generator. ORC pump speed governs evaporation pressure in the cycle while condensing pressure is regulated by the water pump speed. In each off-design condition, two matching criteria should be met in the cycle. (1) mass flow rate through ORC turbine and ORC pump should be equal (18), (2) pressure ratio through the cold path and hot path should be equal (19). Figure 4b illustrates the ORC matching criteria graphically. An intersection point between the turbine operation line and the ORC pump operation line is then a valid operation point for the cycle. A thorough search is conducted through all possibilities (ORC pump speed) to find the one with maximum cycle efficiency. Figure 5a illustrates the flow chart for search and selection of the best cycle in sliding pressure part-load strategy. A simple plane search is used as the small opportunity window does not necessitate an optimization method.
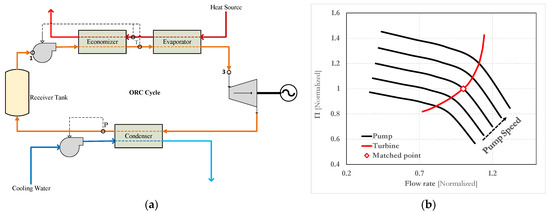
Figure 4.
ORC sliding pressure control logic: (a) Flow-control diagram; (b) Matching criteria.
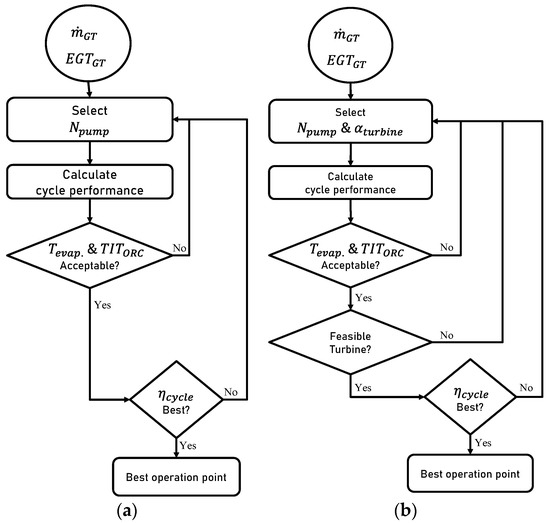
Figure 5.
Selecting optimum cycle: (a) Sliding pressure; (b) VAN/PA turbine.
2.4.2. Variable Geometry Turbine
In the VAN turbine control strategy, ORC pump speed, cooling water pump speed and turbine vanes setting angle are manipulated to control cycle temperatures and to maximize cycle efficiency. A VAN turbine adds a degree of freedom which enables the controller to regulate cycle mass flow rate independent of evaporation pressure. While cooling water pump speed is regulated to control the condensing pressure, a set of pairs (ORC pump speed and VAN turbine setting angle) exist that can follow the off-design conditions imposed by the gas turbine. A thorough search is conducted on all possible evaporation pressure and mass flow rates to find the best efficiency point for each gas turbine load. One should note that the optimum evaporation pressure in part-load is not necessarily equal to the design value since turbine isentropic efficiency decays as vane setting angel changes (Figure 3b). A simple plane search is used since a small search domain does not require optimization methods. Figure 5b shows the flow chart for searching and selecting the best cycle in VAN turbine part-load strategy. The methodology for developing control logic with a PA turbine is the same as a VAN turbine. However, the turbine efficiency pattern and operation range envelope are different and are modelled as explained in Section 2.2.5.
2.4.3. Valve Throttling
The throttle valve is treated as a constant enthalpy component. The throttle position is manipulated to regulate mass flow rate through the turbine based on imposed working conditions by the gas turbine. Thus, the mass flow rate is reduced in part loads when less heat is available from the gas turbine. Meanwhile, evaporation pressure is kept constant equal to the design value to get higher efficiency from the cycle. Entropy generation in the throttling valve is calculated by matching throttle inlet and outlet pressure to ORC pump pressure rise and turbine pressure drop, respectively.
2.5. Method and Tool Verification
The reliability of the developed tool is assured by comparing the results against available data in [17]. The rated and off-design performance of the ORC is considered with a Solar Centaur 50 gas turbine as the topping cycle. The investigation includes two working fluids for the bottoming cycle to check for the reliability of the tool handling different organic fluids. However, no experimental results for the part-load operation of a GT-ORC are used for the validation of the tool. Gas turbine performance data do not require validation as they are extracted from the commercial software, GT MASTER. The simulation results and the corresponding data published in [17] are shown in Table 2. The relative errors for the ORC efficiency are below 1% in both full load and 50% gas turbine load conditions. Thus, it could be concluded that the simulation results are in good agreement with published reference data. It could be confirmed that the developed in-house tool is capable of reliable performance simulation of GT-ORC systems in the range of load demands from the gas turbine.
Table 2.
Results from the tool verification.
3. Results and Discussions
An organic Rankine cycle is designed as a bottoming cycle in two cases of gas turbine topping cycle (cases A and B). Off-design performance of the ORC and combined cycle are investigated with four control strategies: the proposed VAN turbine logic, sliding pressure, partial admission turbine, and throttling valve logic. Improvement made through the presented VAN turbine logic is then compared with other candidate strategies. The effect of different gas turbine control logics on the proposed ORC part-load strategy is studied to find out which gas turbine part-load strategy gives better performance with the proposed solution.
3.1. Design Point
On-design characteristics of the gas turbine topping cycle were tabulated for the selected gas turbine in Table 1. The bottoming cycle is designed according to requirements and practical limitations offshore. Figure 6 shows the results of the parametric study conducted on condensing and evaporation temperatures to find the best possible cycle efficiency while looking after design limitations. Larger evaporation to condensing temperature ratio makes better efficiency for the cycle (Figure 6c), but it requires higher pressure ratios across the turbine which increases turbine weight and size.
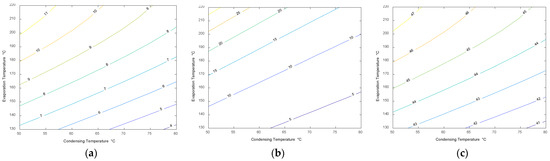
Figure 6.
Parametric study: (a) ORC power; (b) ORC pressure ratio; (c) Combined cycle efficiency.
Figure 6 shows that for a specific condensing temperature, net power output and efficiency increases with evaporation temperature. However, the evaporation temperature is limited to the working fluid thermal decomposition temperature in a Rankine cycle [34]. The turbine pressure ratio assigned to each design choice is depicted in Figure 6b. In practice, a radial inflow turbine may be safely designed with a pressure ratio of 9 or 27 for two or three stages, respectively. Although radial inflow turbines are suggested by many authors for working with organic fluids in offshore applications, axial turbines can also be used if chosen. One should note that too high pressures require heavier facilities and reduce the safety level of the system. On the other hand, too low pressure-ratios give a poor performance to the cycle. The pressure ratio between condensation and evaporation should be practical so that it could be handled by the turbomachinery components.
Setting heat exchanger pinch point limit to 10 °C, the optimum ORC mass flow rate is 106 kg/s. Higher specific power (power per mass flow rate) means more compact designs for a required power or more power available in a given area. So, the mass flow rate is selected as low as possible for the specific power output. Mass flow rates that lead to heat exchanger pinch point temperatures less than allowed heat exchanger pinch point are omitted though.
Cyclopentane is selected as the bottoming cycle working fluid due to favourable pressure values in the working temperature range, less hazardous level, and less environmental impact. Cyclopentane properties are tabulated in Table 3. A 5 °C superheating is applied to evaporator discharge assuring pure vapour phase entering the turbine. As superheating occurs in a gas-gas heat exchanger and occupies a large space, a high degree of superheating is not desired in offshore applications. The design point properties of the designed cycle are presented in Table 4.
Table 3.
Cyclopentane specifications as ORC working fluid (Reprinted with permission from [7]).
Table 4.
On-design properties of designed ORC.
3.2. Part-Load Operation
The part-load performance of the gas turbine is illustrated in Figure 1b for both gas turbine cases. As shown, the exhaust temperature of SGT800 with IGV control is almost constant in part loads while it decreases for the no-IGV control case. Constant part-load exhaust temperature is a favourable characteristic for a gas turbine working with bottoming cycles. Lower gas turbine exhaust temperature in part loads may limit the capacity or efficiency of the bottoming cycle since it forces the ORC to work far from an optimum operational point due to approach temperature limitation in the heat exchangers.
Figure 7 illustrates the optimized ORC turbine inlet pressure in four off-design control logic cases. The pressure is selected in each gas turbine load such that the maximum possible cycle efficiency is achieved. Figure 8 illustrates how the control manipulating parameters are adjusted in the four control logics. The manipulating parameter in the VAN turbine case is the percentage of opening in the stator vane throat area. For the other three strategies, the manipulating parameters are ORC pump speed, turbine arc admission ratio, and throttling valve area ratio (or pressure ratio here) in the cases of sliding pressure, partial admission turbine and throttling valve control logic, respectively.
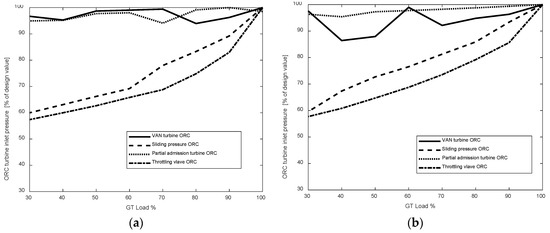
Figure 7.
ORC turbine inlet pressure in off-design conditions: (a) case A; (b) case B.
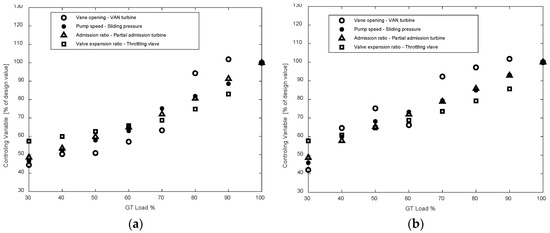
Figure 8.
Control manipulating variables in different control strategies: (a) case A; (b) case B.
Off-design heat transfer coefficient and pressure loss are illustrated in Figure 9. As lower mass flow rate and lowest Reynolds number are seen in part-load, the pressure loss and heat transfer coefficient decrease in off-design conditions. Having a lower Reynolds number in fully turbulent flows through the heat exchanger tubes degrades the mixing rate in the flow. It is known that mixing and flow eddies are the main agents for heat transfer in a turbulent pipe flow.
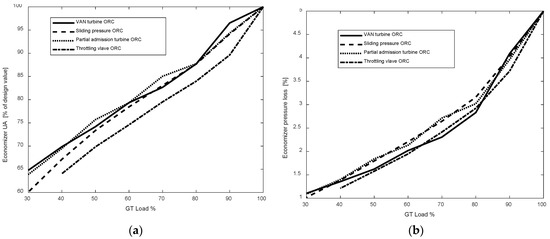
Figure 9.
Economizer off-design characteristics: (a) heat transfer coefficient; (b) pressure loss.
Figure 10a and Figure 11a show the organic Rankine cycle efficiency in part loads. While efficiency drops to 86% of design value at 30% load with SP control strategy, it remains above 96% of design efficiency with the suggested VAN turbine strategy until 30% load (case A). This means a 12% compensation of bottoming cycle efficiency loss in 30% gas turbine load. Reduced heat available from the gas turbine at loads lower than 50% requires the cycle mass flow rate to be reduced in the bottoming cycle. Consequently, evaporation pressure decays with a reduction of mass flow in the SP approach because of radial inflow turbine characteristics. In contrast to this, the VAN turbine allows the reduction of mass flow rate without considerable change in the turbine inlet pressure. Part-load pressures and temperatures of the cycle remain close to design values, thus allowing for having an almost constant cycle efficiency for the bottoming cycle at part loads (Figure 7).
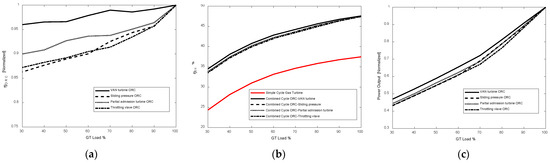
Figure 10.
Part-load performance case A: (a) ORC efficiency; (b) Combined cycle efficiency; (c) ORC power output.
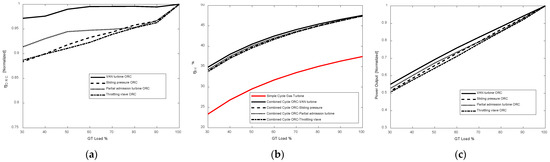
Figure 11.
Part-load performance case B: (a) ORC efficiency; (b) Combined cycle efficiency; (c) ORC power output.
Figure 10b and Figure 11b show plant efficiency in part loads with five cycle configurations: simple cycle gas turbine, combined cycle with VAN turbine, sliding pressure, partial admission turbine and throttling valve control ORC. The bottoming cycle has improved plant efficiency at 50% load from 30% (simple cycle gas turbine) to 40% (SP controlled combined cycle) or 41% (VAN turbine controlled combined cycle). The improvement in design point full load is 11 efficiency points with the presented combined cycle. Assuming 250 g/kWh CO2 emission, this means a 33-kiloton reduction of CO2 emission yearly for a single 47 MW gas turbine working at full load. Proposed VAN turbine logic improved 1.0 efficiency points for the combined cycle in comparison to the sliding pressure controller at 50% gas turbine load. The outcome is a 2.6% relative reduction in CO2 emission yearly in a combined gas turbine cycle which is mostly working at loads equal to or lower than 50%. The VAN turbine part-load strategy shows 10% relative higher bottoming cycle power than SP in 30% load. (Figure 10c and Figure 11c). The increment is almost the same for the both control strategies.
Although bottoming cycle has the same design point efficiency value for both cases, part-load efficiency decreases more for decreasing exhaust temperature gas turbine (case A). The reason is that exhaust heat is delivered at lower temperatures to the bottoming cycle. In such cases, a conventional SP controller limits evaporation temperature and put the plant in a less efficient thermodynamic cycle.
4. Conclusions
An organic Rankine bottoming cycle was designed for harvesting gas turbine waste heat and improving power generation efficiency in offshore oil platforms.
A VAN turbine control strategy for the ORC was proposed to enhance the part-load efficiency. With the suggested VAN turbine logic, the bottoming cycle efficiency was kept above 97% of design value in the range of 30% to 100% gas turbine load (case B). This was achieved while it falls to 88% of design value with the SP control strategy. As offshore gas turbines and combined cycles are expected to work mostly in 50% load or lower, this part-load improvement can get more attention in the application.
Two gas turbine operation cases were studied in combination with four ORC control logics. The gas turbine with constant exhaust temperature pattern showed better plant efficiency in part loads than gas turbine with decreasing exhaust temperature pattern. For the non-IGV gas turbine mode, combined cycle efficiency falls to 34% of design value in 30% gas turbine load. While for the IGV-operated mode, combined cycle efficiency falls to 35% of design value in 30% load. This suggests that gas turbines with constant part-load exhaust temperature are a better choice for offshore ORC combined cycle applications in the sense of part-load efficiencies.
The ORC bottoming cycle technology for offshore oil and gas installations is not fully commercially available yet. Design and assessment of the presented control strategy contribute to achieving an up to date understanding of ORC applicability based on the latest requirements in the offshore oil and gas industry. The research results pointed out for offshore ORC bottoming cycles the possibility of a 2.5% CO2 emission reduction in low load (30–50%) working conditions relative to state-of-the-art operational strategies. The outcome got significance as many gas turbines are expected to work at low loads in offshore applications. The outcome showed superiority of gas turbine constant exhaust temperature control over decreasing temperature when they are used as the topping cycle to the ORCs with the presented control strategy. The results can be used for further development of part-load efficient ORC controllers in offshore applications. The suggested approach could be applied to steam bottoming cycles as a part-load efficiency booster. Detailed design development and study of the dynamic behaviour of the control logic are left for future works.
Author Contributions
M.A.M. developed the modelling tool, carried out the simulations, formal data analysis, and wrote the manuscript. L.O.N. contributed to the critical analysis of the results, reviewed the manuscript, and supervised the work. Both share the effort of conceptualization of the idea. All authors have read and agreed to the published version of the manuscript.
Funding
This publication has been produced with support from the LowEmission Research Centre (www.lowemission.no (accessed on 11 November 2021)), performed under the Norwegian research program PETROSENTER. The authors acknowledge the industry partners in LowEmission for their contributions and the Research Council of Norway (296207).
Conflicts of Interest
The authors declare no conflict of interest.
Nomenclature
| A | heat exchanger area |
| C | heat capacity |
| CR | heat exchanger heat capacity ratio |
| turbine isentropic speed (m/s) | |
| skin friction factor | |
| D | diameter (m) |
| f | Fanning friction factor |
| enthalpy (J/kg) | |
| K | thermal conductivity |
| mass flow rate (kg/s) | |
| N | rotational speed |
| Nu | Nusselt number |
| P | pressure (Pa) |
| Pr | Prandtl number |
| PR | component pressure ratio |
| Q | volume flow rate |
| Re | Reynolds number |
| T | temperature (K) |
| U | impeller tip speed (m/s) or overall heat transfer coefficient |
| x | length (m) |
| turbine specific speed | |
| velocity (m/s) | |
| power (W) | |
| Greek letters | |
| part-load turbine manipulating variable | |
| heat transfer coefficient ratio | |
| efficiency | |
| cycle pressure ratio | |
| density | |
| surface roughness | |
| Subscripts | |
| 0 | Total |
| c | heat exchanger cold side, or corrected |
| cond. | related to condenser |
| D | based on diameter |
| ds | design point |
| econ. | related to economizer |
| evap. | related to evaporator |
| h | heat exchanger hot side |
| i | inlet |
| max | maximum |
| min | minimum |
| o | outlet |
| pump | related to pump |
| rel | relative |
| s | isentropic |
| turb. | related to turbine |
References
- Walnum, H.T.; Nekså, P.; Nord, L.O.; Andresen, T. Modelling and simulation of CO2 (carbon dioxide) bottoming cycles for offshore oil and gas installations at design and off-design conditions. Energy 2013, 59, 513–520. [Google Scholar] [CrossRef]
- Sølvberg, I. Resource Report—Fields and Discovery; The Norwegian Petroleum Directorate: Stavanger, Norway, 2019; pp. 47–53. [CrossRef]
- IEA. The Future of Hydrogen: Seizing Today’s Opportunities. In Proceedings of the G20 Summit, Osaka, Japan, 28–29 June 2019; p. 203. [Google Scholar]
- Omar, A.; Saghafifar, M.; Mohammadi, K.; Alashkar, A.; Gadalla, M. A review of unconventional bottoming cycles for waste heat recovery: Part II—Applications. Energy Convers. Manag. 2019, 180, 559–583. [Google Scholar] [CrossRef]
- Pierobon, L.; Benato, A.; Scolari, E.; Haglind, F.; Stoppato, A. Waste heat recovery technologies for offshore platforms. Appl. Energy 2014, 136, 228–241. [Google Scholar] [CrossRef]
- Del Turco, P.; Asti, A.; Scotti Del Greco, A.; Bacci, A.; Landi, G.; Seghi, G. The ORegen™ Waste Heat Recovery Cycle: Reducing the CO2 Footprint by Means of Overall Cycle Efficiency Improvement. In Proceedings of the ASME Turbo Expo, Vancouver, BC, Canada, 6–10 June 2011; pp. 547–556. [Google Scholar]
- Pierobon, L.; Larsen, U.; van Nguyen, T.; Haglind, F. Optimization of organic rankine cycles for off-shore applications. Proceedings of ASME Turbo Expo, San Antonio, TX, USA, 3–7 June 2013; pp. 1–11. [Google Scholar] [CrossRef]
- Riboldi, L.; Nord, L.O. Concepts for lifetime efficient supply of power and heat to offshore installations in the North Sea. Energy Convers. Manag. 2017, 148, 860–875. [Google Scholar] [CrossRef]
- Burton, T.; Sharpe, D.; Jenkins, N.; Bossanyi, E. Wind Energy Handbook; John Wiley & Sons, Ltd.: Hoboken, NJ, USA, 2001. [Google Scholar]
- Barnhart, C.J. Energy and Carbon Intensities of Stored Wind Energy. In Wind Energy Engineering: A Handbook for Onshore and Offshore Wind Turbines; Elsevier Inc.: Amsterdam, The Netherlands, 2017; pp. 377–387. [Google Scholar]
- Mazzetti, M.J.; Ladam, Y.; Walnum, H.T.; Hagen, B.L.; Skaugen, G.; Nekså, P. Flexible Combined Heat and Power Systems for Offshore Oil and Gas. In Proceedings of the ASME Power Conference (POWER2014-32169), Baltimore, MD, USA, 28–31 July 2014; pp. 1–8. [Google Scholar]
- Nord, L.O.; Montañés, R.M. Compact steam bottoming cycles: Model validation with plant data and evaluation of control strategies for fast load changes. Appl. Therm. Eng. 2018, 142, 334–345. [Google Scholar] [CrossRef]
- van Nguyen, T.; Voldsund, M.; Breuhaus, P.; Elmegaard, B. Energy efficiency measures for offshore oil and gas platforms. Energy 2016, 117, 325–340. [Google Scholar] [CrossRef]
- Cao, Y.; Dai, Y. Comparative analysis on off-design performance of a gas turbine and ORC combined cycle under different operation approaches. Energy Convers. Manag. 2017, 135, 84–100. [Google Scholar] [CrossRef]
- Fu, B.R.; Hsu, S.W.; Lee, Y.R.; Hsieh, J.C.; Chang, C.M.; Liu, C.H. Effect of off-design heat source temperature on heat transfer characteristics and system performance of a 250-kW organic Rankine cycle system. Appl. Therm. Eng. 2014, 70, 7–12. [Google Scholar] [CrossRef]
- Casartelli, D.; Binotti, M.; Silva, P.; Macchi, E.; Roccaro, E.; Passera, T. Power Block Off-design Control Strategies for Indirect Solar ORC Cycles. Energy Procedia 2015, 69, 1220–1230. [Google Scholar] [CrossRef]
- de Escalona, J.M.M.; Sánchez, D.; Chacartegui, R.; Sánchez, T. Part-load analysis of gas turbine & ORC combined cycles. Appl. Therm. Eng. 2012, 36, 63–72. [Google Scholar] [CrossRef]
- Cao, Y.; Gao, Y.; Zheng, Y.; Dai, Y. Optimum design and thermodynamic analysis of a gas turbine and ORC combined cycle with recuperators. Energy Convers. Manag. 2016, 116, 32–41. [Google Scholar] [CrossRef]
- Chacartegui, R.; Sánchez, D.; Muñoz, J.M.; Sánchez, T. Alternative ORC bottoming cycles FOR combined cycle power plants. Appl. Energy 2009, 86, 2162–2170. [Google Scholar] [CrossRef]
- Carcasci, C.; Ferraro, R.; Miliotti, E. Thermodynamic analysis of an organic Rankine cycle for waste heat recovery from gas turbines. Energy 2014, 65, 91–100. [Google Scholar] [CrossRef]
- Khaljani, M.; Saray, R.K.; Bahlouli, K. Thermodynamic and thermoeconomic optimization of an integrated gas turbine and organic Rankine cycle. Energy 2015, 93, 2136–2145. [Google Scholar] [CrossRef]
- Nami, H.; Ertesvåg, I.S.; Agromayor, R.; Riboldi, L.; Nord, L.O. Gas turbine exhaust gas heat recovery by organic Rankine cycles (ORC) for offshore combined heat and power applications—Energy and exergy analysis. Energy 2018, 165, 1060–1071. [Google Scholar] [CrossRef]
- GT MASTER Version 29.0; Thermoflow Inc.: Fayville, MA, USA, 2016; Available online: http://www.thermoflow.com/UpdateLetters/TF8_UPDATE_LETTER.html (accessed on 11 November 2021).
- Hu, D.; Li, S.; Zheng, Y.; Wang, J.; Dai, Y. Preliminary design and off-design performance analysis of an Organic Rankine Cycle for geothermal sources. Energy Convers. Manag. 2015, 96, 175–187. [Google Scholar] [CrossRef]
- Manente, G.; Toffolo, A.; Lazzaretto, A.; Paci, M. An Organic Rankine Cycle off-design model for the search of the optimal control strategy. Energy 2013, 58, 97–106. [Google Scholar] [CrossRef]
- Meitner, P.L.; Glassman, A.J. Off-Design Performance Loss Model for Radial Turbines with Pivoting, Variable-Area Stators; National Aeronautics and Space Administration Cleveland Oh Lewis Research Center: Cleveland, OH, USA, 1980. [Google Scholar]
- Hagen, B.A.L.; Agromayor, R.; Nekså, P. Equation-oriented methods for design optimization and performance analysis of radial inflow turbines. Energy 2021, 237, 121596. [Google Scholar] [CrossRef]
- Wang, H.; Luo, K.; Huang, C.; Zou, A.; Li, D.; Qin, K. Numerical investigation of partial admission losses in radial inflow turbines. Energy 2022, 239, 121870. [Google Scholar] [CrossRef]
- Hagen, B.A.L.; Nikolaisen, M.; Andresen, T. A novel methodology for Rankine cycle analysis with generic heat exchanger models. Appl. Therm. Eng. 2020, 165, 114566. [Google Scholar] [CrossRef]
- Dhar, P.L. Thermal System Design and Simulation; Elsevier Ltd.: Amsterdam, The Netherlands, 2016. [Google Scholar]
- NPhu, M.; Trinh, N.T.M. Modelling and experimental validation for off-design performance of the helical heat exchanger with LMTD correction taken into account. J. Mech. Sci. Technol. 2016, 30, 3357–3364. [Google Scholar] [CrossRef]
- Selander, W.N. Explicit Formulas for the Computation of Friction Factors in Turbulent Pipe Flow; Energy Can Ltd. AECL Rep., No. 6354; Atomic Energy of Canada Ltd.: Chalk River, ON, Canada, 1978. [Google Scholar]
- Bell, I.H.; Wronski, J.; Lemort, Q.; Lemort, V. Pure and pseudo-pure fluid thermophysical property evaluation and the open-source thermophysical property library CoolProp. Ind. Eng. Chem. Res. 2014, 53, 2498–2508. [Google Scholar] [CrossRef]
- Rajabloo, T.; Bonalumi, D.; Iora, P. Effect of a partial thermal decomposition of the working fluid on the performances of ORC power plants. Energy 2017, 133, 1013–1026. [Google Scholar] [CrossRef]


Publisher’s Note: MDPI stays neutral with regard to jurisdictional claims in published maps and institutional affiliations. |
© 2021 by the authors. Licensee MDPI, Basel, Switzerland. This article is an open access article distributed under the terms and conditions of the Creative Commons Attribution (CC BY) license (https://creativecommons.org/licenses/by/4.0/).