Article

Assessment of the Impact of Applying a Non-Factory Dual-Fuel (Diesel/Natural Gas) Installation on the Traction Properties and Emissions of Selected Exhaust Components of a Road Semi-Trailer Truck Unit

by
Mirosław Karczewski
* and
Marcin Wieczorek
Faculty of Mechanical Engineering, Military University of Technology in Warsaw, 00-908 Warsaw, Poland
*
Author to whom correspondence should be addressed.
Energies 2021, 14(23), 8001; https://doi.org/10.3390/en14238001
Submission received: 5 November 2021 / Revised: 22 November 2021 / Accepted: 28 November 2021 / Published: 30 November 2021

Abstract

:
Problems such as global warming and rising oil prices are driving the implementation of ideas to reduce liquid fuel consumption and greenhouse gas emissions. One of them is the use of natural gas as an energy source. It is a hydrocarbon fuel with properties that allow the reduction of CO2 (Carbon Dioxide) emissions during combustion. Solutions are being implemented that allow for the use of natural gas to means of transport, namely in trucks of various categories and intended use. These installations are used in new vehicles, but also in the form of conversion for used cars, usually several years old. The article presents the results of tests of an engine from a used semi-trailer truck with a mileage of approx. 800 thousand km, with the compressed natural gas supply system installed. This installation (hardware and software), depending on the engine operating conditions, enables the replacement of up to 80% of diesel (base fuel) with natural gas. The impact of changing the fuel supply method on the traction characteristics calculated with the use of external characteristics of both conventional and dual-fuel mode was assessed. The emissions of exhaust gas components were also determined under the conditions of the UNECE Regulation No. 49. The test results confirm that compared to conventional fueling, dual fueling allows for a significant reduction in CO2 emissions, even in a used vehicle with high mileage. The use of a non-factory installation did not significantly affect the traction properties of the vehicle, and engine wear is of greater importance in this case (comparison with factory data). The work is a valuable supplement to the results of the research in which the impact of the use of a non-factory CNG (Compressed Natural Gas) supply system on the performance of a semi-trailer truck unit equipped with such an installation was assessed compared to a semi-trailer truck unit powered in a classic way with diesel fuel.

1. Introduction

Along with the development of civilization and the increase in consumerism, the demand for the transport of goods using wheeled vehicles is also increasing [1,2]. This is especially true in cities where people have to deal with the negative health effects of pollution caused by an increasing number of vans and trucks [3,4]. It is estimated that only in Poland, about 50,000 people die each year due to bad air quality, or even twice as much, taking into account the percentage of deaths in Europe caused by exposure to fine particulate matter (PM 2.5) created as a result of burning fossil fuels for a population over 14 years old [5]. Typical airborne dust concentrations can vary from 0.01 mg/m3 in clean rural environments to about 20 g/m3 in desert conditions [6]. The basic components of road dust are silica (SiO2) and corundum (Al2O3), the content of which in the total mass of dust can reach up to 95%. The grains of these minerals are characterized by high hardness, 7 and 9 degrees on the ten-point Mohs scale, respectively, and irregular shape [7].
Public transport seems to offer a more rational use of the environment [8] by reducing fuel consumption, exhaust emissions [9,10,11] and noise. The concept of sustainable transport combines high-quality transport with care for the environment [12]. Therefore, these vehicles should have a power source other than diesel or gasoline. Of course, reducing CO2 emissions from transport can improve quality of life, but other factors such as access, amenities and safety need to be taken into account [13].
Currently, it is particularly important to reduce the emission of harmful exhaust gas components through the development of low-emission urban transport and road transport of goods [14,15,16]. Importantly, according to the statistics published by the Barcelona Institute for Global Health [17], on the list of the 50 most polluted cities in the EU (European Union), 15 are in Poland.
The data of the European Environment Agency [18] show that transport in the European Union causes a systematic increase in the emission of harmful substances, mainly greenhouse gases. In the years 1990–2015, it reached a level of about 35% [18]. Therefore, the European Commission began to take decisions aimed at reducing the consumption of fossil fuels and their negative impact on the environment. It was assumed that it is necessary to reduce greenhouse gas (GHG) emissions by 2050 by at least 60% compared to 1990 levels. This is particularly important for road transport, as it dominates freight transport in the European Union (about 75% of total transport in 2018) [19].
An example of such activities may be the increasing restrictiveness of requirements for products formed during the combustion of a fuel mixture. Their implementation means that, for example, even relatively new semi-trailer truck units (5 years old) are classified as polluting and their use is subject to additional fees, e.g., increased road fees or extra ecological taxes. This forces vehicle manufacturers to seek technical solutions that reduce harmful emissions. It seems obvious to build trucks with hybrid or electric engines only. However, in this case, range is still a limitation, which for an electric car with medium load capacity is currently around 400 km, while for a semi-trailer truck unit, it is, according to the available data, only 100–300 km [20]. In addition, the price of an electric semi-trailer truck unit in 2021 was five to eight times higher than the price of the same conventional semi-trailer truck (DAF, Volvo and Scania as an example). In addition, the increase in the weight of the semi-trailer truck unit as a result of the use of heavy batteries reduces the weight of the load that can be transported, and the loading process is time-consuming. Both of these elements have a strongly negative impact on the logistic costs of using such a vehicle. Therefore, a good direction of changes is still the introduction of more environmentally friendly solutions in road transport, mainly through the use of ecological or alternative fuels to diesel, including natural gas in various forms such as Compressed or Liquid Natural Gas (CNG—LNG).
The combustion of natural gas, due to its different composition compared to diesel fuel with a lower share of carbon and a greater share of hydrogen, results in lower carbon dioxide emissions and reduces greenhouse gas emissions and the toxicity of the resulting exhaust gases. In the short and medium term, natural gas may become the most important alternative fuel [21,22]. Large natural gas resources increase its importance as an ecological fuel, which can be obtained to a large extent from the countries’ own sources. In addition, many European countries have a well-developed infrastructure adapted to distribution of CNG and LNG. Natural gas is also a relatively cheap fuel in relation to diesel. In 2020, the average price of natural gas accounted for approx. 60% of the diesel fuel price. Taking into account its lower energy value compared to petroleum-derived fuels, the average cost of using natural gas to drive heavy transport vehicles is about 40% lower than that of diesel fuel [23].
The properties of natural gas (in particular in the form of compressed CNG) in terms of the use of internal combustion engines in transport/utility vehicles to power reciprocating internal combustion engines, the availability of resources and the growing sources of supply in individual European countries justify undertaking scientific, research and development works on the use of CNG to power internal combustion engines of heavy transport vehicles. This is in line with the energy policy of the European Union—Directive 2009/33/EC of 23 April 2009—on the promotion of ecologically clean and energy-efficient road transport vehicles. The presented work is an example of such activities. It describes the effects (measured and calculated) of the application of an innovative concept of effective adaptation of a semi-trailer truck engine to CNG in dual-fuel mode. The method of fuel suppling in dual-fuel engines can be implemented in many different ways. For a given application, those that can be used in a given implementation are selected. The basic method of supplying gas fuel is through the intake manifold to the interior of the engine. This solution is the original solution from which it is worth starting the research of a given dual-fuel engine. Further modifications that can be applied to the tested engine include the introduction of direct gas injection into the combustion chamber and multiple fuel injection, allowing the ignition of the mixture in alternative modes of compression ignition, such as Reactivity Controlled Compression Ignition (RCCI) or Direct Dual Fuel Stratification (DDFS) [24]. To achieve mentioned ignition methods, it is required to create a homogeneous mixture of gaseous fuel with air, which requires interference in the structure of the engine intake system and the combustion chamber, in which the level of the mixture swirling should change [25].
The operation of an internal combustion engine in which a homogeneous mixture of fuel and air is self-igniting differs significantly from classic internal combustion engines, primarily in terms of efficiency and emission of harmful exhaust components. Increasing the thermal efficiency of such an engine is related to the reduction of emissions of many harmful exhaust components, the emission of which is difficult to reduce in a long-term manner with the use of an engine’s exhaust aftertreatment system. This will have a major impact on human health and environmental pollution in the future.
The article is part of the topicality of the problem of searching for new concepts of propulsion of the means of transport focused on pro-ecological solutions and alternative fuels. The developed methodology of tractive effort curvess and ecological properties of CNG-powered trucks will allow for the classification of this fuel for the propulsion of motor vehicles. Currently, most researchers focus on assessing the ecological properties of CNG-powered vehicles, without taking into account driving performance after changing the engine fueling method. In the case of the mass transport of goods with the use of a road semi-trailer truck unit, their mechanics of movement are of great importance, which is discussed in this paper.

2. Purpose, Object and Research Plan

The main goal of the research was to assess the impact of the use of CNG supply on the ecological parameters of vehicles in terms of their use in natural operation in the transport of goods compared to vehicles powered by conventional fuel. Particular emphasis was placed on the comparison of the vehicle’s tractive force and their ecological properties in relation to the same vehicle powered by diesel fuel only. During the research, an innovative high-pressure indirect CNG injection system was used to supply the engine. The mentioned CNG injection system was developed in cooperation with the Military University of Technology in Warsaw.
The aim of the research was to experimentally determine how the application of a non-factory diesel/CNG dual-fuel installation to a used tractor unit of a tractor engine with a semi-trailer affects its tractive effort curves and changes the emissions of individual exhaust components: NO (Nitrogen Oxide), NO2, (Nitrogen Dioxide) NOx (Nitrogen Oxides), CH4 (Methane), CO (Carbon Dioxide), CO2 (Carbon Dioxide), HC (Hydrocarbons) and smoke opacity in the test cycle carried out in accordance with the requirements of the UNECE Regulation No. 49.
The investigation was led on a standard dynamometer stand. The engine was load by the Zöllner PS1-3812/AE water dynamometer with 1250 kW maximum power. Torque produced by dynamometer was measured with tensometric transducer. Rotational speed was measured with pulse transducer in cooperation with toothed wheel, which was on a dynamometer flange. Measuring of fuel consumption was led with AVL Fuel Balance every 5 s (diesel) and SwirlMaster FSS450 Intelligent Swirl Flowmeter (CNG). Temperature of cooling liquid was controlled on the level 85 ÷ 90 °C using an external heat exchanger. Table 1 presents the basic technical parameters of the investigation equipment used.
The tests and calculations were carried out for the D13C460 EURO V EEV (Enhanced Environmentally friendly Vehicle) (338 kW) engine, used in the Volvo FH13 series semi-trailer truck (Figure 1). The mileage of the semi-trailer truck, the unit of which was tested on an engine dynamometer and on which a non-factory diesel/CNG installation was adapted, was 790,500 km. The total operating time of the engine is 11,800 h, the engine has used 229,100 liters of diesel fuel since the beginning of its operation. The tested engine, according to the approval documents, met the requirements of the EURO V standard when it left the factory.
The planned tests were divided into the following steps:
  • Determination of the external characteristics of the D13C460 engine when fueled by the basic fuel, which was diesel;
  • Determination of the external characteristics of the D13C460 engine with a diesel/CNG supply system installed and optimized on a dynamometric test bench during dual fuel operation;
  • An assessment of the impact of the dual-fuel diesel/CNG supply of the D13C460 engine on the tractive effort curves of a semi-trailer truck and semi-trailer combination with a total weight of 40 tons;
  • An assessment of the impact of the dual fuel diesel/CNG supply on the emission of the toxic exhaust gas components during the research test in accordance with the requirements of the UNECE Regulation No. 49.

2.1. Determination of the External Characteristics of the Engine

The work began with the determination of the external characteristics of the D13C460 engine, which was dismantled from the semi-trailer truck unit. The test was performed on a dynamometric stand located in the Department of Engines and Exploitation Engineering of the Military University of Technology in Warsaw. Commercial diesel fuel was used to power the engine. Due to the design limitations of the dynamometric brake used, the external characteristics were determined in the speed range from 900 rpm to 2100 rpm (compared to the factory data, the area of low values was omitted—from 600 rpm to 900 rpm).
The engine was equipped with a power supply system that allows two types of fuel (diesel and CNG) to be delivered to the cylinders. In the course of adaptation activities, it was subjected to the optimization process, in which the main criterion was the maximum replacement of diesel oil by CNG, taking into account the influence of the current engine operating conditions (an appropriate example of a gas replacement map is shown later. After this determination, the values of the torque and the effective power of the engine as a function of the rotational speed of the engine crankshaft were again carried out. The test results are summarized in Figure 2 and Table 2 (additionally, for comparative purposes, the manufacturer’s catalog characteristics were also taken into account—marked as factory data).
The external characteristics determined in this way were used to assess the impact of the change in the power supply method on the tractive effort curves of a fully loaded (total weight 40 tons) semi-trailer truck and semi-trailer unit.

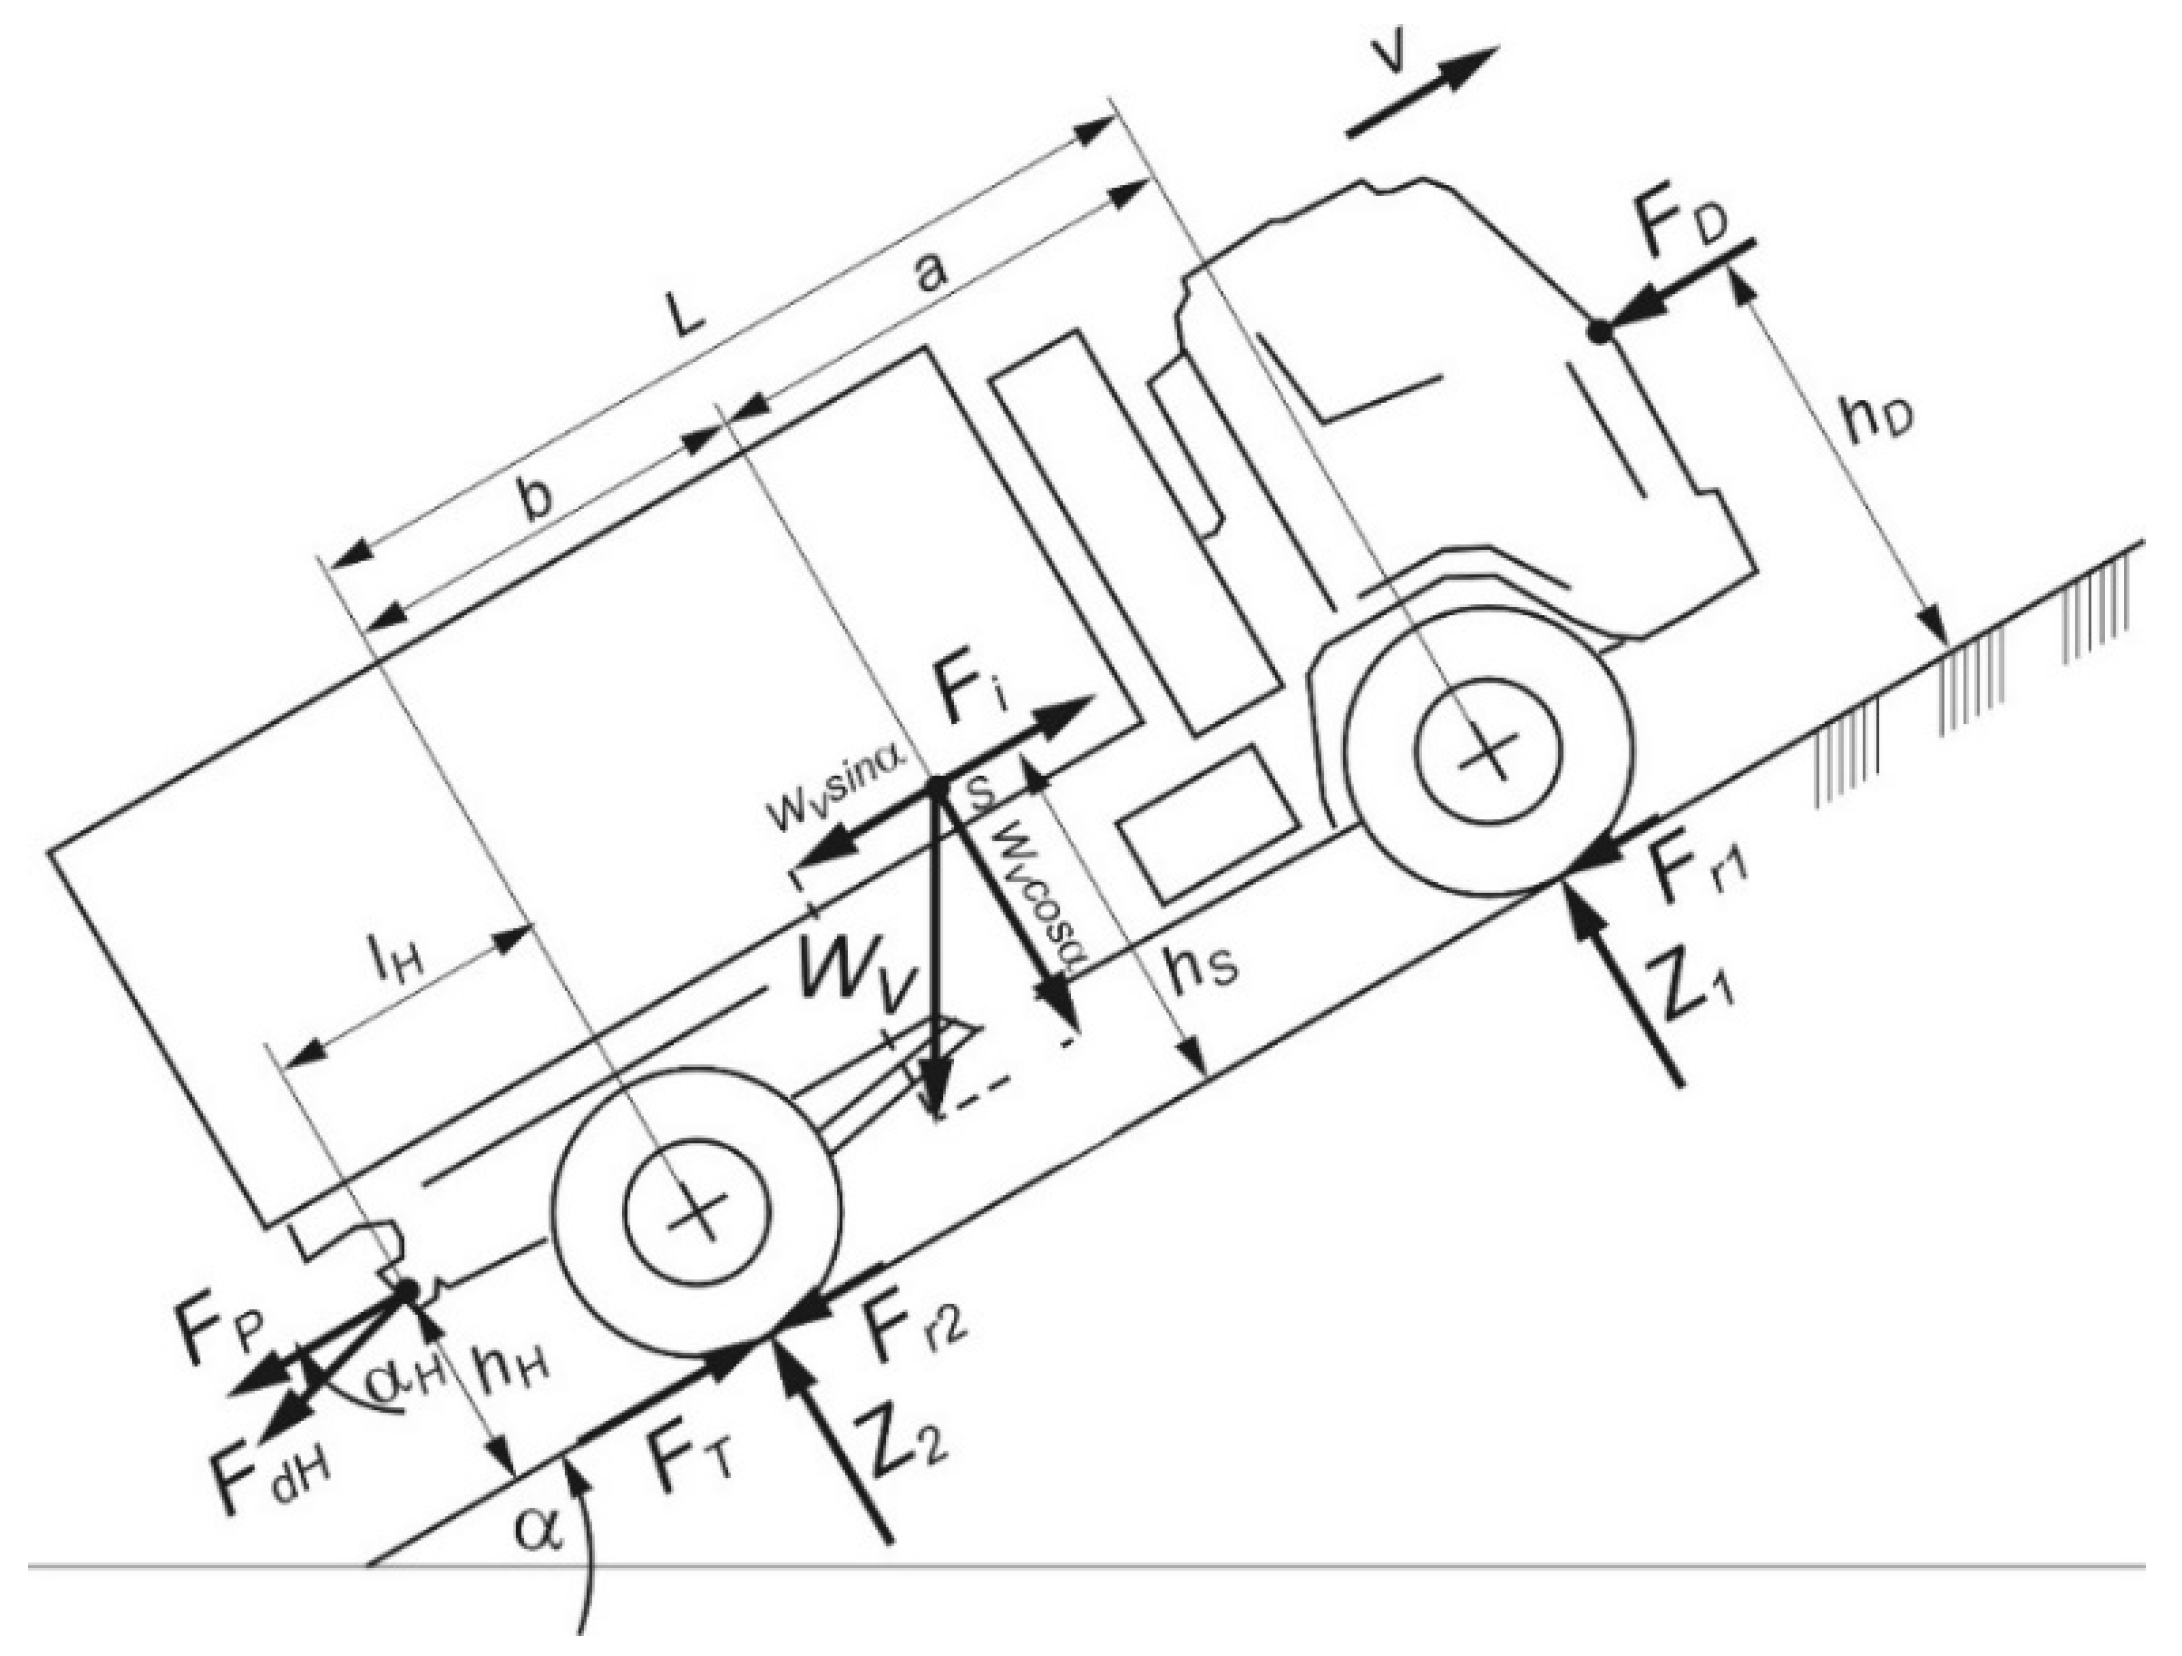
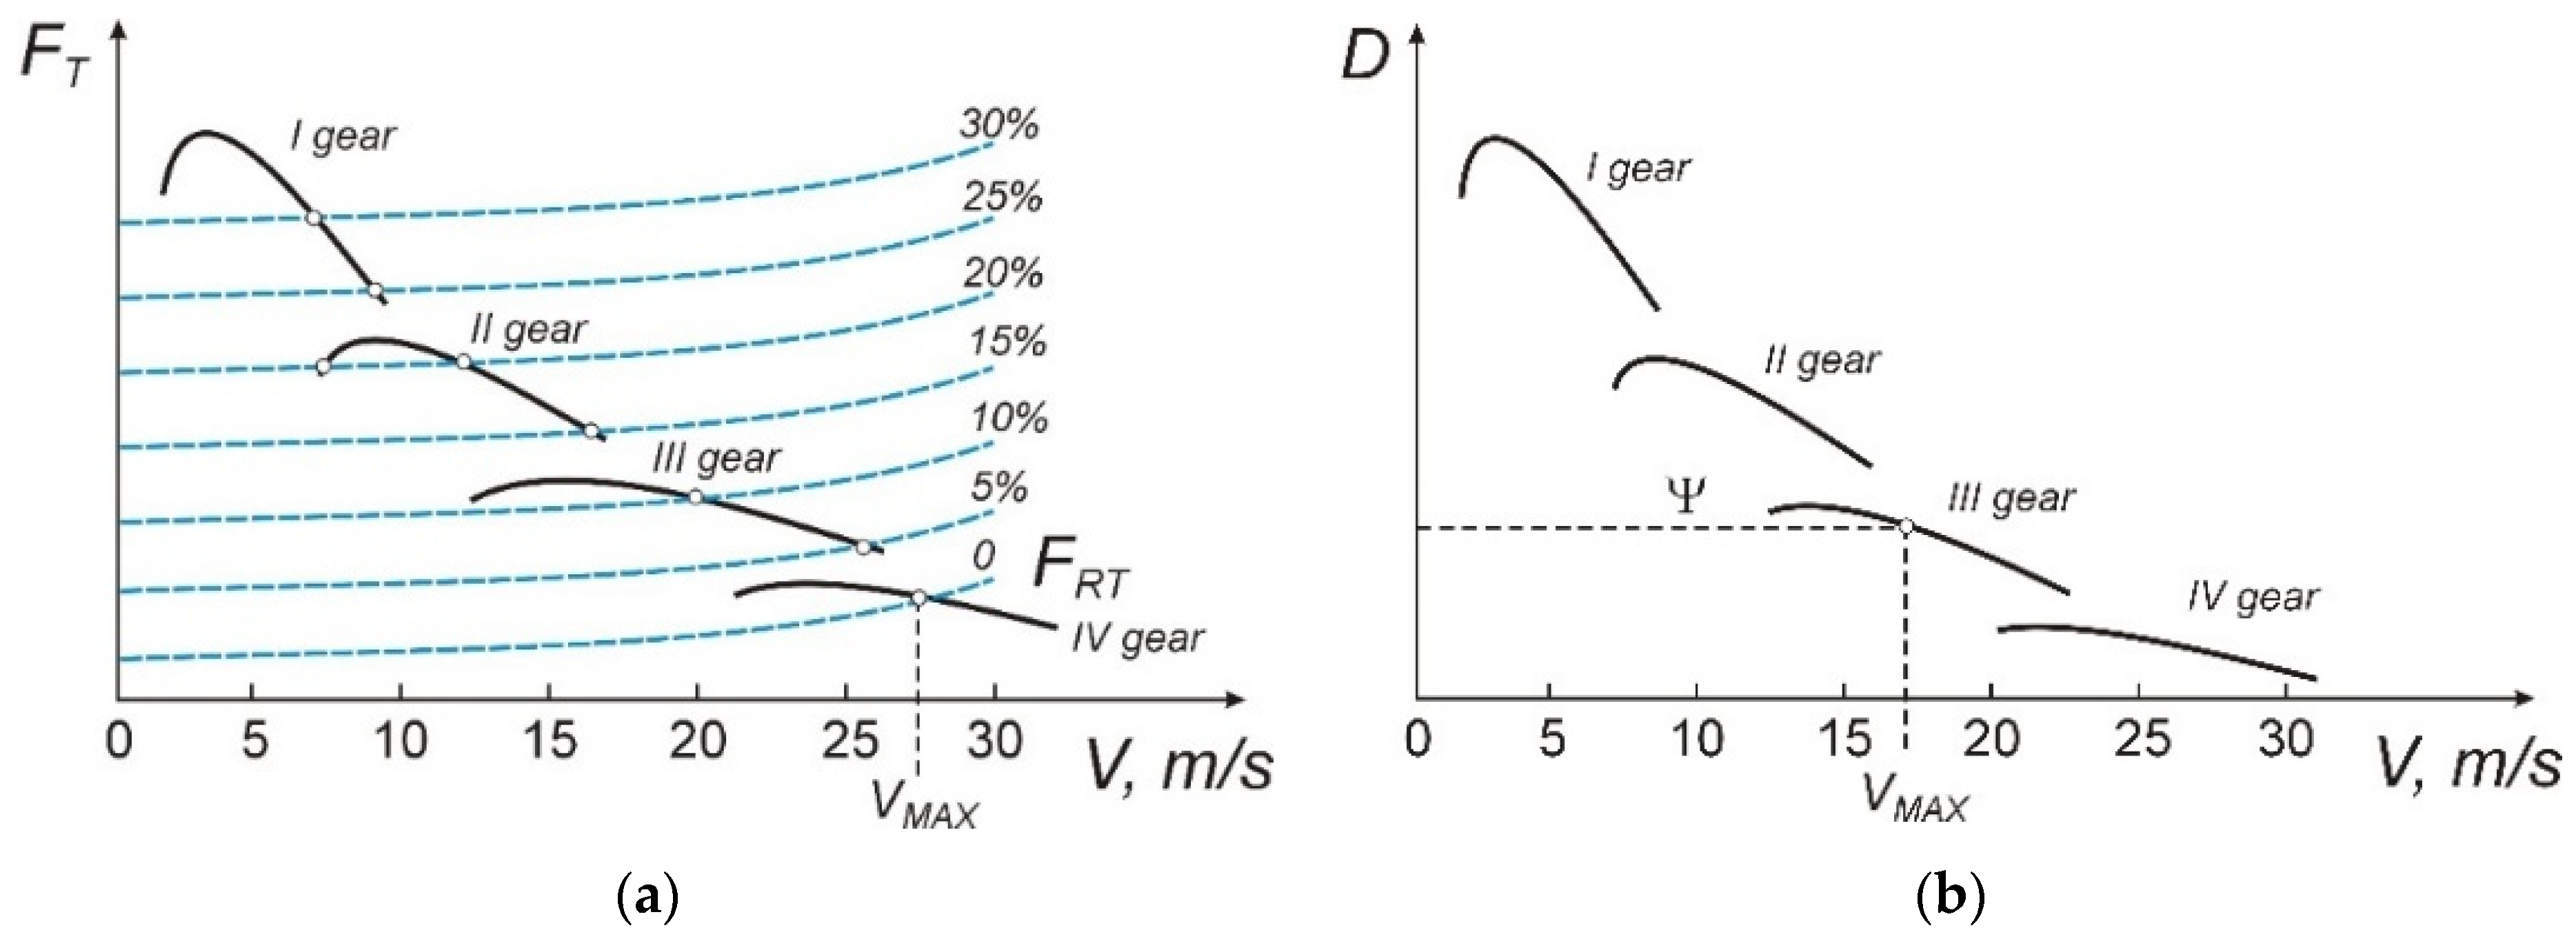
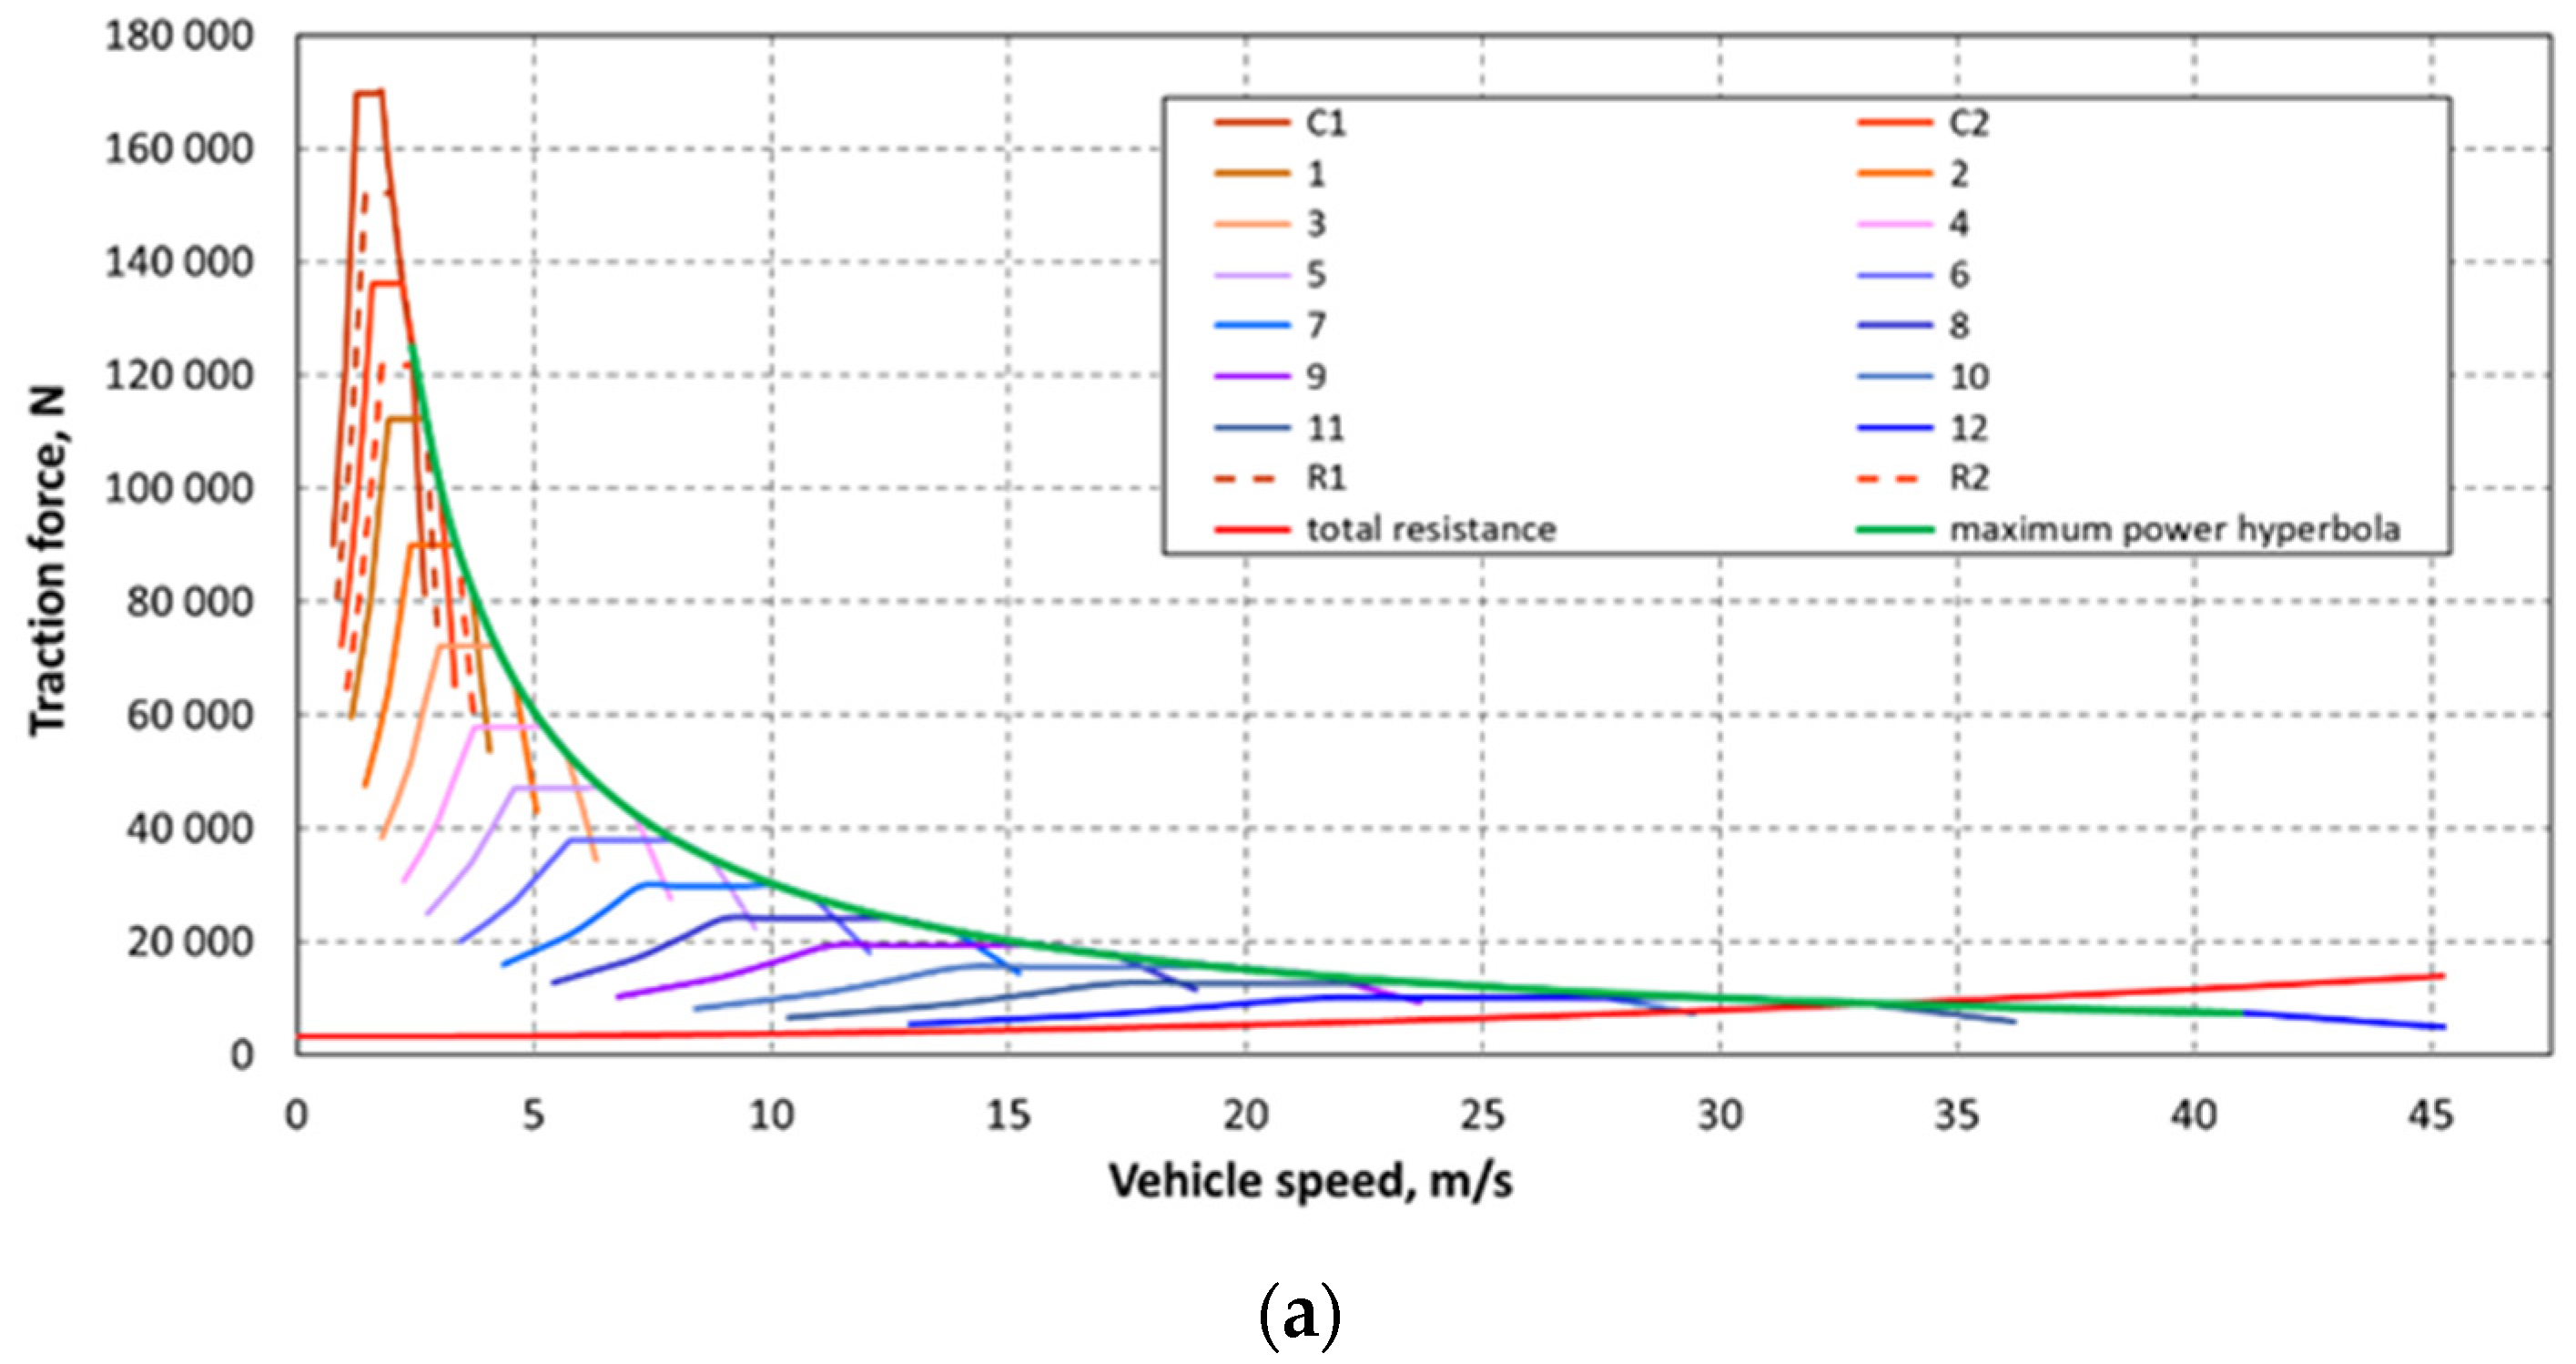
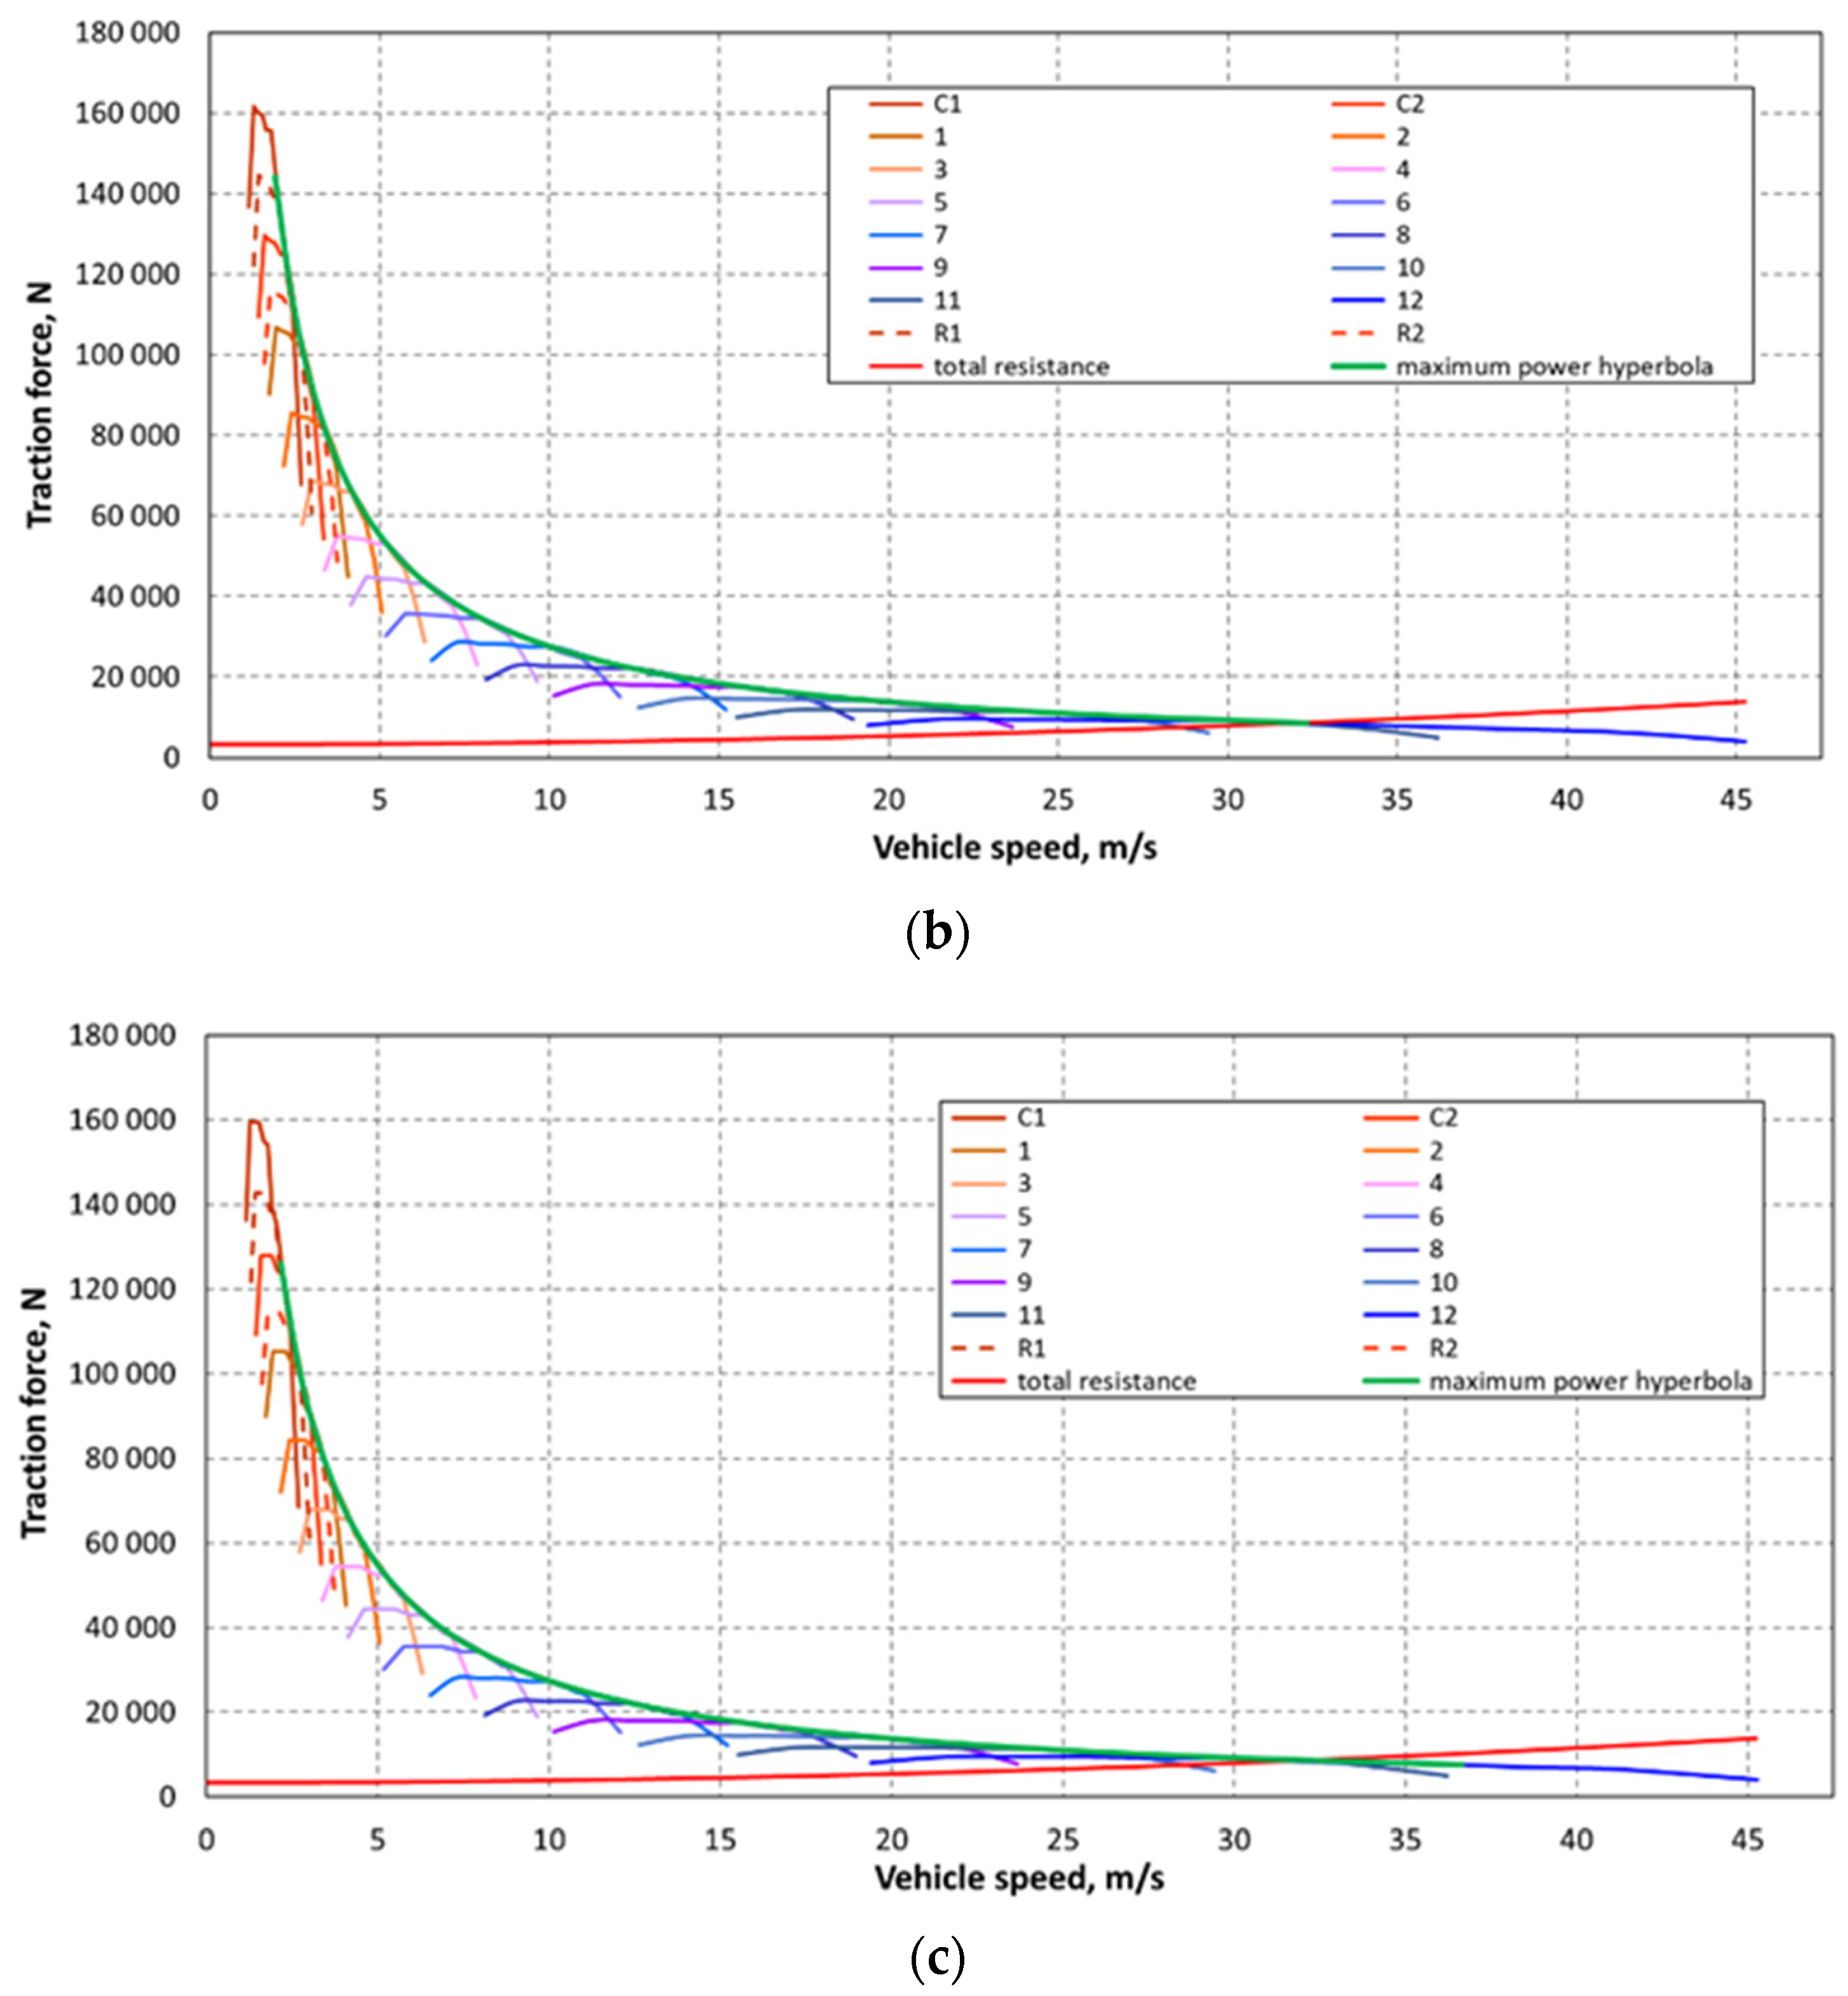
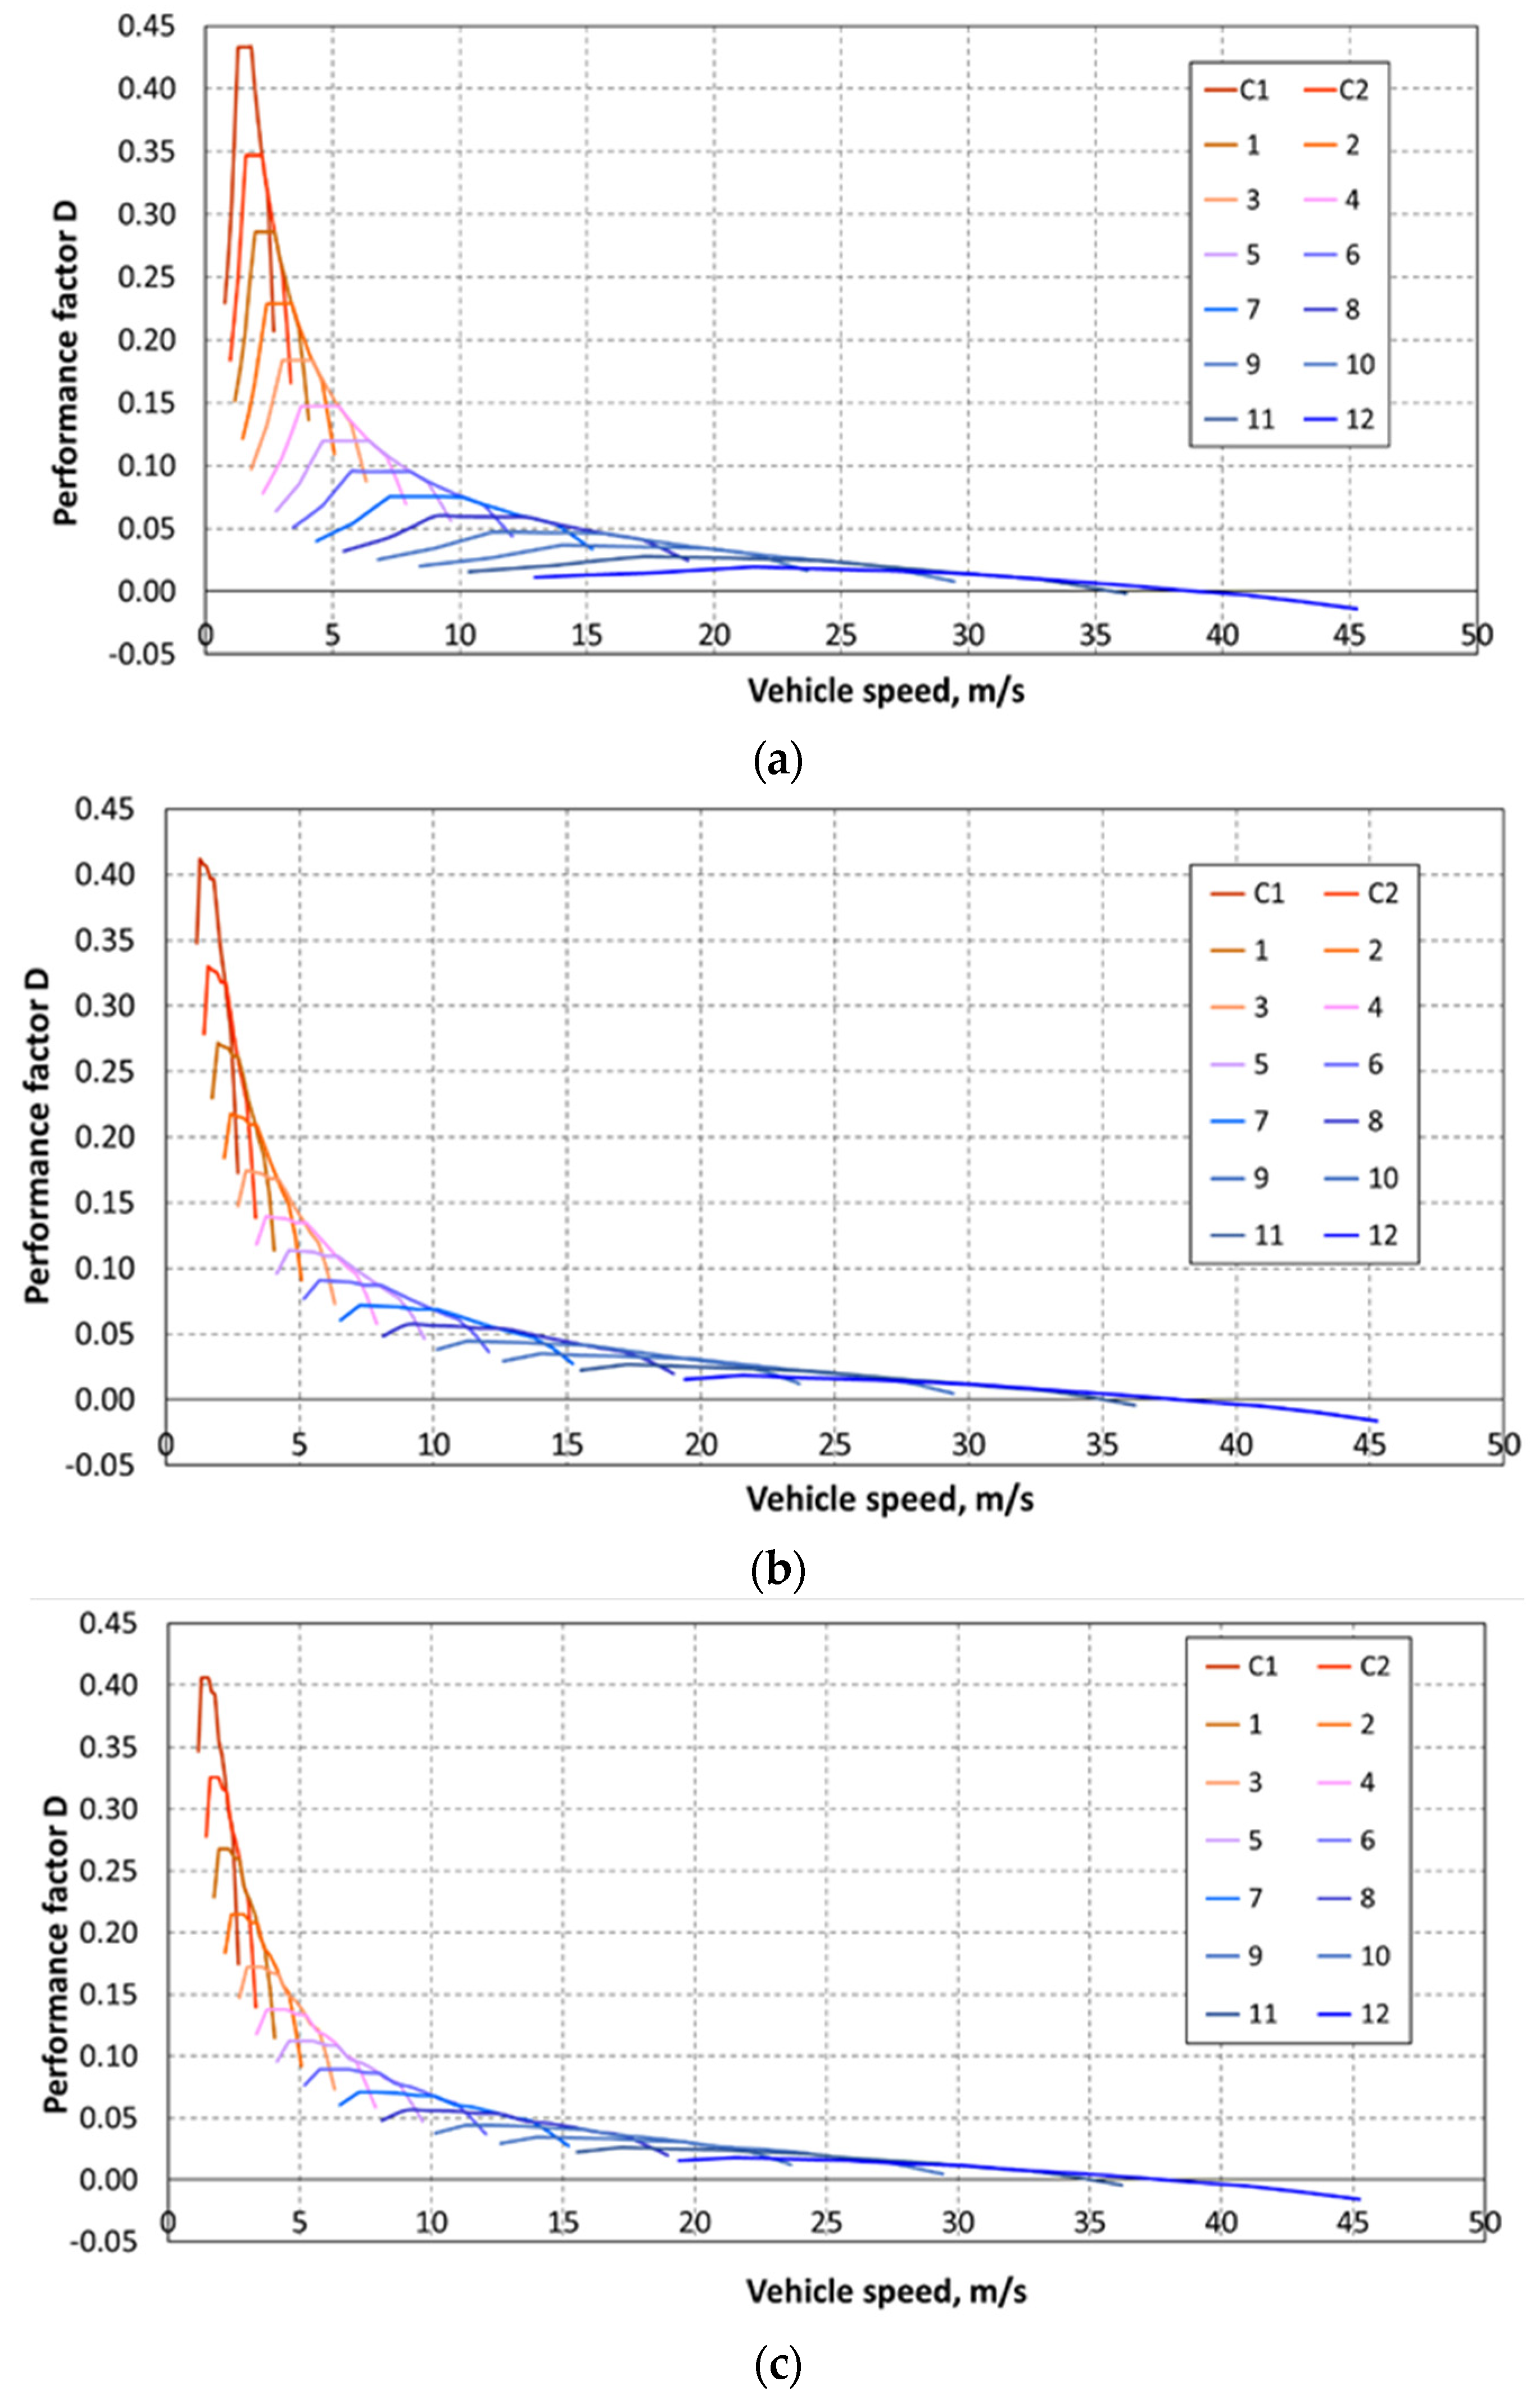
2.2. Traction Characteristics—Forces and Vehicle Performance

External forces, which are shown in Figure 3, acts on a car moving in a uniform or alternating rectilinear motion on a flat road surface. The most important ones include the following forces: WV—vehicle weight, Fr—rolling resistance force, FD—aerodynamic drag force and movement occurring in certain circumstances, namely: FT—tractive effort, Fg—grading resistance force, Fi—inertia force, FP—semi-trailer truck pulling force (trailer resistance force) and normal reactions Z1 and Z2 under wheels (where 1 and 2 are the first and second axes of the vehicle). Based on the balance of forces, we can write:
F T = F r 1 + F r 2 + F D F i + F P + W v sin α
Z 1 + Z 2 = W v cos α + F P t g α H
The rolling resistance force acts on the road wheels of the vehicle and amounts to:
F r = f r · ( W v cos α + F P t g α H )
In the estimated force calculations, the rolling resistance coefficient can be determined from the empirical equation [26]:
f v = f r [ 1 + ( 0.0216 v ) 2 ]   for   v ,   m / s
The aerodynamic drag force affects the vehicle’s running properties at high speeds (for speeds v < 30 km/h, the effect of the FD force is often neglected [26]). It is an aerodynamic force and acts on the body in the opposite direction to the vehicle’s direction. The value of the aerodynamic drag force is determined by [27,28]:
F D = C D · A x · ρ · V r 2 2
where: Ax—frontal area of the vehicle body; ρ—air density; CD—quantifies the aerodynamic properties of the car and is usually called the aerodynamic drag coefficient or the aerodynamic coefficient; Vr—relative speed of vehicle and wind velocity component in the vehicle moving direction.
Surface Ax is usually calculated as an approximation [26]:
A x = γ P · H · b w
where: γP—cross-sectional filling factor, which for heavy goods vehicles is 0.9–1.1; H—vehicle height; bw—track width; Ax = 9.0 ÷ 12.0 m2—for vehicles with a load capacity of more than 15 tons.
The grading resistance is the component of gravity parallel to the road surface:
F g = W v sin α
When negotiating gradients and descents, the pressure of the vehicle’s wheels on the road is reduced. This reduces the rolling resistance value at the expense of the increase in the force Fg. The combined approach to the uphill and rolling resistance forces creates the so-called road resistance:
F Ψ = F r + F g = W v ( f r cos α + sin α ) = W v Ψ gdzie   Ψ = f r cos α + sin α
The amount of road resistance makes it easier to jointly capture the impact of the road on the vehicle, especially at the initial stage of vehicle calculations or evaluation of their tractive effort curves.
The force of inertia is opposed to changes in the speed of the vehicle. There are two basic components of the vehicle inertia resistance resulting from translational and rotational motion:
F i 1 = m d v d t = W v g d v d t   and   M i = k I k d ω K d t = F i 2 r D
where Ik—moment of inertia of the kth rotating element (including moving parts of the engine and drive system), reduced to the driving wheels axis; ωK—angular velocity of the drive wheel with dynamic rolling radius rD; ωKv/rD.
Therefore, the force of inertia can be described by an approximate:
F i = F i 1 + F i 2 = δ W v g d v d t
where δ (rotating mass factor) stands for the ratio of the rotating masses of the engine and drivetrain. Its value can be approximated as follows [29]:
δ = 1 + ( 0.04 ÷ 0.06 ) ( 1 + i g b 2 ) W c v W v
where Wcv—current vehicle weight; Wv—nominal vehicle weight; igb—gear ratio in the gearbox.
Trailer drag force results from the sum of the resistance to motion of the trailer towed by the vehicle. The force acting directly on the trailer towbar is FdH (Figure 3). The trailer’s drag force FP directed parallel to the ground is considered:
F P = F d H cos α H
The aerodynamic drag force of a trailer with a height not exceeding that of the semi-trailer truck usually reaches up to 35% of the semi-trailer truck aerodynamic drag forces value.
Reactions to the road surface and the limitations resulting from the grip of the tires change constantly while driving. The values of normal reactions that vary while driving are often compared to those calculated in the state of static equilibrium (the vehicle is affected by the force of gravity WV and the normal and tangential reactions to the road surface). A significant limitation of the available driving force is the adhesion of the wheels to the road surface and the load per drive axle.
This limitation has not been taken into account in the study, because this factor is not related to any changes resulting from the way the engine is powered.
The equation of motion of the car results from the sum of projections (on the direction parallel to the road surface and the longitudinal axis of the vehicle) of the forces acting on the vehicle and the balance of power in the vehicle drive system (power available on the wheels) can be written by the equation:
P T = P e P l o s s = F T v = N e η d l = P R T
where P R T =   F R T v is the power of resistance to motion (demanded power). In this equation, Ploss expresses the power losses occurring in the drive system, when it is transferred from the engine to the driving wheels. These losses are included in the form of the overall efficiency of the drive system ηdl. The individual components of the power of resistances to motion can be expressed as follows from the equation of motion:
P R T =   F R T v = ( F r + F D + F g F i ) · v = P r + P D + P g P i
In order for the vehicle to move, there must be a relation P e · η d l P R T , where the value of the engine power is read from its external (speed) characteristic. On the other hand, the difference P e   ·   η d l P R T = Δ P is the excess power that can be used for acceleration, acceleration of the vehicle or overcoming the resistance to motion in difficult road conditions or the resistance to motion of the trailer.
Tractive effort curves are often used to compare performance of vehicles of different designs. It is presented in the form of a diagram of the relation between the driving force FT on the wheels and the driving speed v, which is calculated as follows [28,30]:
F T = T e · i d l · η d l r D   and   v = 2 π 60 n S i d l r K
where Te is the engine torque, idl and ηdl are the gear ratio and efficiency of the driveline, rD is the dynamic wheel radius, nS is the rotational speed of the engine crankshaft and rK is the kinematic radius of the wheel, which is usually assumed to be equal to the dynamic radius rD (in calculations later in the work for simplification, rolling of wheels without skidding was assumed).
An example of the tractive effort curves is shown in Figure 4a. The number of visible branches (black lines) corresponds to the number of constant gear ratios that can be obtained in the car’s drive system. The figure also shows the course of the drag forces resulting from the interaction of the rolling resistance and the air drag force with a blue line. Its point of intersection with the branches of individual gears shows the value of the maximum speed that the vehicle can reach under given conditions.
Figure 4a additionally shows the lines of force of resistance to movement while climbing hills with increasing inclination (inclination expressed as a percentage). Such a combination allows you to show not only what maximum speed can be achieved, but also which gear allows you to overcome a given incline. Starting from the equation of the car motion F T =   F R T = F r + F D + F g F i , the concept of a performance factor is introduced [31]:
D = F T F D W
where W is the weight of the vehicle (semi-trailer truck with semi-trailer). The diagram of the relation D = f(v) shown in Figure 4b is called the dynamic characteristic. It is a convenient indicator for evaluating and comparing vehicle performance. The dynamic characteristics can be used to determine the current road conditions:
D Ψ = F r + F g W = f r cos α + sin α Ψ
where the lines DΨΨ indicate the value of the achievable speed in road conditions, described in a conventional manner by the value of the road resistance coefficient Ψ.
The location of these lines makes it easier to determine the maximum speed in the considered road conditions and the accelerations that can be achieved. Their designation results from the following list [32]:
D D Ψ = δ g d v d t   d v d t = g δ [ D ( v ) Ψ ] and   d v d t | max δ g ( D max f r ) dla   α = 0
Using the dynamic characteristics, it is possible to determine the time and path of acceleration of the car:
t a = v min v δ d v g ( D ( v ) Ψ ) , S a = 0 t a v d v

2.3. Selection of Data for Calculations

The next step of preparations was the selection of the values of the values characterizing the tested set of vehicles and other design factors influencing its traction parameters. Available data, the details of which are described below, were used to determine the resistance to motion, the value of the torque transmitted to the wheels and the power.
Semi-trailer truck and semi-trailer: One of the most important parameters determining the driving properties of a set of vehicles is its permissible total weight, which according to the regulations in force (see Paragraph 3 in [33]) may not exceed the value of 40 tons in the case of a two-axle semi-trailer truck unit and a three-axle semi-trailer (or a three-axle semi-trailer truck and two-axle semi-trailer).
Drivetrain: The Volvo FH13 semi-trailer truck is equipped with 14-speed gearbox VTO2214B [34]. It is a manual gearbox, consisting of three mechanisms: the Splitter Group transmission (two speeds), the main gearbox (four speeds) and the Range Change Group transmission (two speeds) (Figure 5). The letter “O” used in the marking shows that the Splitter Group transmission was made in a different way than the traditional one, i.e., its gear ratio is 1.0 in the “Split Low” position and 0.8 in the “Split High” position. Finally, the ratios of individual gears were determined, the values of which are summarized in Table 3. The letters C and R denote the ratios of the creeping and reverse gears, and the SL, SH, RL and RH, respectively, show the low and high gear ratios of the Splitter and Range Group gears. The gear change time during acceleration was assumed to be 1 second.
The torque is transmitted to the wheels of the drive axle via the drive shaft and the main gear located in the drive axle (manufacturer’s code RSS1344C) ratio of 2.85 to 1 [35].
Apart from the transmission ratio, the efficiency of the drive system and the dynamic radius of the wheel also determine the value of the driving force developed on the wheels. The efficiency of the classic system [26,31] is the product of the efficiency of its components, which include the efficiency of couplings (possible slippage), cylindrical wheels with external and internal gearing, drive shaft with joints, drive axle (bevel gear, differential and hub bearings). The final estimated efficiency of the driveline used for the calculations was ηdl = 0.90.
Semi-trailer truck driving wheels. The dynamic radius of the drive wheel was calculated with the wheel size 315/70R22.5 and the recommendations contained in sources [32,36]. It was also assumed that the wheels would be loaded with the nominal value of the normal load (specified in the tire catalog); hence, its value will be rD = 0.49 m.
Vehicle movement resistance. The rolling resistance coefficient of the size wheels was determined on the basis of the test results presented in [37,38] for semi-trailer truck tires of the size 315/70R22.5 and in [39] for the tires of the semi-trailer size 385/65R22.5. At the same time, the least favorable value was chosen, assuming, in simplified terms, the same for all wheels of the vehicle fr = 0.0083. This procedure was performed due to the verification of only two factors influencing the movement of the vehicle, namely the torque and useful power of the engine powered by various types of fuel. The value of the rolling resistance coefficient was also dependent on the driving speed:
f r ( v ) = f r · ( 1 + 0.000045 · v 2 )
When calculating the inertia resistance, the dependencies proposed in [26,30] were used, where the rotating mass coefficient δ, related to the gear ratios, was used:
δ = 1 + 0.0175 · i g b , k 2
where igb,k—ratio on gear k.
By selecting a higher value of the constant factor, Equation (21) takes into account the moments of inertia of the trailer wheels in their rotational motion.
When calculating aerodynamic drag resistance, the dimensional data taken from [35,40] and information on the range of values of the aerodynamic drag coefficient CD [41,42,43] were used (the possible range of changes is up to 50%). In addition, apart from the cab structure and the way of setting up the semi-trailer truck and semi-trailer unit (differences in the height of the cab and the body, their distance, etc.), there is also an influence of additional resistance resulting from increased disturbances in the flow of air in a situation when the direction of air movement does not correspond to the direction of move. This significantly increases the value of the CD coefficient. As shown in [42], for a semi-trailer truck with a semi-trailer, it is an increase of 125% for the same driving speed and a deviation of 10°.
In order to take into account the maximum possible resistance to motion, the value of CD = 0.9 (CD for 0° = 0.5 and correction for angular deviation equal to 1.2) was selected for a set of vehicles. The frontal area was also approximated, assuming, based on the data [35,40,44]: width and height of the semi-trailer truck cab—2.49 m; 3.87 m and the height and width of the semi-trailer: 4.00 m, 2.55 m and the cross-section factor of 0.9. This allowed for the calculation of the frontal area, which is A = 9.16 m2. The air density was also assumed to be ρ = 1.225 kg/m3, which corresponds to the standard conditions used in the calculations of aerodynamics.
Another component of the resistance is the longitudinal inclination of the road (resulting from its grade line and marked in Figure 3 by the angle α). Pursuant to paragraph 24 in [45], its value depends on the assumed design speed of the road and should not be greater than that specified in Table 4. A similar range of road inclination to 12% for a set of vehicles and the possibility of moving it up to such a hill five times is specified in the Regulation of the European Commission No 1230/2012 [46]. On this basis, the range of road gradient changes from 0 to 15% was adopted (it was additionally extended to 30% when calculating the maximum speed, taking into account the possible specific operating conditions in mountain terrain).
In the traction calculations performed in the work, the variable factor was the engine with changed fuel supply system. They also included values taken from the catalog data of the vehicle manufacturer [35,47] (labeled “Factory data”), which showed the capabilities of the semi-trailer truck—semi-trailer combination.

2.4. Results of Tractive Effort Calculations

Figure 6 summarizes the tractive effort for the three considered variants of the external characteristics of the engine. In general, the course of the characteristics is very similar to the achieved values of the driving force and speed. Slight differences are related to the stability of the maximum engine torque (in the range of 1000–1400 rpm), which is regulated by the EDC controller. This value remains unchanged on the manufacturer’s (catalog) characteristic, while the results of the measurements performed show a decrease in the torque value by about 3.5%. This tendency is visible regardless of the diesel fuel only or diesel/CNG combination.
Compared to the factory characteristics, the course of the maximum power hyperbola has also changed, which in the F-V coordinate system is calculated as FT∙v = PTMAX = const (PTMAX is the maximum power supplied to the wheels) and is expressed by the general equation C∙x−1 [48]. The determined constant values are as follows:
C Factory data = 302,603 N∙m/s
C Diesel = 275,945 N∙m/s
C Diesel/CNG = 273,251 N∙m/s
This shows that the achieved values of the driving force or speed will be greater for a vehicle with an engine operating in accordance with the factory data, and the change from diesel fuel to diesel and CNG has a very small (imperceptible) effect on the traction performance of the vehicle.
This conclusion is confirmed by calculations of the predicted maximum speed depending on the road gradient on which the vehicle is used (Figure 7). The use of the measurement results leads to the determination of the speed lower by 4–5% compared to the factory data. The change of power supply does not cause a significant reduction in speed (for a horizontal flat road, it is only 0.15 m/s, and this value decreases with the increase of the road inclination angle).
Figure 8 shows the calculations of the range of gradient changes that can be covered in each of the possible gear ratios. Again, as expected, the highest elevation values are provided by the engine with the factory characteristics (gray bar). The calculations made using the measurements from the dynamometer with diesel fuel (yellow bar) showed a decrease in the percentage of the road gradient, which was about 3.5% for the crawling gear C1, 1.5% for the second gear and similarly for subsequent gears, with gradual reduction differences. The introduction of CNG to power supply caused a further reduction of the value by about 0.5% in gear C1 and about 0.25% in second gear. In the following gears, the differences are even smaller and will not be felt during typical use of the vehicle.
Figure 9 shows the power on the drive wheels PT = f(v). The field of available power is the area under the lines of the PT = f(v) diagram, while the field of lost power is located between the line of maximum power PTMAX on the wheels and the curves of the characteristics for individual gears PT = f(v). On their background, a graph of resistance power in steady motion on a horizontal road was drawn (red line). The summary shows that the shaping of the power curve determined in the measurements (its unevenness) results in the formation of the lost power fields (areas shaded in gray in the figure). In the case of diesel fuel supply, this field will appear in the range of the engine speed of 1500–1700 rpm, and for diesel/CNG, it is in a speed range of 1400–1600 rpm. At the same time, it is the largest field, but it is above the economic speed range indicated in by the manufacturer (1000–1500 rpm).
Another important parameter determining the tractive effort of a vehicle set is the performance factor D. The course of changes in its values for individual gear ratios and three considered variants are shown in Figure 10. The characteristic presented in this way allows to indicate with what maximum speed and in which gear the car will be able to overcome the assumed motion resistance. In this approach, the change of fuel supplying the engine does not result in significant differences. The largest discrepancy in values in favor of the supply with diesel only is about 1.5% and it occurs at 1000 rpm and about 5% at 1500 rpm.
Such a decrease in the value of the dynamic index, resulting from the unevenness of the course of the engine torque, is reflected in the achieved acceleration values. In Figure 11, for one of the gears, a dashed line has been drawn, denoting the engine speed to 1500 rpm. It should be expected that close to this value, a truck powered by diesel/CNG would accelerate 10% slower. This can be important, for example, when entering traffic or when crossing a road intersection (when one needs to start moving from a dead stop).
An example of the values from the graphs is presented in Table 5. These values show that the change of fuel supplying the engine does not noticeably affect the traction characteristics of the road semi-trailer truck during acceleration. The results in a graphic form are presented in Figure 12.

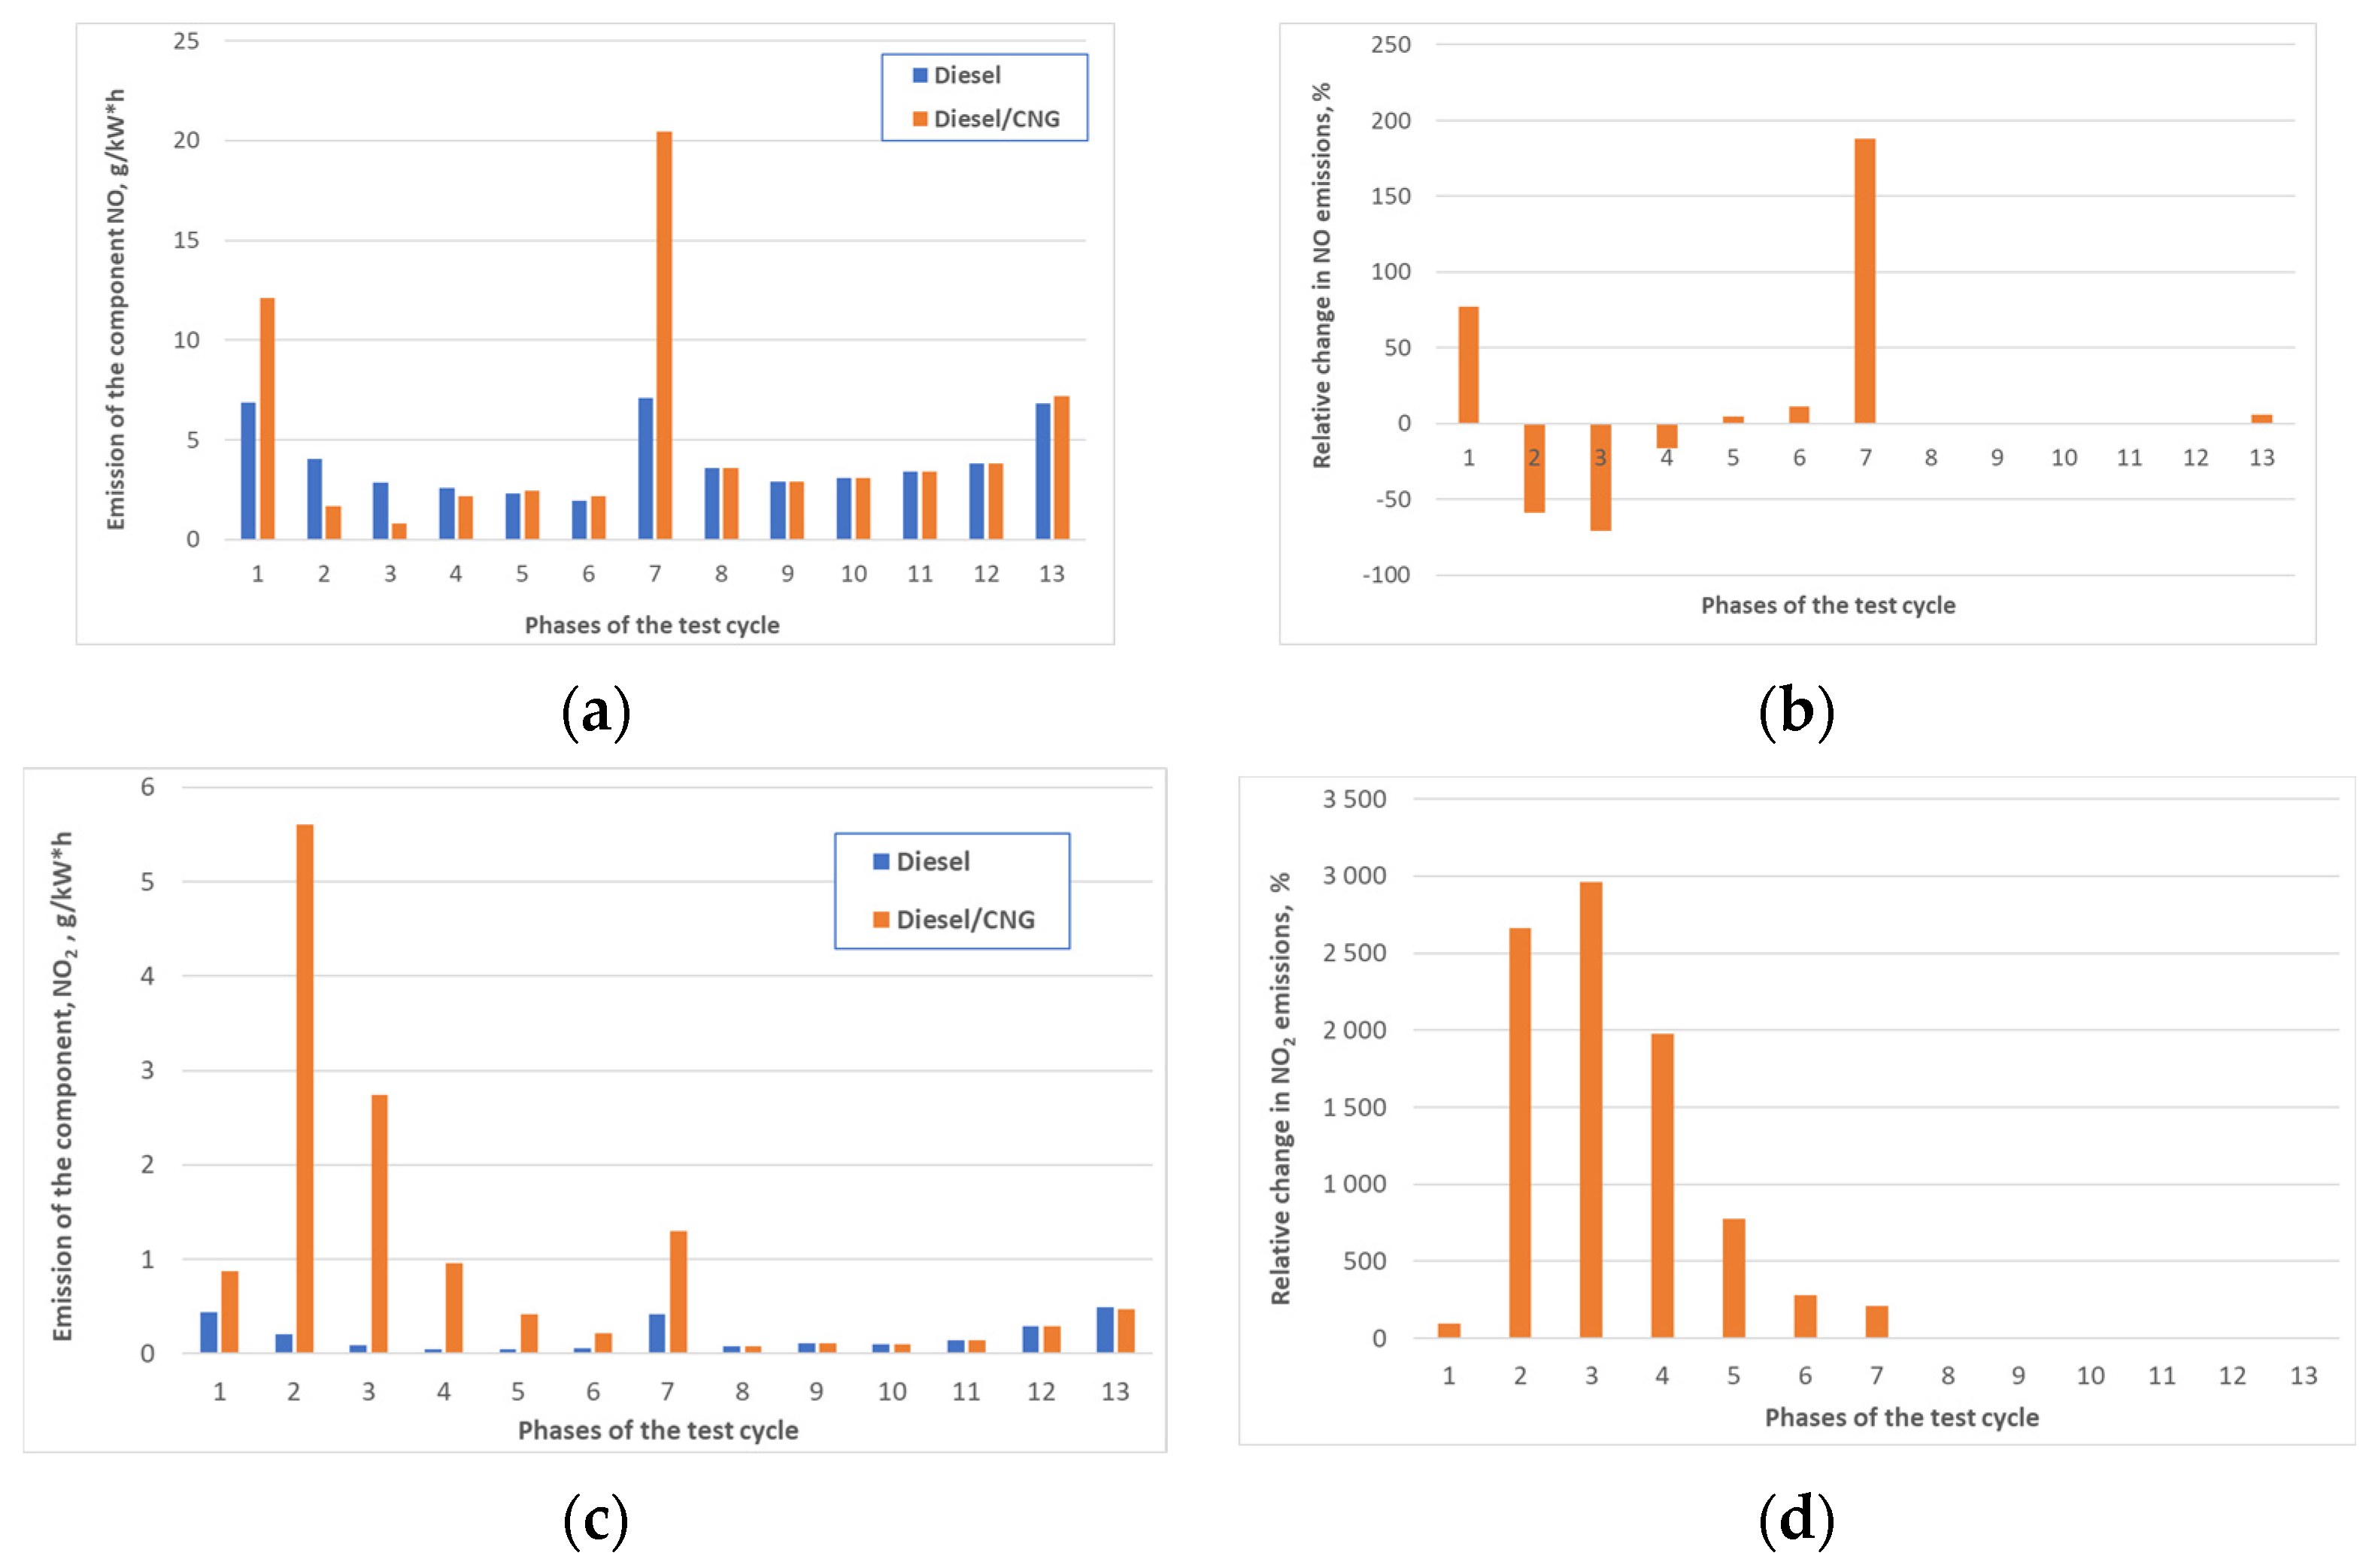
2.5. Exhaust Emission Tests in Accordance with the Requirements of the UNECE Regulation No. 49

The next step of the research was to determine how the use of a non-factory diesel/CNG dual-fuel installation to supply the engine of a semi-trailer truck unit affects the emission of individual exhaust components, i.e., NO, NO2 NOx, CH4, CO, CO2, HC and exhaust smoke opacity. To determine these components, the research cycle resulting from the provisions of the UNECE Regulation No. 49 (Table 6), adopted for application in Poland by Resolution No. 97/92 of the Council of Ministers of 31 August 1992, was used.
During the tests, commercial diesel fuel from one production batch was used, in accordance with the EN-590 standard (the same that was used to determine the speed characteristics). The normative document (UNECE Regulation No. 49) [49] allows the use of fuel similar to the reference fuel in a situation where the appropriate reference fuel is unreachable. The advantage of choosing such a procedure is the determination of the actual values of the engine operation characteristics with a random fuel composition (from random petrol station). It was also remembered to minimize the impact of fuel properties on the result of the comparative tests, which is why diesel fuel from one delivery was used for all tests.
The measurements were made with the use of the prepared research version of the CNG dosing controller, in which the optimal individual control functions (injection maps, timing, etc.) were determined. The following were adopted as components of the diesel replacement function. The optimal CNG dose: gas injection start, diesel/CNG exchange ratio, correction for pressure in the intake manifold, correction for power developed, correction for temperature and gas pressure. Figure 13 shows the exchange ratio as a function of rotational speed and fuel dose. The visible numerical values on a red background show the percentage of CNG in the total fuel dose (vertical axis) supplied to the engine at various values of the engine RPM and its load represented as the calculated dose of diesel fuel for one work cycle. The diesel/CNG exchange ratio was variable and depended on the operating conditions—it ranged from 20 to 75%.
The results of the tests are illustrated by comparing them in the following figures of changes in the emission of the components of individual gases: NO and NO2 (Figure 14), NOX and CH4 (Figure 15), CO and CO2 (Figure 16) as well as HC and exhaust smoke as the coefficient of extinction of absorbed radiation (Figure 17). To facilitate the analysis process and to present the changes in a numerical manner, the results were also presented as relative, comparing the results obtained for diesel/CNG supply with diesel fuel only (on the right side of the figures). The emission of individual gaseous components and the smoke opacity were determined directly at the engine exhaust pipe, just before the exhaust gas treatment system.
Should be noted that the obtained results of emissions of individual exhaust components do not take into account the deterioration factors resulting from the European Union Commission Regulation No. 2018/1832 of 5 November 2018 amending Directive 2007/46/EC of the European Parliament and of the Council, Commission Regulation No. 692/2008 and European Union Commission Regulation No. 2017/1151.
The change in the share of individual nitrogen oxides is illustrated in Figure 14 and also in Figure 15a,b. In the case of NO, at the rotational speed of the intermediate gear and low values of the torque (up to 25%), a significant decrease in the content of this gas in the exhaust gas was observed. After exceeding the engine load of above 50%, this value increases slightly; at a speed of 1700 rpm, no changes in the composition of exhaust gases were recorded. For NO2, at an intermediate speed, tens of times increase in the content of this gas in the exhaust gas is visible, which decreases with increasing engine torque. This is related to the reduction of CNG in the total fuels dose (sum of diesel and CNG doses). As in the case of NO, at the speed of 1700 rpm, the change in the fueling method did not significantly affect the exhaust gas composition. The observed changes in NOX emission at an engine speed of 1300 rpm are in the area of 20–30%.
The change in the share of methane gas in the exhaust is shown in Figure 15c,d. In the case of this gas, while suppling the engine with diesel fuel only, CH4 emission fluctuated at the level of 0.002–0.004 g/kW∙h. The use of diesel/CNG resulted in a significant increase in the concentration of this gas in the exhaust gas up to 7 000 g/kW∙h. The reason for this is methane entering the exhaust manifold during the “cylinder air flush” on the intake stroke. In order to minimize or eliminate this disadvantage, it will be necessary to develop further changes including the redesign of valve timing system.
The use of alternative fueling caused an increase in CO content, which decreased with increasing engine load, and no changes were observed at the engine speed of 1700 rpm. For CO2, CNG supply had a very positive effect on reducing the emission of this greenhouse gas in the area of intermediate rotational speeds and up to 75% of the engine torque value.
The use of dual-fuel suppling resulted in an increase in exhaust gas opacity by 50–150%, depending on the load at the speed of the maximum torque. It is related to the reduction of global AFR and the occurrence of local oxygen deficiencies, which favors the formation of solid particles [50].
Based on the results obtained in individual test phases, the total emission of gaseous components was also determined (the Importance factors in the calculations were shown earlier in Table 6) and compared with the requirements of Euro IV and Euro V (Table 7).

3. Conclusions

The information contained in the previous parts of this work allows for the following conclusions:
  • Factory data (published by the manufacturer) concerning the maximum value of torque and power, as well as the course of their changes in the area of the tested engine RPMs, differ significantly from those determined in the measurements on the dynamometer, both with diesel fuel and Diesel/CNG. This affected the traction calculations, in which the semi-trailer truck (towing semi-trailer) with an engine with factory parameters always had the best results. For this reason, they were treated as achievable values; however, the comparisons themselves were made only for the results of laboratory measurements.
  • Changing the supply fuel (from Diesel fuel to Diesel/CNG) does not significantly reduce the traction characteristics of the vehicle, and the changes are so small that the driver should not notice the differences indicated in the calculations (very similar acceleration values, distance and time traveled, hill-climbing ability, use of the same gear in the same state of movement, etc.).
  • The engine power values determined in the laboratory tests show differences in relation to the factory characteristics, which is the result of the natural processes of engine wear. As a result, irrespective of the fuel used, the power field losses occurred, which are greater when supplied with Diesel/CNG. This can lead to a slight increase in fuel consumption when driving with the use of higher engine speeds—above 1500 rpm for diesel fueling and above 1400 rpm for Diesel/CNG.
  • Similar fluctuations occur with torque. The biggest disadvantages for Diesel/CNG supply, compared to Diesel fuel only, seems the lower torque values, close to 1500 rpm. As calculated, it may result in a temporary reduction of the achieved acceleration value up to 10%.
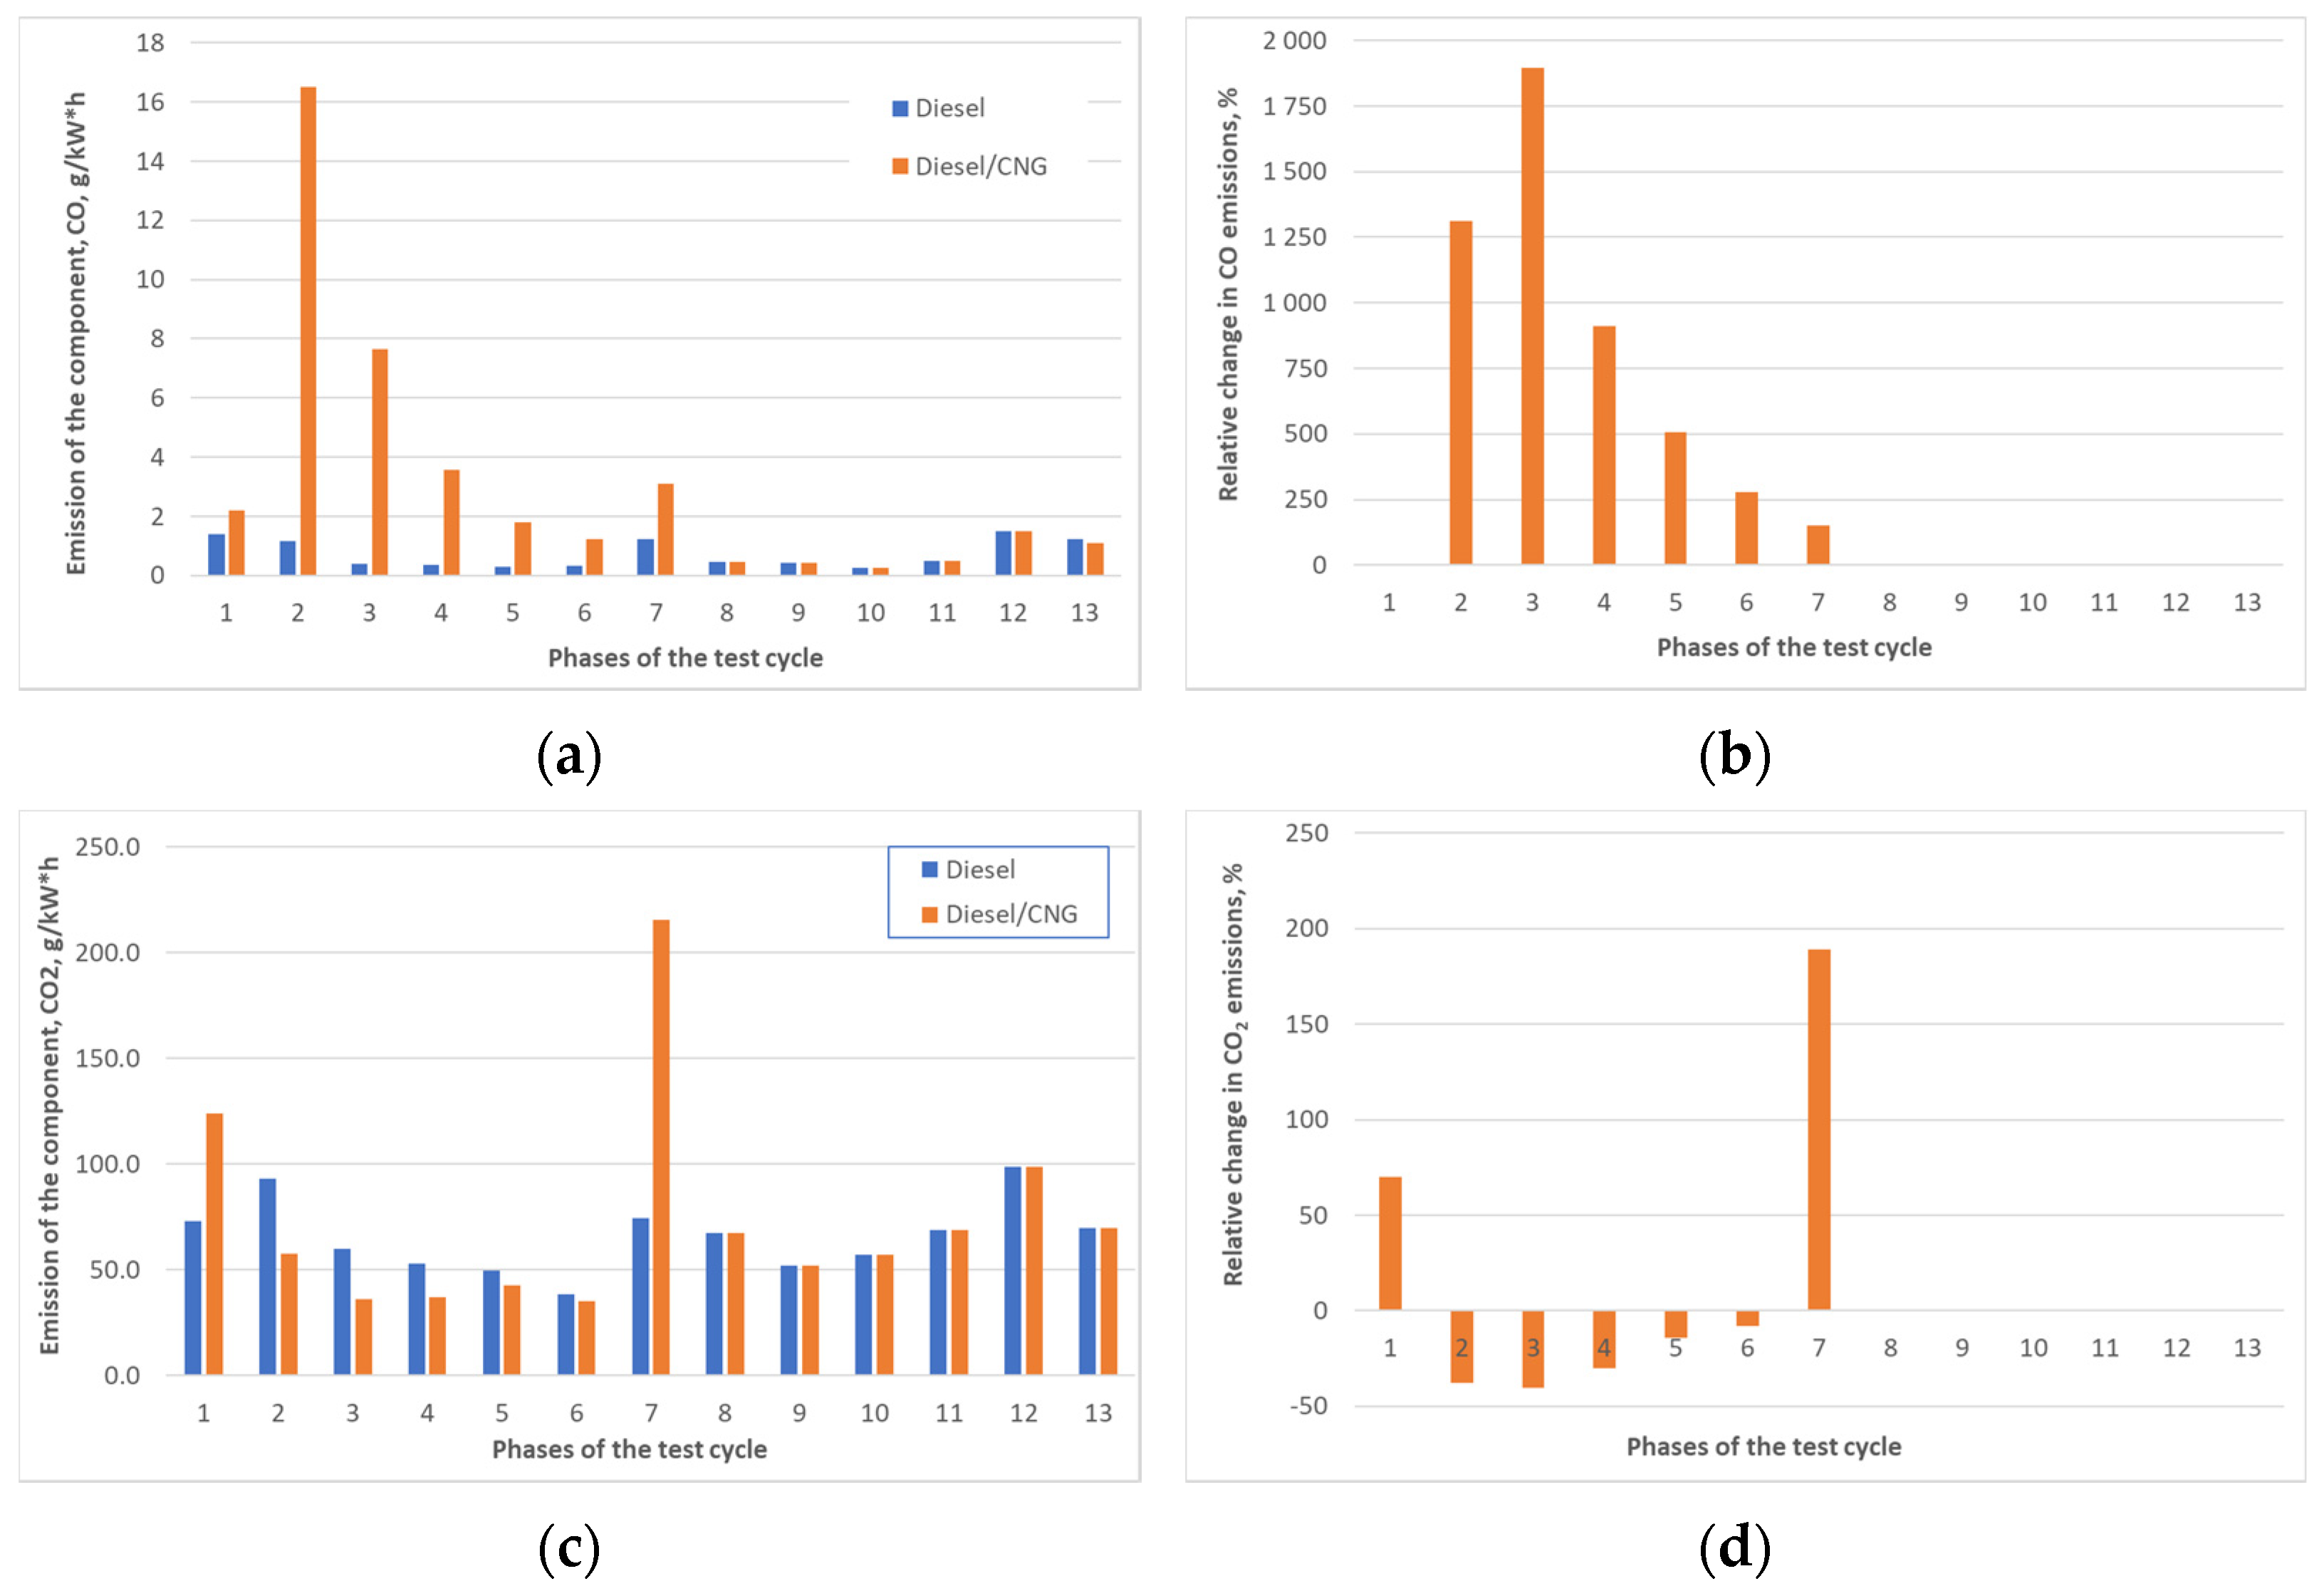
  • A decrease in the CO2 content was noticed during with the Diesel/CNG mixture, which is related to the change of the elemental hydrogen and carbon particles ratio in the outgoing exhaust gas. It is a favorable phenomenon in terms of the emission of toxic and greenhouse gases. The changes in the CO2 content are proportional to the changes in the Diesel/CNG replacement factor.
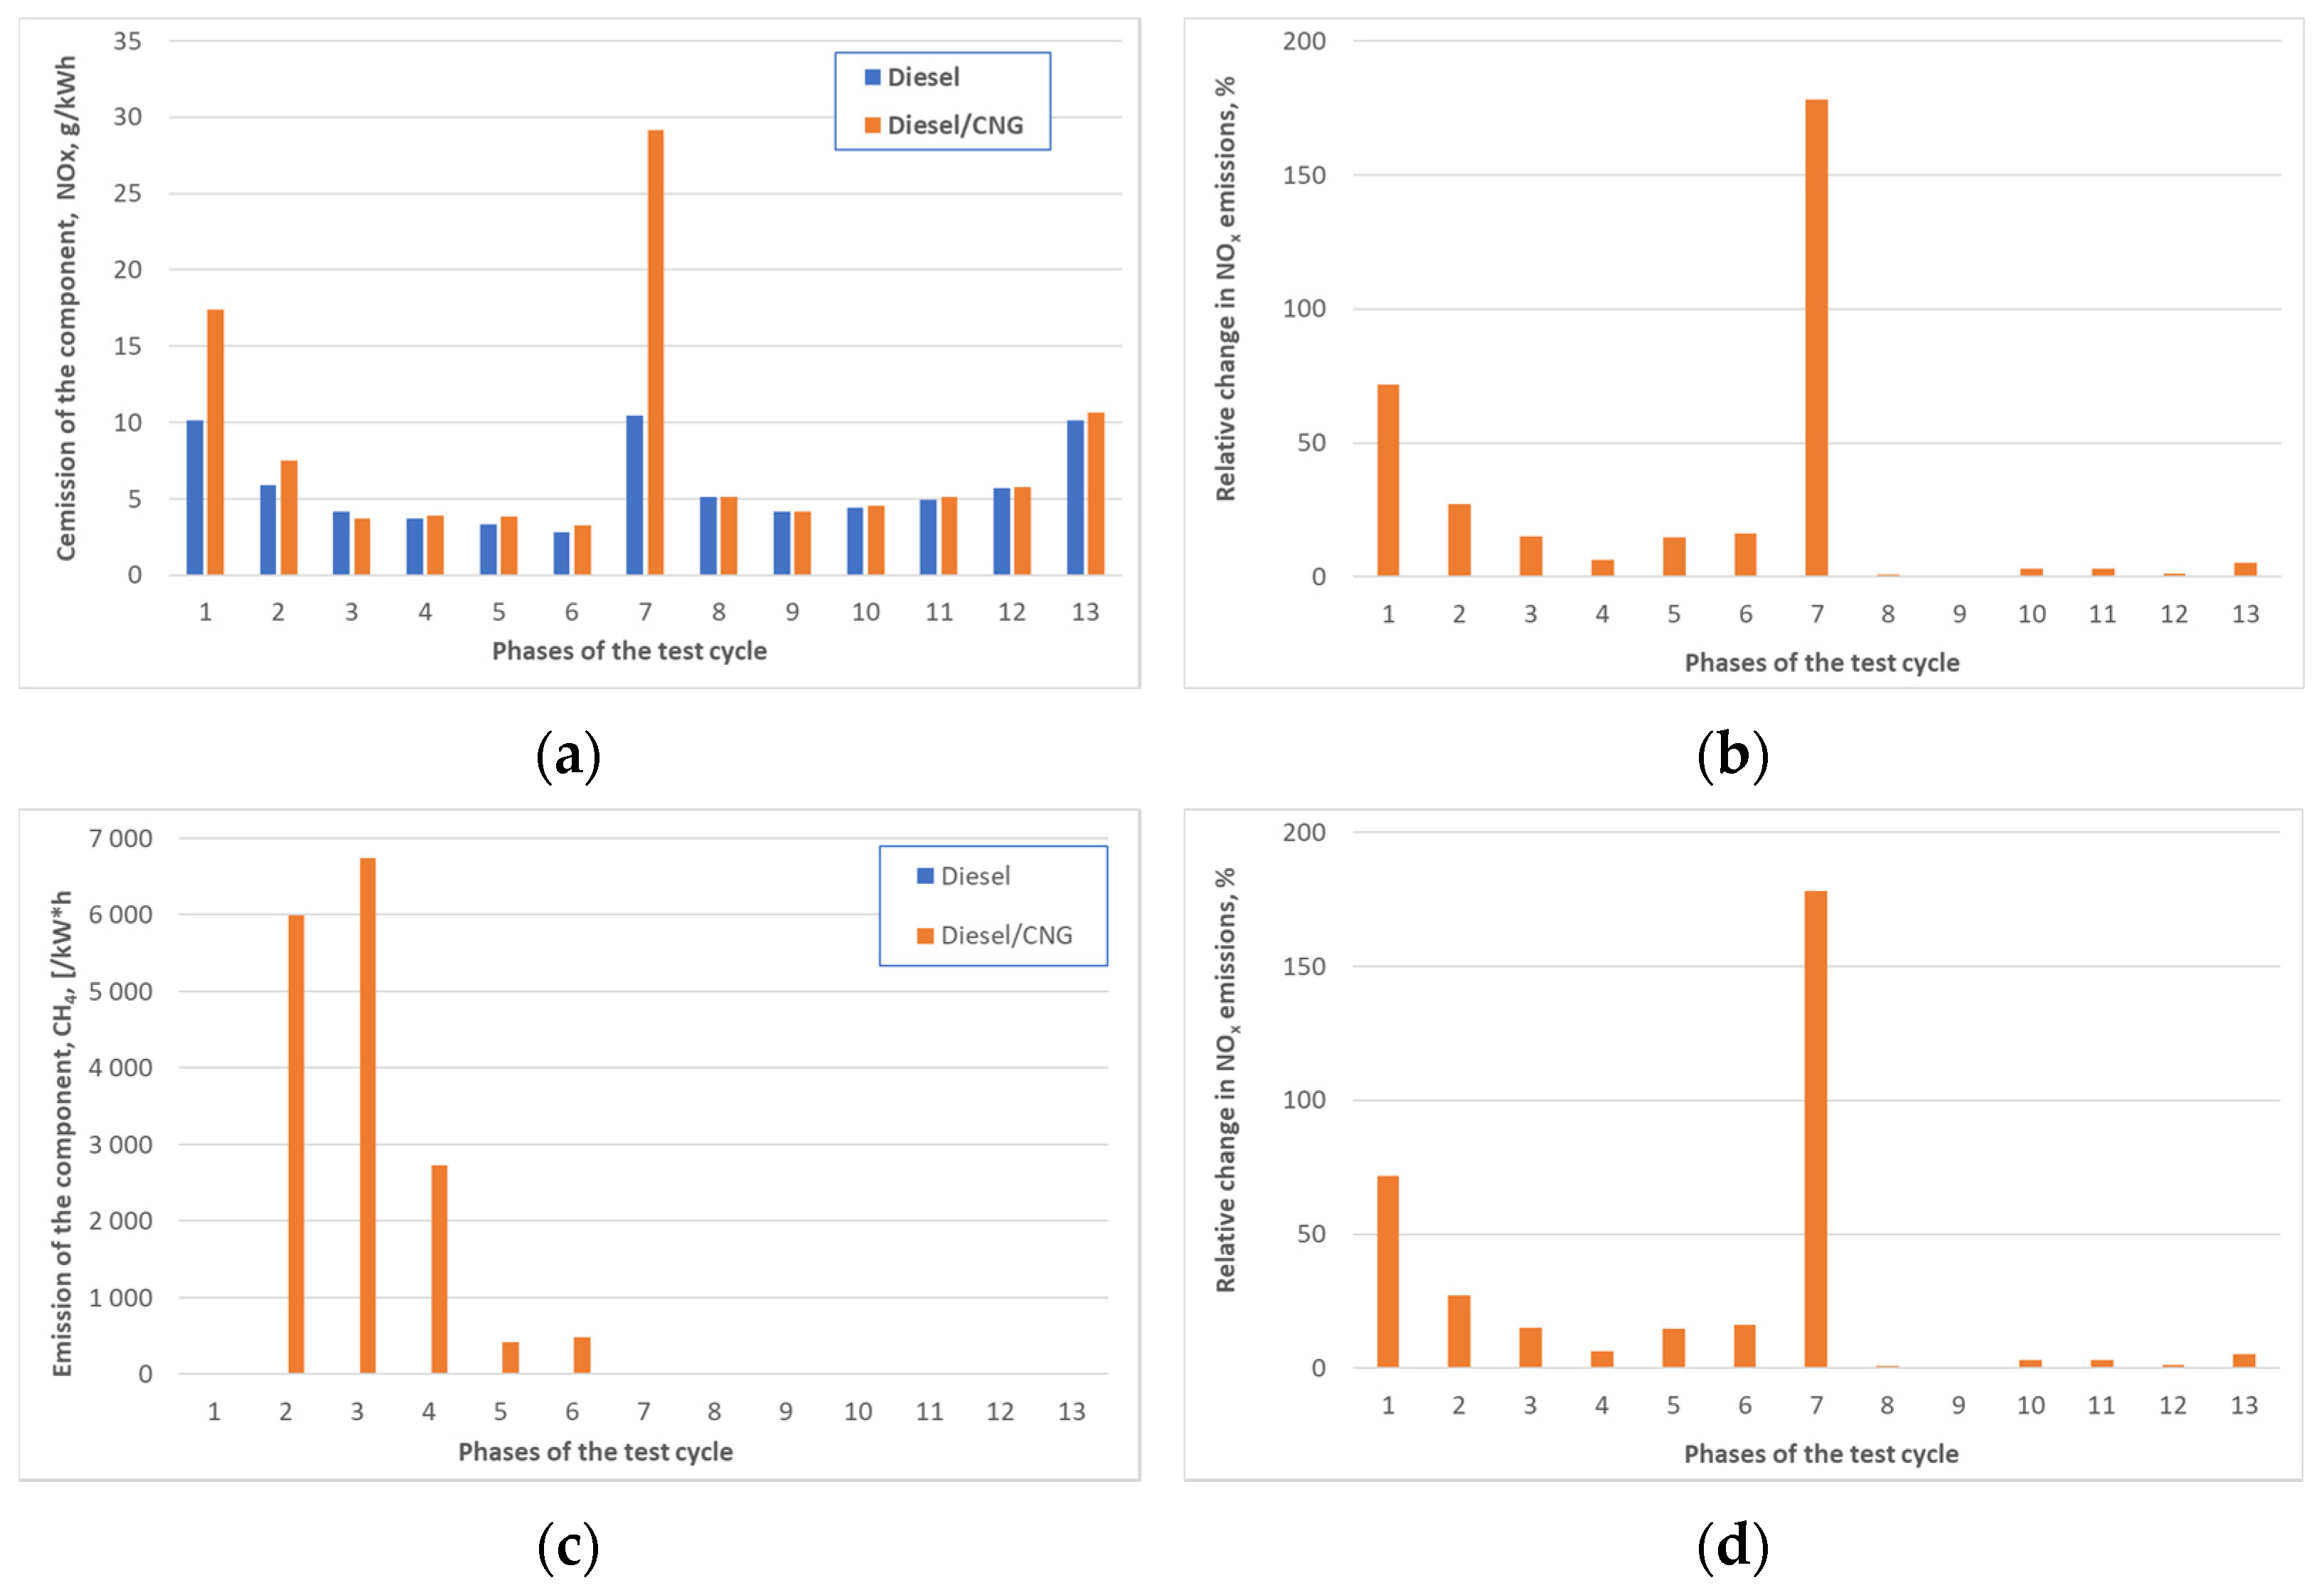
  • There was a dozen or so percent increase in the content of NO. It involves changing the combustion process to similar to combustion in typical spark ignition engines. The introduction of CNG into the intake manifold reduces the excess air ratio and increases the combustion temperature of the air-fuel mixture. Increasing the combustion temperature results in an increase in NO2 content, which affects the total NOx emissions. The vehicle’s engine is equipped originally with an SCR system that should reduce NOx emissions to the required level.
  • A several hundred-fold increase in the methane content in the exhaust gas was noticed. This is related to the contraction of the intake and exhaust systems—air flushing of the combustion chamber. This phenomenon may also cause an increase in CO emissions during homologation tests and, as a result, exceed the limits resulting from the requirements of EURO emissions standards. This conclusion is confirmed by the several dozen-fold increase in the content of CO in the exhaust gas. This results from the changes in the organization of the combustion process (similar situation to the NOX concentration). By introducing CNG into the intake manifold, the fuel is mixed with air in advance, resulting in an almost homogeneous mixture which is then supplied to the cylinder. After compression, Diesel fuel is injected into this air-CNG mixture in liquid phase. This causes local oxygen deficiencies—which favors incomplete combustion and the formation of carbon monoxide as well as an increase in smoke occurrence during Diesel/CNG supply in the range of 50–120%, depending on the operating conditions. This phenomenon is very unfavorable from the point of view of environmental protection due to the increased emission of solid particles to the atmosphere.
  • There may be several reasons for the increased opacity of exhaust gases:
    o
    Reduction of the excess air factor due to the supply of CNG fuel in gaseous form,
    o
    Change in the combustion method of the air-fuel mixture, resulting from the shift of the flammability limit and homogenization of the mixture [25,51],
    o
    Local oxygen deficiencies resulting from the co-combustion of CNG and Diesel fuel, which leads to a local reduction of the excess air ratio, especially in the area of diesel fuel combustion.
It should be stated that the engine running on a Diesel/CNG supply did not meet the Euro V standard requirements. However, the engine was tested without the exhaust gas treatment system. This may be confirmed by the fact that the Euro V standard limits were not met also when fueling with diesel fuel as the basic fuel. The final verification of the impact of the use of the Diesel/CNG dual fuel supply on the emissions of individual exhaust components should be carried out by certified laboratory with appropriate authorizations. In future research, it is advisable to carry out tests of an engine equipped with a complete exhaust system—exhaust gas catalysts and an SCR-type NOx reduction system—in order to assess the impact of Diesel/CNG supply on the operation of exhaust gas treatment systems. The conducted tests and analyzes allowed for the assessment of the impact of applying a CNG supply system to a used semi-tractor. The obtained results confirm the purposefulness of using such solutions in order to reduce CO2 emissions by vehicles used in the transport of goods. The change in the tractive forces is not significant enough to affect the way vehicles of this type are used.
Moreover, in order to optimize the engine in terms of emissions of individual exhaust components, tests of the correct valve timing and optimization of the CNG injection process should be carried out too.

Author Contributions

Conceptualization, M.K. and M.W.; methodology, M.K. and M.W.; calculation M.W.; formal analysis, M.W. and M.K.; investigation, M.K.; data curation, M.W. and M.K.; writing—original draft preparation, M.W.; writing—review and editing, M.K.; visualization, M.W and M.K.; supervision, M.K.; project administration, M.K.; funding acquisition, M.K. All authors have read and agreed to the published version of the manuscript.

Funding

The publication was created as a result of work under: Name of the competition: Ścieżka dla Mazowsza, Agreement No. MAZOWSZE/0123/19-00, Subject: “Innovative ecological CNG installation for diesel engines limiting the emission of harmful exhaust components together with a mobile diagnostic platform”.

Institutional Review Board Statement

Not applicable.

Informed Consent Statement

Not applicable.

Data Availability Statement

Not applicable.

Conflicts of Interest

The authors declare no conflict of interest.

Abbreviations

alongitudinal distance from center of gravity to front axle
avvehicle acceleration
Axfrontal area of the vehicle body
blongitudinal distance from center of gravity to rear axle
bwfront track width
CNGCompressed Natural Gas
CO2Carbon Dioxide
COCarbon Oxide
CDaerodynamic drag coefficient
Dperformance factor
dv/dtvehicle acceleration
FDaerodynamic drag force
FdHforce acting in drawbar
Fggrading resistance
Fiinertia force
FPpulling force
Frrolling resistance
frrolling resistance coefficient
FTtraction force
FRTtotal resistance force
gstandard gravity
Hvehicle height
hSheight of the center of mass
hDheight of the center of wind pressure
hHheight of towing hitch
igbgear box ratio
Ikmoment of interia of k-th rotating element reduced to the driving wheel axis
idldriveline ratio
Lwheelbase
LNGLiquid Natural Gas
mvehicle mass
NOxNitrogen Oxides
NO2Nitrogen Dioxide
Peengine power
Pttraction power
nsengine speed (rpm)
rDdynamic rolling radius
rKkinematic rolling radius
Scenter of mass
Saacceleration distance
SCRselective catalytic reduction
taacceleration time
Teengine torque
Tiinertia torque
vvehicle speed in m/s
vrrelative speed of vehicle and wind velocity component in the vehicle moving direction
WTtrailer weight
WVvehicle weight
Z1, Z2normal force under front and rear wheels, respectively
αroad inclination angle
αHtilt angle of drawbar
γfill factor of the frontal area of the vehicle body
δrotating mass factor
ηdldriveline efficiency
ρdensity of the ambient air
Ψroad resistance
ωwangular velocity of the driving wheel

References

  1. Marseglia, G.; Vasquez-Pena, B.F.; Medaglia, C.M.; Chacartegui, R. Alternative Fuels for Combined Cycle Power Plants: An Analysis of Options for a Location in India. Sustainability 2020, 12, 3330. [Google Scholar] [CrossRef] [Green Version]
  2. Marseglia, G.; Rivieccio, E.; Medaglia, C.M. The dynamic role of Italian energy strategies in the worldwide scenario. Kybernetes 2019, 48, 636–649. [Google Scholar] [CrossRef]
  3. Proost, S.; Van Dender, K. Energy and environment challenges in the transport sector. Econ. Transp. 2012, 1, 77–87. [Google Scholar] [CrossRef]
  4. Pietrzak, K.; Pietrzak, O. Environmental effects of electromobility in a sustainable urban public transport. Sustainability 2020, 12, 1052. [Google Scholar] [CrossRef] [Green Version]
  5. Vohra, K.; Vodonos, A.; Schwartz, J.; Marais, E.A.; Sulprizio, M.P.; Mickley, L.J. Global mortality from outdoor fine particle pollution generated by fossil fuel combustion: Results from GEOS-Chem. Environ. Res. 2021, 195, 110754. [Google Scholar] [CrossRef]
  6. Dziubak, T. Experimental Studies of Dust Suction Irregularity from Multi-Cyclone Dust Collector of Two-Stage Air Filter. Energies 2021, 14, 3577. [Google Scholar] [CrossRef]
  7. Dziubak, T. Performance characteristics of air intake pleated panel filters for internal combustion engines in a two-stage configuration. Aerosol Sci. Technol. 2018, 52, 1293–1307. [Google Scholar] [CrossRef]
  8. Wołek, M.; Wolański, M.; Bartłomiejczyk, M.; Wyszomirski, O.; Grzelec, K.; Hebel, K. Ensuring sustainable development of urban public transport: A case study of the trolleybus system in Gdynia and Sopot (Poland). J. Clean. Prod. 2021, 279, 123807. [Google Scholar] [CrossRef]
  9. Grijalva, E.R.; López Martínez, J.M. Analysis of the Reduction of CO2 Emissions in Urban Environments by Replacing Conventional City Buses by Electric Bus Fleets: Spain Case Study. Energies 2019, 12, 525. [Google Scholar] [CrossRef] [Green Version]
  10. Junga, R.; Pospolita, J.; Niemiec, P.; Dudek, M.; Szleper, R. Improvement of coal boiler’s efficiency after application of liquid fuel additive. Appl. Therm. Eng. 2020, 179, 115663. [Google Scholar] [CrossRef]
  11. Feiock, R.C.; Stream, C. Environmental protection versus economic development: A false trade-off? Public Adm. Rev. 2001, 61, 313–321. [Google Scholar] [CrossRef]
  12. Wallander, J.L.; Schmitt, M.; Koot, H.M. Quality of life measurement in children and adolescents: Issues, instruments, and applications. J. Clin. Psychol. 2001, 57, 571–585. [Google Scholar] [CrossRef] [PubMed]
  13. European Mobility Week. Available online: https://ec.europa.eu/inea/en/news-events/events/european-mobility-week-2017 (accessed on 3 April 2021).
  14. Parzentny, H.R.; Róg, L. Distribution and Mode of Occurrence of Co, Ni, Cu, Zn, As, Ag, Cd, Sb, Pb in the Feed Coal, Fly Ash, Slag, in the Topsoil and in the Roots of Trees and Undergrowth Downwind of Three Power Stations in Poland. Minerals 2021, 11, 133. [Google Scholar] [CrossRef]
  15. Frankowski, J. Attention: Smog alert! Citizen engagement for clean air and its consequences for fuel poverty in Poland. Energy Build. 2020, 207, 109525. [Google Scholar] [CrossRef]
  16. Czyżewski, B.; Trojanek, R.; Dzikuć, M.; Czyżewski, A. Cost-effectiveness of the common agricultural policy and environmental policy in country districts: Spatial spillovers of pollution, bio-uniformity and green schemes in Poland. Sci. Total Environ. 2020, 726, 138254. [Google Scholar] [CrossRef] [PubMed]
  17. Adrian, Ł.; Piersa, P.; Szufa, S.; Romanowska-Duda, Z.; Grzesik, M.; Cebula, A.; Kowalczyk, S.; Ratajczyk-Szufa, J. Experimental research and thermographic analysis of heat transfer processes in a heat pipe heat exchanger utilizing as a working fluid R134A. In Renewable 17. Energy Sources: Engineering, Technology, Innovation; Springer: Berlin/Heidelberg, Germany, 2018; pp. 413–421. [Google Scholar]
  18. Emissions of the Main Air Pollutants in Europe. Available online: https://www.eea.europa.eu/data-and-maps/indicators/main-anthropogenic-air-pollutant-emissions-1/assessment (accessed on 3 November 2021).
  19. Eurostat (European Commission). Energy, Transport and Environment Statistics; Collection: Statistical Books; Publications Office of the European Union: Luxembourg, 2020. [Google Scholar] [CrossRef]
  20. 40ton.net. Available online: https://40ton.net/volvo-fh-electric-trafilo-do-oferty-duza-kabina-300-km-zasiegu-664-km-mocy-i-zaporowa-cena/ (accessed on 15 October 2021).
  21. Jamrozik, A.; Tutak, W.; Grab-Rogaliński, K. An Experimental Study on the Performance and Emission of the diesel/CNG Dual-Fuel Combustion Mode in a Stationary CI Engine. Energies 2019, 12, 3857. [Google Scholar] [CrossRef] [Green Version]
  22. Warguła, L.; Kukla, M.; Lijewski, P.; Dobrzyński, M.; Markiewicz, F. Impact of Compressed Natural Gas (CNG) Fuel Systems in Small Engine Wood Chippers on Exhaust Emissions and Fuel Consumption. Energies 2020, 13, 6709. [Google Scholar] [CrossRef]
  23. Lejda, K.; Jaworski, A.; Mądziel, M.; Balawender, K.; Ustrzycki, K.; Savostin-Kosiak, D. Assessment of Petrol and Natural Gas Vehicle Carbon Oxides Emissions in the Laboratory and On-Road Tests. Energies 2021, 14, 1631. [Google Scholar] [CrossRef]
  24. Hanson, R.; Curran, S.; Wagner, R.; Kokjohn, S.; Splitter, D.; Reitz, R. Piston Bowl Optimization for RCCI Combustion in a Light-Duty Multi-Cylinder Engine. SAE Int. J. Engines 2012, 5, 286–299. [Google Scholar] [CrossRef]
  25. Heywood, J.B. Internal Combustion Engine Fundamentals; McGraw-Hill Education: New York, NY, USA, 2018; ISBN 9781260116106. [Google Scholar]
  26. Prochowski, L. Pojazdy Samochodowe. Mechanika Ruchu; Wydawnictwo Komunikacji i Łączności: Warszawa, Poland, 2016; ISBN 978-83-206-1957-7. pp. 69–96. [Google Scholar]
  27. Peng, J.; Wang, T.; Yang, T.; Sun, X.; Li, G. Research on the Aerodynamic Characteristics of Tractor-Trailers with a Parametric Cab Design. Appl. Sci. 2018, 8, 791. [Google Scholar] [CrossRef] [Green Version]
  28. Arczyński, S. Mechanika Ruchu Samochodu; Wydawnictwa Naukowo-Techniczne: Warszawa, Poland, 1994; pp. 92–104. ISBN 83-204-1488-1. [Google Scholar]
  29. Gillespie, T.D. Fundamentals of Vehicle Dynamics; Society of Automotive Engineers: Warrendale, PA, USA, 1992; pp. 1–43. [Google Scholar]
  30. Gao, Y. Vehicle Dynamics and Performance. In Encyclopedia of Sustainability Science and Technology; Meyers, R.A., Ed.; Springer: New York, NY, USA, 2012. [Google Scholar] [CrossRef]
  31. Lanzendoerfer, J.; Szczepaniak, C. Teoria Ruchu Samochodu; WKŁ: Warszawa, Poland, 1980; pp. 120–132. [Google Scholar]
  32. Mitschke, M. Teoria Samochodu. Dynamika Samochodu. Napęd i Hamowanie. Tom 1; WKŁ: Warszawa, Poland, 1987; pp. 86–128. [Google Scholar]
  33. Dz.U.2015 poz. 2022-Obwieszczenie Ministra Infrastruktury i Budownictwa z Dnia 27 Października 2016 r. w Sprawie Ogłoszenia Jednolitego Tekstu Rozporządzenia Ministra Infrastruktury w Sprawie Warunków Technicznych Pojazdów Oraz Zakresu Ich Niezbędnego Wyposażenia; Dziennik Ustaw Rzeczypospolitej Polskiej, Prezes Rady Ministrów: Warszawa, Poland, 2003. Available online: http://isap.sejm.gov.pl/isap.nsf/download.xsp/WDU20030320262/O/D20030262.pdf (accessed on 12 July 2021).
  34. Manufacturer’s Materials, Volvo, Gear Actuator, Design, Function, Repair, Version 2, 2nd ed.; WABCO: Bern, Switzerland, 2020; Available online: https://www.wabco-customercentre.com/catalog/docs/8150202273.pdf (accessed on 15 July 2021).
  35. Volvotrucks.pl. Available online: https://www.volvotrucks.pl/content/dam/volvo/volvo-trucks/markets/poland/Kamil/Volvo-Serii-FH_Dane-Techniczne_PL.pdf (accessed on 15 July 2021).
  36. Semperit.com. Available online: https://blobs.semperit.com/www8/servlet/blob/1203744/c865b910ae14026eeff5a77b81000454/semperit-technical-data-book-data.pdf (accessed on 12 July 2021).
  37. Owczarzak, W.; Sommer, S. The influence of inflation pressure and ambient temperature on the value of the truck tires rolling resistance. Autobusy 2019, 12, 77–82. [Google Scholar] [CrossRef]
  38. Guo, M.; Li, X.; Ran, M.; Zhou, X.; Yan, Y. Analysis of Contact Stresses and Rolling Resistance of Truck-Bus Tyres under Different Working Conditions. Sustainability 2020, 12, 10603. [Google Scholar] [CrossRef]
  39. Wilcox, D. Resistance movement. Transp. Eng. 2006, 8, 20–23. [Google Scholar]
  40. Manufacturer’s Materials, Naczepa Kurtynowa Kögel; TYP: S 24 P 90/1.100. Available online: http://tmc-transport.pl/art/files/8, (accessed on 15 July 2021).
  41. Hucho, W.H. Teoria Samochodu. Aerodynamika Samochodu. Od Mechaniki Przepływu do Budowy Pojazdu; WKŁ: Warszawa, Poland, 1987; pp. 271–302. [Google Scholar]
  42. Schuetz, T.C. Aerodynamics of Road Vehicles. In Commercial Vehicles, 5th ed.; Kopp, S., Frank, T., Eds.; SAE International: Warrendale, PA, USA, 2015; Chapter 10. [Google Scholar]
  43. CITT PL. Aerodynamika Pojazdów o Urwistym Kształcie Nadwozia. Available online: http://lctt.pollub.pl (accessed on 12 July 2021).
  44. Popielawski, S.; Orzech, P.; Wawrzyńska, E.; Gąsior, D.; Sarna, O.; Szmidt, G.; Zientek, I.; Cieśla, M. Wpływ lekkich konstrukcji naczep siodłowych na efektywność procesów logistycznych. Zesz. Stud. Nasze Studiaquot 2019, 9, 78–88. Available online: https://czasopisma.bg.ug.edu.pl/index.php/naszestudia/article/view/3381 (accessed on 6 August 2021).
  45. Dz.U.2016 poz. 124—Rozporządzenie Ministra Transportu i Gospodarki Morskiej z Dnia 2 Marca 1999 r. w Sprawie Warunków Technicznych, Jakim Powinny Odpowiadać Drogi Publiczne i Ich Usytuowanie; Dziennik Ustaw Rzeczypospolitej Polskiej, Prezes Rady Ministrów: Warszawa, Poland, 2016. Available online: http://isap.sejm.gov.pl/isap.nsf/download.xsp/WDU20160000124/O/D20160124.pdf (accessed on 13 September 2021).
  46. COMMISSION REGULATION (EU) No 1230/2012 of 12 December 2012 Implementing Regulation (EC) No 661/2009 of the European Parliament and of the Council with Regard to Type-Approval Requirements for Masses and Dimensions of Motor Vehicles and Their Trailers and Amending Directive 2007/46/EC of the European Parliament and of the Council. Available online: https://eur-lex.europa.eu/legal-content/EN/TXT/?uri=CELEX%3A32012R1230 (accessed on 13 September 2021).
  47. Europa-ciezarowki.pl. Available online: https://www.europa-ciezarowki.pl/vi/volvo~b774 (accessed on 15 July 2021).
  48. Yavuz, H.; Bayrakçeken, H.; Aysal, F.E. Comparison of Ideal Traction Hyperbola Curves with Matlab-Simulink in Vehicles. Int. J. Automot. Sci. Technol. 2020, 4, 244–247. [Google Scholar] [CrossRef]
  49. Available online: https://eur-lex.europa.eu/LexUriServ/LexUriServ.do?uri=OJ:L:2011:180:0053:0069:PL:PDF (accessed on 10 April 2021).
  50. Karczewski, M.; Chojnowski, J.; Szamrej, G. A Review of Low-CO2 Emission Fuels for a Dual-Fuel RCCI Engine. Energies 2021, 14, 5067. [Google Scholar] [CrossRef]
  51. Karczewski, M.; Szczęch, L. Influence of the F-34 unified battlefield fuel with bio components on usable parameters of the IC engine. Eksploat. Niezawodn.—Maint. Reliab. 2016, 18, 358–366. [Google Scholar] [CrossRef]
Figure 1. Semi-trailer truck Volvo FH13.
Energies 14 08001 g001
Figure 2. External characteristics of the engine: solid line—torque, dashed line—power.
Energies 14 08001 g002
Figure 3. System of forces and reactions acting on the vehicle (description in the text): S—center of mass, hS—height of the center of mass, hH—height of the towing hitch, hD—height of the center of wind pressure, a, b and L—the distances between the center of mass and the axles of one and the vehicle’s wheelbase, α—road inclination angle, αH—tilt angle of drawbar.
Energies 14 08001 g003
Figure 4. Examples of (a) the tractive effort curves—driving force as a function of speed for a car equipped with a four-speed gearbox, with the marked influence of the angle α of the road inclination on the maximum speed achieved (marked points of intersection) and (b) the dynamic characteristics D = f(v) of a car with the same gearbox.
Energies 14 08001 g004
Figure 5. Schematic diagram of the VTO2214B gearbox design system [34]: 1—Splitter Group gearbox, 2—main gearbox, 3—Range Change Group gearbox, Split High—(SH, i = 0.80), Split Low—(SL, i = 1.00), High Range—(HR, i = 1.00), Low Range—(LR, i = 3.75).
Energies 14 08001 g005
Figure 6. Tractive effort curves determined for: (a) factory data, (b) diesel fuel and (c) diesel/CNG.
Energies 14 08001 g006aEnergies 14 08001 g006b
Figure 7. Change of the achieved maximum speed value depending on the road inclination angle.
Energies 14 08001 g007
Figure 8. Gradeability in each gear of the gearbox.
Energies 14 08001 g008
Figure 9. Power supply field on drive wheels. (a) Factory data, (b) Diesel and (c) Diesel/CNG.
Energies 14 08001 g009
Figure 10. Dynamic characteristics. (a) Factory data, (b) Diesel and (c) Diesel/CNG.
Energies 14 08001 g010
Figure 11. Acceleration achieved in individual gears. (a) Factory data, (b) Diesel and (c) Diesel/CNG.
Energies 14 08001 g011
Figure 12. Time (a), distance (b) and speed during acceleration of the vehicle set (c).
Energies 14 08001 g012
Figure 13. T Map of Diesel/CNG replacement factor.
Energies 14 08001 g013
Figure 14. Emission of gaseous exhaust components during test on diesel fuel and diesel/CNG supply for individual phases of the test: (a) emission of NO, (b) relative change in NO emission, (c) emission of NO2 and (d) relative change in NO2 emission.
Energies 14 08001 g014
Figure 15. Emission of gaseous exhaust components during the R49 test on diesel fuel and diesel/CNG supply for individual phases of the test: (a) emission of nitrogen oxides (NOx), (b) relative change in NOx emission, (c) emission of CH4 and (d) relative change in CH4 emission.
Energies 14 08001 g015
Figure 16. Emission of gaseous exhaust components during the R49 test on diesel fuel and diesel/CNG supply for individual phases of the test: (a) emission of CO, (b) relative change in emission of CO, (c) concentration of CO2 and (d) relative change in emission of CO2.
Energies 14 08001 g016
Figure 17. Extinction coefficient of absorbed radiation during the R49 test on diesel fuel and diesel/CNG supply for individual phases of the test: (a) extinction coefficient of absorbed radiation and (b) relative change in the extinction coefficient of absorbed radiation.
Energies 14 08001 g017
Table 1. List of investigation equipment used during the investigation.
No.Name of Device/Measured QuantityTypeRangeAccuracy
1. Water dynamometer
Torque—Mo,
rotated speed—n
Zöllner PS1-3812/AEMo = (0 ÷ 700) N∙m,
n = (0 ÷ 4000) rpm
±1 N∙m,
±1 rpm,
2.Fuel weight-meter (diesel)AVL 733S Fuel Balance(0 ÷ 200) kg/h±0.005 kg/h
3.Fuel weight-meter (CNG)SwirlMaster FSS450 Intelligent Swirl Flowmeter1.2–104.6 kg/h±0.6% measured quantity
4.Exhaust analyzer—measuring of toxic elements Concentration in exhaust gases
hydrocarbons (HC),
nitrogen oxides (NOx),
AVL CEBIIHC (1.0 ÷ 2200) ppm,
NOx (1.0 ÷ 6000) ppm
±0.1% measured quantity
5.Exhaust analyzer—measuring of toxic elements Concentration in exhaust gases
carbon dioxide (CO2),
carbon monoxide (CO),
nitrogen oxides (NOx),
nitrogen dioxide (NO2),
oxygen (O2).
atmosFIR,
emissions monitoring FTIR systems
CO2 (0.01 ÷ 23)%
CO (1.0 ÷ 11,000) ppm,
NOx (1.0 ÷ 6000) ppm
NO2 (1.0 ÷ 6000)
O2 (0.1 ÷ 21)%
±0.1% measured quantity
6.Smoke concentration—extinction coefficient of light radiation—k.AVL Opacimeter 4390(0.001 ÷ 10.0) m−1±0.002 m−1
7.Thermocouple—measuring of exhaust temperature—TNiCr—NiAl (K)(−50 ÷ 1100) °C±1 °C
8Mass air consumptionSensyMaster FMT430 Thermal Mass Flowmeter120 ÷ 7000 kg/h±1.2 kg/h
Table 2. Comparison of the values of the torque and the useful power used in the traction calculations of a set of vehicles.
Engine SpeedFactory DataDieselDiesel/CNG
RPMN∙mkWN∙mkWN∙mkW
600122076.6----
7001430104.8----
8001650138.2----
9001975186.11850152.91845152.4
10002300240.82190201.52160198.4
11002300264.92170220.82160219.6
12002300289.02160240.62160240.0
13002300313.12110254.72100253.3
14002305337.92110274.52090271.9
15002151337.91980275.91890263.4
16002017337.91840273.51830272.0
17001897337.71720271.71730273.3
18001790337.41600267.61590265.9
19001690336.21500264.81520268.3
20001400293.21260234.11250232.3
21001100241.9920179.5930181.5
Table 3. Identification of the gear ratios of the VTO2214B gearbox.
Type of GearingSplitter GroupMain GearboxRange Change Group
SLSHIIIIIIIVWRLRH
Ratio1.000.803.6052.3801.5301.0003.2253.751.00
GearC1C2123456789101112
Ratio13.5210.828.937.145.744.593.753.002.381.901.531.221.000.80
GearR1R2R3R4
Ratio12.099.683.232.58
Table 4. The maximum road gradient depending on the adopted design speed [45].
Design speed of the road (km/h)120100807060504030
Road grade inclination (%)4.05.06.07.08.09.010.012.0
Table 5. Parameters of the acceleration process.
ParameterMeasurment
Factory DataDieselDiesel/CNG
Distance to reach speed [m]50 km/h248268270
80 km/h102911561163
Time to reach speed [s]50 km/h29.231.531.8
80 km/h69.277.377.9
Distance travel time [s]500 m44.645.845.9
1000 m68.770.670.8
Table 6. Phases of the test cycle with their importance factors—values required by the UNECE Regulation No. 49 [49].
Phases of the test cycle12345678910111213
RPM rangeidlingmiddleidlingnominalidling
RPM during test 6001300130013001300130060017001700170017001700600
Tourqe (%)0102550751000100755025100
Importance factor1/120.080.080.080.080.251/120.10.020.020.020.021/12
Table 7. The obtained results of emissions of individual exhaust gas components and the applicable Euro IV and Euro V standards limits.
Exhaust Componente COe NOxE HC
g/kW∙hg/kW∙hg/kW∙h
Emission on Diesel fuel0.3403.2210.073
Emission on Diesel/CNG1.663.490.91
Emission in accordance with Euro IV requirements1.503.500.46
Emission in accordance with Euro V requirements1.502.000.16
Publisher’s Note: MDPI stays neutral with regard to jurisdictional claims in published maps and institutional affiliations.

