Abstract
Air pollution is a significant problem in city centers. According to public health care in Poland, there is a need for local authorities to propose good purification solutions in both outdoor and indoor conditions. The main objective of this study is the development of an appropriate filtration system for public transport, especially for buses and bus stops. Firstly, the authors justify the need for air filtration in the capital of Poland, Warsaw. The average concentration level of PM10 and PM2.5 dust particles in large Polish cities is presented. In addition, it is underlined that PM2.5 dust particles are carriers for coronavirus COVID-19 and easily inhaled by humans. In the next step, the authors introduce an experimental stand used in the examination of different filtration baffles. The filtration efficiency is defined and calculated according to experimental examinations. In these experiments, an antismog cover for air-conditioning split systems, an H13 HEPA filter and a three-stage filtration baffle (active carbon + F5 filter + EPA11 filter) were taken into consideration, and the efficiency of filtration under pressure-drop conditions and the influence of moisture were ascertained. The best filter setup was thereby determined to be the three-stage filtration baffle, being the most efficient in cleaning air on account of having the smallest mass concentration of PM2.5. This indicates that three-stage filtration is the most suitable air-filtration method for public transportation in cities where air pollution is a serious concern.
1. Introduction
Air quality in Central Europe and especially in Poland is quite low [,]. This is because of both pollutant emissions and climate conditions. Climate is one of the main components of the natural environment. It plays an important role in the functioning of the whole ecosystem. It is defined as a set of long-therm average humidity, temperature, sunshine, rain, wind velocity and atmospheric phenomena, such as frost, fog and hailstorms. All of these are a result of geographical location, i.e., latitude, altitude, or distance from sea or land. They also depend on location in relation to the main structures of the continental relief and the relief of the nearest surroundings, as well as the physical nature of the land surface, type and degree of air pollution. Weather conditions determine the transport of substances in the atmospheric air. The presence of pollutants in the atmosphere affects the weather and climate. Different sources of emissions determine the occurrence of pollution. However, the concentration of pollution in a unit of air volume is primarily dependent on meteorological conditions. These conditions are shaped by the intensity of air turbulence at ground level. Among the meteorological factors mentioned above, the wind speed and its direction are the most important. Wind speed determines the rate of pollution spread, while the direction of the wind is responsible for the route of pollution transport. Average climate conditions are established on the basis of approximately 30 years of measurements.
Pollutant concentration increases on days with sunshine, while high levels of night-time heat radiation from the ground create light wind. These pollutants include waste products (particulate matter, sulphur dioxide, NOx, and CO [,]) from combustion processes [] and other sources, such as fertilisers in agriculture, industrial processes [], cattle breeding or dust rising from mining heaps. Some pollutants are not related to human activity, but come from natural processes, such as volcanic eruptions, weathering of rocks and biological processes. Some of them come from chemical reactions.
Combustion is the most common way of obtaining electric and heat energy in industry, power engineering, households [] or transport. The harmfulness of combustion processes in the power industry and other industries can be reduced by using appropriate technologies to remove pollutants from the exhaust gases (denitrification, desulphurisation, filtration []). It is much more difficult to reduce the adverse effects on human health of emissions from combustion processes in households and transport. Unfortunately, pollutants from such sources are emitted at a relatively low level. However, greater emissions are observed where human concentrations are large. A significant part of household emissions comes from individual buildings. This process occurs in temperate climate areas with a shortage of alternative energy sources (nuclear, hydro and wind power plants) and inefficient heating infrastructure. A. For example, in Poland local boiler plants uses coal as a fuel. The result is a poor air quality, especially in winter in the areas with high population density. Similar difficulties are caused by public transport in city downtown areas [,].
Thus, there is a problem with smog in Poland. Regarding PM10 dust, the permitted annual average concentration is 40 μg/m3, and the permitted 24-h average concentration is 50 μg/m3. According to Polish law, this amount should occur only 35 times a year []. In the case of PM2.5 dust, the permitted annual average concentration level was 20 μg/m3 in 2020. In October 2019, new alarm thresholds were introduced in Poland. A smog alarm is announced when 24-h average mass concentration of PM10 dust exceeds 150 μg/m3 (previously the threshold value for PM10 dust was 300 μg/m3). The informative mass concentration is defined as 100 μg/m3. In 2012, it was 300 μg/m3 and 200 μg/m3, respectively [,]. These amounts were in the highest in the European Union.
In Figure 1 and Figure 2, air quality in Poland is presented for three locations in the centers of the large cities of Warsaw, Cracow and the mountain resort of Zakopane for December, 2018. The graphs show the average 24-h concentrations of PM10 (Figure 1 []) and PM2.5 (Figure 2 []).
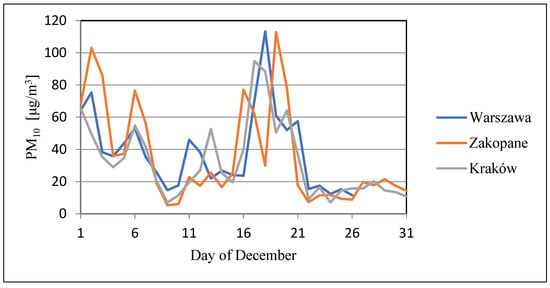
Figure 1.
Daily average urban district PM10 dust concentration in December 2018 [].
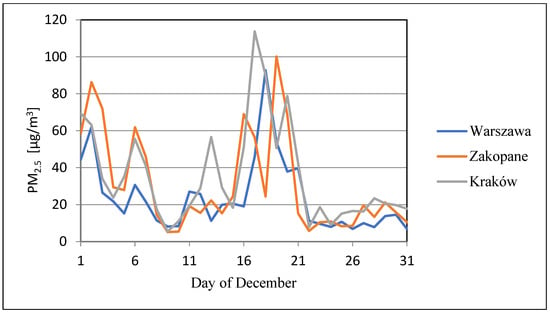
Figure 2.
Daily average urban district PM2.5 concentration in December 2018 [].
Unfortunately, high concentrations of 50–100 μg/m3 and very high concentrations of 100–200 μg/m3 for PM10, and similarly high (30–60 μg/m3) and very high (60–120 μg/m3) for PM2.5 were observed. These are far higher than the amounts recommended by the World Health Organisation [].
Due to this fact, pregnant women, children, the elderly and people suffering from asthma, lung diseases [], skin allergies, eye diseases and cardiovascular diseases (post-myocardial infarction and cardiac arrhythmias) should avoid outdoor physical activity and generally reduce the time spent outdoors. The recommendations for the remaining part of the population are to reduce the time and intensity of outdoor activities. Moreover, according to authorities there is a close link between COVID-19 spread and high levels of PM10 and PM2.5. Coronavirus easily attaches to smog particles and is inhaled directly into human lungs [,].
Thus, there is a strong, growing demand for cleaning the air in people’s close surroundings [,,]. The Heating, Ventilation, Air Conditioning and Refrigeration industry is interested in scientific findings on this matter [,,,]. Some filtration methods could be used in new materials for transparent covers on window glass [], and other technologies could be used to obtain new strong, recyclable and washable filtration material layers [,,,,]. Moreover, an interesting option is to introduce electric forces to eliminate dust contamination [,]. The authors of this manuscript focused on air-purification in city buses and bus stops. In the scientific literature, information can be found regarding special filtration systems in public transport. Some scientists are trying to find a new type of filter material for exactly this solution. Nevertheless, there is a need for quick and inexpensive air purifiers on the market. The possibility of verification of the effectiveness of selected filter elements has also become a common issue.
The main objective of this study was to develop appropriate filtration systems for public transport, namely buses and bus stops.
2. Materials and Method
For the purposes of this project, an experimental stand was prepared. Measurements of air pollution reduction by selected filters were carried out. Air flow, humidity, air temperature and pollutant mass concentrations were variable parameters (Figure 3). The analysis was performed to assess the available filters in the market. This allowed the authors to configure the most suitable filtration system for buses and bus stops to prevent the spread of PM2.5 dust as much as possible. The future producer of such filtration systems will have information about the class of filters and their effectiveness of filtration.
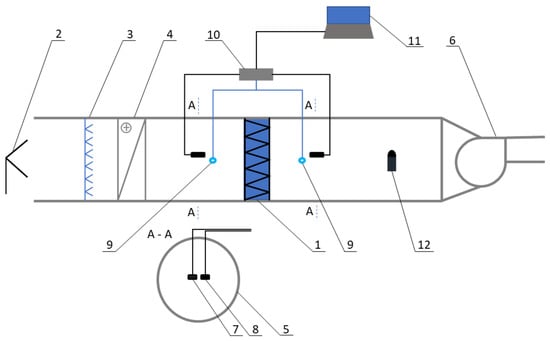
Figure 3.
Overview of experimental stand: 1—filter, 2-source of dust, 3—humidifier, 4–heater, 5—vent pipe, 6—fan, 7—mass concentration sensor (SPS 30), 8—temperature and humidity sensor, 9—differential pressure gauge, 10—measuring card, 11–computer, 12—handheld air speed meter.
The Experiment
The experiments were carried out in laboratory conditions. The fan was turned on, and smoke was made by a generator (BeamZ S500 model, producer: BeamZ, made in Almelo, Holland) and transported to the mixing chamber. The vacuum made by the fan was used to carry polluted air through the filter elements. Simultaneously, measurements of the mass concentrations of dust were taken before and after the use of the filter, and temperature and humidity were recorded. The humidity of the polluted air was regulated by humidifier (water atomiser). The recorded measurements were not of the same time samples, because of the difficulty of stabilising dust mass concentration in polluted air flowing through the filter elements. Under real conditions, the level of contaminant mass concentration fluctuates significantly over hourly and daily periods. The experimental simulation applied to different levels of PM2.5 particles.
The following filters were tested as part of the experiment:
- anti-smog fabric cover;
- H13 HEPA filter (filter element number: IZ-E1, made by Webber+, Posen, Poland);
- filtration baffle: activated carbon layer + F5 filter (filter element number: FB-BMAC-200) + EPA11 filter (filter element number: FH-BMAC-200) produced in (F5 and EPA 11 filter produced by Foshan Shunde Big Climatic Manufacture Co. LTD, FoShan City, China)
For such filters, a reduction in impurities had been determined in a wide range of grain diameters from 0.3 μm to 10 μm. Fine particulate matter was measured using a portable SPS30 Particulate Matter (PM) (made by Sensirion AG, Staefa ZH, Switzerland) sensor, which measurement principle is based on laser scattering. It is a new category of mobile detectors for fast and accurate measurements of dust mass concentrations.
The SPS30 PM is a real-time laser photometer that measures aerosol mass concentrations within a range of 1–1000 μg/m3. It has obtained MCERTS (Monitoring Certification Scheme) certification from Sira Certification Service, and it complies with the regulations within the European Air Quality Standard DIN EN 15267 []. Concentration size ranges are PM1.0—0.3 to 1.0 μm, PM2.5—0.3 to 2.5 μm, PM4.0—0.3 to 4.0 μm, PM10—0.3 to 10.0 μm. The mass concentration precision for PM1.0 and PM2.5 from 0 to 100 µg/m3 is ± 10 µg/m3 and from 100 to 1000 µg/m3 is ± 10%, respectively. The mass concentration precision for PM4.0 and PM10 from 0 to 100 µg/m3 is ± 25 µg/m3 and from 100 to 1000 µg/m3 is ± 25%, respectively. The sensor shows its best performance is obtained when operating within the recommended normal temperature and humidity range of 10–40 °C and 2–80% RH, respectively.
Under real conditions, the level of contaminant mass concentration fluctuates significantly over hourly and daily periods. The main experimental problem was to achieve proper mass concentrations of PM2.5 particles, which could be observed outdoors.
As a result of the measurements carried out, the filtration efficiency of the examined filter baffle could be defined as presented in Equation (1):
The result depended on both the initial mass concentration before filtration and the final mass concentration after the filter baffle. If the difference in dust concentrations before and after filtration was greater, the filtration efficiency was higher, while if the difference in dust concentration was smaller, the filtration efficiency was lower.
3. Results
This section presents the results of laboratory tests. Most of the results concern PM2.5 and small dust mass concentration particles. The measurements allowed the authors to ascertain the efficiency of different filter elements, and to choose the most appropriate, fast and market-available solution for the filtration of harmful smog particles.
3.1. Anti-Smog Fabric Cover
The market offers some solutions for smog filtration. The difficulty lies in meeting the severe restrictions on PM2.5 levels in the environment. Anti-smog covers mounted on split units are considered the first option. An anti-smog cover was mounted on the experimental stand, after which measurements were taken (Figure 4 and Figure 5).
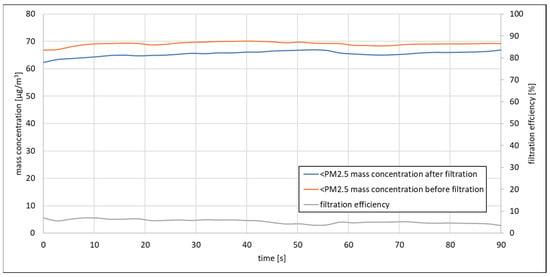
Figure 4.
Mass concentration of ≤PM2.5 size before and after anti-smog fabric cover regarding filtration efficiency (temperature: 11 °C, relative humidity: 50%).
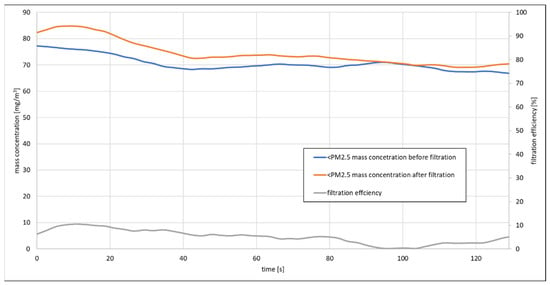
Figure 5.
Mass concentrations of ≤PM2.5 size before and after filtration regarding filtration efficiency (temperature: 11 °C, relative humidity: 50%).
The results of the measurements were confusing. In Figure 4 it can be seen that filtration efficiency was between 6% and 7%. The mass concentration of polluted air was set to replicate real outside conditions when smog is observed in the city. The filtration efficiency was very low, so this anti-smog fabric cover should not be applied in specific anti-smog setups. This is due to non-compliance with the norm established by European law, which states that mass concentrations of ≤PM2.5 should be below 20 µg/m3.
Figure 5 shows high instability in the filtration efficiency of the examined filter, ranging at low levels between 0% and 10%. The decreasing dust mass concentration caused a predictable decrease in the filtration efficiency. Furthermore, in this experiment (Figure 5)—contrary to that in Figure 4—the mass concentrations before and after filtration were almost the same. This evidence indicates a low filtration efficiency in the anti-smog cover.
This confirms the unsuitability of this particular filter for air filtration in buses and bus stops. However, the tested filter is a representative of similar solutions offered by different manufacturers. Thus, the results cannot be generalised to solutions from other suppliers.
3.2. H13 HEPA Filter
For the H13 HEPA filter, the problem with long-term stabilisation of dust mass concentration was also observed (Figure 6). For an illustration of the results, a short time sample is presented in Figure 7.
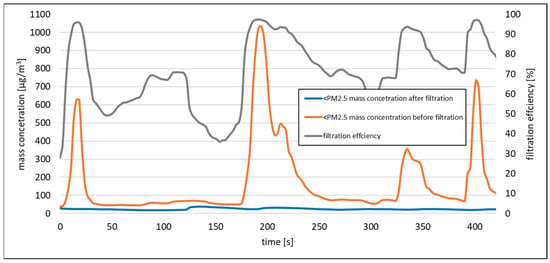
Figure 6.
The change of ≤PM2.5 mass concentration before and after filter element H13 HEPA regarding filtration efficiency (temperature: 15 °C, relative humidity: 47%).
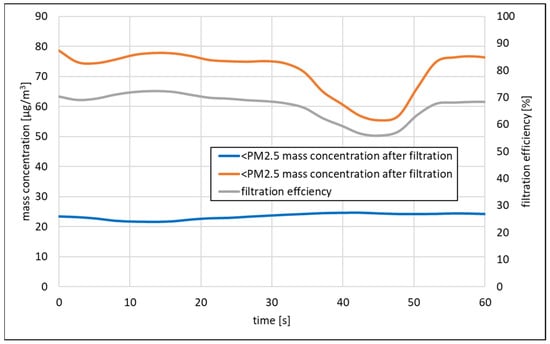
Figure 7.
The change in mass concentrations of dust after application of the H13 HEPA filter element regarding filtration efficiency (temperature: 15 °C, relative humidity: 45%).
Additionally, in Figure 6, it can be seen that the H13 HEPA filter ((filter element number: IZ-E1, made by Webber+, Posen, Poland) made of plastic; specific information about filtration material is registered) has the ability to maintain a constant low level of dust mass concentration after air filtration. The analysis of the filtration efficiency resulted in an observation that the very high mass concentration of ≤PM2.5 dust flowing into the filter and the constantly low mass concentration downstream of the filter after H13 HEPA raised the filtration efficiency to a level much higher than that of the anti-smog fabric cover. Its range was from 40% to nearly 99%.
The result is even more visible in Figure 7, which shows good results for the H13 HEPA filter in the case of ≤PM2.5 dust mass concentration reduction (it is obvious that the filtration efficiency in the case of particles greater than PM2.5 was much higher).
The next step in the research was to find out how the filter element worked under conditions of higher humidity. During the experiment, the humidifier was turned on and the relative humidity raised. The result of the measurement is shown in Figure 8.
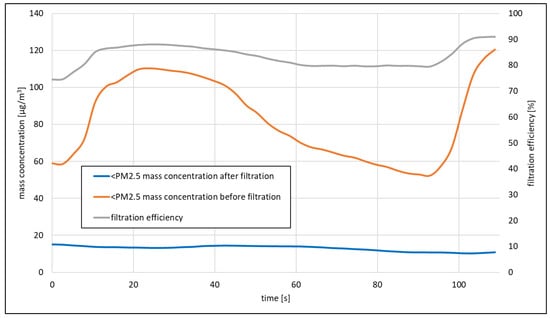
Figure 8.
Mass concentrations of dust ≤ PM2.5 with a higher relative humidity in air after application of H13 HEPA filter regarding filtration efficiency (temperature: 15 °C, relative humidity: 60%).
Increased air humidity results in higher saturation of the filter layer, which results in increased filtration efficiency. The concentration of PM2.5 after filtration drops below 20 µg/m3. This phenomenon could be observed because of a thin mist layer formed on the filter. Thanks to this effect, the filtration efficiency increased to over 80%.
3.3. Activated Carbon Layer + F5 Filter + EPA11 Filter
The last examined setup consisted of the three-stage filtration. Such filtration systems are used in various configurations for the best purification of dusty air.
Figure 9 shows that dust particles of sizes not greater than PM2.5 almost never passed through the filtering system. The obtained concentration was below 3 μg/m3. The filtration efficiency was found to be close to 99.99%.
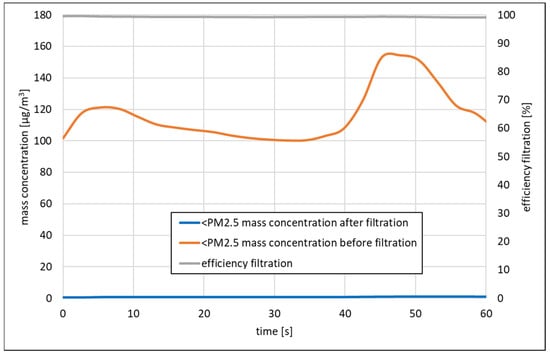
Figure 9.
The change in mass concentrations of dust after application of activated carbon layer + F5 filter + EPA11 filter regarding filtration efficiency (temperature: 14 °C, relative humidity: 42%).
Furthermore, Figure 10 reveals that with very high concentrations of particulate matter (which do not occur in real conditions outdoors) the filtration is practically perfect. At the highest concentrations of 600–700 μg/m3 in inflow air stream, there was only 5–6 mg/m3 behind the filtration system. This indicated that filtration efficiency was close to 99.99%.
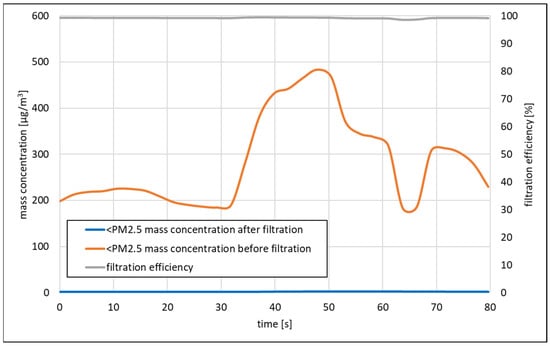
Figure 10.
Mass concentrations of dust before and after application of activated carbon layer + F5 filter + EPA11 filter (temperature: 14 °C, relative humidity: 42%).
Next, this three-stage filter (Table 1) was examined in order to establish the relationship between pressure drop and air stream volume flow. All measurements were performed on rectangular filter sheets 330 × 120 mm. The width of the activated carbon layer was 15 mm, the F5 filter layer was 60 mm and the EPA11 filter layer was 50 mm. The F5 and EPA11 filters were made of plastic (specific information about filtration material is registered).

Table 1.
Characteristics of examined three-stage filter.
The above experiments allowed us to determine which filters selected by the authors were the most appropriate for cleaning the air of smog. During the experiments, the biggest problem was to prepare the concentrations of dust at the inlet of the examined filter. In further work, this inconvenience must be resolved. In the flow system, obtaining high relative humidity was also a problem. Future analyses should also allow for an increase in recording time in order to facilitate the best selection of the filtration system for the desired solution.
4. Conclusions
This article responds to the need to protect people from excessive airborne dust pollution in large urban agglomerations. The aim of this research was to compose the best filter baffle for city buses and bus stops to remove dust particles PM2.5 in size. It is known that PM2.5 dust is the most dangerous for human health due to its ability to penetrate through human upper airways and then through the alveoli into bloodstream.
While there are some filters with high nominal filtration efficiency on the market, the main problem is to develop a filter setup for the required air volumetric flow rate. Analysing the results of the study, it should be stated that the best results were obtained for the H13 HEPA type filter, which practically eliminated the concentrations of particulate matter in the air. The filter, in the form of a three-stage system, with particular emphasis on the class F5 and EPA11 filter layers, permitted reduction of concentrations of PM2.5 dust to the level treated as the safety limit, i.e., 25 mg/m3. It should be noted that moderate dampness of the filter due to higher air humidity improved filtration efficiency, although in the long term it may weaken its mechanical structure. It is important to note that the anti-smog screen used by some split air conditioner manufacturers did not fulfil requirements. The efficiency of PM10 and PM2.5 particulate matter retention was practically negligible.
The results shown in the graphs represent repeatable measurement data. The maintained repeatability of the measured values allows us to conclude that the test results represent the actual efficiencies of the selected filtration systems. Experiments related to anti-smog filtration should be continued. Better control of simulated mass concentrations of the dust and humidity of the flow air should be taken into consideration, and filters should be also observed over longer periods.
It should be emphasised that the research presented here is part of a number of studies currently being conducted around the world checking the effectiveness of various air treatment methods in order to protect the daily health and life of people living in large urban agglomerations. These studies facilitate the verification of the filtration methods used so far and help producers find ways to increase the efficiency of air purification.
Author Contributions
Conceptualisation: A.R. (Artur Rusowicz), A.G. and A.R. (Adam Ruciński).; methodology: R.L. and G.N., formal analysis: M.J.; investigation: M.J., R.L and A.R. (Adam Ruciński).; resources: G.N. and A.B.; writing: A.B. and A.R. (Adam Ruciński)., A.R. (Artur Rusowicz); writing—review and editing: A.G. and A.R. (Adam Ruciński). All authors have read and agreed to the published version of the manuscript.
Funding
This research received no external funding.
Conflicts of Interest
The authors declare no conflict of interest.
References
- Rogula-Kozłowska, W.; Kozielska, B.; Klejnowski, K.; Szopa, S. Hazardous compounds in urban PM in the central part of upper Silesia (Poland) in winter. Arch. Environ. Prot. 2013, 39, 53–65. [Google Scholar] [CrossRef]
- 2019 World Air Quality Report. Region & City PM2.5 Ranking. IQAir. 2020. Available online: https://www.iqair.com (accessed on 12 February 2021).
- Wielgosiński, G.; Łechtańska, P.; Namiecińska, O. Emmision of some pollutants from biomass combustion in comparison to hard coal combustion. J. Energy Inst. 2017, 90, 787–796. [Google Scholar] [CrossRef]
- Qian, X. Statistical Analysis and Evaluation of the Advanced Biomass and Natural Gas Co-Combustion Performance. Ph.D. Thesis, Morgan State University, Baltimore, MD, USA, 2019. [Google Scholar]
- Nozari, V.; Beheshti, B.; Ghobadian, B.; Borghei, S.A.M. Investigation exhaust emissions and performance characteristics of a diesel engine by using addition of nanoparticles to diesel fuel. J. Power Technol. 2020, 100, 129–137. [Google Scholar]
- Ruciński, A.; Rusowicz, A.; Rucińska, K. Identyfikacja spektralna gazowych i stałych odpadów z przetwórstwa gumy. Przemysł Chem. 2016, 95, 1325–1329. [Google Scholar] [CrossRef]
- Owczarek, M.; Owczarek, S.; Baryłka, A.; Grzebielec, A. Measurement method of thermal diffusivity of the building wall for summer and winter seasons in Poland. Energies 2021, 14, 3836. [Google Scholar] [CrossRef]
- Grzebielec, A.; Rusowicz, A.; Szelągowski, A. Air purification in industrial plants producing automotive rubber components in terms of energy efficiency. Open Eng. 2017, 7, 106–114. [Google Scholar] [CrossRef]
- Dales, R.; Liu, L.; Szyszkowicz, M.; Dalipaj, M.; Willey, J.; Kulka, R.; Ruddy, T.D. Particulate air pollution and vascular reactivity: The bus stop study. Int. Arch. Occup. Environ. Health 2007, 81, 159–164. [Google Scholar] [CrossRef]
- Rusowicz, A.; Grzebielec, A.; Ruciński, A.; Niewiński, G.; Laskowski, R.; Jaworski, M.; Mielewczyk, W.; Całun-Nadulski, K. Review of air purification methods in urban open spaces. Mod. Eng. 2019, 3, 103–108. [Google Scholar]
- Directive 2008/50/EC of the European Parliament and of the Council of 21 May 2008 on Ambient Air Quality and Cleaner Air for Europe. In Official Journal of the European Union; L 152/1; European Union: Brussels, Belgium, 2008.
- Regulation of the Minister of the Environment of 24 August 2012 on the Levels of Certain Substances in the Air. Journal of Laws 2012, Item 1031. Available online: http://isap.sejm.gov.pl/isap.nsf/DocDetails.xsp?id=WDU20120001031 (accessed on 5 November 2021).
- Regulation of the Minister of the Environment of 8 October 2019 Amending the Regulation on the Use of Certain Substances in the Air. Journal of Laws 2019, Item 1931. Available online: http://isap.sejm.gov.pl/isap.nsf/DocDetails.xsp?id=WDU20190001931 (accessed on 5 November 2021).
- Bank Danych Pomiarowych. Available online: https://powietrze.gios.gov.pl/pjp/archives (accessed on 5 November 2021).
- Davidson, C.I.; Phalen, R.F.; Solomon, P.A. Airborne particulate matter and human health: A review. Aerosol Sci. Technol. 2005, 39, 737–749. [Google Scholar] [CrossRef]
- Gong, W.; Zhang, T.; Zhu, Z.; Ma, Y. Characterisitics of PM1.0, PM2.5 and PM10 and Their Relation to Black Carbon in Wuhan, Central China. Atmophere 2015, 6, 1377–1387. [Google Scholar] [CrossRef] [Green Version]
- Zoran, M.A.; Savastru, R.S.; Savastru, D.M.; Tautan, M.N. Assessing the relationship between ground levels of ozone (O3) and nitrogen dioxide (NO2) with coronavirus (COVID-19) in Milan, Italy. Sci. Total Environ. 2020, 740, 140005. [Google Scholar] [CrossRef]
- Coccia, M. Factors determining the diffusion of COVID-19 and suggested strategy to prevent future accelerated viral infectivity similar to COVID. Sci. Total Environ. 2020, 729, 138474. [Google Scholar] [CrossRef]
- Kabrein, H.; Yusof, M.Z.M.; Leman, A.M. Progresses of filtration for removing particles and gases pollutants of indoor. Limitations and future direction. Review article. ARPN J. Eng. Appl. Sci. 2016, 11, 3633–3639. [Google Scholar]
- Wang, C.; Zhang, J.; Zhou, J. PM2.5 Filtration Device and Filtration Method of Automobile Air Conditioner Filter. Patent CN104707439A, 17 June 2015. Available online: https://patents.google.com/patent/CN104707439A/en (accessed on 5 November 2021).
- Liu, G.; Xiao, M.; Zhang, X.; Gal, C.; Chen, X.; Liu, L.; Pan, S.; Wu, J.; Tang, L.; Clements-Croome, D. A review of air filtration technologies for sustainable and healthy building ventilation. Sustain. Cities Soc. 2017, 32, 375–396. [Google Scholar] [CrossRef]
- Araji, M.T.; Ray, S.D.; Leung, L. Pilot-study on airborne PM2.5 filtration with particle accelerated collision technology in office environments. Sustain. Cities Soc. 2017, 1, 101–107. [Google Scholar] [CrossRef]
- Ma, H.; Shen, H.; Shui, T.; Li, Q.; Zhou, L. Experimental Study on Ultrafine Particle Removal Performance of Portable Air Cleaners with Different Filters in an Office Room. Int. J. Environ. Res. Public Health 2016, 13, 102. [Google Scholar] [CrossRef] [Green Version]
- Fermo, P.; Comite, V.; Falciola, L.; Guglielmi, V.; Miani, A. Efficiency of an Air Cleaner Device in Reducing Aerosol Particulate Matter (PM) in Indoor Environments. Int. J. Environ. Res. Public Health 2020, 17, 18. [Google Scholar] [CrossRef] [Green Version]
- Huang, W.-R.; He, Z.; Wang, J.-L.; Liu, J.-W.; Yu, S.-H. Mass Production of Nanowire-Nylon Flexible transparent Smart Windows for PM2.5 Capture. iScience 2019, 12, 333–341. [Google Scholar] [CrossRef] [Green Version]
- Bai, Y.; Han, C.B.; He, C.; Gu, G.Q.; Nie, J.H.; Shao, J.J.; Xiao, T.X.; Deng, C.R.; Wang, Z.L. Washable Multilayer Triboelectric Air Filter for Efficient Particulate Matter PM2.5 Removal. Adv. Funct. Mater. 2018, 28, 1706680. [Google Scholar] [CrossRef]
- Choi, S.-J.; Kim, K.H.; Kim, H.J.; Yoon, J.S.; Lee, M.J.; Choi, K.-S.; Sung, U.-D.; Park, W.-T.; Lee, J.; Jeon, J.; et al. Highly Efficiant, Flexible, and Recyclable Air Filters Using Polyimide Films with Patterned Thru-Holes Fabricated by Ion Miling. Appl. Sci. 2019, 9, 235. [Google Scholar] [CrossRef] [Green Version]
- Liu, H.; Huang, J.; Mao, J.; Chen, Z.; Chen, G.; Lai, Y. Transparent antibacterial nanofiber air filters with highly efficient moisture resistance for sustainable particulate matter capture. iScience 2019, 19, 214–223. [Google Scholar] [CrossRef] [PubMed] [Green Version]
- Qian, X.; Lee, S.; Chandrasekaran, R.; Yang, Y.; Caballes, M.; Alamu, O.; Chen, G. Electricity Evaluation and Emission Characteristics of Poultry Litter Co-Combustion Process. Appl. Sci. 2019, 9, 4116. [Google Scholar] [CrossRef] [Green Version]
- Feng, J.; Wang, J.; Hwang, W.; Young, M. Characterization of filter media prepared from aligned nanofibers for fine dust screen. J. Appl. Polym. Sci. 2019, 136, 48166. [Google Scholar] [CrossRef]
- Han, K.S.; Lee, S.; Kim, M.; Park, P.; Lee, M.H.; Min, H.; Nah, J. Electrically Activated Ultrathin PVDF-TrFE Air Filter for High-Efficiency PM1.0 Filtration. Adv. Funct. Mater. 2019, 29, 37. [Google Scholar] [CrossRef]
- Ching-Wen, L.; Shih, Y.-H.; Chen-Hung, H.; Shu-An, L.; Yueh-Sheng, C.; Jia-Horng, L. Filtration Effciency of Electret Air Filters Reinforced by Titanium Dioxide. Appl. Sci. 2020, 10, 2686. [Google Scholar] [CrossRef] [Green Version]
- MCERTS Product Confirmity Certificate. Available online: https://www.csagroup.org/wp-content/uploads/MC-20035001.pdf (accessed on 10 November 2021).
Publisher’s Note: MDPI stays neutral with regard to jurisdictional claims in published maps and institutional affiliations. |
© 2021 by the authors. Licensee MDPI, Basel, Switzerland. This article is an open access article distributed under the terms and conditions of the Creative Commons Attribution (CC BY) license (https://creativecommons.org/licenses/by/4.0/).