
Ridon Vehicle: Drive-by-Wire System for Scaled Vehicle Platform and Its Application on Behavior Cloning


Abstract
:1. Introduction
- The drive-by-wire system design for a scaled vehicle.
- Integration of sensor packages to the drive-by-wire system.
- Comprehensive descriptions on the proposed design.
- The full software stack for deep-learning-based study.
- Validations of the proposed hardware and software in behavior cloning study.
2. Related Work
2.1. Modifying a Real Vehicle
2.2. Using a Simulation Environment
2.3. Scaled Vehicle Platforms
2.4. Behavioral Cloning Using End-to-End Approach
3. Vehicle Platform Design
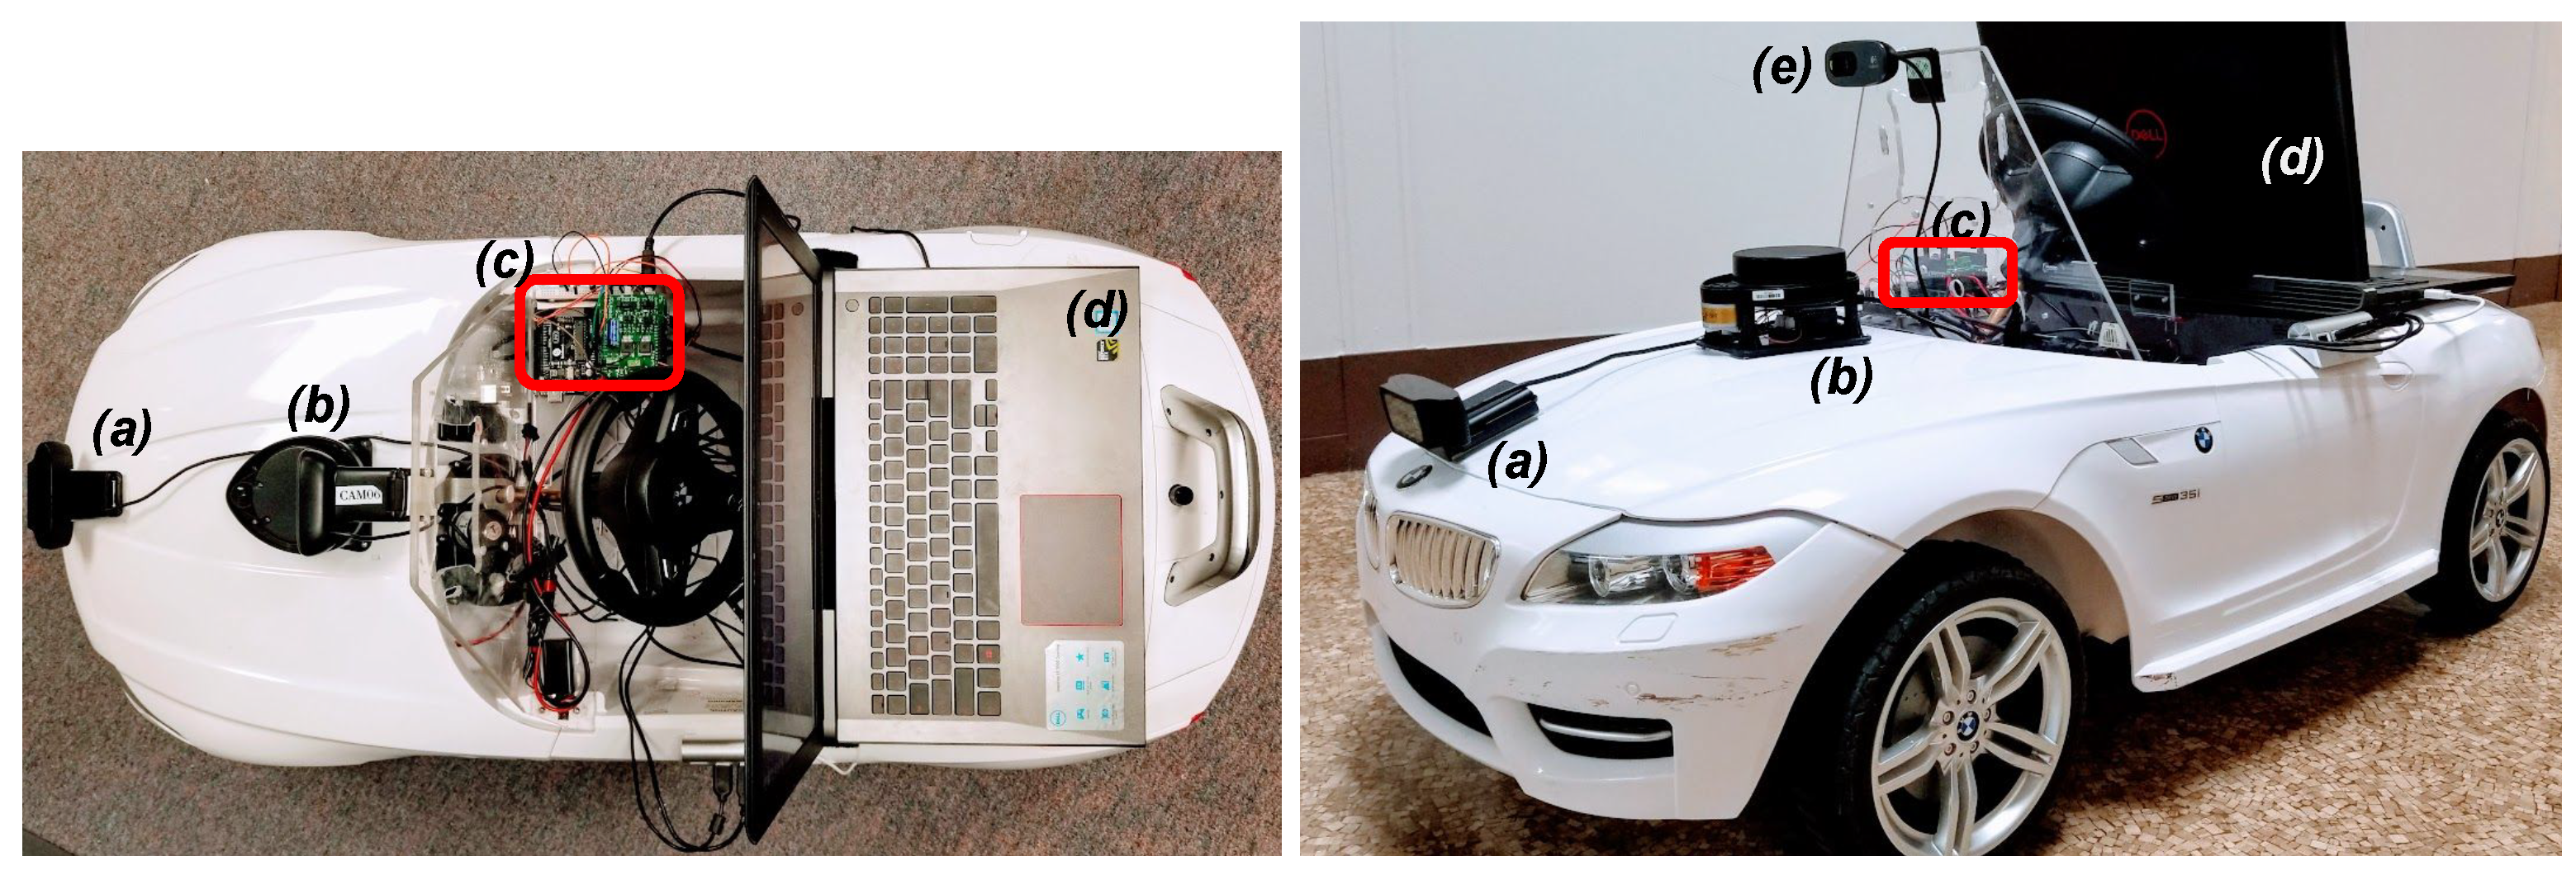
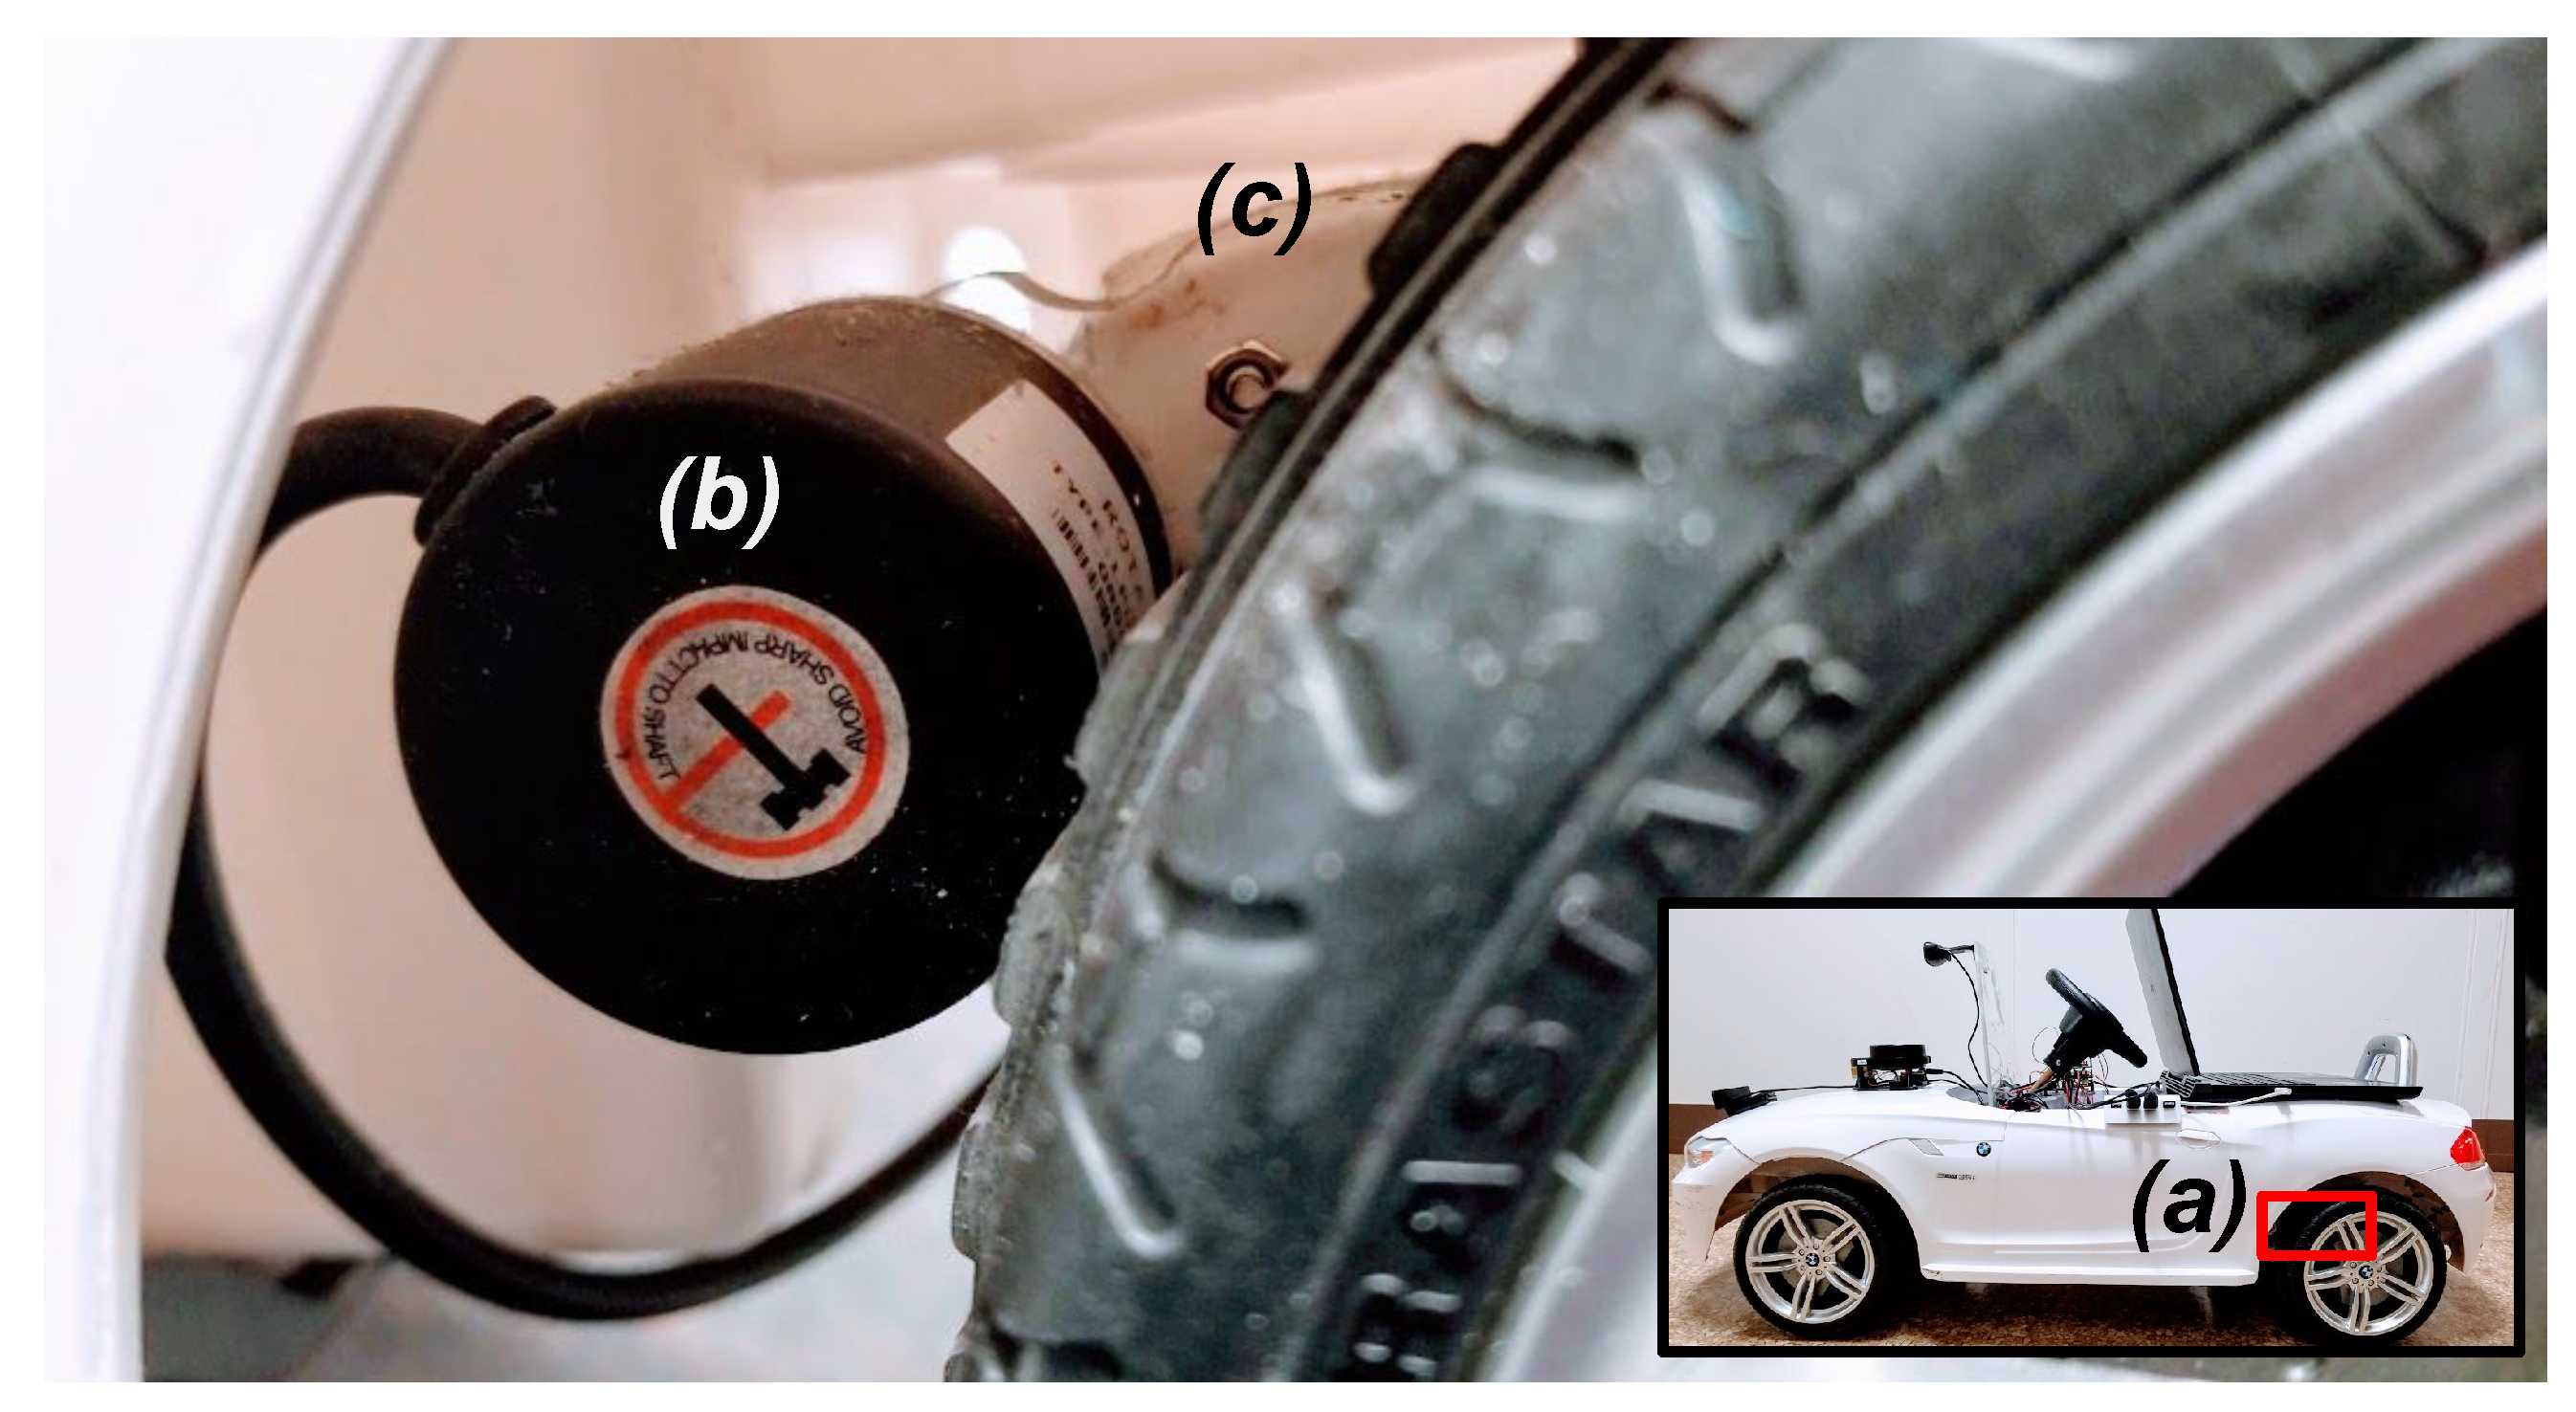
3.1. The Ridon Vehicle
3.2. Car Platform
3.3. Mechatronics Design
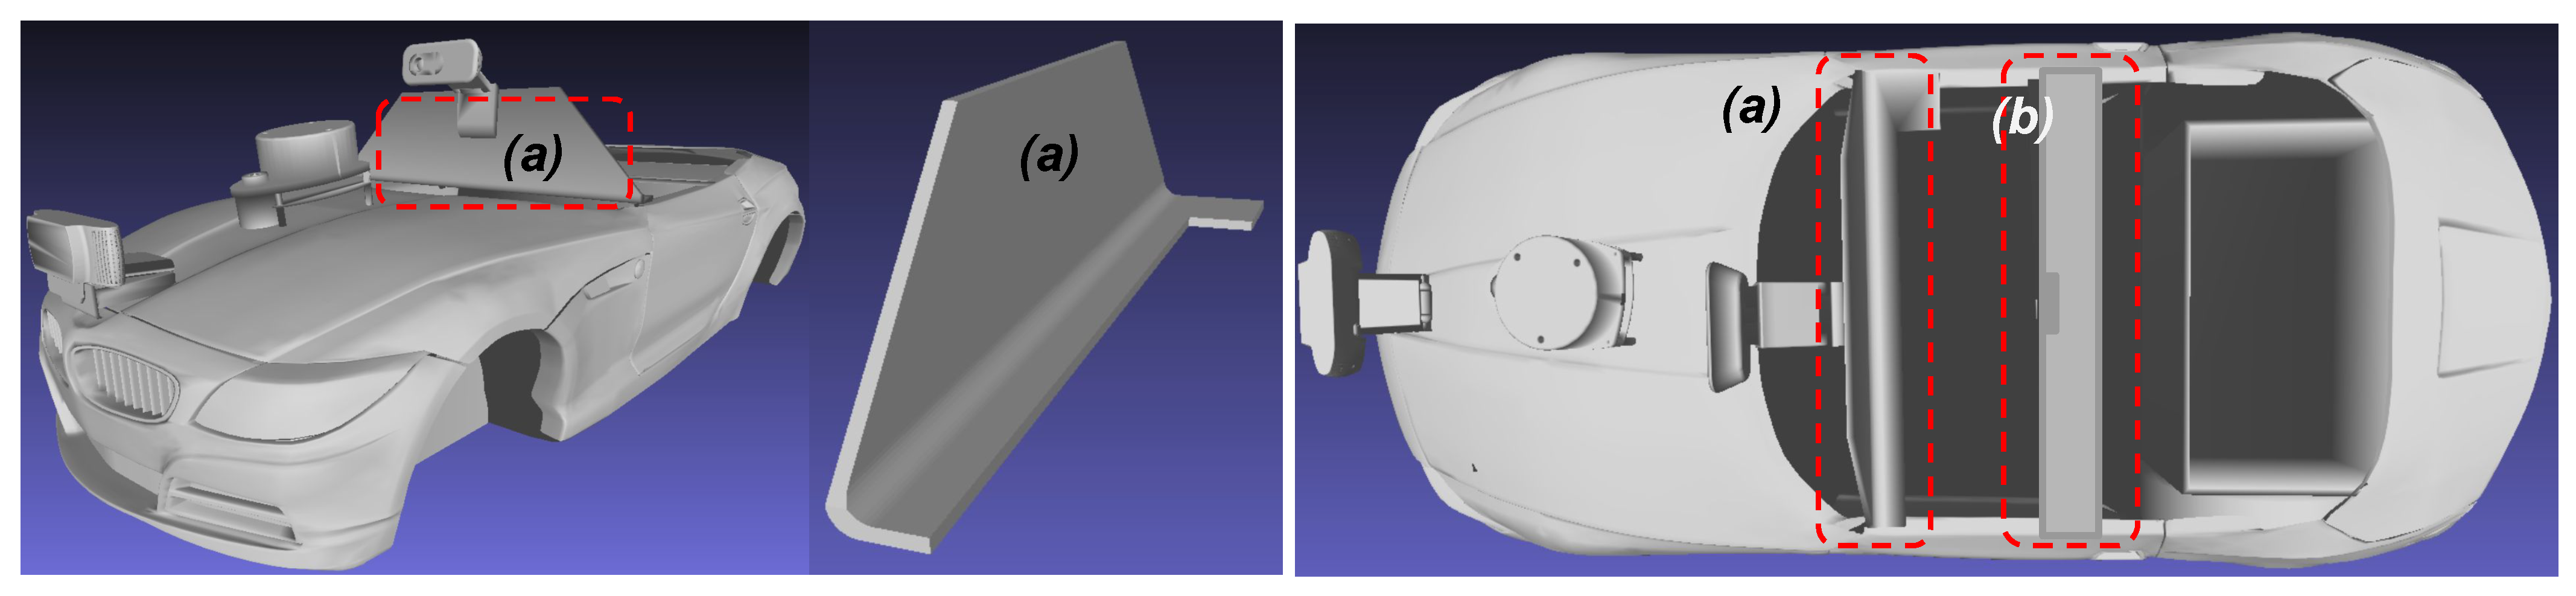
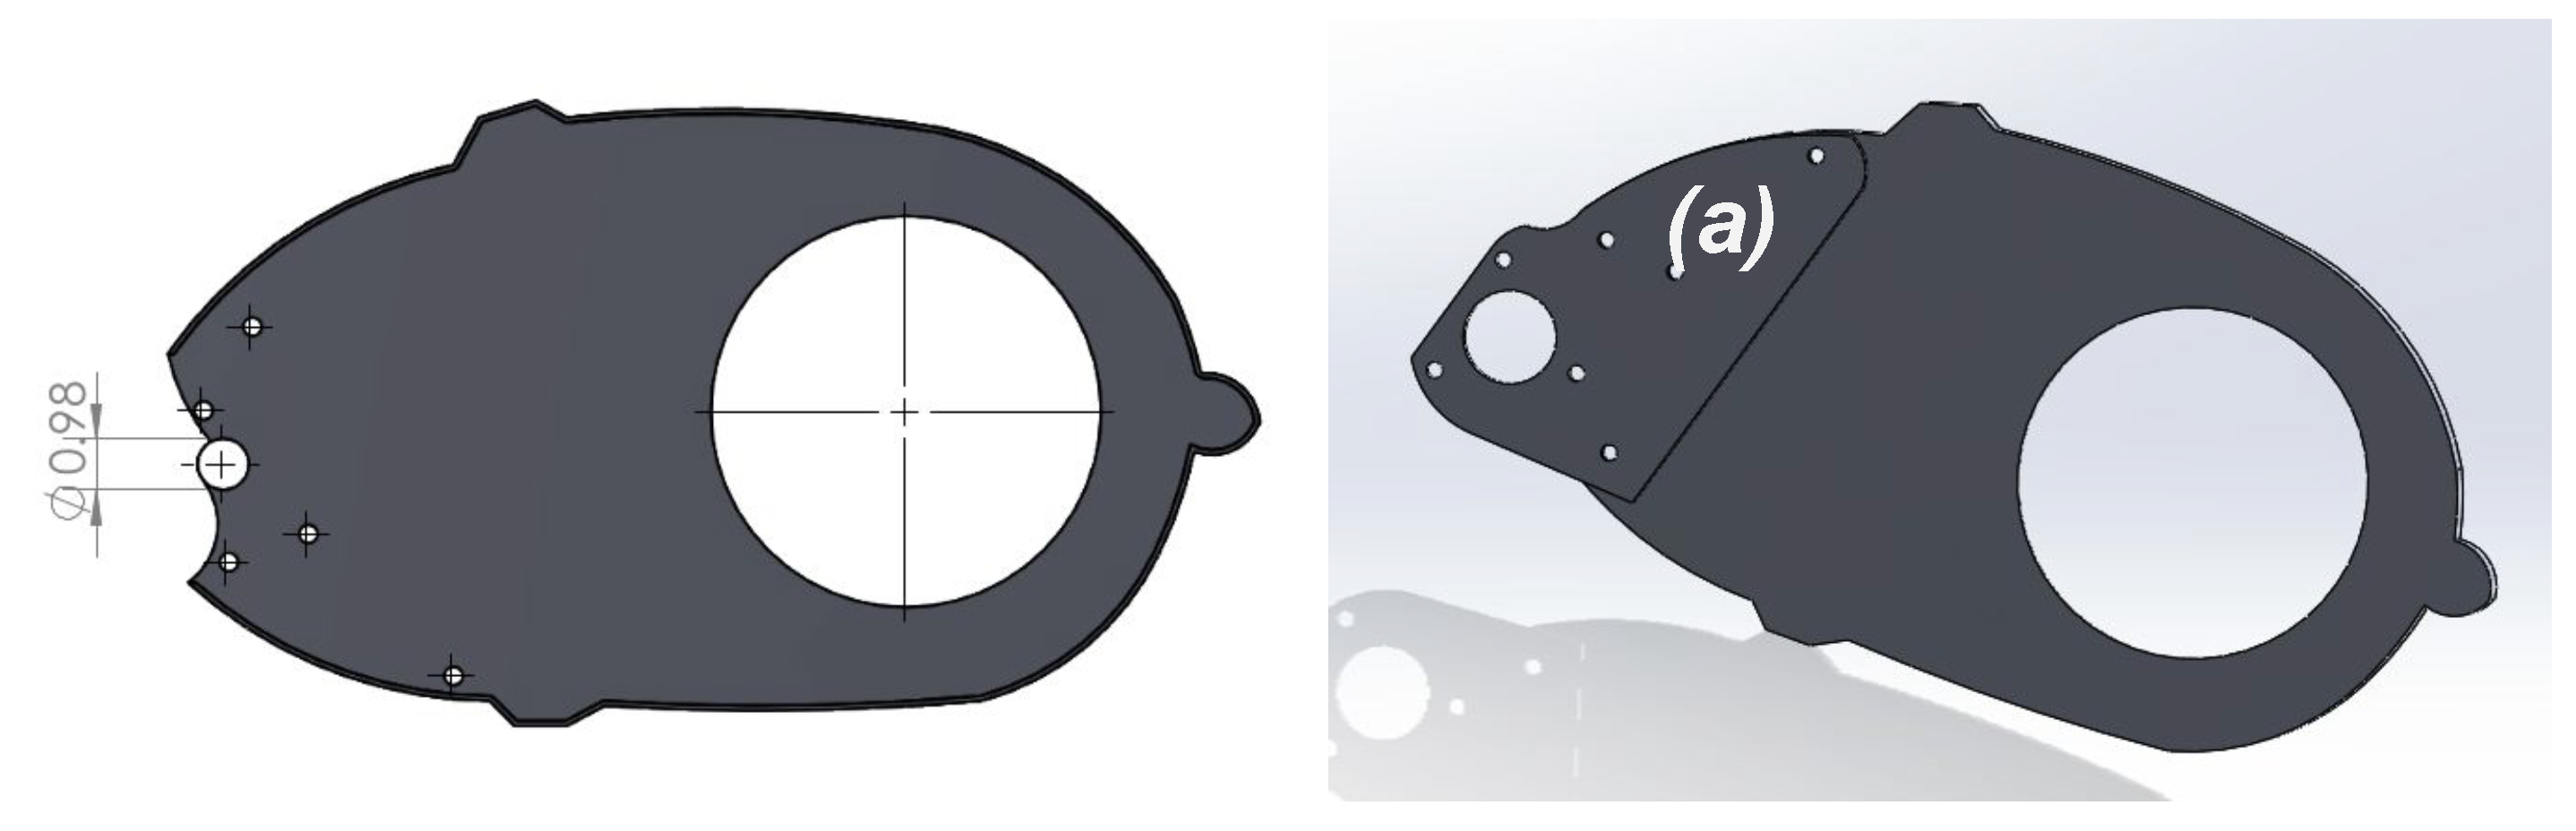
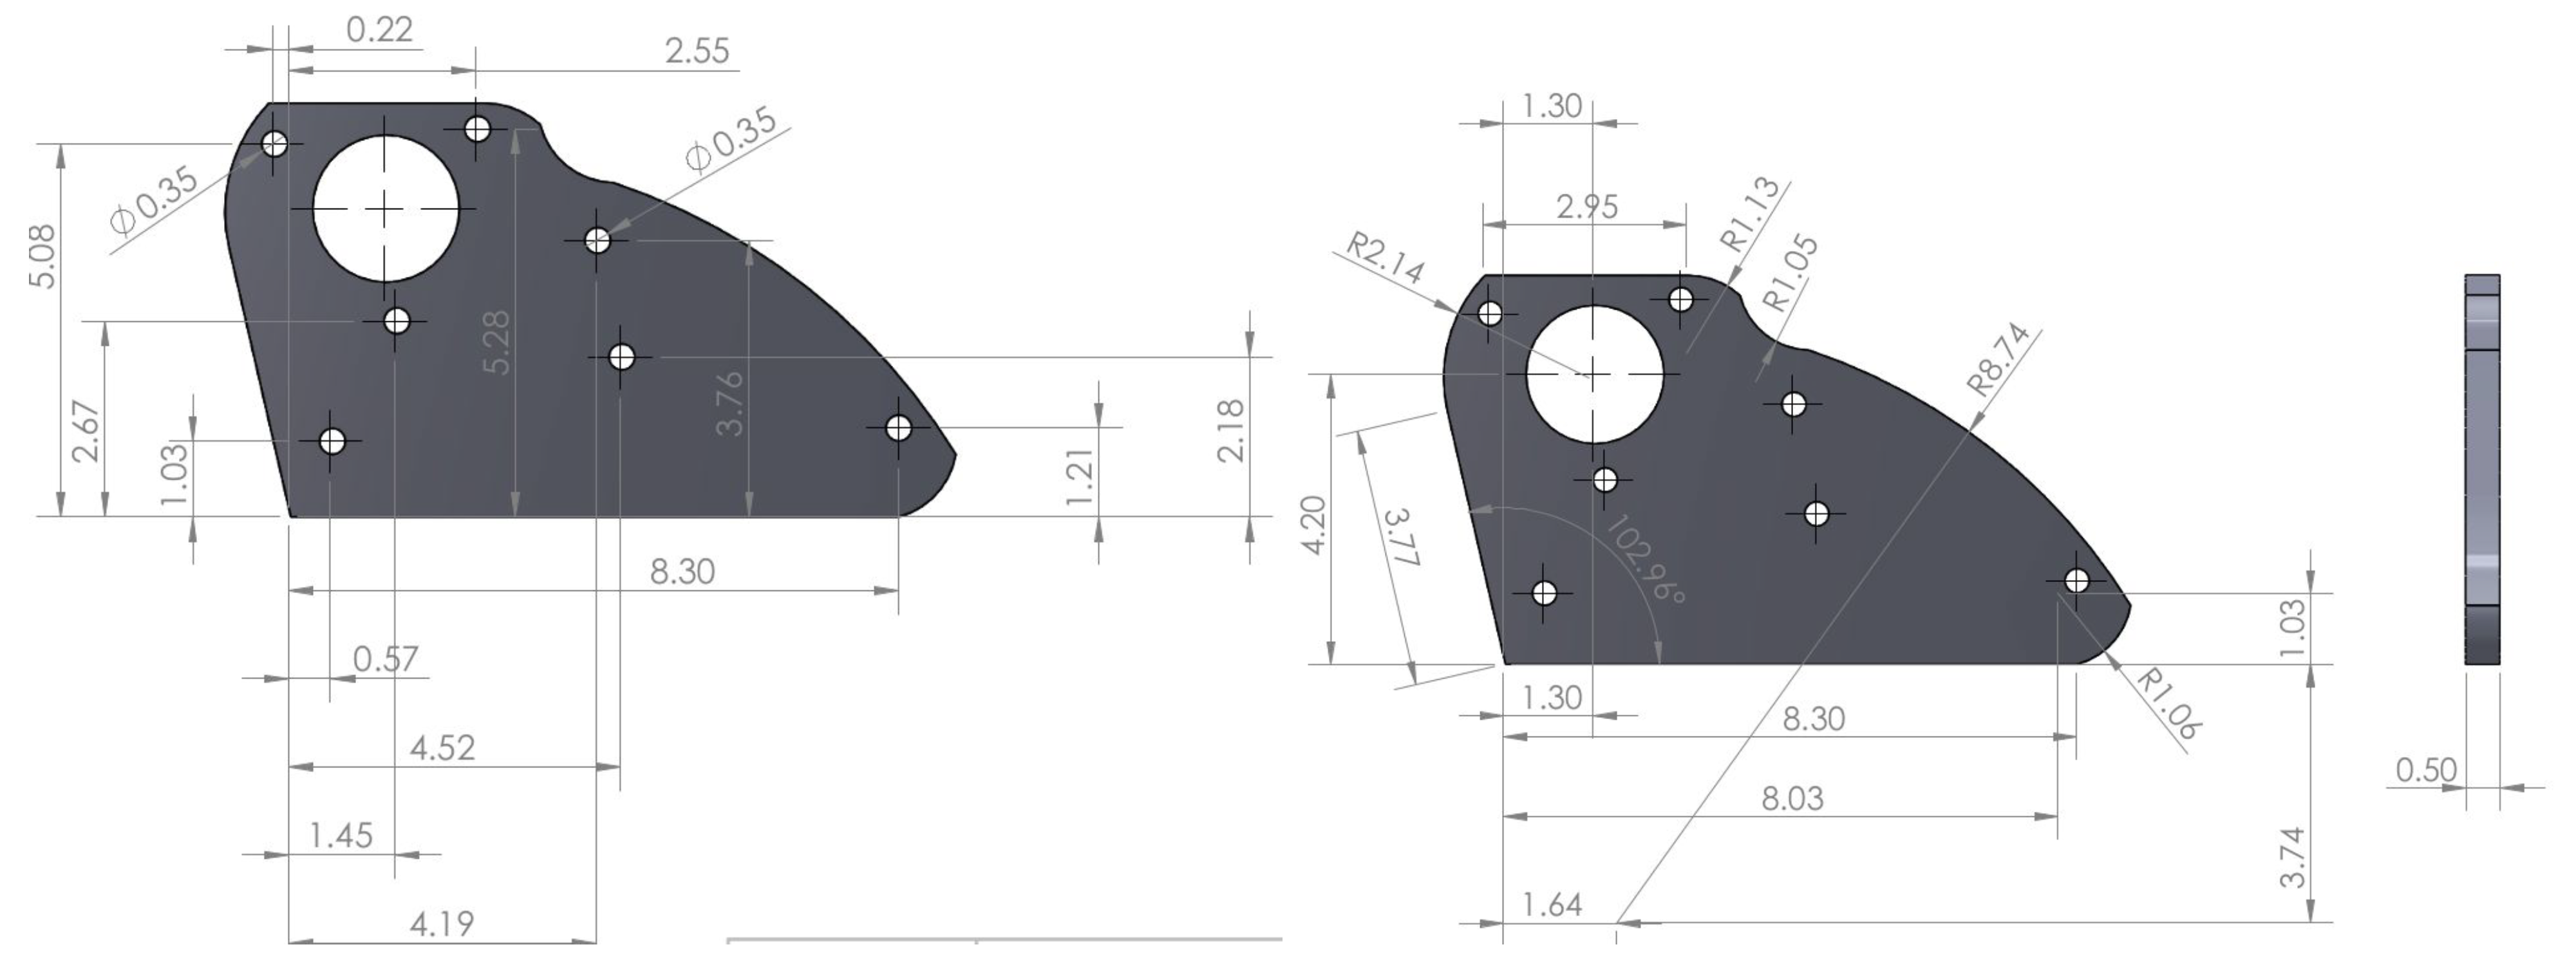
3.3.1. Mechanical Design
Gearbox Modification
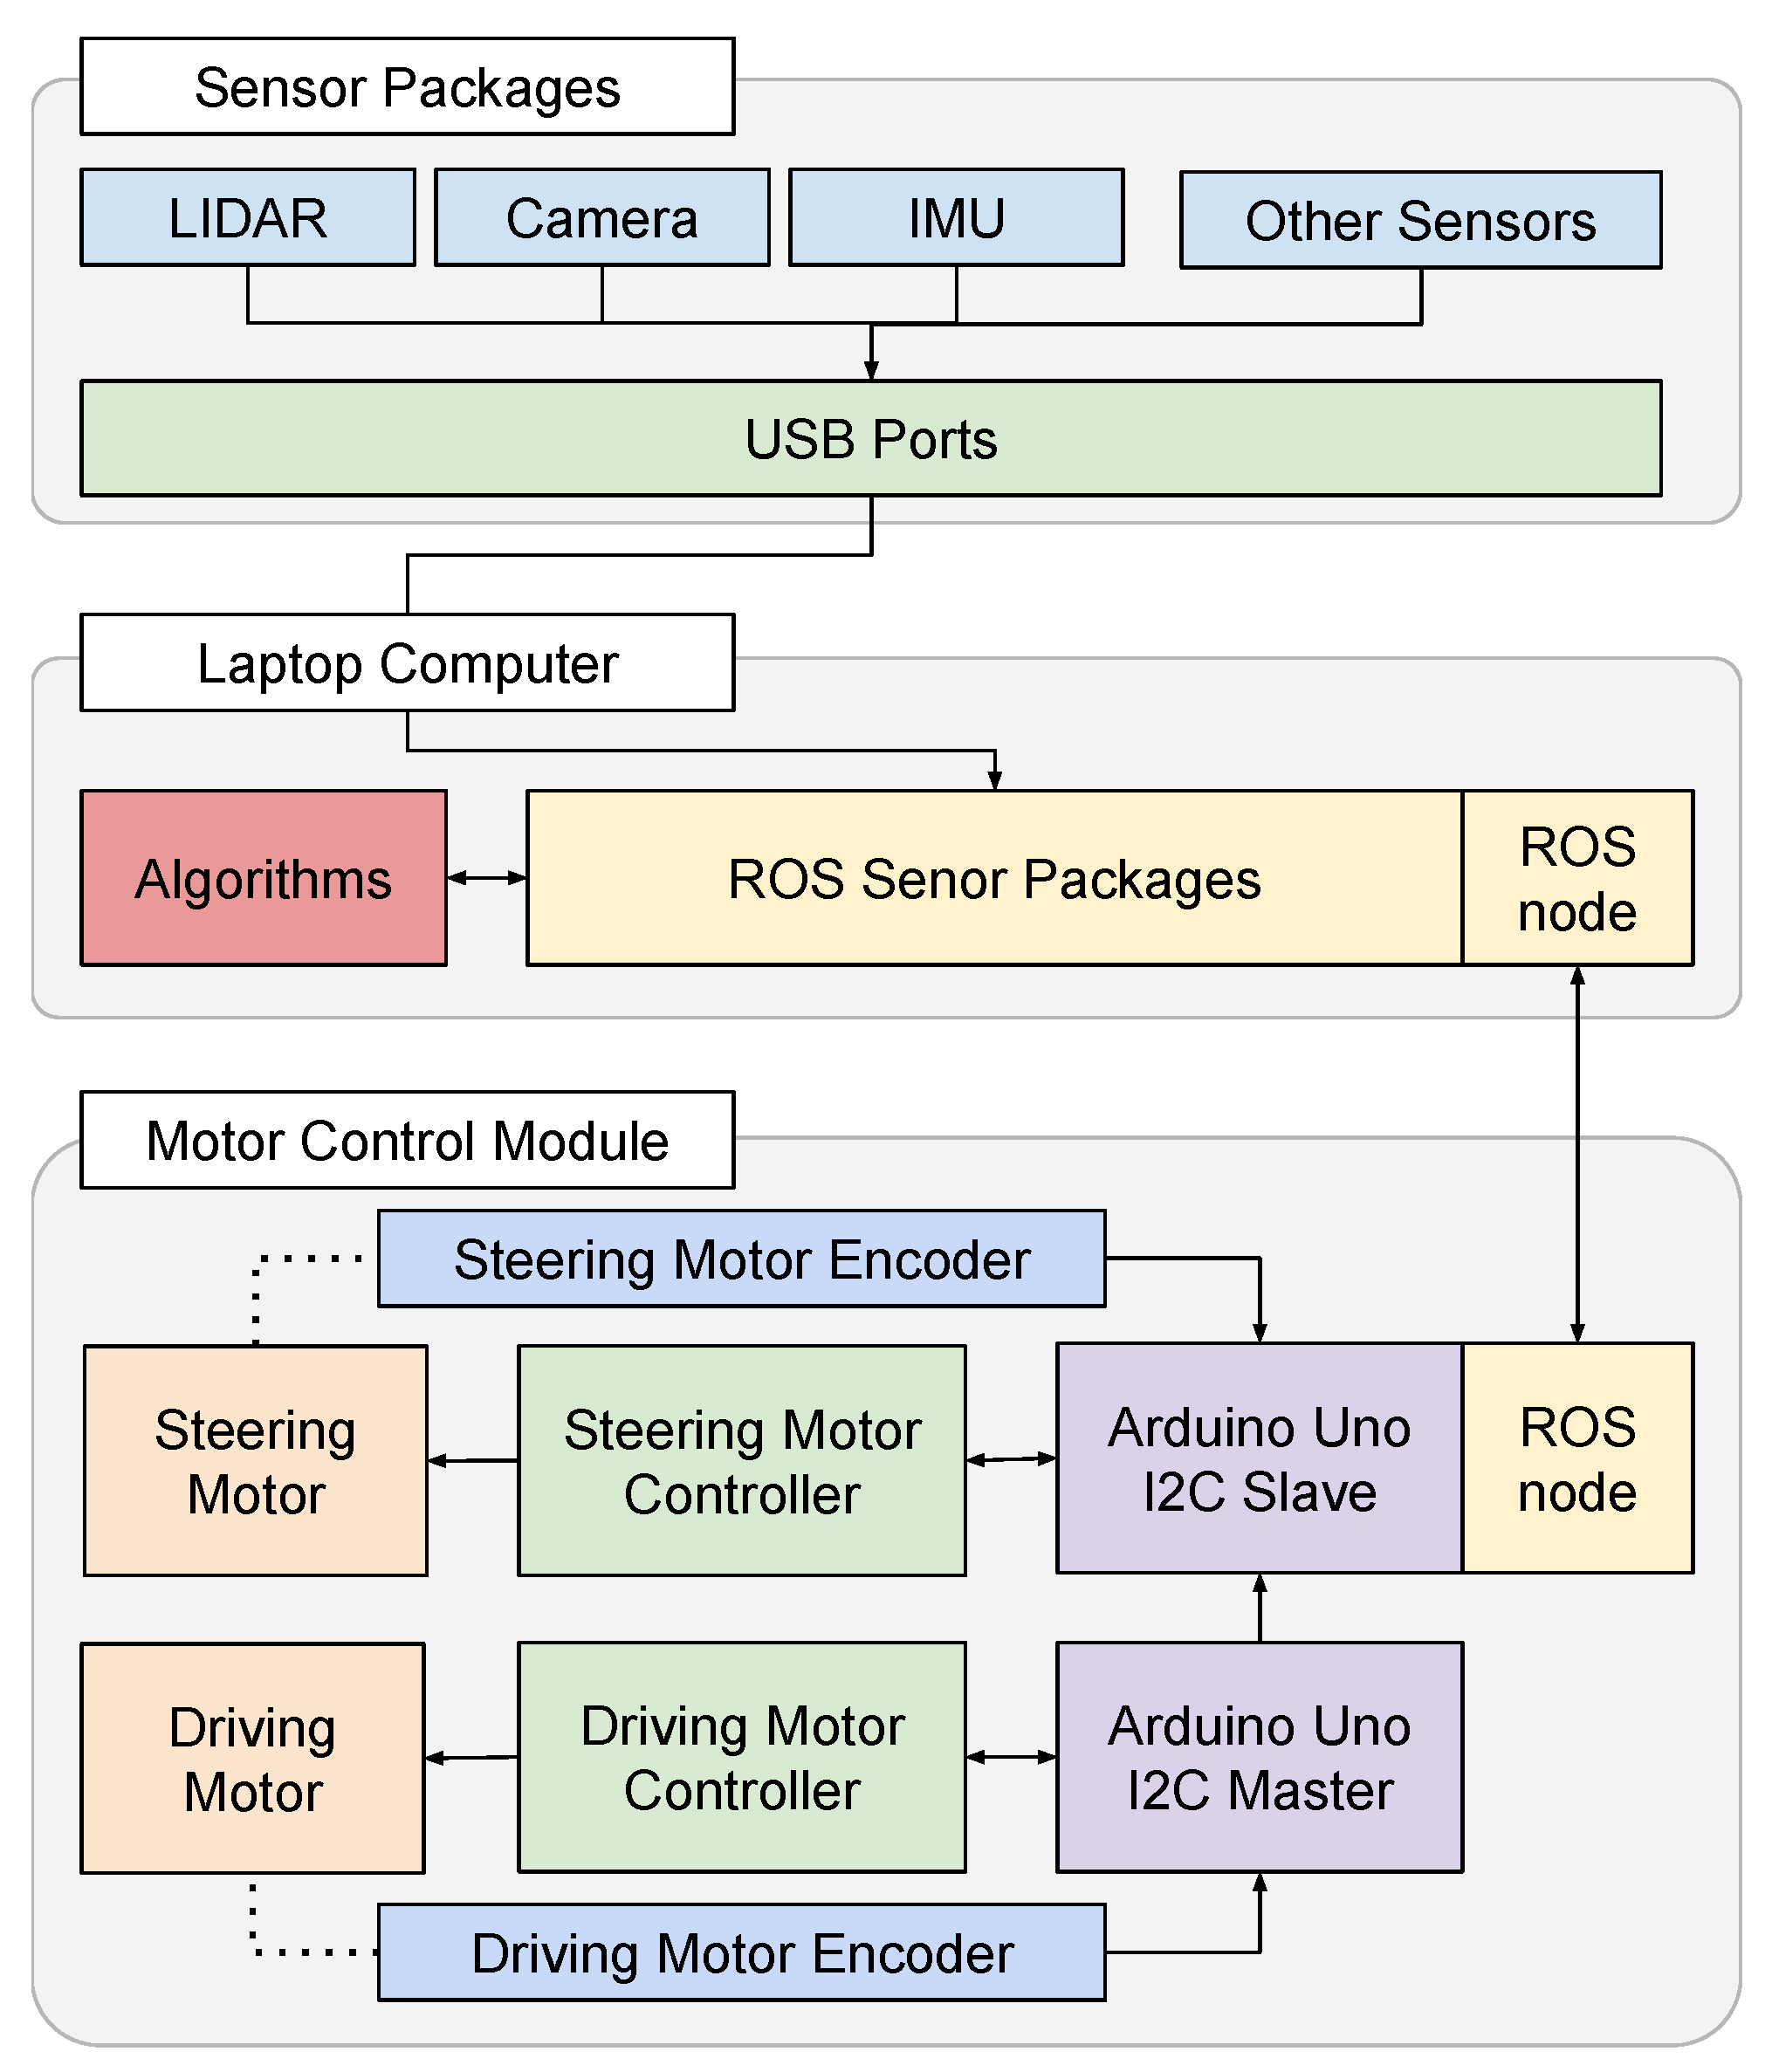
3.3.2. Electrical Design
Encoders
Microcontroller
Motors and Motor Controllers
Power and Wiring
3.4. Sensor Suite Design
3.4.1. Camera Sensor
3.4.2. RGBD Camera
3.4.3. LiDAR
3.5. Software Design
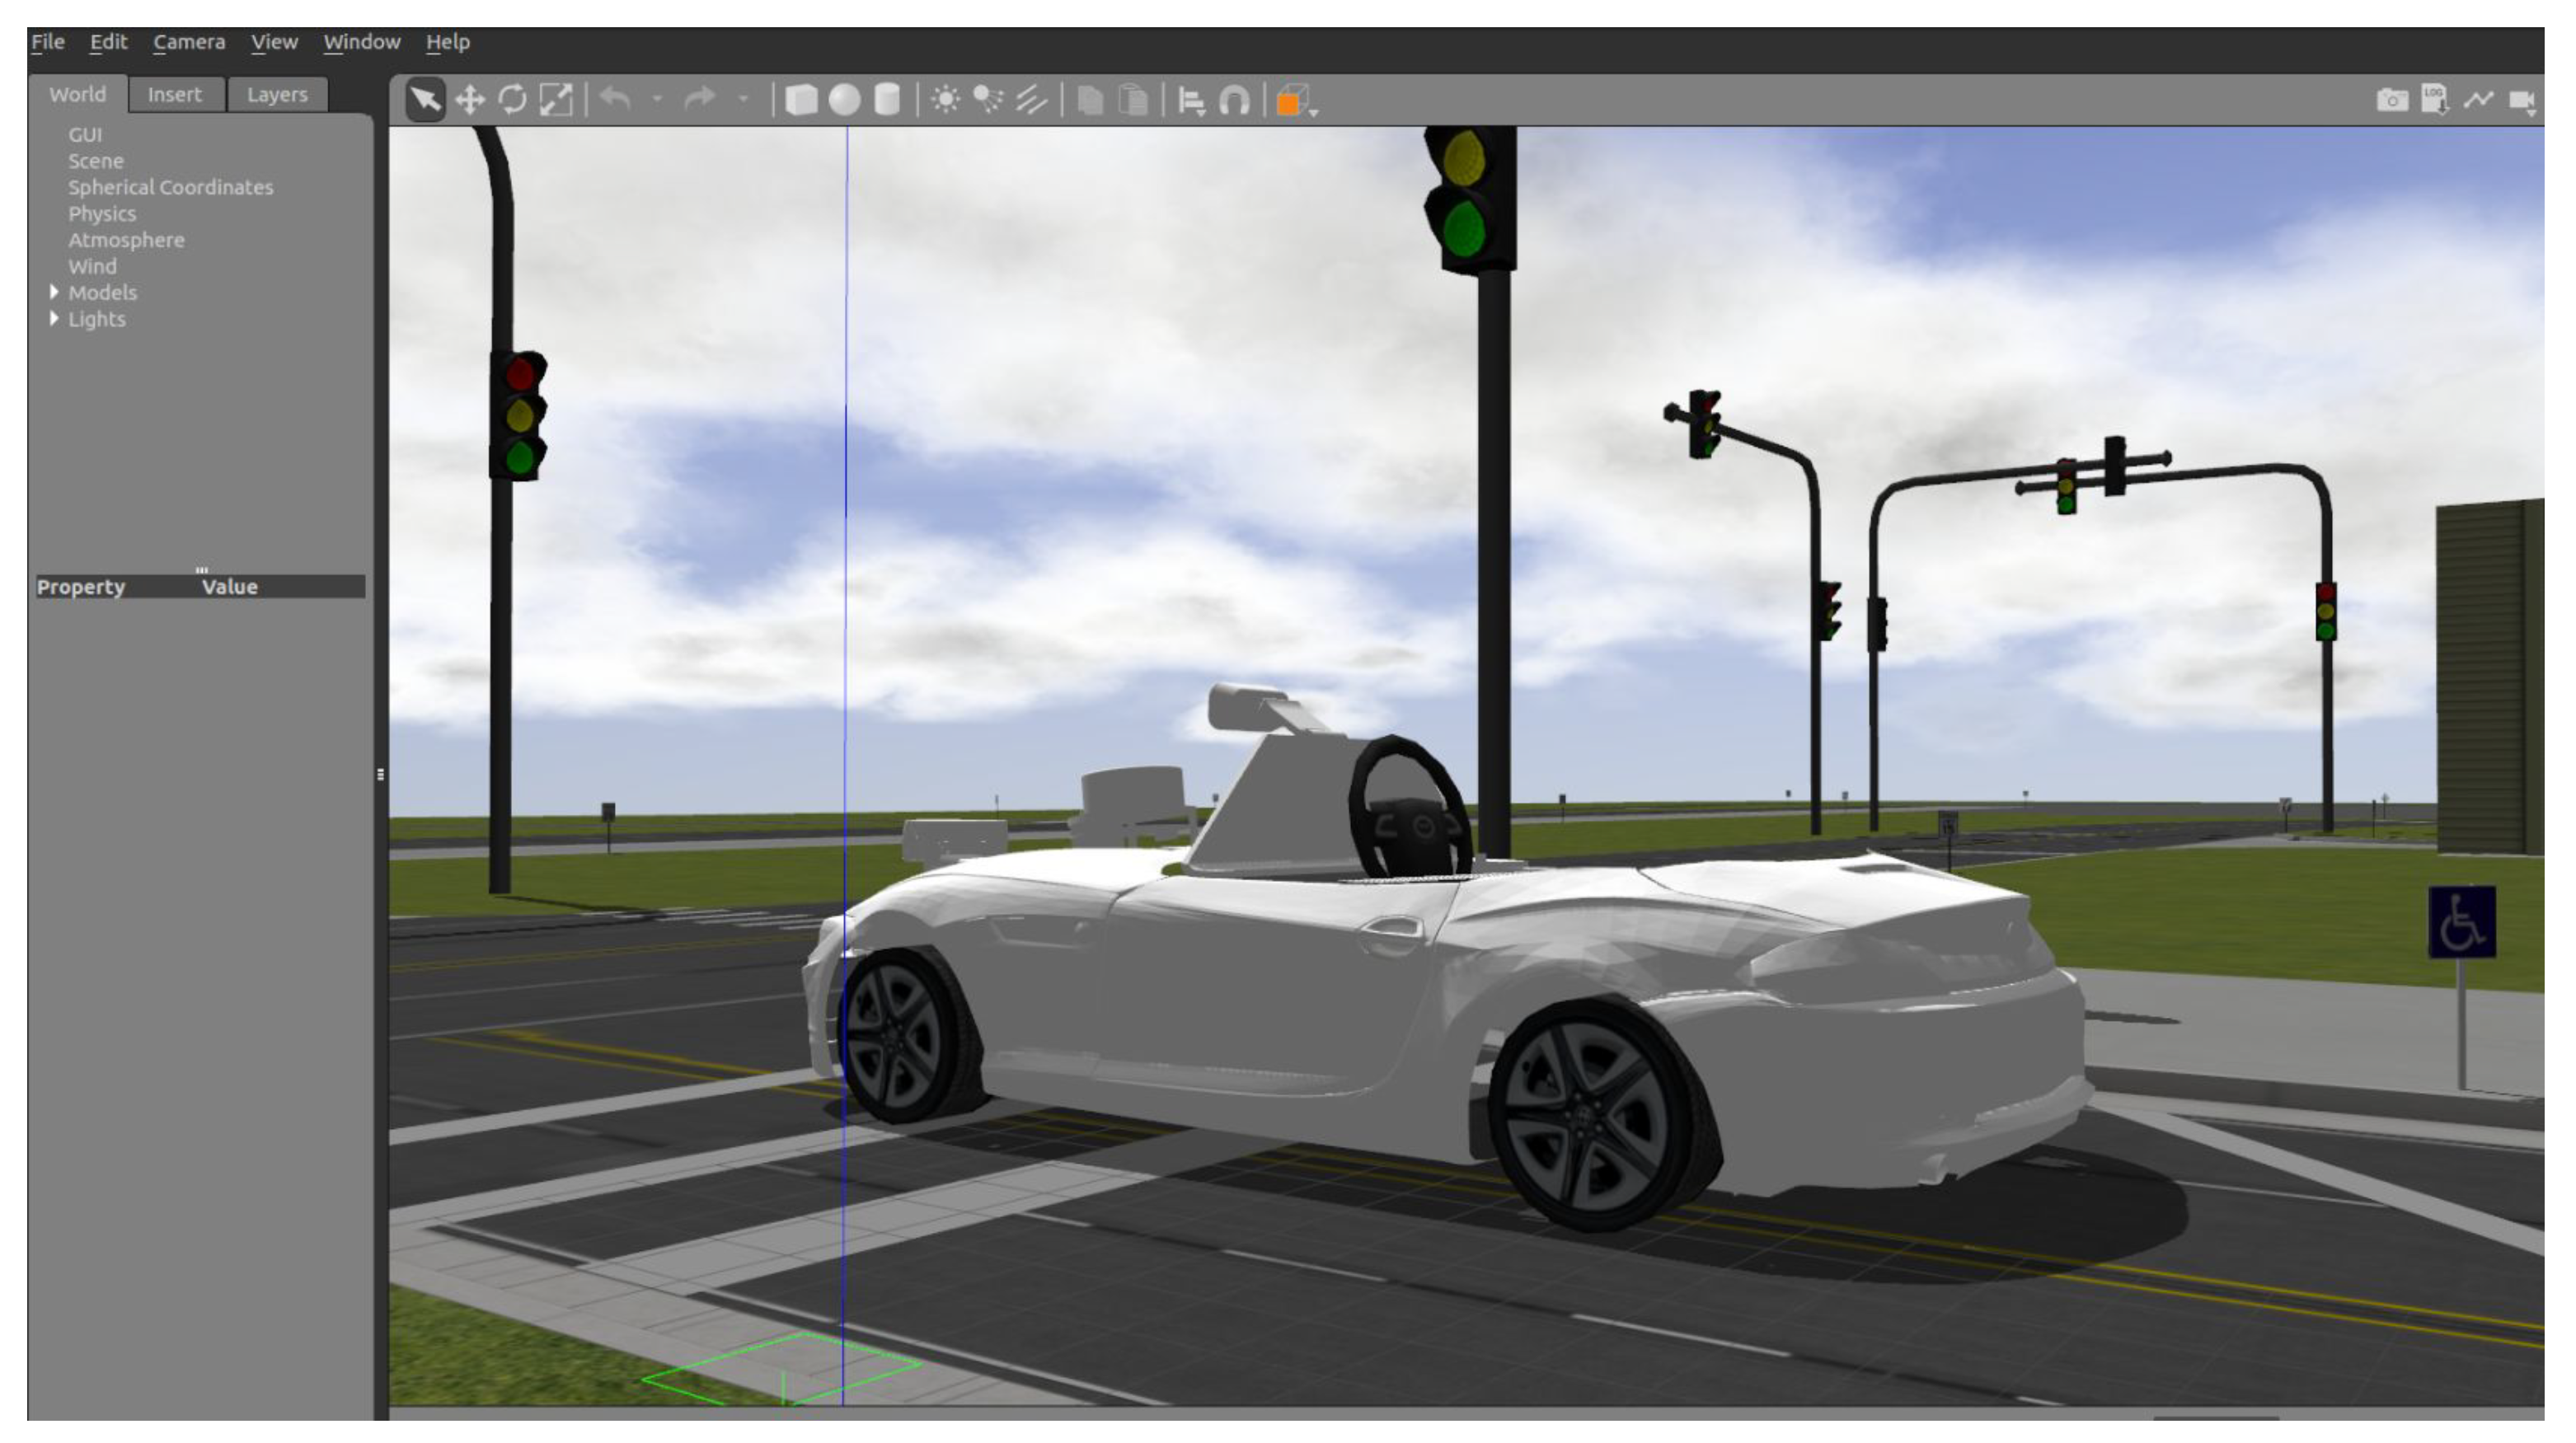
3.5.1. Environment
3.5.2. 3D Vehicle Model
3.5.3. Microcontroller
3.5.4. Laptop Computer
Remote Control
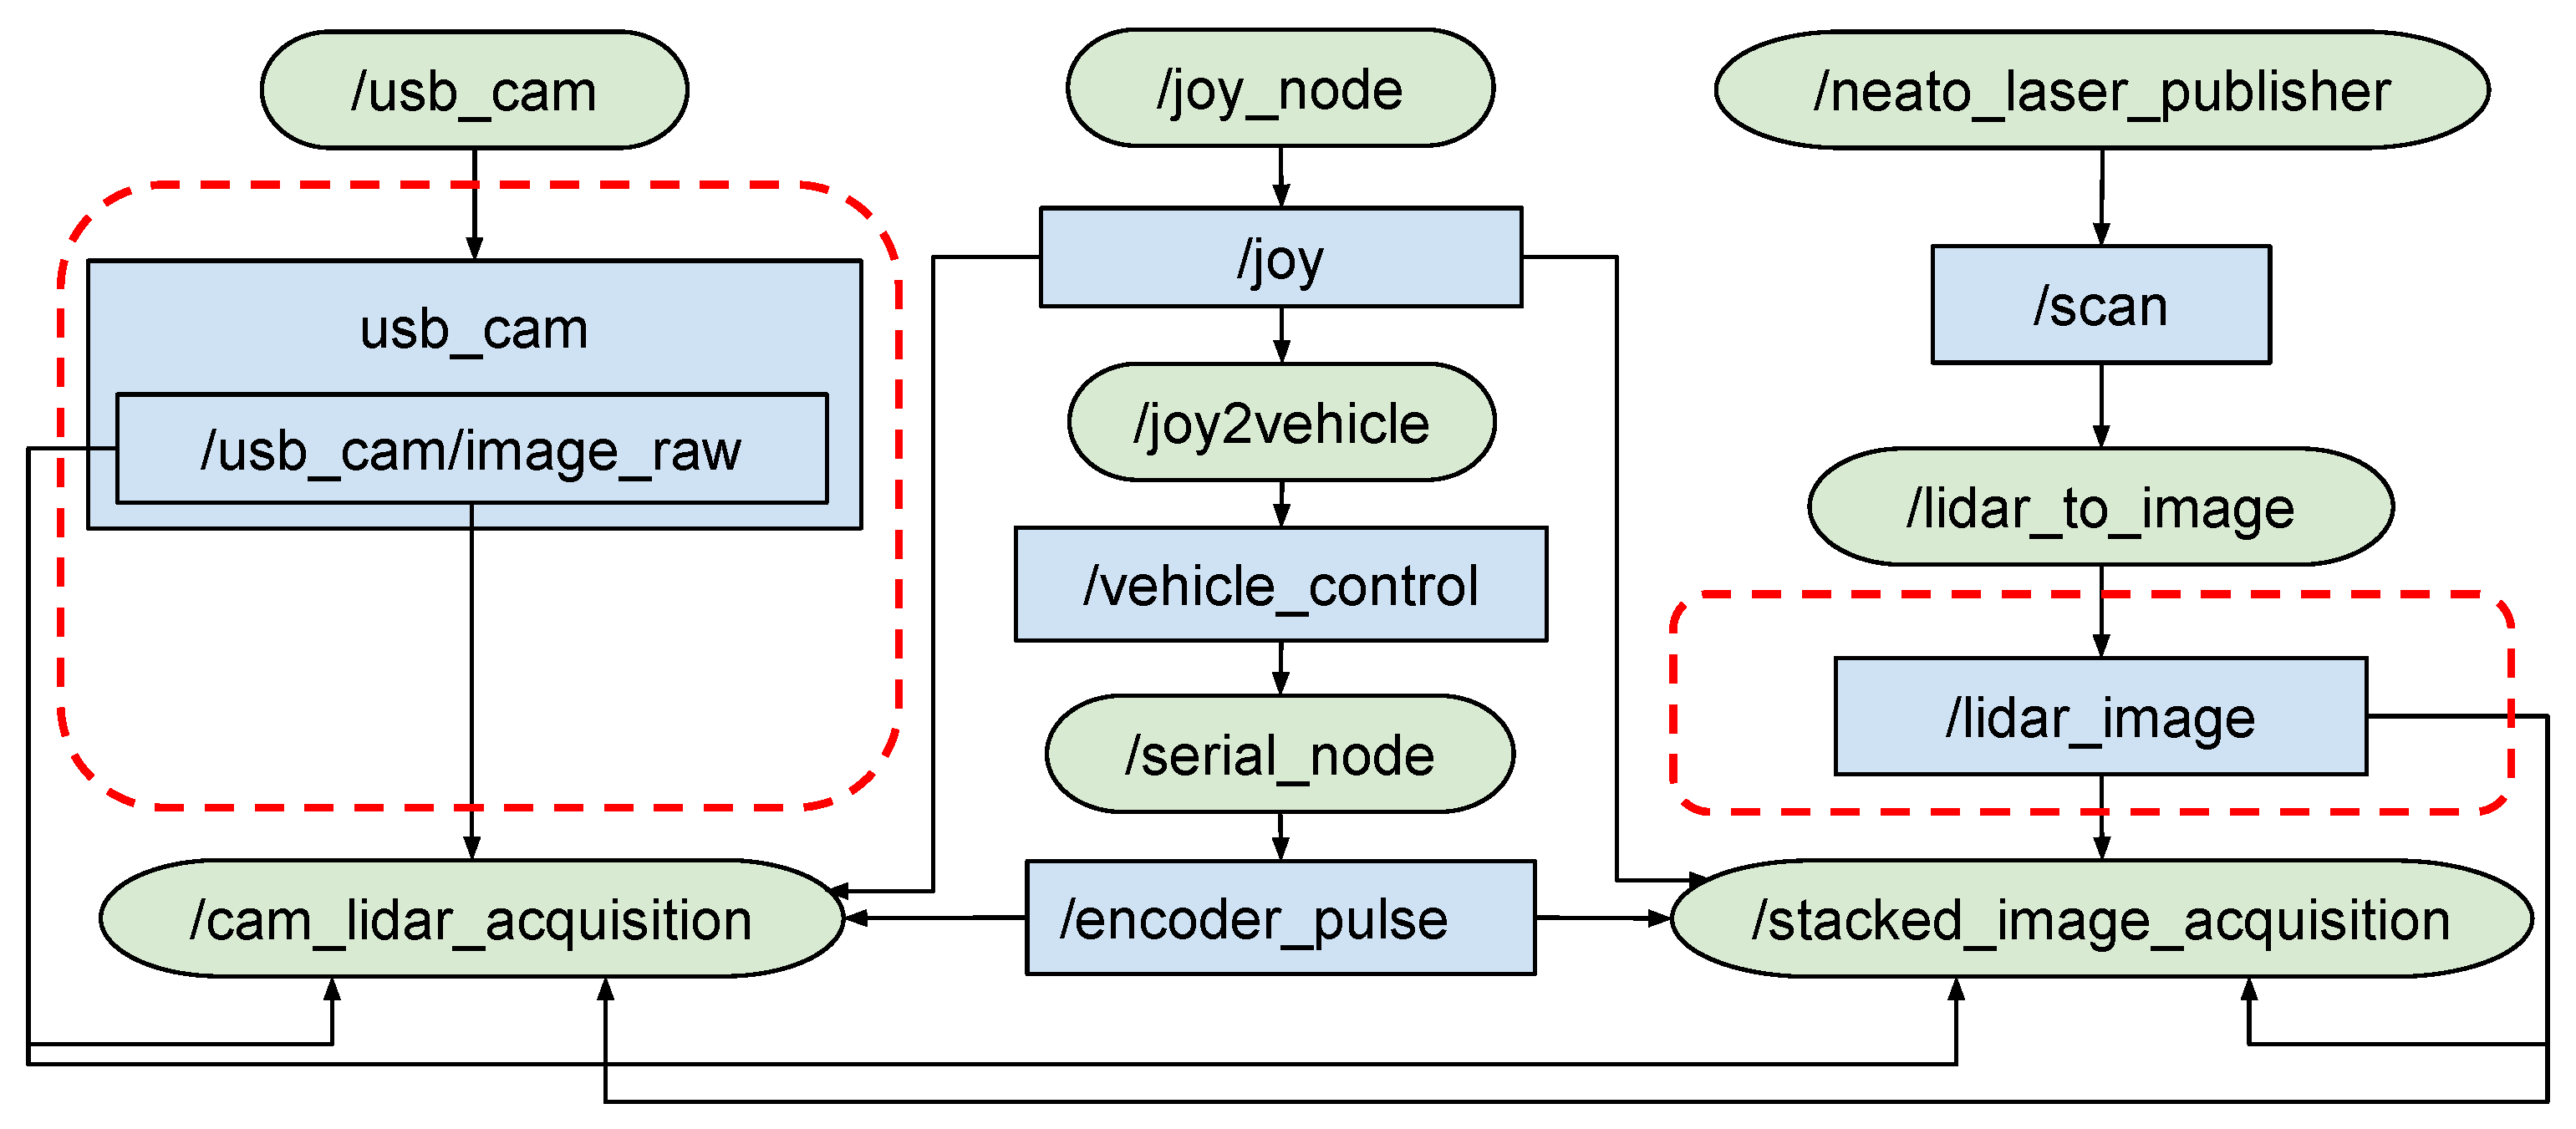
Data acquisition
3.5.5. Communication
3.5.6. Set up ROS on the Ridon Vehicle
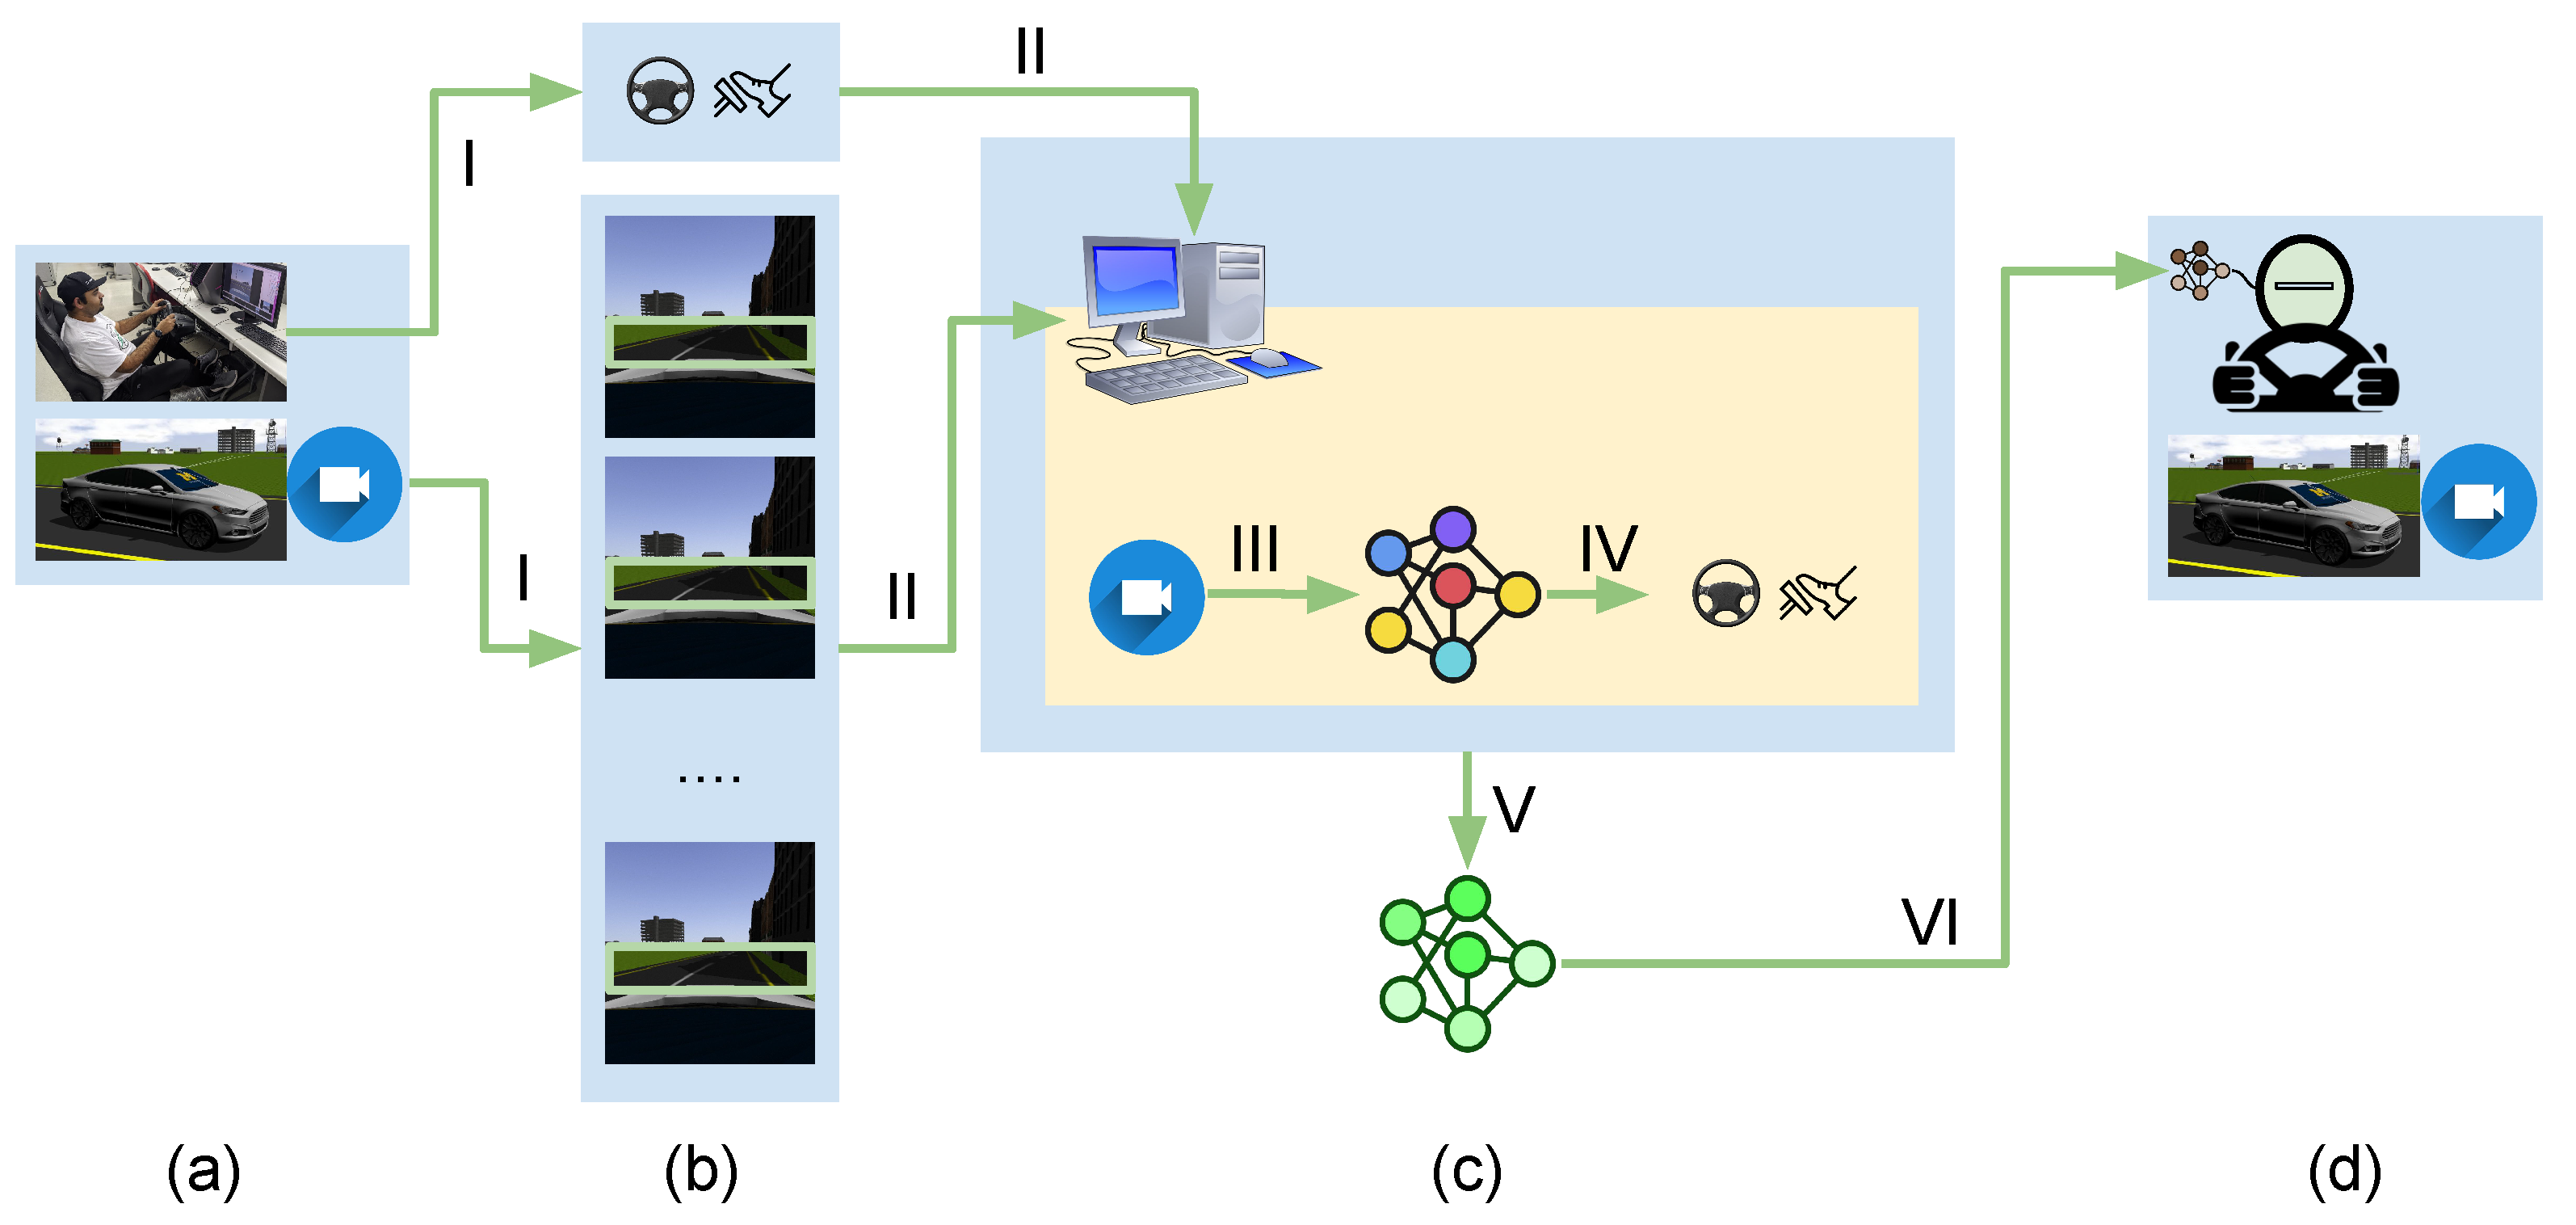
4. Validation on Behavior Cloning
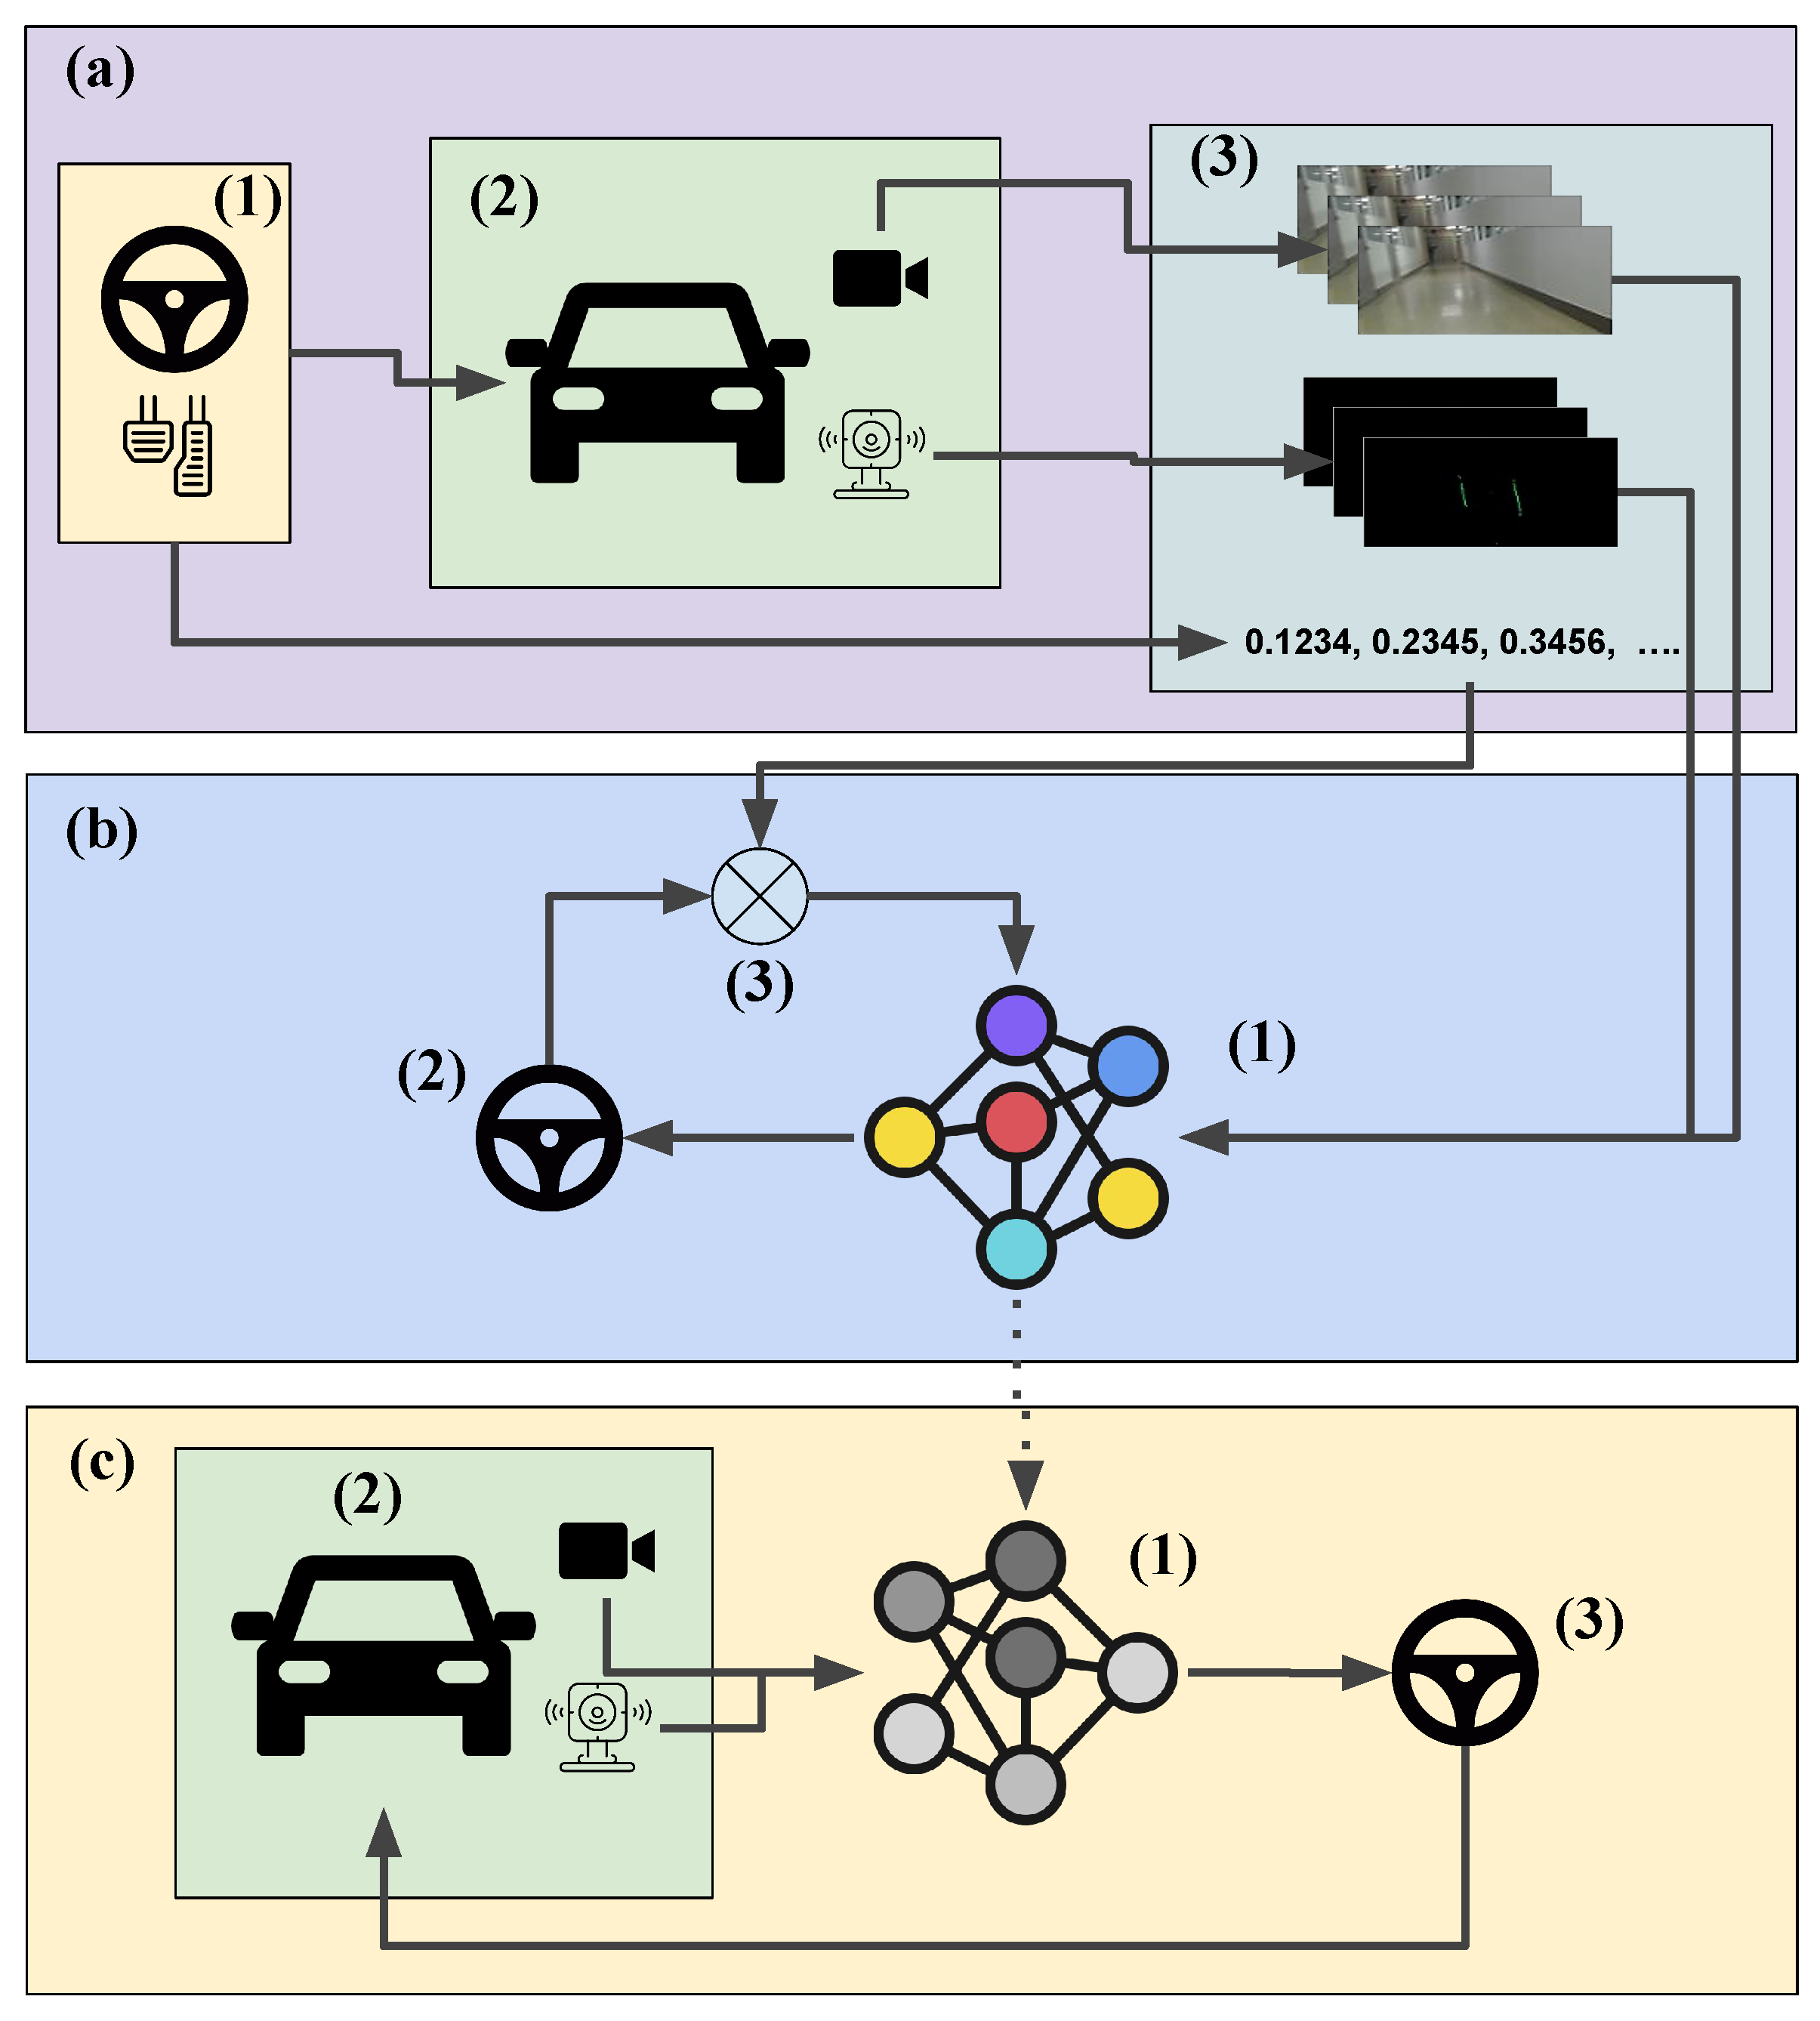
4.1. High-Level Architecture
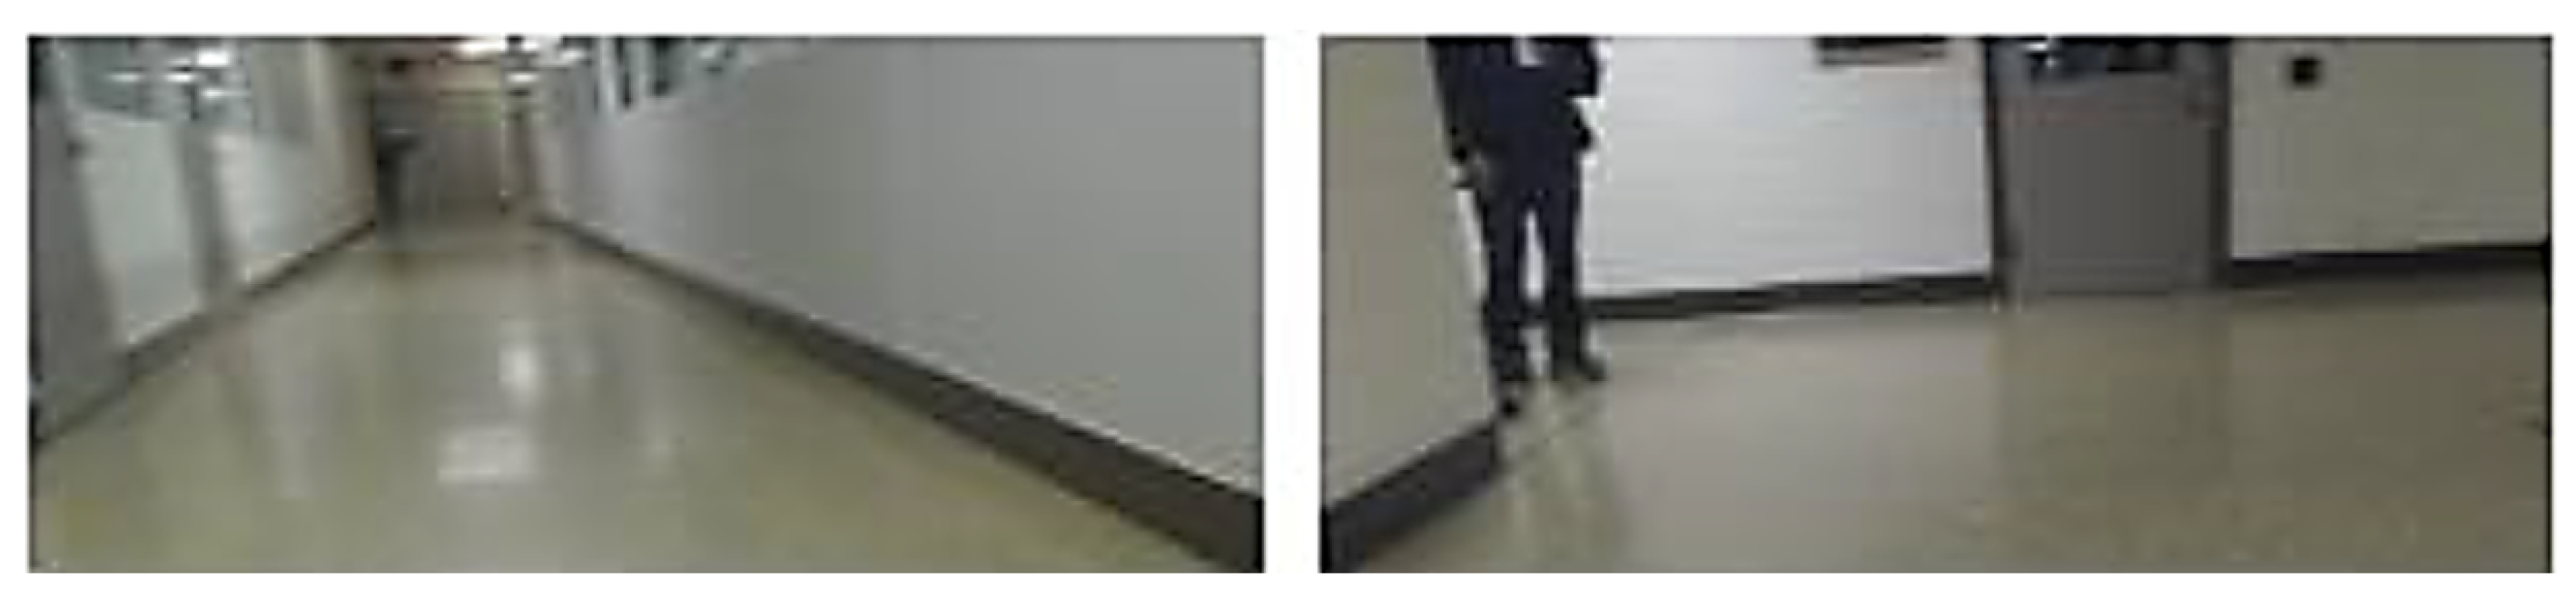
4.2. Data Acquisition
4.3. Training Neural Networks
4.3.1. Neural Network Architecture for Camera Data
4.3.2. Neural Network Architecture for LiDAR Data
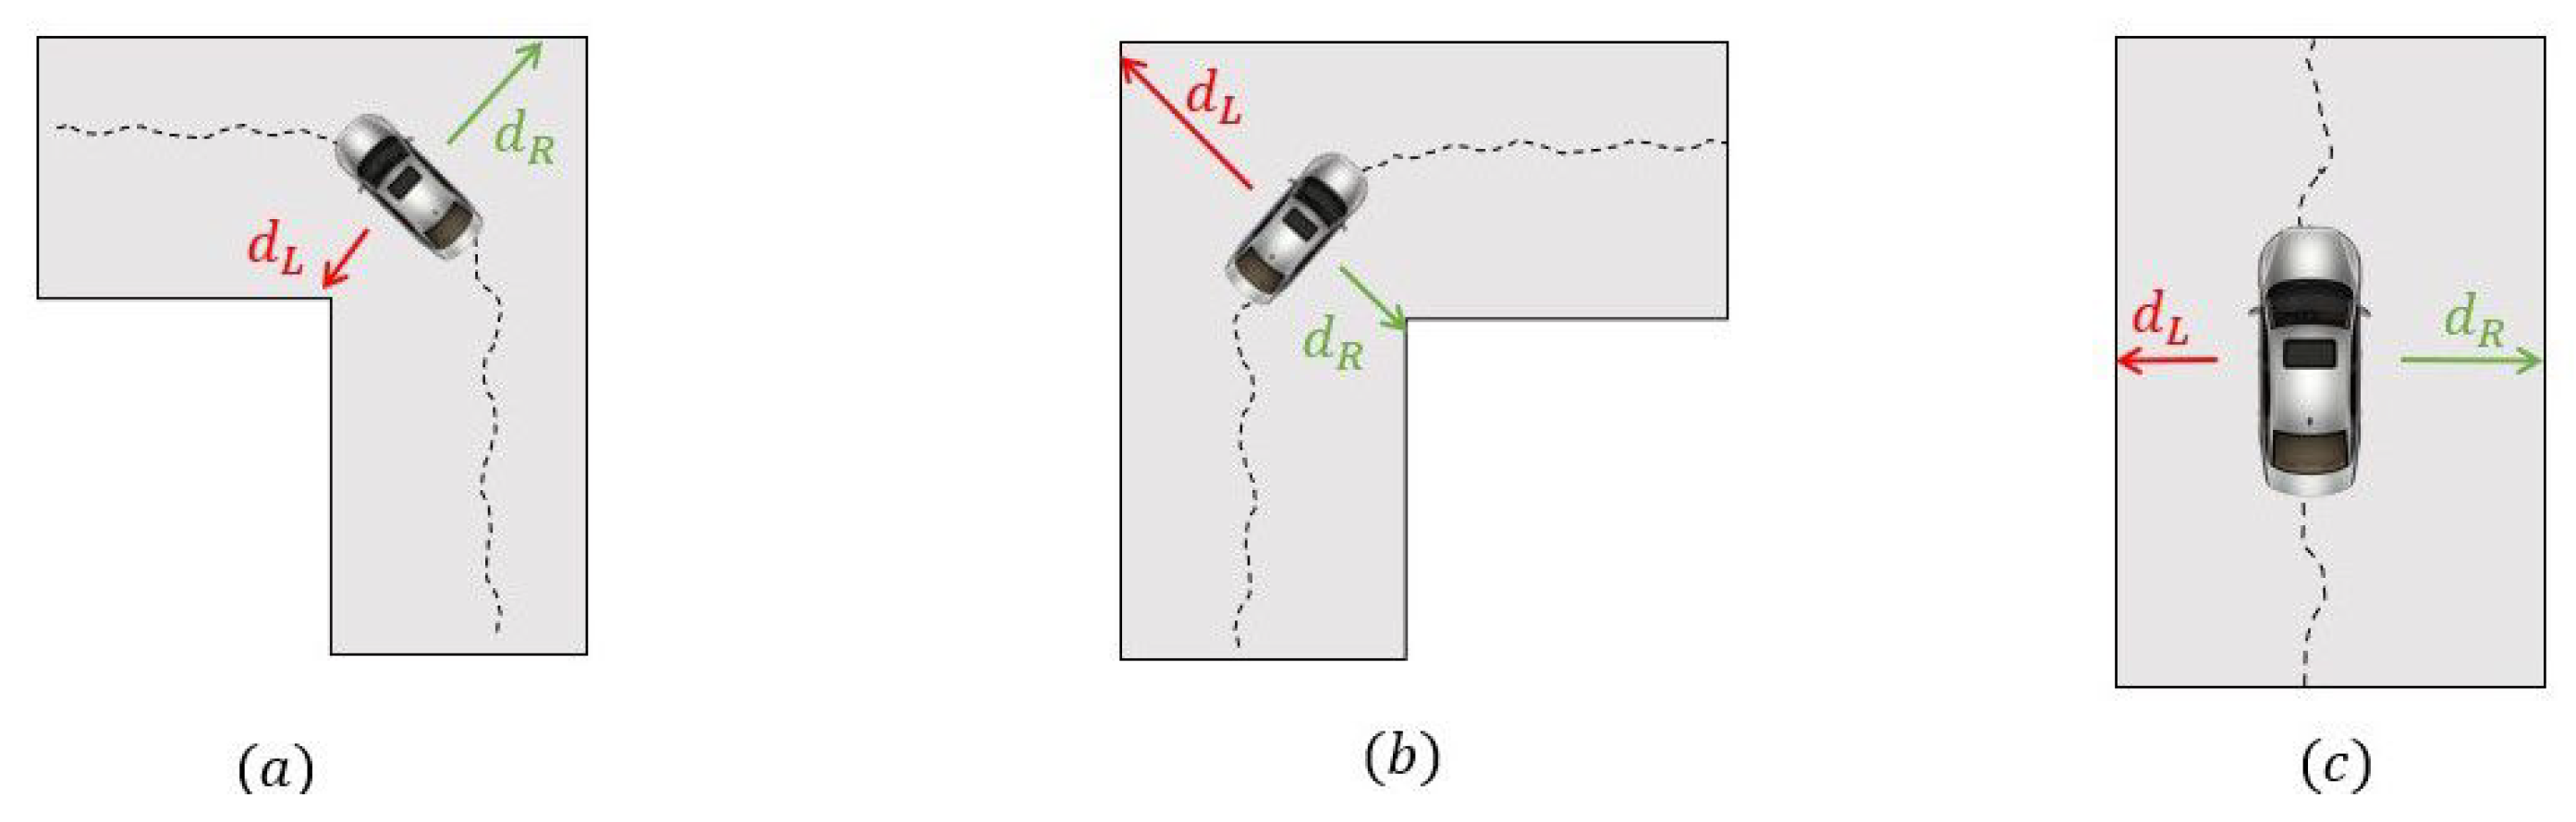
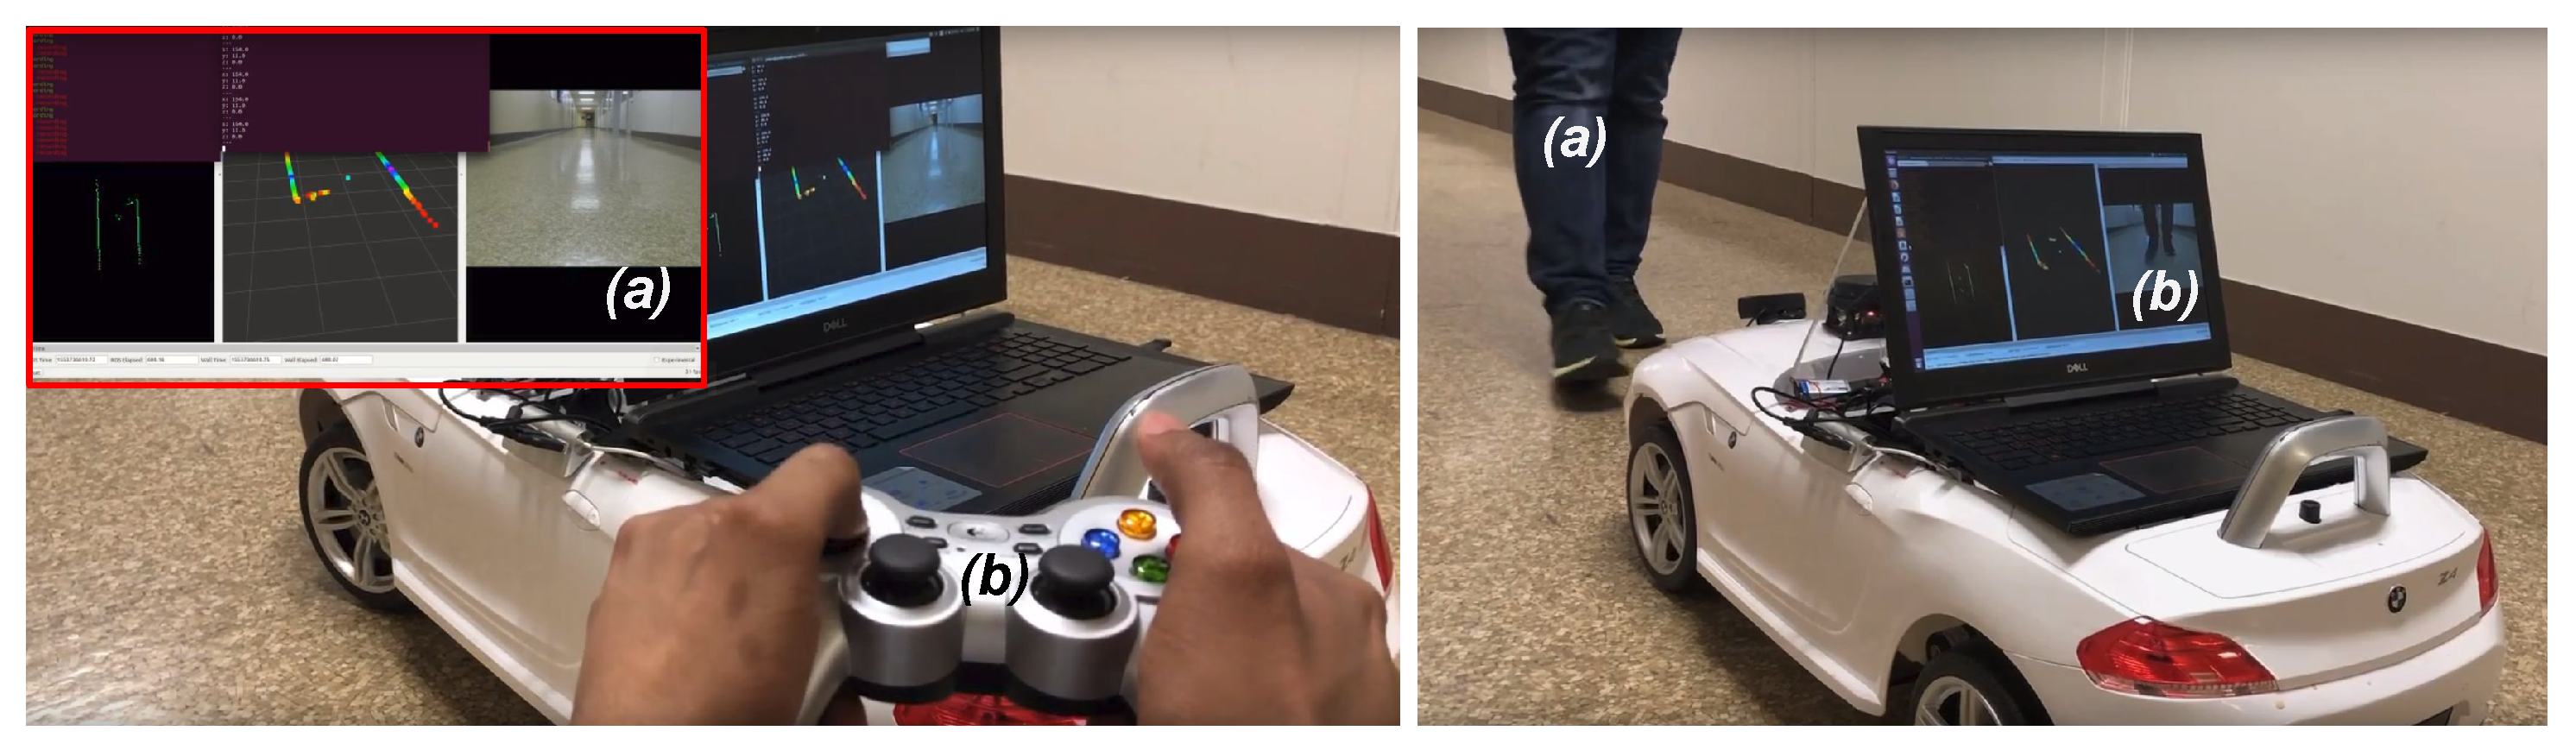
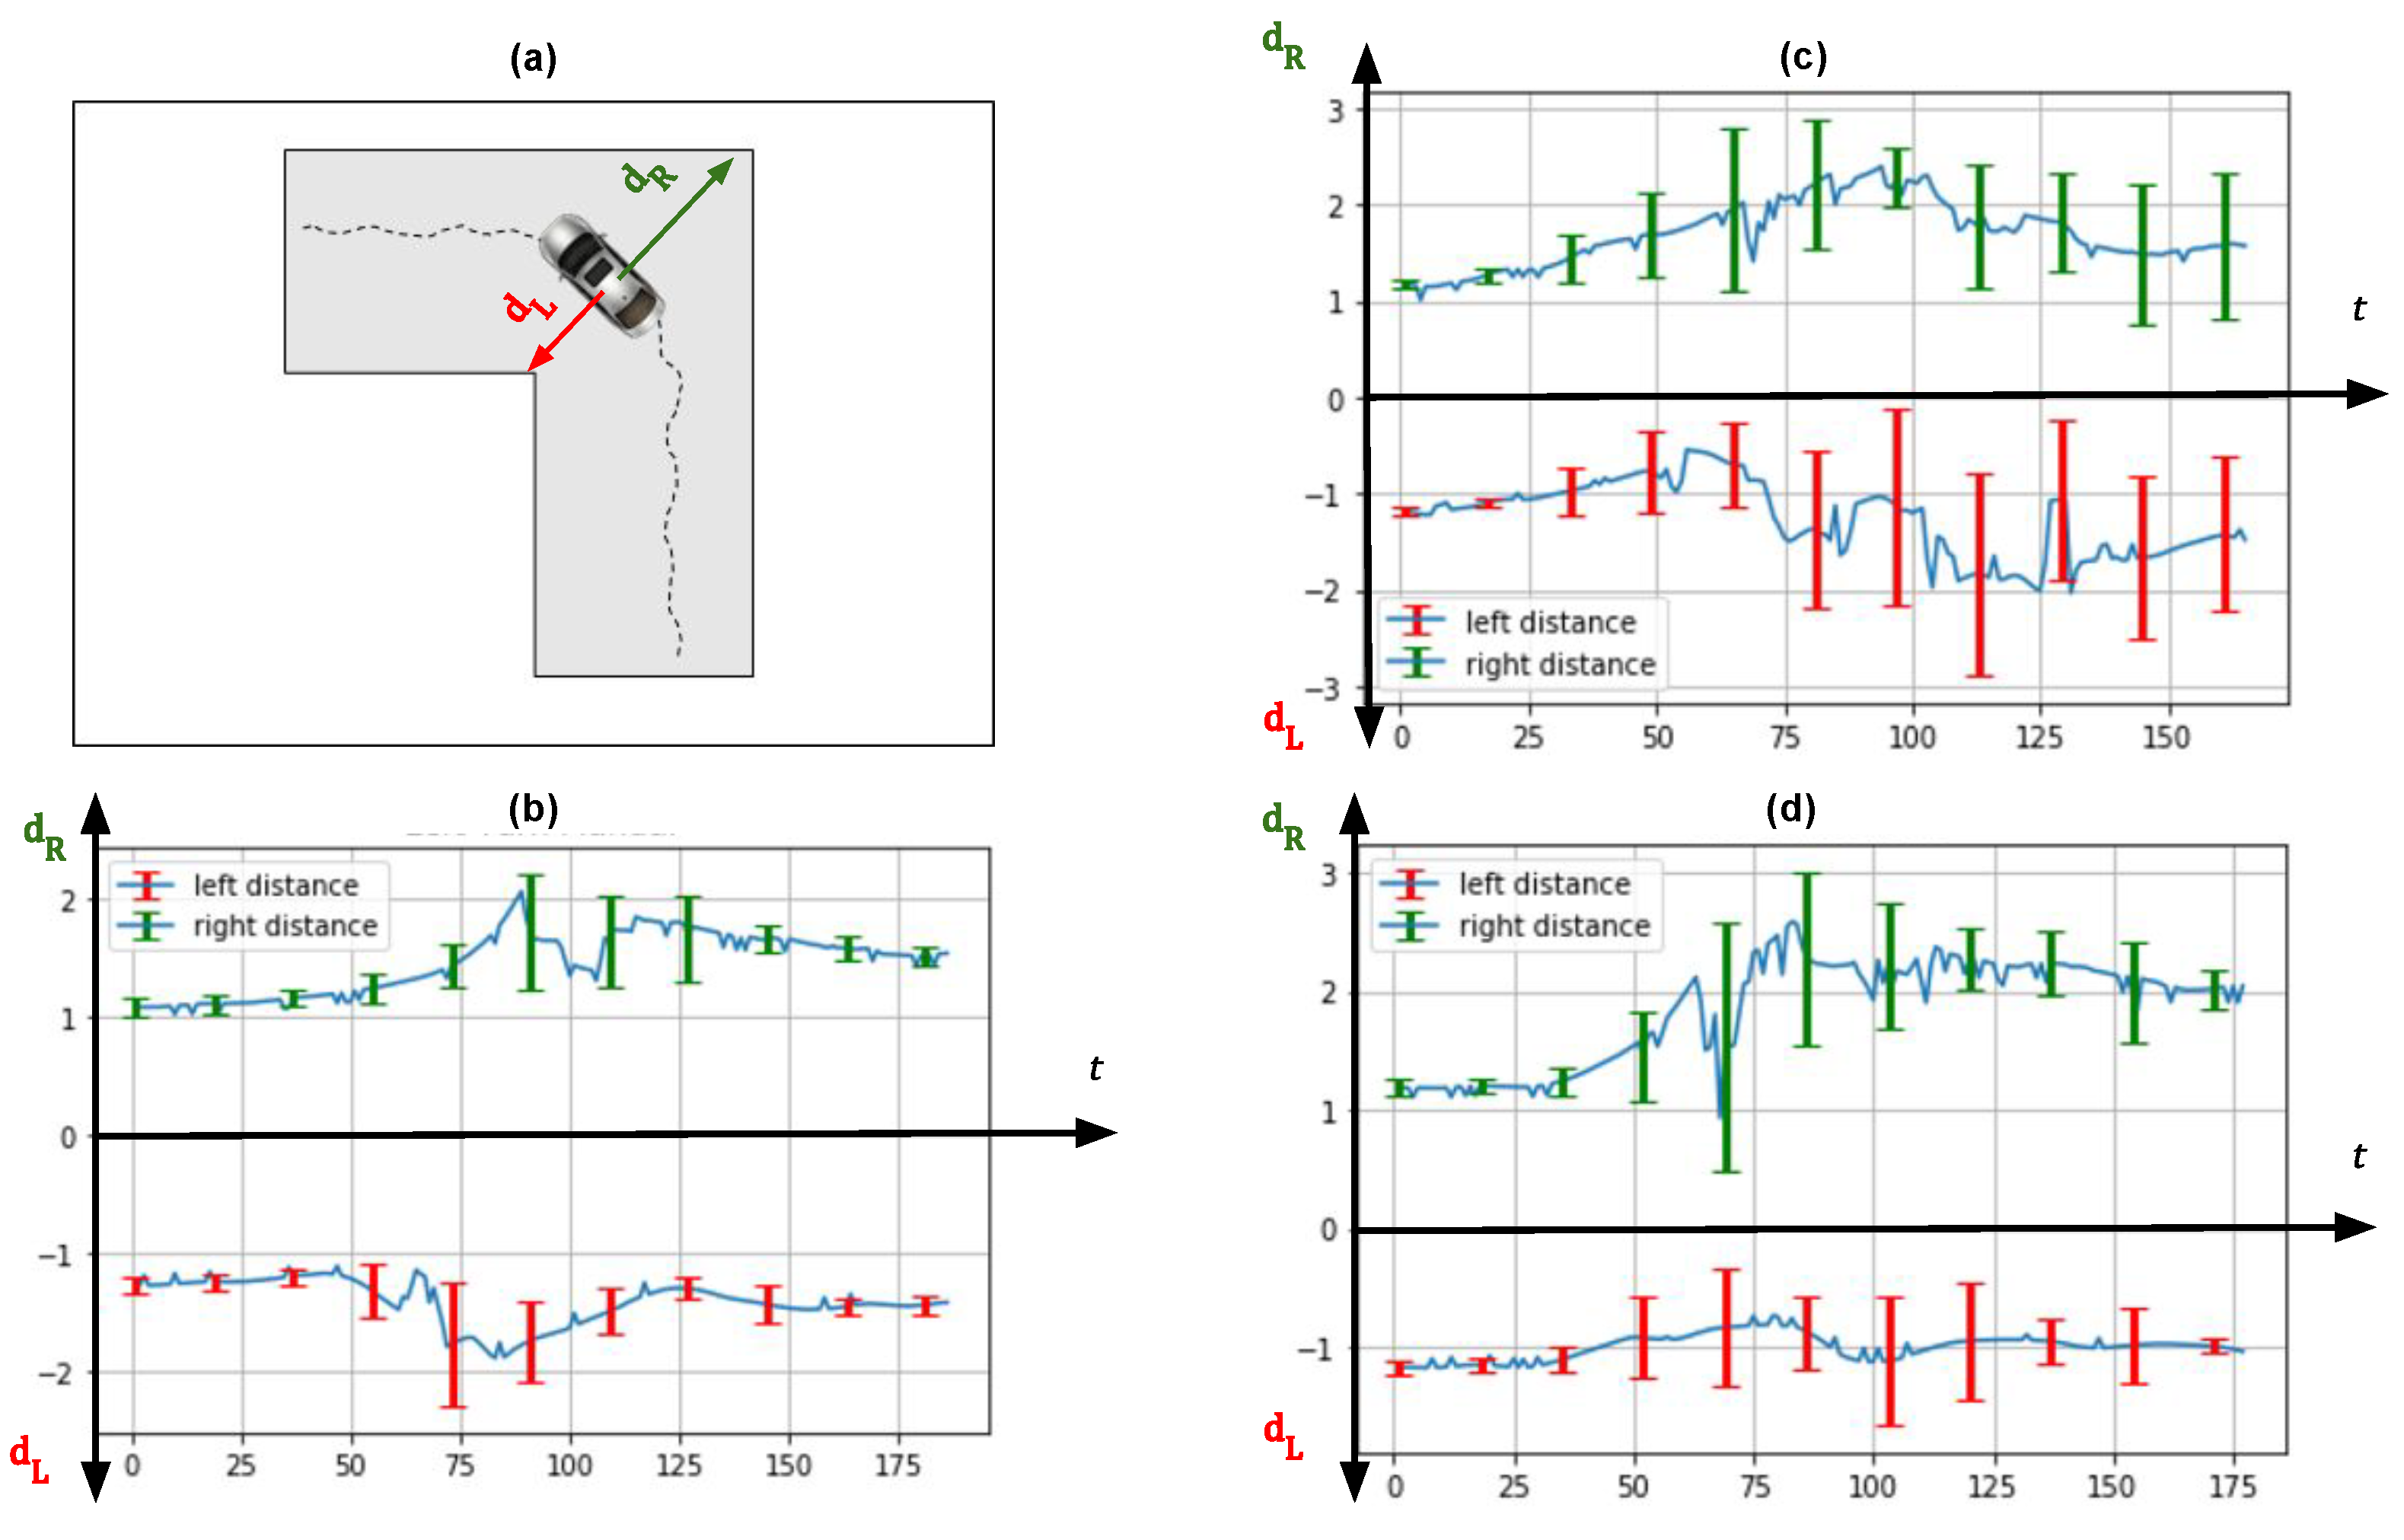
4.4. Testing the Trained Neural Networks
5. Results
Behavioral Cloning Results
6. Discussion and Future Work
7. Conclusions
Author Contributions
Funding
Conflicts of Interest
Appendix A

| Item | Description | Q’t | Price | Total |
|---|---|---|---|---|
| Camera | Logitech USD | 1 | USD 66 | USD 66 |
| Lidar Sensor | Neato XV Lidar 5Hz scan rate | 1 | USD 75 | USD 75 |
| Arduino Uno | 80 MHz frequency CPU USD | 2 | USD 20 | USD 40 |
| Incremental rotary encoder signswise LBD 3806 | 600 pulse per revolution | 2 | USD 17 | USD 34 |
| Other accessories | Fixture, screws, and wires | - | USD 20 | USD 20 |
| Logitech gamepad F710 | 2.4 GHz Wireless Controller | 1 | USD 39 | USD 39 |
| Motor Controller Shields | Robot Power 13 A 5–28 V H-bridge | 2 | USD 45 | USD 90 |
| Newsmarts Spur Gear module | 17 teeth 7 mm bore—NS27IU001-25 | 2 | USD 6 | USD 12 |
| Extra Battery | 9.6 V—2000 mAh Rechargeable with charger | 1 | USD 33 | USD 33 |
| Ride-on-Car | One Motor rear drive | 1 | USD 210 | USD 210 |
| Total of the core items | USD 619 | |||
| Optional Items | ||||
| Laptop | i7 7700 HQ 2.8 GHz 16GB RAM with GTX 1060 TI 6 GB GDDR | 1 | USD 1050 | USD 1050 |
| Intel Realsense | Depth Camera | 1 | USD 149 | USD 149 |
| IMU | Razor 9 DOF Sparkfun | 1 | USD 36 | USD 36 |
| Camera | Logitech C260 | 1 | USD 19 | USD 19 |
| Total of optional items | USD 1254 |
References
- Tostado-Véliz, M.; León-Japa, R.S.; Jurado, F. Optimal electrification of off-grid smart homes considering flexible demand and vehicle-to-home capabilities. Appl. Energy 2021, 298, 117184. [Google Scholar] [CrossRef]
- CB-Insigths-Research. 46 Corporations Working on Autonomous Vehicles. 2018. Available online: https://www.cbinsights.com/research/autonomous-driverless-vehicles-corporations-list (accessed on 18 November 2021).
- Quigley, M.; Conley, K.; Gerkey, B.; Faust, J.; Foote, T.; Leibs, J.; Wheeler, R.; Ng, A.Y. ROS: An Open-Source Robot Operating System; ICRA Workshop on Open Source Software: Kobe, Japan, 2009; Volume 3, p. 5. [Google Scholar]
- Codevilla, F.; Santana, E.; López, A.M.; Gaidon, A. Exploring the Limitations of Behavior Cloning for Autonomous Driving. In Proceedings of the IEEE/CVF International Conference on Computer Vision (ICCV), Seoul, Korea, 27 October–2 November 2019; Available online: https://arxiv.org/abs/1904.08980 (accessed on 18 November 2021).
- Wei, J.; Snider, J.M.; Kim, J.; Dolan, J.M.; Rajkumar, R.; Litkouhi, B. Towards a viable autonomous driving research platform. In Proceedings of the 2013 IEEE Intelligent Vehicles Symposium (IV), Gold Coast, QLD, Australia, 23–26 June 2013; pp. 763–770. [Google Scholar] [CrossRef]
- Jo, K.; Kim, J.; Kim, D.; Jang, C.; Sunwoo, M. Development of Autonomous Car—Part I: Distributed System Architecture and Development Process. IEEE Trans. Ind. Electron. 2014, 61, 7131–7140. [Google Scholar] [CrossRef]
- Jo, K.; Kim, J.; Kim, D.; Jang, C.; Sunwoo, M. Development of Autonomous Car—Part II: A Case Study on the Implementation of an Autonomous Driving System Based on Distributed Architecture. IEEE Trans. Ind. Electron. 2015, 62, 5119–5132. [Google Scholar] [CrossRef]
- Shah, S.; Dey, D.; Lovett, C.; Kapoor, A. AirSim: High-Fidelity Visual and Physical Simulation for Autonomous Vehicles. In Field and Service Robotics; Hutter, M., Siegwart, R., Eds.; Springer Proceedings in Advanced Robotics; Springer International Publishing: Berlin/Heidelberg, Germany, 2018; pp. 621–635. [Google Scholar]
- Dosovitskiy, A.; Ros, G.; Codevilla, F.; Lopez, A.; Koltun, V. CARLA: An Open Urban Driving Simulator. In Proceedings of the Conference on Robot Learning, Mountain View, CA, USA, 13–15 November 2017; pp. 1–16. [Google Scholar]
- Tobias, D. Daniel Tobias’ CAR-Cherry Autonomous Racecar. 2017. Available online: https://www.jetsonhacks.com/2017/03/02/daniel-tobias-car-cherry-autonomous-racecar/ (accessed on 18 November 2021).
- Ollukaren, N.; McFall, K. Low-cost platform for autonomous ground vehicle research. In Proceedings of the 14th Early Career Technical Conference, Birmingham, AL, USA, 1–2 November 2014; Volume 13. [Google Scholar]
- Gómez, C.; Hernández, A.C.; Crespo, J.; Barber, R. A ROS-based Middle-cost Robotic Platform with High-performance. In Proceedings of the International Academy of Technology, Education and Development (IATED), Madrid, Spain, 2–4 March 2015. [Google Scholar]
- Radxa-Rock-Pro. Radxa Rock Pro Specifications. 2014. Available online: https://library.iated.org/view/GOMEZ2015ARO (accessed on 18 November 2021).
- Walling, D.H. The Design of an Autonomous Vehicle Research Platform. Ph.D. Thesis, Virginia Tech, Blacksburg, VA, USA, 2017. [Google Scholar]
- Shukla, A.; Singh, R.; Agarwal, R.; Suhail, M.; Saha, S.K.; Chaudury, S. Development of a Low-Cost Education Platform: RoboMuse 4.0. In Proceedings of the Advances in Robotics, AIR ’17, New Delhi, India, 28 June–2 July 2017; ACM: New York, NY, USA, 2017; pp. 38:1–38:6. [Google Scholar] [CrossRef]
- Dang, L.; Sriramoju, N.; Tewolde, G.; Kwon, J.; Zhang, X. Designing a cost-effective Autonomous Vehicle Control System Kit (AVCS Kit). In Proceedings of the 2017 IEEE AFRICON, Cape Town, South Africa, 18–20 September 2017; pp. 1453–1458. [Google Scholar] [CrossRef]
- Verma, A.; Bagkar, S.; Allam, N.V.S.; Raman, A.; Schmid, M.; Krovi, V.N. Implementation and Validation of Behavior Cloning Using Scaled Vehicles; SAE WCX Digital Summit; SAE International: Warrendale, PA, USA, 2021. [Google Scholar] [CrossRef]
- Alzu’bi, H.; Dwyer, B.; Nagaraj, S.; Pischinger, M.; Quail, A. Cost Effective Automotive Platform for ADAS and Autonomous Development; SAE Technical Paper 2018-01-0588; SAE International: Warrendale, PA, USA, 2018. [Google Scholar] [CrossRef]
- Srinivasa, S.S.; Lancaster, P.; Michalove, J.; Schmittle, M.; Summers, C.; Rockett, M.; Smith, J.R.; Choudhury, S.; Mavrogiannis, C.; Sadeghi, F. MuSHR: A Low-Cost, Open-Source Robotic Racecar for Education and Research. arXiv 2019, arXiv:cs.RO/1908.08031. [Google Scholar]
- Paull, L.; Tani, J.; Ahn, H.; Alonso-Mora, J.; Carlone, L.; Cap, M.; Chen, Y.F.; Choi, C.; Dusek, J.; Fang, Y.; et al. Duckietown: An open, inexpensive and flexible platform for autonomy education and research. In Proceedings of the 2017 IEEE International Conference on Robotics and Automation (ICRA), Singapore, 29 May–3 June 2017; pp. 1497–1504. [Google Scholar] [CrossRef]
- Lin, H.Y.; Dai, J.M.; Wu, L.T.; Chen, L.Q. A vision-based driver assistance system with forward collision and overtaking detection. Sensors 2020, 20, 5139. [Google Scholar] [CrossRef] [PubMed]
- Chen, Z.; Huang, X. End-to-end learning for lane keeping of self-driving cars. In Proceedings of the 2017 IEEE Intelligent Vehicles Symposium (IV), Nagoya, Japan, 11–17 July 2017; pp. 1856–1860. [Google Scholar] [CrossRef]
- Pomerleau, D. ALVINN: An Autonomous Land Vehicle In a Neural Network. In Proceedings of the Advances in Neural Information Processing Systems 1. Morgan Kaufmann, Denver, CO, USA, 27–30 November 1989; pp. 305–313. [Google Scholar]
- 2004. Available online: https://cs.nyu.edu/~yann/research/dave/ (accessed on 18 November 2021).
- Yu, F.; Chen, H.; Wang, X.; Xian, W.; Chen, Y.; Liu, F.; Madhavan, V.; Darrell, T. BDD100K: A Diverse Driving Dataset for Heterogeneous Multitask Learning. In Proceedings of the 2020 IEEE/CVF Conference on Computer Vision and Pattern Recognition (CVPR), Seattle, WA, USA, 13–19 June 2020; pp. 2633–2642. [Google Scholar] [CrossRef]
- Scale. PandaSet Open Datasets-Scale. Available online: https://scale.com/open-datasets/pandaset (accessed on 18 November 2021).
- Waymo. Waymo Open Dataset. Available online: https://github.com/waymo-research/waymo-open-dataset (accessed on 18 November 2021).
- Caesar, H.; Bankiti, V.; Lang, A.H.; Vora, S.; Liong, V.E.; Xu, Q.; Krishnan, A.; Pan, Y.; Baldan, G.; Beijbom, O. nuScenes: A Multimodal Dataset for Autonomous Driving. In Proceedings of the 2020 IEEE/CVF Conference on Computer Vision and Pattern Recognition (CVPR), Seattle, WA, USA, 13–19 June 2020; IEEE: Seattle, WA, USA, 2020; pp. 11618–11628. [Google Scholar] [CrossRef]
- BMW-Z4-Roadster. BMW Z4 Roadster 6V Electric Children’s Battery Powered Under Licensed Ride On Car with (White) RC Remote Control Radio Car. 2009. Available online: https://www.nitrorcx.com/28c-81800-bmw-z4-white.html (accessed on 18 November 2021).
- HN3806-AB-600N. HN3806-AB-600N Incremental Rotary Encoder 600 P/R (Quadrature): Micro JPM. 2016. Available online: https://www.microjpm.com/products/ad38348 (accessed on 18 November 2021).
- C922-Specifications. C922 PRO STREAM WEBCAM-Logitech Support. 2016. Available online: https://support.logi.com/hc/en-us/articles/360026132953--Product-Gallery-C922-Pro-Stream-Webcam (accessed on 18 November 2021).
- Logitech-C310-HD-Webcam. Logitech C310 HD Webcam, 720p Video with Lighting Correction. 2019. Available online: https://support.logi.com/hc/en-us/articles/360026362933-GalleryImage-HD-Webcam-C310 (accessed on 18 November 2021).
- Pruitt, B. Choosing an Intel® RealSense™ Depth Camera. 2018. Available online: https://www.intelrealsense.com/compare (accessed on 18 November 2021).
- YDLIDAR-X4. YDLIDAR-X4. 2016. Available online: https://www.ydlidar.com/products/view/5.html (accessed on 18 November 2021).
- URDF. Urdf-ROS Wiki. 2019. Available online: http://wiki.ros.org/urdf (accessed on 18 November 2021).
- Kwon, J. Ridon Vehcile. 2021. Available online: https://github.com/jrkwon/ridon (accessed on 20 October 2021).
- ROS-Serial. Rosserial-ROS Wiki. 2018. Available online: http://wiki.ros.org/rosserial (accessed on 18 November 2021).
- Sharma, S.; Tewolde, G.; Kwon, J. Lateral and longitudinal motion control of autonomous vehicles using deep learning. In Proceedings of the 2019 IEEE International Conference on Electro Information Technology (EIT), Brookings, SD, USA, 20–22 May 2019; IEEE: Piscataway, NJ, USA, 2019; pp. 1–5. [Google Scholar]
- Premebida, C.; Ludwig, O.; Nunes, U. LIDAR and vision-based pedestrian detection system. J. Field Robot. 2009, 26, 696–711. [Google Scholar] [CrossRef]
- Ye, J. Cosine similarity measures for intuitionistic fuzzy sets and their applications. Math. Comput. Model. 2011, 53, 91–97. [Google Scholar] [CrossRef]
- Dosselmann, R.; Yang, X.D. A Formal Assessment of the Structural Similarity Index. 2008. Available online: https://www.semanticscholar.org/paper/A-Formal-Assessment-of-the-Structural-Similarity-Dosselmann-Yang/fca773a6ed8aefeae5d9127161146734009fd6c3 (accessed on 18 November 2021).


| Layer (Type) | Output Shape | Parameters |
|---|---|---|
| Lambda_1 | (None, 70, 160, 3) | 0 |
| Conv2D_1 | (None, 70, 160, 24 ) | 1824 |
| Maxpooling2D_1 | (None, 69, 159, 24) | 0 |
| Conv2D_2 | (None, 69, 159, 36) | 21,636 |
| Maxpooling2D_2 | (None, 34, 79, 36) | 0 |
| Conv2D_3 | (None, 34, 79, 48) | 43,248 |
| Maxpooling2D_3 | (None, 17, 39, 48) | 0 |
| Conv2D_4 | (None, 17, 39, 64) | 76,864 |
| Maxpooling2D_4 | (None, 8, 19, 64) | 0 |
| Conv2D_5 | (None, 8, 19, 64) | 102,464 |
| Maxpooling2D_5 | (None, 4, 9, 64) | 0 |
| Flatten_1 | (None, 2304) | 0 |
| Dropout_1 | (None, 2304) | 0 |
| Dense_1 | (None, 256) | 590,080 |
| Dropout_2 | (None, 256) | 0 |
| Dense_2 | (None, 128) | 32,896 |
| Dropout_3 | (None, 128) | 0 |
| Dense_3 | (None, 64) | 8256 |
| Layer (Type) | Output Shape | Parameters |
|---|---|---|
| Lambda_1 | (None, 70, 160, 3) | 0 |
| Conv2D_1 | (None, 68, 158, 24) | 672 |
| Maxpooling2D_1 | (None, 34, 79, 24) | 0 |
| Conv2D_2 | (None, 32, 77, 36) | 7812 |
| Conv2D_3 | (None, 30, 75, 36) | 11,700 |
| Maxpooling2D_2 | (None, 15, 37, 36) | 0 |
| Conv2D_4 | (None, 13, 35, 48) | 15,600 |
| Conv2D_5 | (None, 11, 33, 48) | 20,784 |
| Maxpooling2D_3 | (None,5, 16, 48) | 0 |
| Conv2D_6 | (None, 3, 14, 64) | 27,712 |
| Conv2D_7 | (None, 1, 12, 64) | 36,928 |
| Flatten_1 | (None, 768) | 0 |
| Dense_1 | (None, 512) | 393,728 |
| Dropout_1 | (None, 512) | 0 |
| Dense_2 | (None, 256) | 131,328 |
| Dense_3 | (None, 50) | 12,850 |
| Model Type | Path Type | Cosine Similarity Values | Performance |
|---|---|---|---|
| Camera LiDAR | Left Turn | 0.9723 0.9867 | Good Better |
| Camera LiDAR | Right Turn | 0.9814 0.9581 | Better Good |
| Camera LiDAR | Straight | 0.9865 0.9983 | Good Better |
| Model Type | Path Type | SSI Values | Performance |
|---|---|---|---|
| Camera LiDAR | Left Turn | 0.8996 0.9138 | Good Better |
| Camera LiDAR | Right Turn | 0.9076 0.9149 | Good Better |
| Camera LiDAR | Straight | 0.8743 0.9107 | Good Better |
| Full-Scale Vehicle | RC-Based Car | Simulation Environment | Ridon | |
|---|---|---|---|---|
| Cost | High | Low | Low | Low |
| Saftey Concerns | High | Low | Low | Medium Low |
| HIL | Yes | Yes | No | Yes |
| Onboard Computer | Yes | No | N/A | Yes |
| Deep-Learning Capabilities | Yes | No * | Yes | Yes |
Publisher’s Note: MDPI stays neutral with regard to jurisdictional claims in published maps and institutional affiliations. |
© 2021 by the authors. Licensee MDPI, Basel, Switzerland. This article is an open access article distributed under the terms and conditions of the Creative Commons Attribution (CC BY) license (https://creativecommons.org/licenses/by/4.0/).
Share and Cite
Khalil, A.; Abdelhamed, A.; Tewolde, G.; Kwon, J. Ridon Vehicle: Drive-by-Wire System for Scaled Vehicle Platform and Its Application on Behavior Cloning. Energies 2021, 14, 8039. https://doi.org/10.3390/en14238039
Khalil A, Abdelhamed A, Tewolde G, Kwon J. Ridon Vehicle: Drive-by-Wire System for Scaled Vehicle Platform and Its Application on Behavior Cloning. Energies. 2021; 14(23):8039. https://doi.org/10.3390/en14238039
Chicago/Turabian StyleKhalil, Aws, Ahmed Abdelhamed, Girma Tewolde, and Jaerock Kwon. 2021. "Ridon Vehicle: Drive-by-Wire System for Scaled Vehicle Platform and Its Application on Behavior Cloning" Energies 14, no. 23: 8039. https://doi.org/10.3390/en14238039